State of Illinois Pat Quinn, Governor - Environmental Protection
17
State of Illinois Pat Quinn, Governor Illinois Environmental Protection Agency Douglas P. Scott, Director 21 st Annual Toxic Chemical Report November 2009 Illinois Environmental Protection Agency
Transcript of State of Illinois Pat Quinn, Governor - Environmental Protection

State of Illinois Pat Quinn, Governor Illinois Environmental Protection Agency Douglas P. Scott, Director
21st Annual Toxic Chemical Report
November 2009
Illinois Environmental Protection Agency
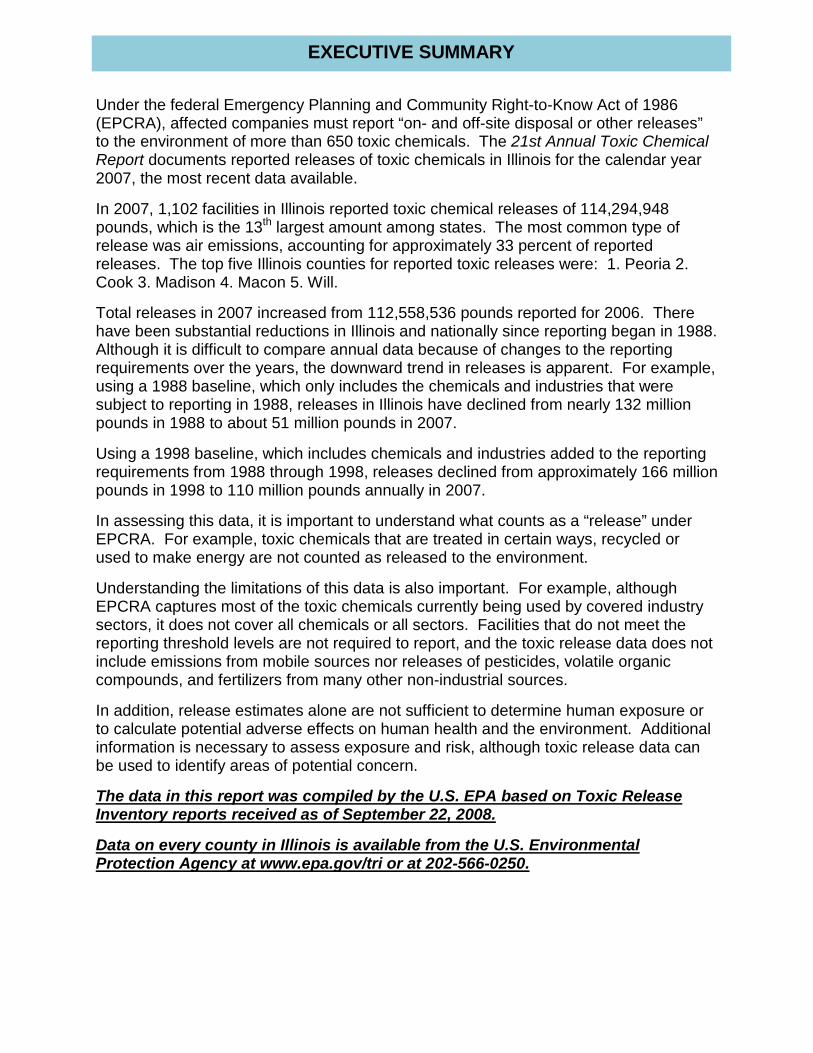
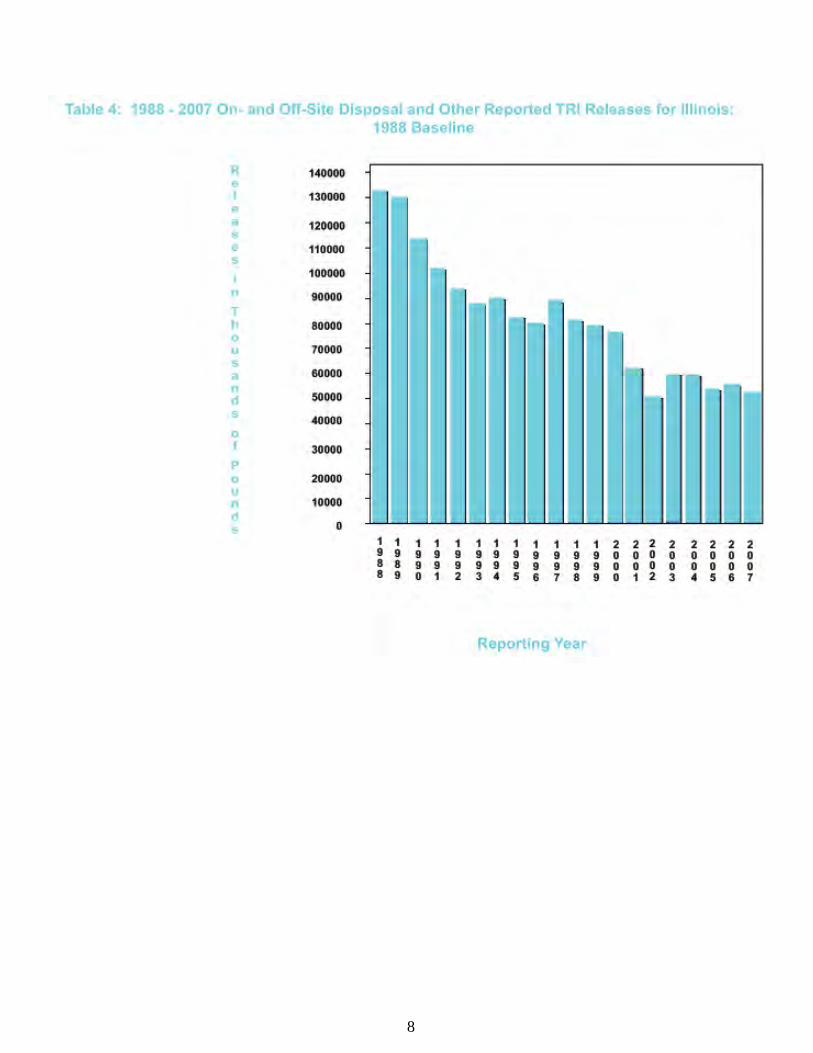
Under the federal Emergency Planning and Community Right-to-Know Act of 1986 (EPCRA), affected companies must report “on- and off-site disposal or other releases” to the environment of more than 650 toxic chemicals. The 21st Annual Toxic Chemical Report documents reported releases of toxic chemicals in Illinois for the calendar year 2007, the most recent data available. In 2007, 1,102 facilities in Illinois reported toxic chemical releases of 114,294,948 pounds, which is the 13th largest amount among states. The most common type of release was air emissions, accounting for approximately 33 percent of reported releases. The top five Illinois counties for reported toxic releases were: 1. Peoria 2. Cook 3. Madison 4. Macon 5. Will. Total releases in 2007 increased from 112,558,536 pounds reported for 2006. There have been substantial reductions in Illinois and nationally since reporting began in 1988. Although it is difficult to compare annual data because of changes to the reporting requirements over the years, the downward trend in releases is apparent. For example, using a 1988 baseline, which only includes the chemicals and industries that were subject to reporting in 1988, releases in Illinois have declined from nearly 132 million pounds in 1988 to about 51 million pounds in 2007. Using a 1998 baseline, which includes chemicals and industries added to the reporting requirements from 1988 through 1998, releases declined from approximately 166 million pounds in 1998 to 110 million pounds annually in 2007. In assessing this data, it is important to understand what counts as a “release” under EPCRA. For example, toxic chemicals that are treated in certain ways, recycled or used to make energy are not counted as released to the environment. Understanding the limitations of this data is also important. For example, although EPCRA captures most of the toxic chemicals currently being used by covered industry sectors, it does not cover all chemicals or all sectors. Facilities that do not meet the reporting threshold levels are not required to report, and the toxic release data does not include emissions from mobile sources nor releases of pesticides, volatile organic compounds, and fertilizers from many other non-industrial sources. In addition, release estimates alone are not sufficient to determine human exposure or to calculate potential adverse effects on human health and the environment. Additional information is necessary to assess exposure and risk, although toxic release data can be used to identify areas of potential concern.
The data in this report was compiled by the U.S. EPA based on Toxic Release Inventory reports received as of September 22, 2008.
Data on every county in Illinois is available from the U.S. Environmental Protection Agency at www.epa.gov/tri or at 202-566-0250.
EXECUTIVE SUMMARY

3
Introduction About the Toxics Release Inventory (TRI)…………………………………………….……..3 What is a Toxic Chemical Release? ………………………………………………….……...3 Limitations on Use of Information………………………………………………………….….4 Illinois Toxic Chemical Release Trends How to Compare Data Across Years…………………………………………………….……4 Trends: 1988-2007………………………………………………………………………….5 - 7 2006 Toxic Chemical Releases Top 20 Counties…………………………………………………………………………………8 Top 20 Facilities...……………………………………………………………………………….9 Top 20 Industries.…………..…………………………………….……………………….…..10 Top 20 Chemicals.………………...…………………………………………………………..11 Appendices Appendix A: Form R…………………...………………………………………..…………12-16
TABLE OF CONTENTS
TABLE OF CONTENTS
4
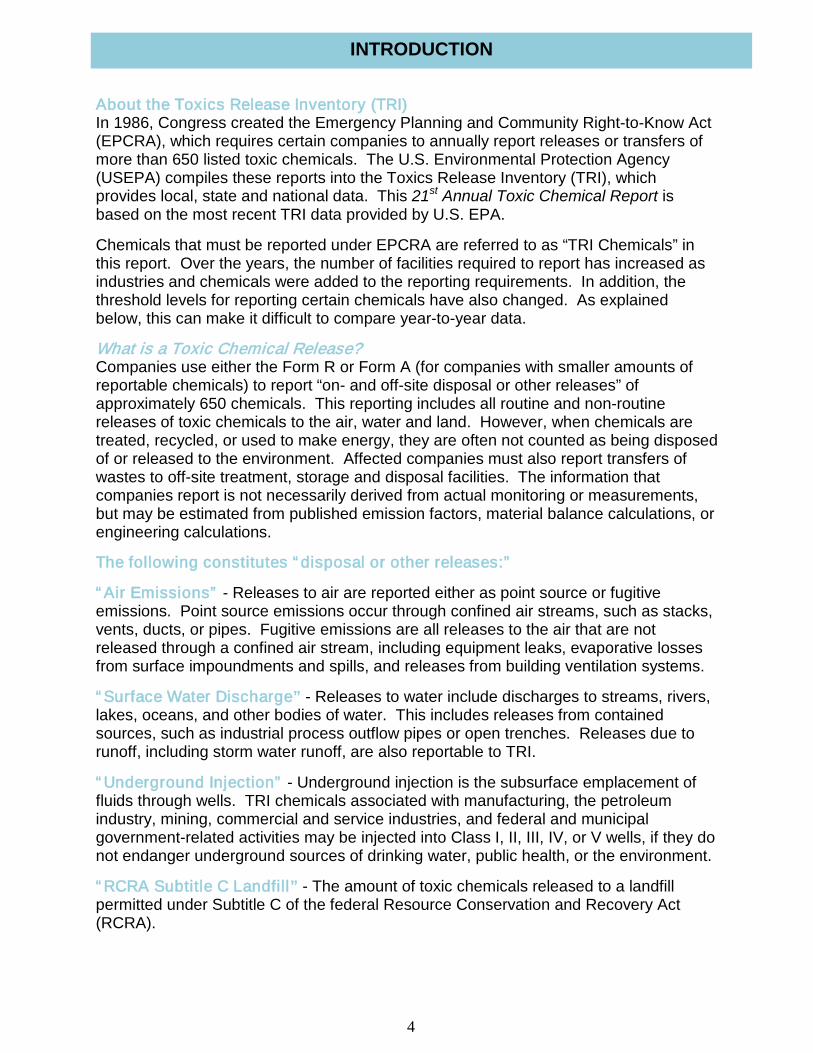
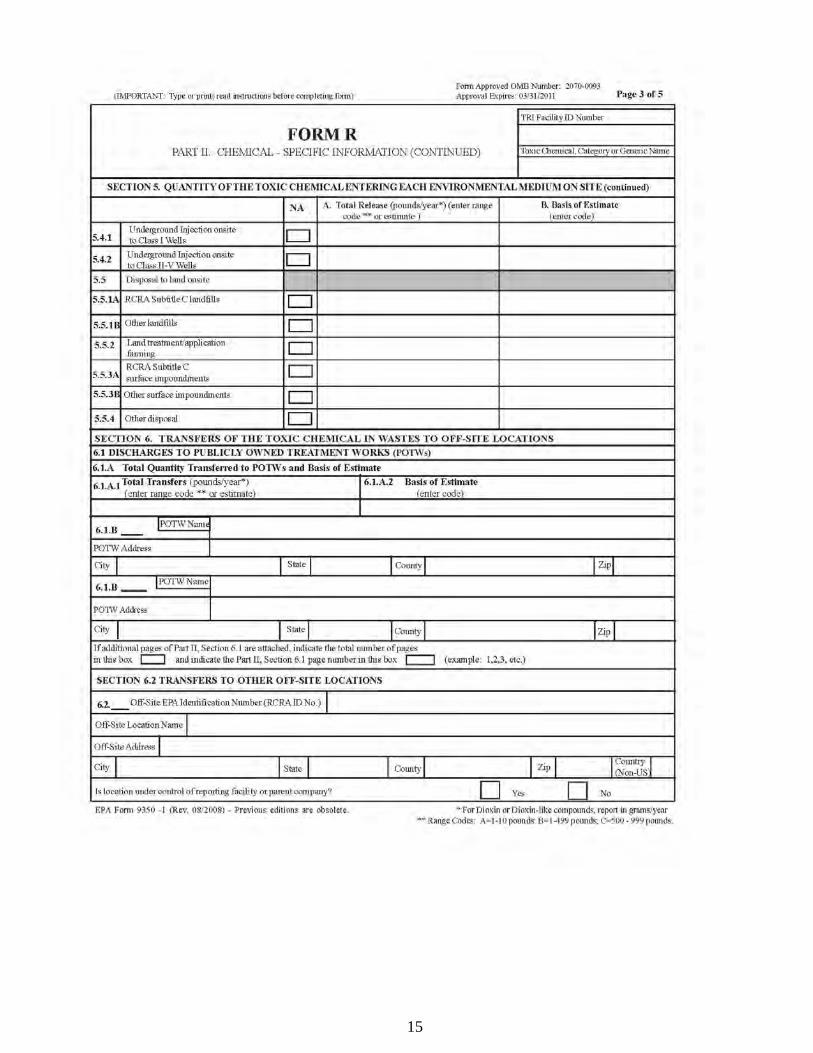
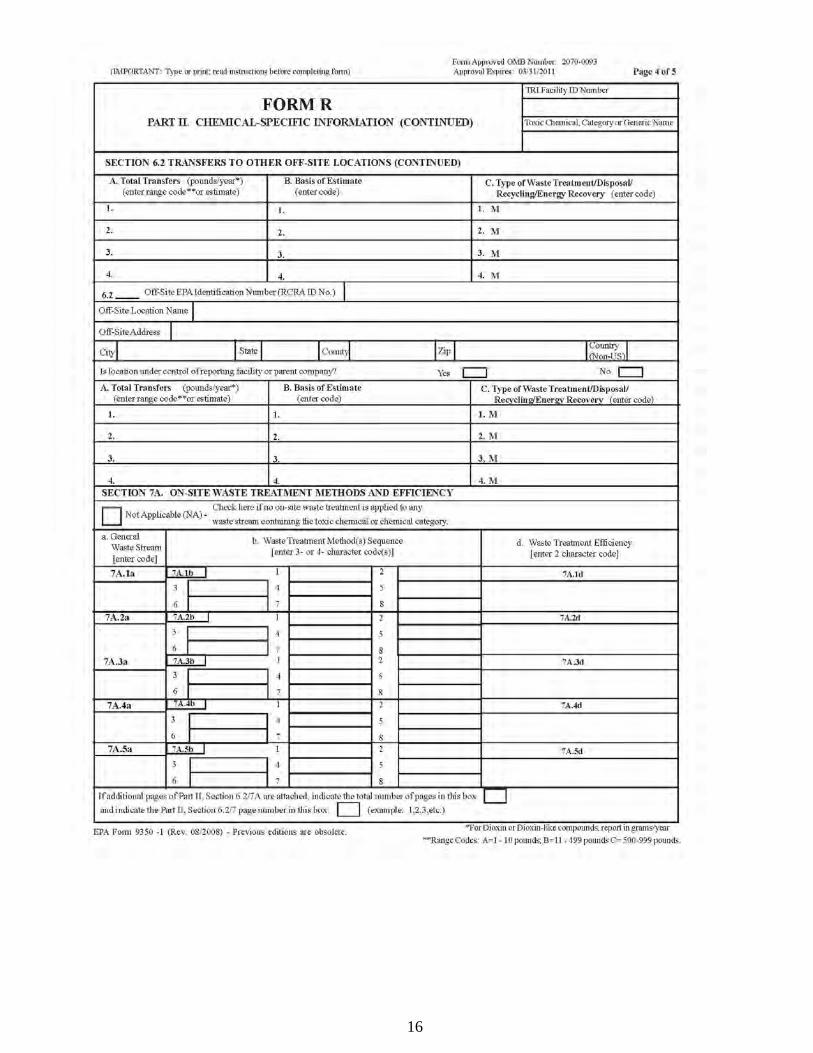
About the Toxics Release Inventory (TRI) In 1986, Congress created the Emergency Planning and Community Right-to-Know Act (EPCRA), which requires certain companies to annually report releases or transfers of more than 650 listed toxic chemicals. The U.S. Environmental Protection Agency (USEPA) compiles these reports into the Toxics Release Inventory (TRI), which provides local, state and national data. This 21st Annual Toxic Chemical Report is based on the most recent TRI data provided by U.S. EPA. Chemicals that must be reported under EPCRA are referred to as “TRI Chemicals” in this report. Over the years, the number of facilities required to report has increased as industries and chemicals were added to the reporting requirements. In addition, the threshold levels for reporting certain chemicals have also changed. As explained below, this can make it difficult to compare year-to-year data. What is a Toxic Chemical Release? Companies use either the Form R or Form A (for companies with smaller amounts of reportable chemicals) to report “on- and off-site disposal or other releases” of approximately 650 chemicals. This reporting includes all routine and non-routine releases of toxic chemicals to the air, water and land. However, when chemicals are treated, recycled, or used to make energy, they are often not counted as being disposed of or released to the environment. Affected companies must also report transfers of wastes to off-site treatment, storage and disposal facilities. The information that companies report is not necessarily derived from actual monitoring or measurements, but may be estimated from published emission factors, material balance calculations, or engineering calculations. The following constitutes “ disposal or other releases:” “ Air Emissions” - Releases to air are reported either as point source or fugitive emissions. Point source emissions occur through confined air streams, such as stacks, vents, ducts, or pipes. Fugitive emissions are all releases to the air that are not released through a confined air stream, including equipment leaks, evaporative losses from surface impoundments and spills, and releases from building ventilation systems. “ Surface Water Discharge” - Releases to water include discharges to streams, rivers, lakes, oceans, and other bodies of water. This includes releases from contained sources, such as industrial process outflow pipes or open trenches. Releases due to runoff, including storm water runoff, are also reportable to TRI. “ Underground Injection” - Underground injection is the subsurface emplacement of fluids through wells. TRI chemicals associated with manufacturing, the petroleum industry, mining, commercial and service industries, and federal and municipal government-related activities may be injected into Class I, II, III, IV, or V wells, if they do not endanger underground sources of drinking water, public health, or the environment. “ RCRA Subtitle C Landfill” - The amount of toxic chemicals released to a landfill permitted under Subtitle C of the federal Resource Conservation and Recovery Act (RCRA).
INTRODUCTION

5
“ Other Land Releases” - Releases to land occur within the boundaries of the reporting facility. Releases to land include disposal in landfills (in which wastes are buried), land treatment/application farming (in which a waste containing a listed chemical is applied to or incorporated into soil), surface impoundments (which are uncovered holding areas used to volatilize and/or settle waste materials), and other land disposal methods (such as waste piles) or releases to land (such as spills or leaks). Beginning with the 1996 reporting year, facilities separately report amounts released to RCRA subtitle C landfills from amounts released to other on-site landfills. Limitations on Use of Information TRI reports reflect releases, transfers and waste management activities of chemicals, not exposures of the public to those chemicals. Release estimates alone are not sufficient to determine exposure or to calculate potential adverse effects on human health and the environment. Although additional information is necessary to assess exposure and risk, TRI data can be used to identify areas of potential concern. TRI, in conjunction with other information, can be used as a starting point in evaluating exposures that may result from releases and other waste management activities of toxic chemicals. The determination of potential risk depends upon many factors, including the toxicity of the chemical, the fate of the chemical after it is released, the locality of the release, and the human or other populations that are exposed to the chemical after its release. Even with the expanded industry coverage, TRI does not address all sources of releases and other waste management activities. Although TRI is successful in capturing information on a significant portion of toxic chemicals currently being used by covered industry sectors, it does not cover all chemicals or all sectors. In addition, facilities that do not meet the TRI threshold levels are not required to report. TRI data does not include toxic emissions from mobile sources, nor releases of pesticides, volatile organic compounds, and fertilizers from many other non-industrial sources. Furthermore, facilities only report estimated data, and EPCRA does not mandate that they monitor their releases. Variations between facilities can result from the use of different estimation methods. How to Compare Data Across Years As the tables below demonstrate, there has been a general downward trend in toxic chemical release since 1988. However, because of changes to the TRI reporting requirements over the years, it is difficult to compare annual data. Industries and chemicals have been added to the reporting requirements since 1988, and the threshold levels for reporting certain chemicals have also changed. In order to compare “apples-to-apples,” the trends assessments shown below only include chemicals and industries subject to reporting since the baseline year. This means that the total releases shown for any given year will vary between these trends assessments.
ILLINOIS TOXIC RELEASE TRENDS
6
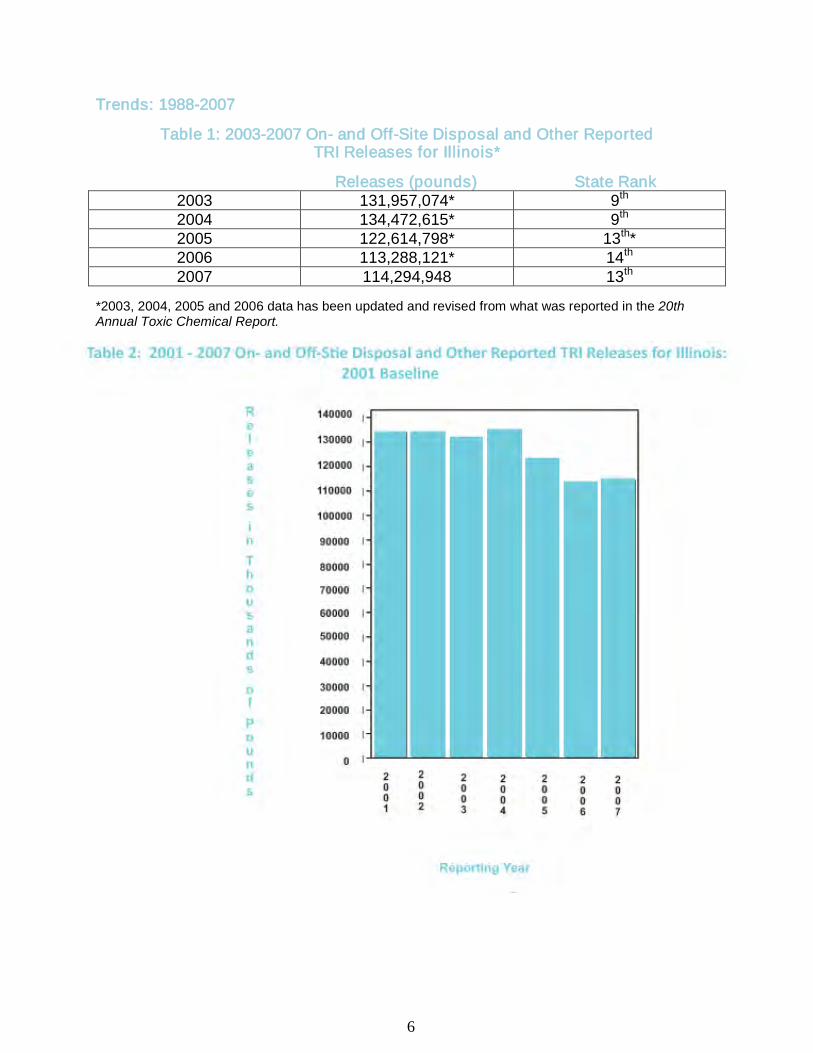
Trends: 1988-2007
Table 1: 2003-2007 On- and Off-Site Disposal and Other Reported TRI Releases for Illinois*
Releases (pounds) State Rank
2003 131,957,074* 9th 2004 134,472,615* 9th 2005 122,614,798* 13th* 2006 113,288,121* 14th 2007 114,294,948 13th
*2003, 2004, 2005 and 2006 data has been updated and revised from what was reported in the 20th Annual Toxic Chemical Report.

7
8

9
For Calendar year 2007, 114 million pounds of TRI chemicals were reported as released to the environment in Illinois. 1,102 facilities submitted TRI reports. The most common type of release was air emissions, accounting for approximately 33 percent of reported releases. The following Tables identify the Top 20 counties, facilities, industries and chemicals for 2007 TRI chemical releases in Illinois.
Table 5: Top 20 Counties TRI On-site and Off-site Disposal or Other Reported Releases of TRI Chemicals
2007 - Illinois
County Total On-site
Disposal or Other Releases
Total Off-site Disposal or Other
Releases
Total On- and Off-site Disposal or Other Releases
1 PEORIA 27,226,262 8,145,881 35,372,142 2 COOK 3,978,492 8,217,730 12,196,222 3 MADISON 8,197,491 3,614,867 11,812,359 4 MACON 3,495,000 2,769,870 6,264,870 5 WILL 4,431,846 281,017 4,712,863 6 WHITESIDE 22,985 4,462,676 4,485,661 7 VERMILION 4,189,937 149,089 4,339,026 8 ROCK ISLAND 3,549,017 104,675 3,653,692 9 CASS 3,462,112 0 3,462,112 10 CHRISTAIN 1,247,201 2,091,348 3,338,549 11 TAZEWELL 1,792,988 1,160,836 2,953,824 12 RANDOLPH 2,651,090 10 2,651,100 13 LA SALLE 543,921 1,797,806 2,341,726 14 MONTGOMERY 2,228,015 581 2,228,596 15 JO DAVIES 2,169,245 966 2,170,211 16 JASPER 2,056,932 0 2,056,932 17 ST CLAIR 995,408 799,547 1,794,955 18 PIKE 1,747,312 0 1,747,312 19 WINNEBAGO 948,462 783,039 1,731,502 20 GRUNDY 1,387,309 5,713 1,393,023
All Reported IL Counties 114,294,948
All Releases Reported in Pounds.
2007 TOXIC CHEMICAL RELEASES

10
Table 6: Top 20 Facilities Total On-site and Off-site Disposal or Other Reported Releases of TRI Chemicals
2007 - Illinois
Facility City County or Parish or County
Equivalent Zip
Total On Site Disposal or
Other Releases
Total Off Site
Disposal or Other
Releases
Total On & Off Site
Disposal or Other
Releases
1 PEORIA DISPOSAL CO #1 PEORIA PEORIA 61615 24,819,371 158,243 24,977,614
2 KEYSTONE STEEL & WIRE CO PEORIA PEORIA 61641 769,494 7,796,007 8,565,501
3 U.S. STEEL
GRANITE CITY WORKS
GRANITE CITY MADISON 62040 6,621,257 7,088 6,628,345
4 ADM DECATUR MACON 62526 3,088,645 1,437,671 4,526,316
5 STERLING STEEL CO LLC STERLING WHITESIDE 61081 5,562 4,453,667 4,459,319
6 CARGILL MEAT SOLUTIONS CORP BEARDSTOWN CASS 62618 3,462,112 0 3,462,112
7 VISCOFAN USA INC DANVILLE VERMILION 61832 3,232,000 3,232,000
8 TYSON FRESH
MEATS INC JOSLIN IL
HILLSDALE ROCK ISLAND 61257 3,105,010 66,682 3,171,692
9 DOMINION KINCAID
GENERATION LLC KINCAID CHRISTIAN 62540 884,124 2,091,348 2,975,472
10 ENVIRITE OF ILLINOIS INC HARVEY COOK 60426 183 2,734,765 2,734,948
11 DYNEGY MIDWEST
GENERATION ENERGY
COMPLEX BALDWIN RANDOLPH 62217 2,651,080 0 2,651,080
12 ARCELORMITTAL RIVERDALE INC RIVERDALE COOK 60827 18,227 2,245,138 2,263,365
13 AMEREN ENERGY
GENERATING COFFEEN POWER
STATION COFFEEN MONTGOMERY 62017 2,228,015 581 2,228,596
14 ALTON STEEL INC ALTON MADISON 62002 18,145 2,203,930 2,222,075
15 RENTECH
ENERGY MIDWEST CORP
EAST DUBUQUE JO DAVIESS 61025 2,167,758 0 2,167,758
16 AMEREN ENERGY
GENERATING NEWTON POWER
STATION NEWTON JASPER 62448 2,056,932 0 2,056,932
17 CARUS CHEMICAL CO LA SALLE LA SALLE 61301 8,806 1,782,269 1,791,075
18 PRAIRIE POWER
INC PEARL STATION
PEARL PIKE 62361 1,774,373 0 1,744,373
19
EDISON INTERNATIONAL
POWERTON GENERATING
STATION
PEKIN TAZEWELL 61554 403,311 1,147,676 1,550,987
20 EXXONMOBIL OIL
CORP JOLIET REFINERY
CHANNAHON WILL 60410 1,553,530 307 1,533,837
All Releases Reported in Pounds.
11
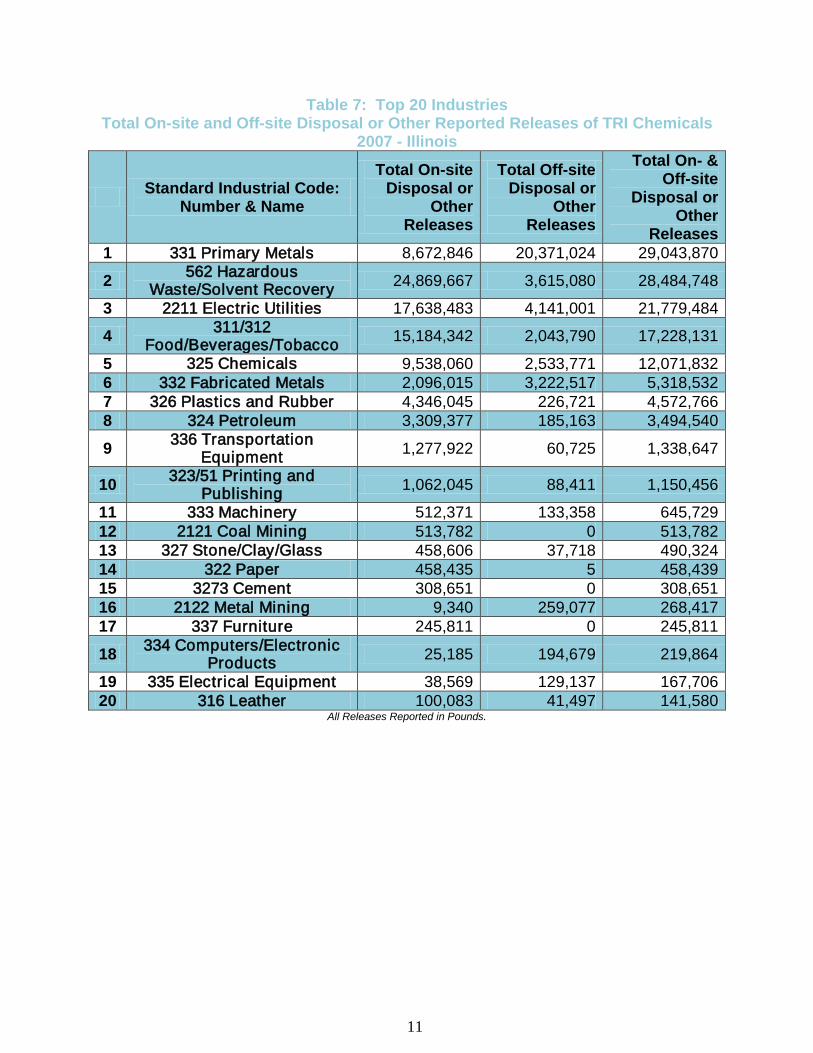
Table 7: Top 20 Industries Total On-site and Off-site Disposal or Other Reported Releases of TRI Chemicals
2007 - Illinois
Standard Industrial Code: Number & Name
Total On-site Disposal or
Other Releases
Total Off-site Disposal or
Other Releases
Total On- & Off-site
Disposal or Other
Releases 1 331 Primary Metals 8,672,846 20,371,024 29,043,870
2 562 Hazardous Waste/Solvent Recovery 24,869,667 3,615,080 28,484,748
3 2211 Electric Utilities 17,638,483 4,141,001 21,779,484
4 311/312 Food/Beverages/Tobacco 15,184,342 2,043,790 17,228,131
5 325 Chemicals 9,538,060 2,533,771 12,071,832 6 332 Fabricated Metals 2,096,015 3,222,517 5,318,532 7 326 Plastics and Rubber 4,346,045 226,721 4,572,766 8 324 Petroleum 3,309,377 185,163 3,494,540
9 336 Transportation Equipment 1,277,922 60,725 1,338,647
10 323/51 Printing and Publishing 1,062,045 88,411 1,150,456
11 333 Machinery 512,371 133,358 645,729 12 2121 Coal Mining 513,782 0 513,782 13 327 Stone/Clay/Glass 458,606 37,718 490,324 14 322 Paper 458,435 5 458,439 15 3273 Cement 308,651 0 308,651 16 2122 Metal Mining 9,340 259,077 268,417 17 337 Furniture 245,811 0 245,811
18 334 Computers/Electronic Products 25,185 194,679 219,864
19 335 Electrical Equipment 38,569 129,137 167,706 20 316 Leather 100,083 41,497 141,580
All Releases Reported in Pounds.
12
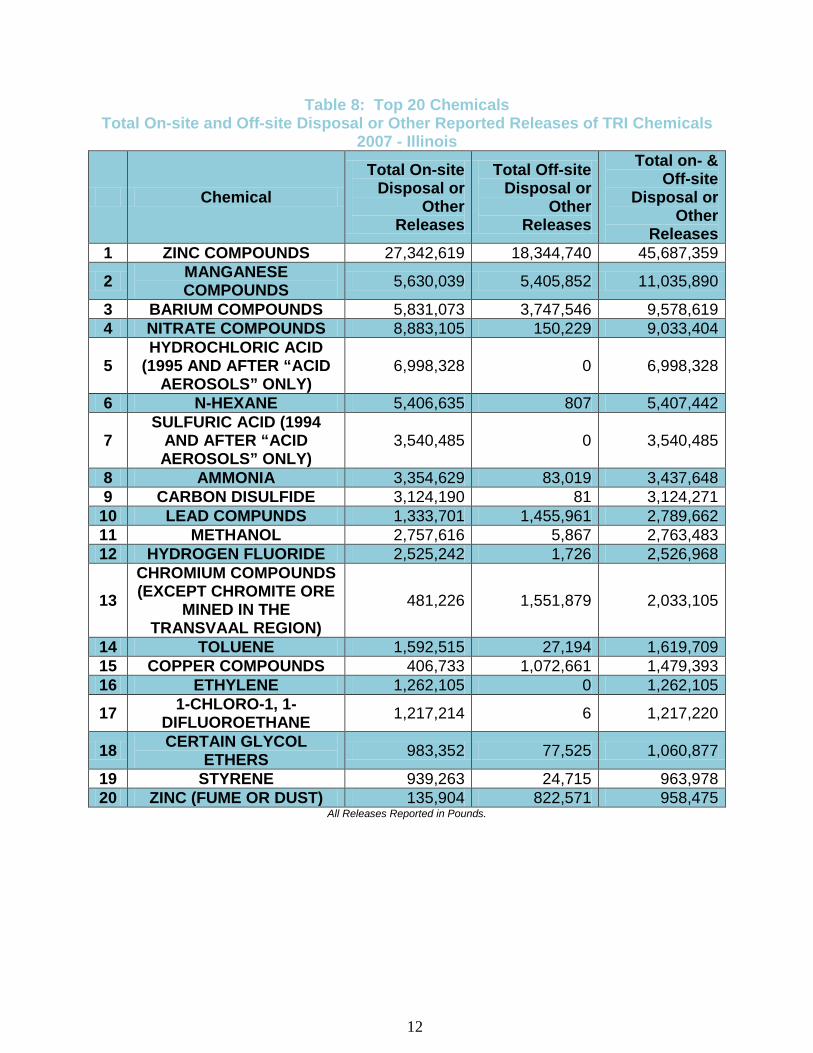
Table 8: Top 20 Chemicals Total On-site and Off-site Disposal or Other Reported Releases of TRI Chemicals
2007 - Illinois
Chemical Total On-site
Disposal or Other
Releases
Total Off-site Disposal or
Other Releases
Total on- & Off-site
Disposal or Other
Releases 1 ZINC COMPOUNDS 27,342,619 18,344,740 45,687,359
2 MANGANESE COMPOUNDS 5,630,039 5,405,852 11,035,890
3 BARIUM COMPOUNDS 5,831,073 3,747,546 9,578,619 4 NITRATE COMPOUNDS 8,883,105 150,229 9,033,404
5 HYDROCHLORIC ACID
(1995 AND AFTER “ACID AEROSOLS” ONLY)
6,998,328 0 6,998,328
6 N-HEXANE 5,406,635 807 5,407,442
7 SULFURIC ACID (1994
AND AFTER “ACID AEROSOLS” ONLY)
3,540,485 0 3,540,485
8 AMMONIA 3,354,629 83,019 3,437,648 9 CARBON DISULFIDE 3,124,190 81 3,124,271
10 LEAD COMPUNDS 1,333,701 1,455,961 2,789,662 11 METHANOL 2,757,616 5,867 2,763,483 12 HYDROGEN FLUORIDE 2,525,242 1,726 2,526,968
13 CHROMIUM COMPOUNDS (EXCEPT CHROMITE ORE
MINED IN THE TRANSVAAL REGION)
481,226 1,551,879 2,033,105
14 TOLUENE 1,592,515 27,194 1,619,709 15 COPPER COMPOUNDS 406,733 1,072,661 1,479,393 16 ETHYLENE 1,262,105 0 1,262,105
17 1-CHLORO-1, 1-DIFLUOROETHANE 1,217,214 6 1,217,220
18 CERTAIN GLYCOL ETHERS 983,352 77,525 1,060,877
19 STYRENE 939,263 24,715 963,978 20 ZINC (FUME OR DUST) 135,904 822,571 958,475
All Releases Reported in Pounds.

13
APPENDIX A – FORM R

14
15
16

17