
State of Health in the EU Latvia · STATE OF HEALTH IN THE EU: COUNTRY HEALTH PROFILE 2017 –...
20
State of Health in the EU Latvia Country Health Profile 2017 on Health Systems and Policies European a partnership hosted by WHO
Transcript of State of Health in the EU Latvia · STATE OF HEALTH IN THE EU: COUNTRY HEALTH PROFILE 2017 –...
State of Health in the EU
LatviaCountry Health Profile 2017
on Health Systems and Policies
European
a partnership hosted by WHO

Contents1 • HIGHLIGHTS 1
2 • HEALTH IN LATVIA 2
3 • RISK FACTORS 4
4 • THE HEALTH SYSTEM 6
5 • PERFORMANCE OF THE HEALTH SYSTEM 8
5.1 Effectiveness 8
5.2 Accessibility 10
5.3 Resilience 13
6 • KEY FINDINGS 16
Disclaimer: The opinions expressed and arguments employed herein are solely those of the authors and do not necessarily reflect the official views of the OECD or of its member countries, or of the European Observatory on Health Systems and Policies or any of its Partners. The views expressed herein can in no way be taken to reflect the official opinion of the European Union. This document, as well as any data and map included herein, are without prejudice to the status of or sovereignty over
any territory, to the delimitation of international frontiers and boundaries and to the name of any territory, city or area.Additional disclaimers for WHO are visible at http://www.who.int/bulletin/disclaimer/en/
Demographic and socioeconomic context in Latvia, 2015
Demographic factors
Socioeconomic factors
1. Number of children born per woman aged 15–49. 2. Purchasing power parity (PPP) is defined as the rate of currency conversion that equalises the purchasing power of different currencies by eliminating the differences in price levels between countries. 3. Percentage of persons living with less than 50% of median equivalised disposable income.
Source: Eurostat Database.
Latvia EU
Population size (thousands) 1 978 509 394
Share of population over age 65 (%) 19.4 18.9
Fertility rate¹ 1.7 1.6
GDP per capita (EUR PPP2) 18 600 28 900
Relative poverty rate3 (%) 14.7 10.8
Unemployment rate (%) 9.9 9.4
The Country Health Profile seriesThe State of Health in the EU profiles provide a concise and policy-relevant overview of health and health systems in the EU Member States, emphasising the particular characteristics and challenges in each country. They are designed to support the efforts of Member States in their evidence-based policy making.
The Country Health Profiles are the joint work of the OECD and the European Observatory on Health Systems and Policies, in cooperation with the European Commission. The team is grateful for the valuable comments and suggestions provided by Member States and the Health Systems and Policy Monitor network.
Data and information sourcesThe data and information in these Country Health Profiles are based mainly on national official statistics provided to Eurostat and the OECD, which were validated in June 2017 to ensure the highest standards of data comparability. The sources and methods underlying these data are available in the Eurostat Database and the OECD health database. Some additional data also come from the Institute for Health Metrics and Evaluation (IHME), the European Centre for Disease Prevention and Control (ECDC), the Health Behaviour in School-Aged Children (HBSC) surveys and the World Health Organization (WHO), as well as other national sources.
The calculated EU averages are weighted averages of the 28 Member States unless otherwise noted.
To download the Excel spreadsheet matching all the tables and graphs in this profile, just type the following StatLinks into your Internet browser: http://dx.doi.org/10.1787/888933593646
© OECD and World Health Organization (acting as the host organization for, and secretariat of, the European Observatory on Health Systems and Policies)

Latv
ia
Highlights . 1
STATE OF HEALTH IN THE EU: COUNTRY HEALTH PROFILE 2017 – LATVIA
1 Highlights
The life expectancy of Latvians improved over the past fifteen years, but still lags several years behind other EU countries. Large inequalities in life expectancy by gender and socioeconomic status exist, driven mainly by greater exposure to risk factors among men and people with low education and income, but also unequal access to health care. The Latvian health system is characterised by serious underfunding, which limits access to high quality and timely care for all.
Life expectancy at birth was 74.8 years in 2015, up from 70.2 years in 2000, but still nearly six years below EU average. The gender gap in life expectancy (almost 10 years) is much greater than the EU average (5.4 years). There is also a huge gap by socioeconomic status: the life expectancy at age 25 of Latvians with low level of education is ten years lower than among those with high education. This is largely due to higher death rates from heart attack, stroke and lung cancer.
Health status
Health system
The Latvian health system is underfunded. In 2015, Latvia spent EUR 1 071 per capita on health, the second lowest level in the EU, accounting for only 5.8% of GDP compared with an EU average of 9.9%. Only 57% of health spending is publicly funded (whereas the EU average is 79%), with most of the remaining spending paid directly out of pocket by households, raising severe accessibility issues.
EffectivenessAmenable mortality in Latvia is the highest in the EU, pointing towards substantial scope for improving access to timely and effective care for life-threatening conditions.
AccessAccess to health care in Latvia is limited for a sizeable proportion of the population, with high numbers of people with low income reporting unmet needs for medical care for financial reasons, waiting times or geographic distance to access services.
LV
EU
0% 13% 26%2005
400
500
300
200
100
0
2014
In 2014, one in four Latvian adults were daily smokers, down from one in three in 2000, but still above the EU average. About one in five Latvian adults report heavy alcohol consumption on a regular basis, which is close to the EU average, but with substantial difference between men and women (33% versus 8%). Obesity rates are the second highest in the EU and on the rise: more than one in five adults in Latvia was obese in 2014 compared to one in six in 2008.
Risk factors
Smoking 25%
19%Binge drinking
21%Obesity
Health system performance
126
332
451
175
ResilienceAddressing the persistent underfunding of the Latvian health system is a prerequisite for improving access to good quality care for all the population. At the same time, the Latvian health system began to streamline the hospital sector, but the challenges are to strengthen prevention and primary care to improve population health and reduce health inequalities.
€4 000
2005 2007 2009 2011 2013 2015€0
€1 000
€2 000
€3 000
2000
78
80
82
76
74
72
70
2015
70.2
77.3
74.8
80.6
74.8 YEARS
% of adults in 2014 LV EU
LV EUPer capita spending (EUR PPP)
Life expectancy at birth, years LV EU
High income All Low income
Amenable mortality per 100 000 population
% reporting unmet medical needs, 2015
LV EU

2 . Health in LatviaLa
tvia
STATE OF HEALTH IN THE EU: COUNTRY HEALTH PROFILE 2017 – LATVIA
2 Health in Latvia
Life expectancy in Latvia increased rapidly but remains the third shortest in the EULife expectancy at birth in Latvia increased by nearly five years between 2000 and 2015. Nevertheless, it remains the third lowest in the EU after Bulgaria and Lithuania (Figure 1). In 2015, life expectancy at birth of the Latvian population was 74.8 years, nearly six years lower than in the EU as a whole (80.6 years).
The gender gap in life expectancy in Latvia is among the largest in the EU: life expectancy at birth for men (69.7 years) is on average almost ten years shorter than for women (79.5 years). Furthermore, there is a considerable gap in life expectancy between socioeconomic groups. Life expectancy at age 25 among men and women who have not completed their secondary education is on average ten years less than those who have completed tertiary (university) education1. This is mainly due to a higher prevalence of risk factors, such as smoking, alcohol consumption and obesity,
resulting in higher death rates from cardiovascular diseases and different types of cancer (Murtin et al., 2017).
The gains in life expectancy in Latvia since 2000 have been driven to a large extent by reductions in mortality rates after the age of 65. The life expectancy of Latvian women at age 65 reached 18.9 years in 2015 (up from 16.8 in 2000), whereas the life expectancy at 65 for men reached 14.2 years (up from 12.3 in 2000). However, not all of these years gained are lived in good health. At age 65, Latvian men and women can expect to live four years of their remaining years free of disability, which corresponds to less than 30% of their remaining years. If the health and functional status of the Latvian population does not improve as they grow older, population ageing will inevitably put additional pressures on health and long-term care systems.
Figure 1. Latvia has the third lowest life expectancy among all EU countries
Source: Eurostat Database.
83.0
82.7
82.4
82.4
82.2
81.9
81.8
81.6
81.6
81.5
81.3
81.3
81.1
81.1
81.0
80.9
80.8
80.7
80.6
78.7
78.0
77.5
77.5
76.7
75.7
75.0
74.8
74.7
74.6
60
65
70
75
80
85
902015 2000Years
Spai
n
Italy
Fran
ce
Luxe
mbo
urg
Swed
en
Mal
ta
Cypr
us
Neth
erla
nds
Finl
and
Irela
nd
Aust
ria
Portu
gal
Gree
ce
Belg
ium
Unite
d Ki
ngdo
m
Slov
enia
Denm
ark
Germ
any EU
Czec
h Re
publ
ic
Esto
nia
Croa
tia
Pola
nd
Slov
ak R
epub
lic
Hung
ary
Rom
ania
Latv
ia
Bulg
aria
Lith
uani
a
EU Average 80.6 years of age
Latvia
74.8years of age
1. Lower education levels refer to people with less than primary, primary or lower secondary education (ISCED levels 0-2) while higher education levels refer to people with tertiary education (ISCED levels 5-8).
The leading causes of death in Latvia are cardiovascular diseases followed by cancerCardiovascular diseases remain the leading cause of death for both women and men, and accounted for 16 100 deaths in 2014 (64% of all deaths among women and 49% among men). Cancer was the second leading cause of death in Latvia in 2014 (Figure 2). Nearly 6 000 people died from cancer, corresponding to 19% of deaths among women and 24% among men, while deaths due to external causes accounted for more deaths among men than women (11% among men and 3% among women).
Looking at trends in specific causes of death, heart diseases and stroke have remained the two most common causes in Latvia since 2000 accounting for half of all deaths in 2014 (Figure 3). Lung cancer continues to be the main cause of cancer death, reflecting the long-term consequences of high smoking rates (Section 3). While five of the ten main causes of death in 2014 were due to different types of cancer, deaths caused by diabetes increased drastically between 2000 and 2014.
Death rates from suicides and traffic accidents have come down since 2000 but still remain important public health challenges in Latvia (Section 5.1).

Health in Latvia . 3
Latv
ia
STATE OF HEALTH IN THE EU: COUNTRY HEALTH PROFILE 2017 – LATVIA
Musculoskeletal problems, mental health problems and diabetes are important contributors to disease burdenIn addition to the burden of disease caused by cardiovascular diseases and cancers, musculoskeletal problems (including low back and neck pain), poor mental health and diabetes are also some of the leading contributors to disability-adjusted life years2 (DALYs) lost in Latvia (IHME, 2016).
Based on self-reported data from the European Health Interview Survey (EHIS), nearly one in three Latvians live with hypertension, and one in twenty-nine lived with asthma. Wide inequalities persist in the prevalence of these chronic diseases by education and income level. People with the lowest level of education are over 50% more likely to live with asthma and more than twice as likely to live with diabetes as those with the highest level of education.3
Latvia also faces challenges with various infectious diseases Latvia has higher levels of infectious diseases than most other EU countries with several communicable diseases still posing major threats to public health. While the number of new tuberculosis cases has decreased since 2010, the number of new HIV and hepatitis C cases has grown steadily. In 2015, Latvia reported the highest hepatitis C notification rate in the EU (79.1 per 100 000 population compared with the EU average of 8.6) (ECDC, 2017). The reported HIV rate was more than three times the EU average (19.8 per 100 000 population compared with the EU average of 5.8) (ECDC/WHO, 2016). The Latvian Ministry of Health has developed an action plan to reduce the risk of contracting a communicable disease, promoting early intervention and diagnosis, which was submitted to the Cabinet of Ministers for approval in 2017.
10%
(Number of deaths: 14 661)
Women (Number of deaths: 13 596)
Men
Cardiovascular diseases
Cancer
Digestive system
External causes
Other causes
Respiratory diseases
10%
64% 49%
24%
11%
9% 4% 4%
19%
3%
3% 2%
Note: The data are presented by broad ICD chapter. Dementia was added to the nervous system diseases’ chapter to include it with Alzheimer’s disease (the main form of dementia).
Source: Eurostat Database (data refer to 2014).
Figure 2. Cardiovascular diseases and cancer cause more than three quarters of all deaths in Latvia
Figure 3. Heart diseases and strokes account for more than half of all deaths 2000 ranking 2014 ranking % of all deaths in 2014
29%
17%
5%
3%
2%
2%
2%
2%
1%
1%
1%
1%
1
2
3
4
5
6
7
8
9
10
19
21
1
2
3
4
5
6
7
8
9
10
16
Ischaemic heart diseases
Stroke
Other heart diseases
Lung cancer
Colorectal cancer
Diabetes
Stomach cancer
Breast cancer
Prostate cancer
Suicide
Transport accidents
26 Accidental poisoning
Source: Eurostat Database.
2. DALY is an indicator used to estimate the total number of years lost due to specific diseases and risk factors. One DALY equals one year of healthy life lost (IHME).
3. Inequalities by education may partially be attributed to the higher proportion of older people with lower educational levels; however, this alone does not account for all socioeconomic disparities.

STATE OF HEALTH IN THE EU: COUNTRY HEALTH PROFILE 2017 – LATVIA
Latv
ia
Less than half of Latvians consider themselves to be in good healthIn 2015, only 46% of Latvians reported to be in good health, the second lowest level in the EU (Figure 4). Latvian men tend to perceive their health as being better than women with 51% reporting to be in good health compared to only 42% of women. There are also large disparities by income group: only about one in three Latvians in low-income households report to be in good health, compared to two in three in high-income households.
4 . Health in Latvia
Figure 4. Large disparities by socioeconomic status in self-perceived health in Latvia
1. The shares for the total population and the low-income population are roughly the same.
2. The shares for the total population and the high-income population are roughly the same.
Source: Eurostat Database, based on EU-SILC (data refer to 2015).
3 Risk factors
20 30 40 50 60 70 80 90 100% of adults reporting to be in good health
Ireland
Cyprus
Sweden
Netherlands
Greece¹
Spain¹
Denmark
Romania²
Austria
United Kingdom
France
EU
Slovak Republic
Italy¹
Bulgaria
Slovenia
Germany
Czech Republic
Croatia
Poland
Hungary
Estonia
Portugal
Lithuania
Latvia
Finland
Luxembourg
Malta
Belgium
Total population High income Low income
Behavioural risk factors are major public health issues in Latvia The relatively poor health status of the population in Latvia is linked to a number of health determinants, including more difficult living and working conditions and behavioural risk factors. Based on the Institute of Health Metrics and Evaluation (IHME) estimations, about 40% of the overall burden of disease in Latvia in 2015 measured in terms of DALYs was attributable to behavioural risks, with smoking (11.5%), alcohol (5.7%) and high body mass index (11.0%) contributing to most of this burden (IHME, 2016).
One in five adults smoke on a daily basisAlthough the share of adults who smoke daily in Latvia has decreased since 2000 (from 33% in 2000 to 25% in 2014), it still remains higher than the average across EU countries (21%) and sixth-highest overall (Figure 5). Smoking is much more common among men (37%) than among women (15%). On a slightly more positive note, there have been substantial reductions in regular smoking among 15-year-old Latvians, so that the smoking rate among these adolescents (14% in 2013-14) is now about equal to the EU average.

STATE OF HEALTH IN THE EU: COUNTRY HEALTH PROFILE 2017 – LATVIA
Latv
ia
Risk factors . 5
Alcohol consumption is on the rise in LatviaIn contrast to most EU countries, alcohol consumption among Latvian adults has increased since 2000, rising from 7.1 litres per adult in 2000 to 10.8 litres in 2015. It is estimated that as many as one in eight Latvian adults have some form of alcohol dependency (CDPC, 2012). Nearly one in five Latvian adults report heavy alcohol consumption on a regular basis (binge drinking4), which is close to the EU average. Binge drinking is much more frequent among men (33%) than among women (8%). Heavy alcohol consumption is also a problem among Latvian adolescents, with one in three 15-year-old boys and one in four girls reporting to have been drunk more than once in their life. This is a greater proportion than in most EU countries.
Obesity is a growing problem among adultsIncreasing rates of obesity are a growing public health issue in Latvia. More than one in five adults (21%) were obese in 2014, an increase from one in six in 2008 (17%), and the third highest rate in the EU. In contrast with other risk factors, the obesity rate
in Latvia is higher among women (23%) than men (19%). It is also higher among people that have not completed their secondary education (23%) compared to those with tertiary education (18%).
Although overweight and obesity rates among adolescents remain below the EU average, they have increased sharply in Latvia, from 6% in 2001-02 to 15% in 2013-14. Twice as many boys as girls were overweight or obese in 2013-14. This trend is worrisome as being overweight or obese in childhood and adolescence increases greatly the risk of being overweight and obese in adulthood.
The level of physical activity among adults in Latvia is relatively low, with only six out of ten adults reporting that they practice at least moderate physical activity each week. This is below the EU average (64%). However, seven out of ten Latvian men exercise weekly, compared to just over half (54%) of Latvian women. Latvia fares better compared to other EU countries in physical activity among adolescents, but still only 14% of 15-year-old girls and 21% of 15-year-old boys report doing the required level of physical activity each day.
Note: The closer the dot is to the centre the better the country performs compared to other EU countries. No country is in the white ‘target area’ as there is room for progress in all countries in all areas.
Source: OECD calculations based on Eurostat Database (EHIS in or around 2014), OECD Health Statistics and HBSC survey in 2013–14. (Chart design: Laboratorio MeS).
4. Binge drinking behaviour is defined as consuming six or more alcoholic drinks on a single occasion, at least once a month over the past year.
Figure 5. Smoking and obesity are public health concerns in Latvia
Physical activity, adults
Physical activity, 15-year-olds
Obesity, adults
Smoking, 15-year-olds
Overweight/obesity, 15-year-olds
Drunkenness, 15-year-olds
Smoking, adults
Binge drinking, adults
STATE OF HEALTH IN THE EU: COUNTRY HEALTH PROFILE 2017 – LATVIA
Latv
ia6 . The health system
4 The health system
Latvia has an NHS-type health system with a purchaser-provider splitThe Latvian health care system is characterised by tax-financed statutory health care provision, a purchaser–provider split and a mix of public and private providers. The system is the result of more than 25 years of transformation since the independence of the country in 1991. After undergoing several reforms, a National Health Service (NHS) type system was established in 2011.
The two main actors in the health system are the Ministry of Health, which is responsible for developing national health policies and for the overall organisation and functioning of the health system, and the NHS, which implements health policies and purchases of publicly financed health services.
Providers contracting with the NHS tend to be predominantly private in the case of primary care; public and private in the case of secondary care, with public ownership concentrated mainly at the municipal level; and predominantly public in the case of tertiary care, with ownership concentrated at the national level.
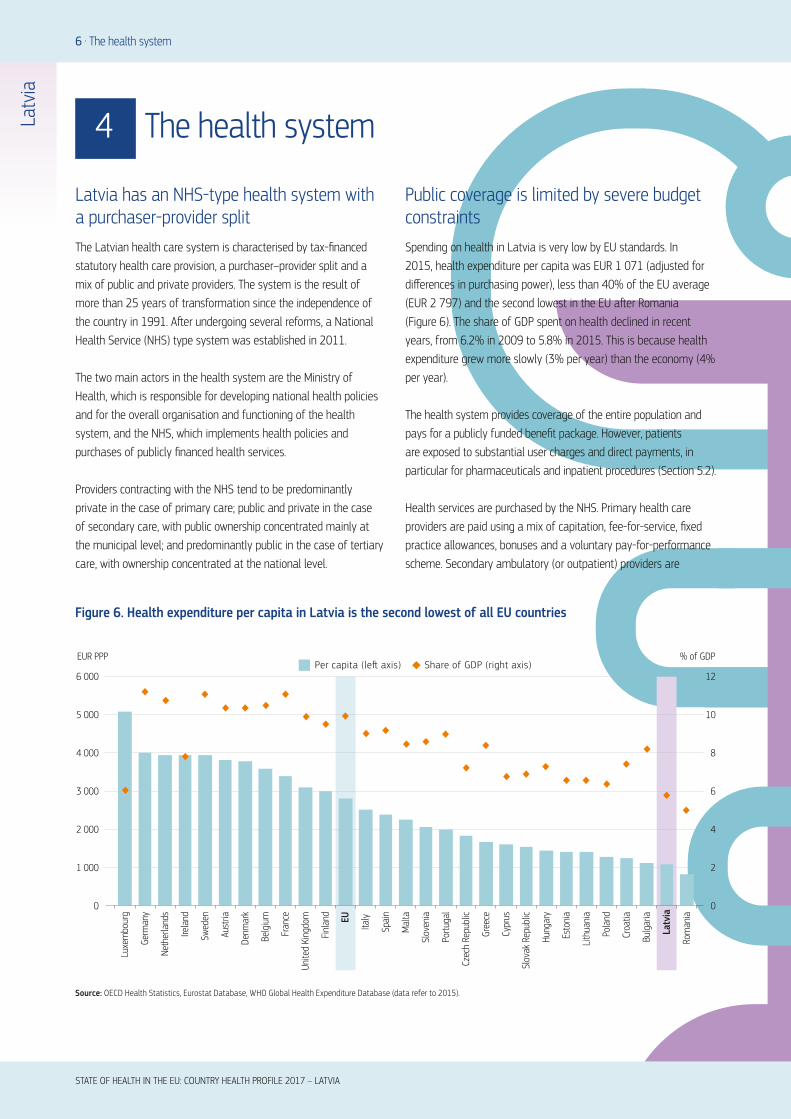
Public coverage is limited by severe budget constraintsSpending on health in Latvia is very low by EU standards. In 2015, health expenditure per capita was EUR 1 071 (adjusted for differences in purchasing power), less than 40% of the EU average (EUR 2 797) and the second lowest in the EU after Romania (Figure 6). The share of GDP spent on health declined in recent years, from 6.2% in 2009 to 5.8% in 2015. This is because health expenditure grew more slowly (3% per year) than the economy (4% per year).
The health system provides coverage of the entire population and pays for a publicly funded benefit package. However, patients are exposed to substantial user charges and direct payments, in particular for pharmaceuticals and inpatient procedures (Section 5.2).
Health services are purchased by the NHS. Primary health care providers are paid using a mix of capitation, fee-for-service, fixed practice allowances, bonuses and a voluntary pay-for-performance scheme. Secondary ambulatory (or outpatient) providers are
Source: OECD Health Statistics, Eurostat Database, WHO Global Health Expenditure Database (data refer to 2015).
Figure 6. Health expenditure per capita in Latvia is the second lowest of all EU countries
0
2
4
6
8
10
12
0
1 000
2 000
3 000
4 000
5 000
6 000Per capita (le� axis) Share of GDP (right axis)
EUR PPP % of GDP
Luxe
mbo
urg
Germ
any
Neth
erla
nds
Swed
en
Irela
nd
Aust
ria
Denm
ark
Belg
ium
Fran
ce
Unite
d Ki
ngdo
m
Finl
and EU
Italy
Mal
ta
Spai
n
Slov
enia
Portu
gal
Czec
h Re
publ
ic
Gree
ce
Cypr
us
Slov
ak R
epub
lic
Hung
ary
Lith
uani
a
Esto
nia
Pola
nd
Croa
tia
Bulg
aria
Latv
ia
Rom
ania

STATE OF HEALTH IN THE EU: COUNTRY HEALTH PROFILE 2017 – LATVIA
Latv
ia
The health system . 7
primarily paid by flat rate fees for defined episodes of illness, with additional fee-for-service payments for preventive, diagnostic and therapeutic interventions. Global budgets adjusted for numbers and types of patients treated were introduced for hospitals in 2010 to control expenditure. The implementation of a new hospital payment based on diagnostic-related groups (DRGs) began in 2015.
General practitioners are the cornerstone of primary careAlmost all Latvians are registered with a general practitioner (GP), who acts as the main point of entry to the health care system and as the gatekeeper to secondary, specialist services. In rural areas (where about a third of the population lives), physician assistants (feldshers) or midwives still provide a considerable share of primary care services. A patient with a referral from the GP can freely choose any specialist or hospital that has a contract with the NHS. Some specialists can be accessed directly (e.g. paediatricians, gynaecologists and ophthalmologists) and patients diagnosed with certain conditions have direct access to relevant specialists (e.g. oncologists psychiatrists and endocrinologists). In 2016, a requirement that only specialists can issue referrals for certain highly specialised diagnostic and laboratory examinations was introduced as an attempt to rationalise expenditure.
The health workforce is under pressureThe number of physicians per population in Latvia is below the EU average (3.2 per 1 000 population compared to 3.6 for the EU average), and the number of nurses per capita is very low (4.7 per 1 000 population), the third lowest number among EU countries after Bulgaria and Greece (Figure 7). Low salaries and difficult working conditions make it difficult to recruit and retain a sufficient number of skilled health workers. Since Latvian doctors and nurses are generally considered well-trained and highly competent, many of them have found employment elsewhere in Europe, particularly after the financial crisis (Section 5.2).
Budget constraints have encouraged a downsizing of the hospital sectorThe overall number of hospital beds per population in Latvia has declined by more than one-third since 2000, coming down from 8.8 per 1 000 population in 2000 to 5.7 in 2015, but still remains above the EU average (5.2), This reduction has been driven by a sharp reduction in the number of acute care beds (which dropped from 6.1 per 1 000 population in 2000 to 3.4 in 2015). However, the number of discharges remains slightly above the EU average. Latvian patients stay on average 8.3 days in the hospital, which also is slightly above the EU average of 8.0 days.
Note: In Portugal and Greece, data refer to all doctors licensed to practice, resulting in a large overestimation of the number of practising doctors (e.g. of around 30% in Portugal). In Austria and Greece, the number of nurses is underestimated as it only includes those working in hospital.
Source: Eurostat Database.
Figure 7. Latvia has among the lowest numbers of practising doctors and nurses
Doctors LowNurses High
Doctors LowNurses Low
Doctors HighNurses High
Doctors HighNurses Low
20
15
10
5
0
1 2 3 4 5 6 7
Prac
tisin
g nu
rses
per
1 0
00 p
opul
atio
n, 2
015
(or n
eare
st y
ear)
Practising doctors per 1 000 population, 2015 (or nearest year)
EU UK
EU average: 3.6
EU average: 8.4AT
BE
BG
HR
CY
CZ
DK
EE
FR
DE
EL
HU
IE
IT
Latvia
LT
LU
MT
NL
PL PTRO
SK
SI
ES
SE
FI

STATE OF HEALTH IN THE EU: COUNTRY HEALTH PROFILE 2017 – LATVIA
Latv
ia
239.5
214.9
207.1
196.3
192.3
168.2
152.5
147.8
121.5
119.9
98.7
97.5
94.4
92.3
88.7
88.2
85.5
85.4
83.9
83.0
80.7
79.7
79.4
77.4
74.1
69.3
67.7
64.9
0 100 200 300 400 500
64.4
Romania
Latvia
Bulgaria
Lithuania
Hungary
Slovak Republic
Estonia
Croatia
Poland
Czech Republic
Malta
EU
United Kingdom
Ireland
Slovenia
Germany
Greece
Denmark
Portugal
Austria
Belgium
Netherlands
Sweden
Finland
Italy
Cyprus
Luxembourg
France
Spain
MenWomen
Age-standardised rates per 100 000 population
0 200 400 600
Age-standardised rates per 100 000 population
501.2
473.2
415.0
388.8
361.3
350.7
335.9
278.2
242.5
229.0
168.2
160.3
158.2
154.4
152.1
149.0
139.6
139.1
138.0
133.0
117.2
117.0
115.1
113.7
110.5
108.2
107.9
96.4
92.1
Lithuania
Latvia
Romania
Bulgaria
Hungary
Estonia
Slovak Republic
Croatia
Czech Republic
Poland
Greece
Slovenia
EU
Finland
Portugal
Malta
Germany
United Kingdom
Austria
Ireland
Sweden
Cyprus
Spain
Denmark
Belgium
Italy
Luxembourg
Netherlands
France
STATE OF HEALTH IN THE EU: COUNTRY HEALTH PROFILE 2017 – LATVIA
5.1 EFFECTIVENESS
Avoidable mortality rates in Latvia are among the highest in the EU Mortality amenable to health care5 provides a general indication of the effectiveness of the Latvian health care system in treating people with life-threatening conditions. In 2014, Latvia had the highest rate of amenable mortality for men and the second highest for women (Figure 8). Ischaemic heart diseases accounted for a very large proportion (44%) of amenable deaths. Other important causes of amenable deaths were stroke (22% of the total) and hypertensive diseases (6%).
More people die after being admitted to hospital for heart attack or stroke in Latvia than in other EU countriesMortality following hospital admission for an acute myocardial infarction (AMI or heart attack) and stroke provides a good indication of the quality of acute care, capturing important processes of care, such as timely transport of patients and the delivery of effective and appropriate treatment in dedicated stroke or cardiac units. Deaths following admission for AMI and stroke are higher in Latvia than in any other EU country reporting these data (Figure 9).
8 . Assessment of the health system
5 Assessment of the health system
Figure 8. Latvia lags far behind other EU countries in terms of amenable mortality
5. Amenable mortality is defined as premature deaths that could have been avoided through timely and effective health care.
Source: Eurostat Database.(data refer to 2014.

Latv
ia
Assessment of the health system . 9
However, there are important variations across hospitals in Latvia in mortality rates following admission for AMI. Mortality rates in some hospitals are up to two times higher than in other hospitals. This indicates opportunities to improve overall hospital system performance by focusing policy action on greater consistency of care across all hospitals (OECD, 2017).
Poor cancer outcomes drive new reforms to improve cancer careSurvival after a diagnosis from breast cancer, cervical cancer and colon cancer has increased slightly in Latvia over the past decade, but the gap has nonetheless widened compared to many other countries. The relatively low survival from treatable cancers is partly due to low screening rates. This means that a high share of cancer patients is diagnosed at a later stage. In 2015, only one quarter of Latvian women in the target group (20-69 years) were screened for cervical cancer during the last three years, while only about one-third of women in the target group (50-69 years) had mammography screening during the last two years6.
Latvia intensified efforts in recent years to improve cancer care. In addition to introducing national cancer control strategies in 2009, cancer care delivery has been centralised and expertise concentrated in specialised institutions to improve both quality and efficiency of care delivery. A national plan was adopted in 2017 aiming to improve cancer care in Latvia. It includes reducing the prevalence of risk factors and improving access to early diagnosis and treatment, as well as rehabilitation and palliative care. This initiative, called the ‘Green Corridor’ pathway, specifically targets early diagnosis of cancer (Box 1).
Potentially avoidable hospitalisations can be reduced by strengthening primary careHospitalisations for chronic conditions, such as asthma, chronic obstructive respiratory disease (COPD) and diabetes, provide an indication of the quality of primary care as these hospitalisations may be prevented if well-managed in primary care. Latvia has a high rate of hospitalisations for asthma, which is more than double the EU average (119 per 100 000 population versus 52 per 100 000 population). On the other hand, Latvia fares better when it comes to hospitalisation for diabetes with the rate closer to the EU average (Figure 10).
Latvia has undertaken several initiatives in recent years to strengthen the quality of its primary care. A new pay-for-performance scheme was introduced in 2013 to reward GPs who are meeting defined targets for prevention, chronic disease management, increased diversity and efficiency of services.
The impact of these initiatives has not yet been evident, as shown by the high hospital admission rates for chronic diseases and the persistently low survival from cancer. However, it is still too early to assess either the changes in physician behaviour or the health impacts. The increasing prevalence of some key risk factors and consistently low cancer screening rates nonetheless signal the challenges for prevention and early detection, and most indicators in the pay-for-performance scheme have not been met by most GPs since the scheme was implemented (OECD, 2016).
6. However, in addition to the organised cervical cancer screening in Latvia, opportunistic screening is still widely applied, meaning that the proportion of patients undergoing screening may be higher.
BOX 1. RECENT REFORM AIMING TO PROMOTE EARLY DETECTION OF CANCER AND IMPROVE QUALITY OF CARE
A new streamlined pathway to ensure effective and timely diagnosis and treatment of cancer was introduced on 1 October 2016. According to this so-called ‘Green Corridor’, family doctors with a medically reasonable suspicion of cancer in a patient have to refer this patient for primary diagnostic examinations within 10 working days. If the suspicion of cancer is confirmed, the family doctor has to request an appointment at a specialised cancer centre for a specialist consultation and secondary diagnostic tests within another 10 working days. A first treatment decision has to be taken no later than one month after the first specialist consultation. During the period from 14 November to 31 December 2016 according to the ‘Green corridor’ pathway, 926 patients received such accelerated oncological consultations.
Note: These data refer to mortality rates within 30 days following a hospital admission for AMI and ischaemic stroke, including deaths both in the hospital where the patient was initially admitted and deaths in other settings.
Source: OECD Health Statistics (data refer to 2015).
Figure 9. Latvia has the EU’s highest death rates from heart attacks and stroke
Age-sex standardised rate per 100 000 population aged 45 and over
10.5EU15
18.0Latvia
12.7EU15
25.7Latvia
STATE OF HEALTH IN THE EU: COUNTRY HEALTH PROFILE 2017 – LATVIA

STATE OF HEALTH IN THE EU: COUNTRY HEALTH PROFILE 2017 – LATVIA
10 . Assessment of the health system
Preventable deaths are high in Latvia, particularly among men Preventable mortality, such as deaths from traffic accidents, lung cancer and alcohol-related conditions, shows that Latvia struggles to reduce the number of premature deaths. While alcohol-related death rates are the second highest in the EU, traffic accidents caused more deaths in Latvia than in any other EU country. In fact, four times as many men as women died in road traffic accidents in 2014. Latvian men are also at substantially higher risk of dying from lung cancer, with death rates more than seven times higher for men than women.
These premature deaths could be reduced if appropriate and effective prevention policies and strategies were in place, specifically targeting high risk groups. Although a series of tobacco control policies contributed to a reduction in smoking rates among adolescents and adults in Latvia over the past decade, the smoking rates among adults nonetheless remain higher than in most other EU countries, particularly among men and people with lower levels of education.
Latvia’s low spending on prevention raises concerns. Spending on prevention represents only 2% of current health spending in Latvia compared to the EU average of 3%. Investment in public health and prevention in Latvia is also heavily reliant on funding from the EU and the international community more broadly. One of these EU-
funded initiatives is the Public Health Strategy for 2014-20, which allocates considerable financial resources for health promotion and prevention activities.
Drawing on experiences from other EU countries in reducing harmful alcohol consumption, the Latvian government increased excise taxes on alcoholic beverages and tobacco products in 2015 and 2017. A national action plan is currently under preparation, including activities aimed at reducing harmful alcohol consumption and alcoholism, as well as strengthening regulations around the marketing of alcoholic drinks.
5.2 ACCESSIBILITY
Despite universal health coverage, many Latvians cannot access the care they needLatvia has universal health coverage, although the breadth and depth of coverage is more limited than in most other EU countries. As a result, a large share of people reports problems in obtaining care mainly because of financial barriers, but also because of geographic reasons or long waiting times.
In 2015, 8.4% of Latvians reported unmet medical care needs, the fourth highest share among all EU countries (Figure 11). Unmet medical care needs are mainly reported by people in low-income groups: one in six Latvians (17.1%) from low-income households
Note: Rates are not adjusted by health care needs or health risk factors.
Source: OECD Health Statistics 2017 (data refer to 2015).
Figure 10. High hospital admissions raise questions over quality of chronic disease management
0
100
200
300
400
500
600Po
rtuga
l
Italy
Neth
erla
nds
Unite
d Ki
ngdo
m
Spai
n
Slov
enia
Swed
en
Esto
nia
Fran
ce
Denm
ark
Belg
ium
Finl
and
Luxe
mbo
urg EU
Irela
nd
Mal
ta
Czec
h Re
p.
Slov
ak R
ep.
Aust
ria
Latv
ia
Germ
any
Pola
nd
Hung
ary
Lith
uani
a
COPDDiabetes Asthma
Latv
ia

STATE OF HEALTH IN THE EU: COUNTRY HEALTH PROFILE 2017 – LATVIA
Latv
ia
Assessment of the health system . 11
reported to having forgone medical appointment or treatment due to financial or other reasons, a share that is three times greater than the EU average (5.5%). In contrast, only 2.5% of high-income households in Latvia reported such unmet needs.
Latvians also report the highest level of unmet needs for dental care among EU countries with almost 14% of the population reporting unmet dental care needs in 2015. This is over three times higher than the EU average (4.4%). Here as well, there is a large disparity by income group: 27% of people with low income reported unmet needs for dental care compared to about 4% only for people in the highest income group.
The publicly-funded benefits package is limited in scope Publicly-funded health benefits cover only services provided by physicians and institutions that have contractual agreements with the NHS. The benefit package is defined by ‘positive lists’ (for pharmaceuticals and for certain preventive, diagnostic and therapeutic interventions) and ‘negative lists’ (exclusion of certain services, such as dental care for adults, rehabilitation with exceptions, as well as sight and hearing correction aids).
The scope of the benefit package is relatively limited, and it was reduced after the economic crisis in 2008 to contain health spending during the period of fiscal consolidation. Some clear gaps exist between recommended clinical practice and the publicly-funded benefits package. For example, thrombolysis for ischaemic stroke is excluded from the benefit package, running against clinical evidence on international best practice. Furthermore, procedures that might be expected to be covered, such as thoracic surgery and some neurological procedures are not included. A failure to make such services systematically available limits access to good quality care.
Barriers to care are exacerbated by high user charges and the annual ‘quota’ systemAll health services in Latvia, including GP visits, specialist visits, hospital stays and pharmaceuticals, require cost-sharing in the form of user charges. Public funding only accounted for 57% of health spending in 2015, the second lowest share in the EU after Bulgaria (Figure 12). Nearly all of the rest (42%) is paid out of pocket by patients themselves. This is the third highest share in the EU after Cyprus and Bulgaria, and nearly three times the EU average of 15%. These large out-of-pocket payments constitute a substantial barrier to accessing medical care for many Latvians, as reflected in the high levels of unmet medical and dental care needs.
The organisation of health services is based on an annual ‘quota’ system, which constitutes an additional barrier to accessing care for Latvians. Service providers are given annual quotas for the volume of services that will be covered by the NHS. When these service quota limits are reached, patients must either wait for the following year and the renewal of the quota or pay for the services out of pocket. Therefore, access has been reported to worsen in the last months of the year. However, the ‘quota’ system’s impact on waiting times is seen throughout the year. To avoid long waits for services, many people choose to pay out of pocket, contributing to Latvia’s high shares of out-of-pocket payments.
Total population Low income High income
Estonia
Greece
Romania
Latvia
Poland
Italy
Bulgaria
Finland
EU
Portugal
Lithuania
Ireland
United Kingdom
Hungary
Belgium
Slovak Republic
Croatia
Cyprus
Denmark
France
Sweden
Luxembourg
Czech Republic
Malta
Spain
Germany
Netherlands
Slovenia
Austria
20100% reporting unmet medical need, 2015
Figure 11. Latvians report the fourth highest level of unmet needs for medical care in the EU
Note: The data refer to unmet needs for a medical examination or treatment due to
costs, distance to travel or waiting times. Caution is required in comparing the data across
countries as there are some variations in the survey instrument used.
Source: Eurostat Database, based on EU-SILC (data refer to 2015).

STATE OF HEALTH IN THE EU: COUNTRY HEALTH PROFILE 2017 – LATVIA
12 . Assessment of the health systemLa
tvia
High cost-sharing puts low-income households at risk of facing catastrophic out-of-pocket paymentsThe limited coverage of health services and pharmaceuticals outside hospital is reflected in the structure of out-of-pocket spending. In 2015, spending on pharmaceuticals and curative care represented 80% of total out-of-pocket spending, with dental care accounting for another 10%. As a consequence, many Latvian households face catastrophic out-of-pocket payments.7 This is particularly the case among low-income households, with over 25% of them facing catastrophic out-of-pocket payments in 2013 (Figure 13).
The reduction in the share of low-income households facing catastrophic out-of-pocket payments between 2008 and 2010 was partly due to the implementation of the Safety Net and Social Sector Reform Programme. This scheme, which was implemented from 2009-11, aimed to protect the poorest people from financial risk in the event of illness by exempting certain households from co-payments and subsidising pharmaceuticals. While the scheme is still covering some specific patient groups, it was discontinued for low-income households in 2011. After discontinuation, the share of households in the lowest income groups (1st and 2nd income quintile) facing catastrophic of-pocket payments increased sharply, going back to their 2008 level.
Figure 13. Catastrophic out-of-pocket payments affect mostly low-income households
7. Catastrophic expenditure is defined as household out-of-pocket spending exceeding 40% of total household spending net of subsistence needs (i.e. food, housing and utilities).
% o
f hou
seho
lds
in q
uint
ile
2008 2009 2010 2013
30
25
20
15
10
5
0
Poorest 2nd 3rd 4th Richest
Source: Taube et al (2017, forthcoming) (data refer to 2013).
Figure 12. Out-of-pocket payments account for a large share of health spending in Latvia
Source: OECD Health Statistics, Eurostat Database (data refer to 2015).
Public/Compulsaryhealth insurance
Out-of-pocket
Other
Voluntary health insurance
Latvia1%
42% 57%
EU1%
79%
15%
5%

STATE OF HEALTH IN THE EU: COUNTRY HEALTH PROFILE 2017 – LATVIA
Latv
ia
Assessment of the health system . 13
Steps were taken to address shortages of health professionals Although the number of practising doctors has slowly increased, it remains below the EU average. The number of practising nurses causes even greater concern. Not only are the numbers below the EU average, but the numbers of new graduates have dropped sharply since 2011. Furthermore, low salaries and difficult working conditions have led many nurse graduates to choose not to pursue a nursing career and rather seek employment in other sectors in Latvia. Many nurses have also decided to migrate to other EU countries.
Latvia also faces growing challenges with the geographic distribution of health workers. Due to declining population, GPs are leaving rural areas or are reaching retirement without being replaced. Geographic distribution of secondary and tertiary services throughout the country also poses a problem with many services concentrated in urban areas, particularly in or around Riga. The introduction of free hotel-type accommodation for low-income groups when they have to travel for treatment (typically for day surgery) is designed to mitigate these additional travel costs.
With the support from EU funding, several measures are underway to attract health workers to work in rural areas, thereby reducing the shortage of specialists and health workers in regions outside of Riga. The Ministry of Health has taken steps since April 2015 to address the geographic maldistribution of doctors by requiring medical universities to give priority residency positions to applicants who have agreed to practice in a rural area after completing their training. Some 43 residents were accepted in this new ‘regional arrangement’ programme during the second year of implementation (2016-17).
5.3 RESILIENCE
Latvia has taken steps to improve efficiency in the hospital sectorLatvia’s health system is structurally underfunded. Increasing efficiency to optimise the use of limited resources has been, and continues to be, a major priority – and progress has been made. In response to the economic crisis and budgetary pressures, Latvia closed a number of hospitals and 18 emergency departments in order to improve quality and contain costs. Simultaneously, efforts were made to move care out of hospitals to community settings to reduce admissions and lengths of stay in hospitals.
Latvia’s push to reduce the size of the hospital sector and move more care into the community started before the economic crisis but was accelerated afterwards. The ‘Development Programme for Outpatient and Inpatient Healthcare Service Providers’ (adopted
in 2004 with an implementation plan in 2005) aimed to further develop an integrated health care system through optimising the number and distribution of service providers. The programme and implementation plan stipulated that, as of 2005, the number of hospital beds providing state-paid services would gradually be decreased. Furthermore, a home care programme was put in place to promote earlier discharge for frail patients. Services provided comprise close follow-up of chronically ill patients, post-surgery care and rehabilitation for stroke patients.
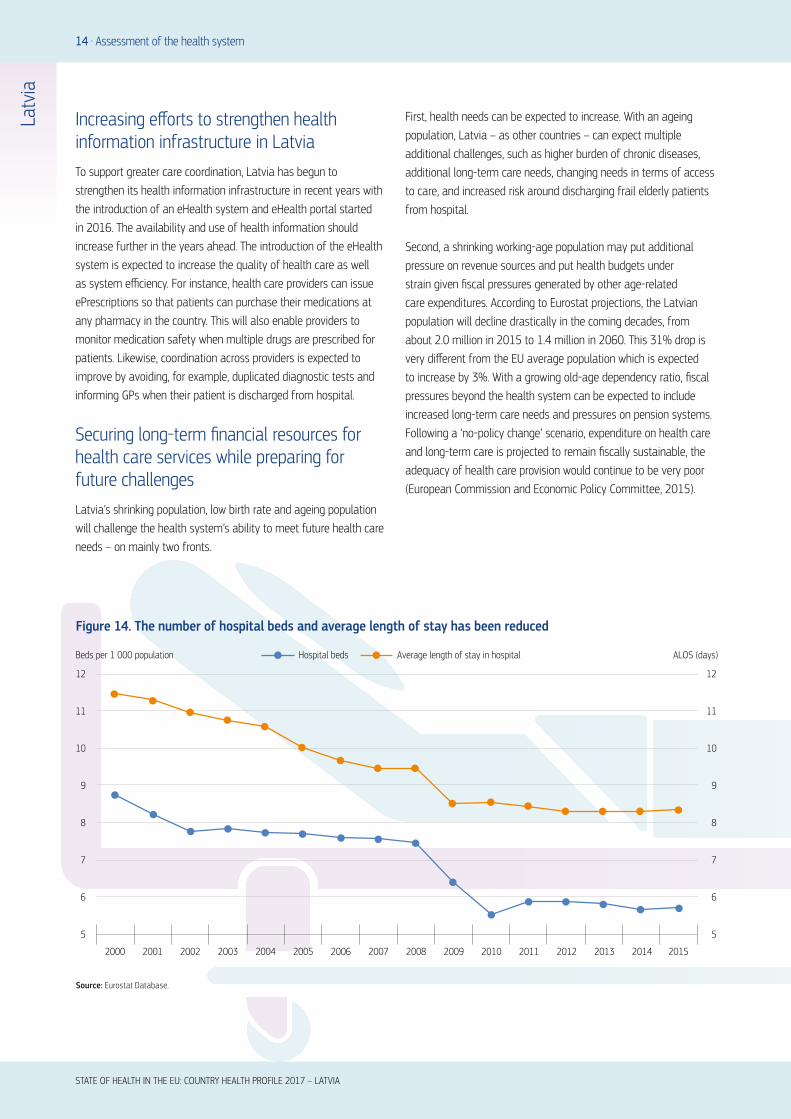
By 2015, there were 6 435 fewer hospital beds than in 2005, a reduction of 36%. However, most of this reduction occurred in 2009-10. The number of hospitals providing state-funded services also decreased by more than half with the closure of some institutions and the transformation of others from inpatient to outpatient settings exclusively. At the same time, there was a decrease of nearly 20% in average length of stay in hospital, coming down from 10 days in 2005 to 8.3 days in 2015, with most of the reduction occurring after 2008 (Figure 14).
While Latvia has already reduced hospital beds to a level close to the EU average and closed a number of hospitals and emergency departments, its level of psychiatric care beds remain high. There may be scope for functional changes to help secure higher quality care and greater efficiency. It is important, however, that such efficiency measures are part of a broader plan to strengthen mental health care and expand the scope of services provided outside of hospitals. The Mental Health Care Policy Action Plan implemented in 2013-14 included measures to improve the availability and quality of mental health care services.
Latvia implemented measures to increase the use of genericsLatvia’s relatively low public spending coupled with the high share of out-of-pocket spending for pharmaceuticals create financial barriers to pharmaceutical drugs for many people, particularly those in low-income groups. Latvia has encouraged the use of generic medicines by obliging pharmacists to offer the cheapest version of prescribed pharmaceutical products that are included in the publicly funded benefit package. For other prescriptions, pharmacists are allowed to substitute unless the prescribing doctor has forbidden this option. These measures led to a high share of the generics market, in terms of value and volume.
STATE OF HEALTH IN THE EU: COUNTRY HEALTH PROFILE 2017 – LATVIA
Latv
ia
Increasing efforts to strengthen health information infrastructure in Latvia To support greater care coordination, Latvia has begun to strengthen its health information infrastructure in recent years with the introduction of an eHealth system and eHealth portal started in 2016. The availability and use of health information should increase further in the years ahead. The introduction of the eHealth system is expected to increase the quality of health care as well as system efficiency. For instance, health care providers can issue ePrescriptions so that patients can purchase their medications at any pharmacy in the country. This will also enable providers to monitor medication safety when multiple drugs are prescribed for patients. Likewise, coordination across providers is expected to improve by avoiding, for example, duplicated diagnostic tests and informing GPs when their patient is discharged from hospital.
Securing long-term financial resources for health care services while preparing for future challenges Latvia’s shrinking population, low birth rate and ageing population will challenge the health system’s ability to meet future health care needs – on mainly two fronts.
First, health needs can be expected to increase. With an ageing population, Latvia – as other countries – can expect multiple additional challenges, such as higher burden of chronic diseases, additional long-term care needs, changing needs in terms of access to care, and increased risk around discharging frail elderly patients from hospital.
Second, a shrinking working-age population may put additional pressure on revenue sources and put health budgets under strain given fiscal pressures generated by other age-related care expenditures. According to Eurostat projections, the Latvian population will decline drastically in the coming decades, from about 2.0 million in 2015 to 1.4 million in 2060. This 31% drop is very different from the EU average population which is expected to increase by 3%. With a growing old-age dependency ratio, fiscal pressures beyond the health system can be expected to include increased long-term care needs and pressures on pension systems. Following a ‘no-policy change’ scenario, expenditure on health care and long-term care is projected to remain fiscally sustainable, the adequacy of health care provision would continue to be very poor (European Commission and Economic Policy Committee, 2015).
14 . Assessment of the health system
Figure 14. The number of hospital beds and average length of stay has been reduced
12
2000 2001 2002 2003 2004 2005 2006 2007 2008 2009 2010 2011 2012 2013 2014 2015
11
10
9
8
7
6
5
12
11
10
9
8
7
6
5
Hospital bedsBeds per 1 000 population ALOS (days)Average length of stay in hospital
Source: Eurostat Database.
STATE OF HEALTH IN THE EU: COUNTRY HEALTH PROFILE 2017 – LATVIA
Latv
ia
ATBE
BGHR
CYCZ
DK
EE
FI
FR
DE
ELHU
IE
IT
LatviaLT
LU
MT
NL
PL
PT
RO
SK
SI
ES
SE
UK
0
1 000
2 000
3 000
4 000
5 000
6 000
0 50 100 150 200 250 300 350
Health expenditure per capita, EUR PPP
Amenable mortality per 100 000 population
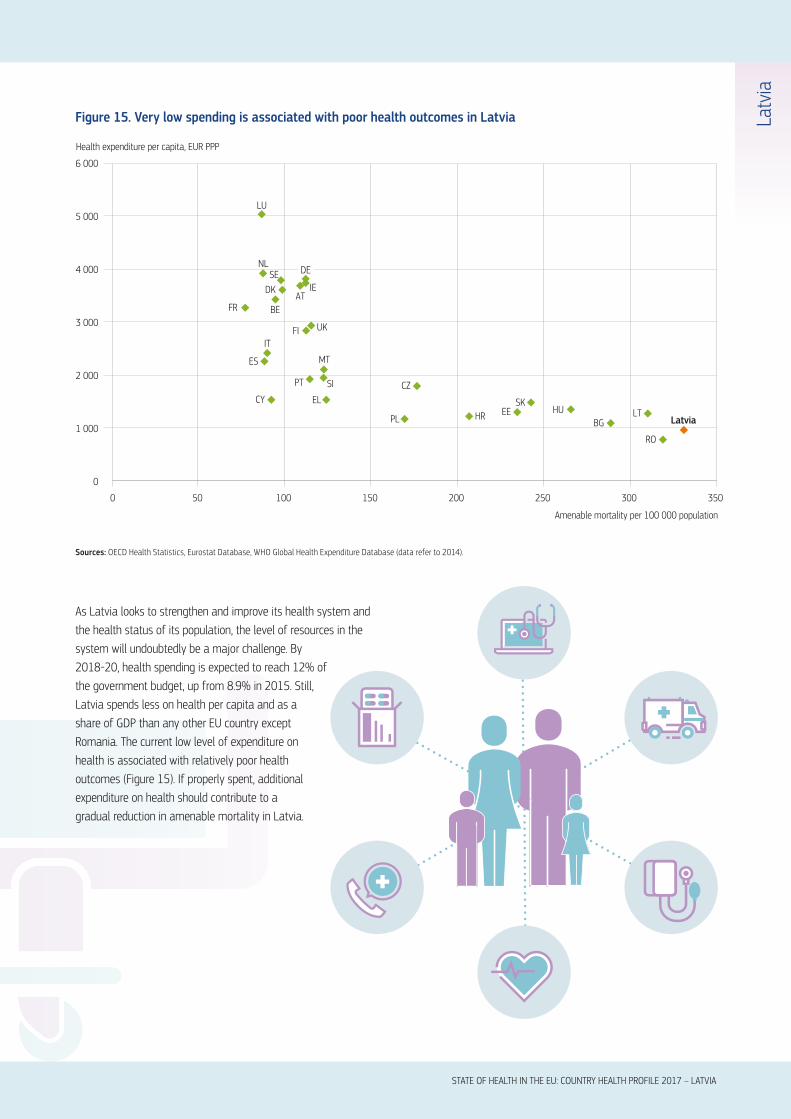
Figure 15. Very low spending is associated with poor health outcomes in Latvia
Sources: OECD Health Statistics, Eurostat Database, WHO Global Health Expenditure Database (data refer to 2014).
Assessment of the health system . 15
As Latvia looks to strengthen and improve its health system and the health status of its population, the level of resources in the system will undoubtedly be a major challenge. By 2018-20, health spending is expected to reach 12% of the government budget, up from 8.9% in 2015. Still, Latvia spends less on health per capita and as a share of GDP than any other EU country except Romania. The current low level of expenditure on health is associated with relatively poor health outcomes (Figure 15). If properly spent, additional expenditure on health should contribute to a gradual reduction in amenable mortality in Latvia.

Latv
ia16 . Key findings
STATE OF HEALTH IN THE EU: COUNTRY HEALTH PROFILE 2017 – LATVIA
lThe life expectancy of the Latvian population increased
quite rapidly over the past fifteen years, but still lags
about six years behind the EU average, and is the third
lowest in the EU after Lithuania and Bulgaria. There are
huge gaps in life expectancy by sex and socioeconomic
status. Latvian men can expect to live on average
nearly ten years less than women. The gap in life
expectancy at age 25 between Latvians with the lowest
and highest level of education is also ten years. These
health inequalities are mainly due to higher prevalence
of risk factors, particularly smoking and harmful alcohol
consumption, among men and people with low education
or income.
lStrengthening efforts to prevent non-communicable
diseases has been recognised as a priority in Latvia,
with policies designed to control tobacco smoking,
alcohol abuse and obesity. The Public Health Strategy
for 2014-20 allocates considerable financial resources
for health promotion and prevention activities, using
EU funds and state budget, to address key risk factors
related to cardiovascular diseases and cancer, as well as
perinatal, neonatal and mental health.
lThe performance of the Latvian health care system
must be considered in the light of the limited resources
available. Health spending in Latvia is among the lowest
in the EU, resulting in considerable resource constraints
within the health system. The low level of health
spending is a challenge to sustainable improvements in
population health and health system performance. Recent
government plans to increase public spending on health
should produce real inroads into problems with access
and quality of care and contribute to improving health
outcomes for the population.
lGiven the limited resources that have been allocated so
far to health, it is not surprising to see that the Latvian
health system does not perform well in terms of quality
or access. Regarding the quality of acute care, Latvia
has the highest case fatality rates for heart attack and
stroke among all the EU countries reporting these data.
Early detection and timely access to treatment are also
challenges in cancer care with both screening rates and
net survival for breast and cervical cancer among the
lowest in the EU.
lAccess to quality primary care can be assessed by
looking at hospitalisations for chronic conditions that
could had been avoided if patients were well-managed
in primary care. The Latvian data indicate that there is
scope for improving chronic disease management outside
of hospitals. While hospitalisation rates for diabetes in
Latvia is close to the EU average, it is much higher for
asthma and chronic obstructive pulmonary disease.
lGiven the low levels of public spending on health, the
health system is highly reliant on private spending in the
form of direct out-of-pocket payments by households.
Cost-sharing requirements are applied to nearly all health
services, resulting in severe financial barriers to accessing
care, particularly for low-income households. The lack
of financial protection mechanisms for people with low
incomes limits access to care. More than one in four
low-income households face catastrophic out-of-pocket
spending.
6 Key findings

STATE OF HEALTH IN THE EU: COUNTRY HEALTH PROFILE 2017 – LATVIA
Health in Latvia . c
Latv
ia
Mitenbergs, U. et al. (2012), “Latvia: Health System Review”, Health Systems in Transition, Vol. 14(8).
CDPC (Centre for Disease Prevention and Control) (2012), Atkaribu_izraisoso_vielu_lietosanas_izplatiba_un_sekas_Latvija_2011_gada%20(6).pdf, p. 39.
ECDC (2017). Annual epidemiological report for 2015 – Hepatitis C. European Centre for Disease Prevention and Control, Stockholm.
ECDC (2016), “Systematic Review on Hepatitis B and C Prevalence in the EU/EEA”, Stockholm, accessible from: http://ecdc.europa.eu/en/publications/Publications/systematic-review-hepatitis-B-C-prevalence.pdf.
ECDC/WHO (2016). HIV Surveillance in Europe, 2015. European Centre for Disease Prevention and Control, Stockholm.
European Commission (DG ECFIN) and Economic Policy Committee (AWG) (2015), “The 2015 Ageing Report – Economic and budgetary projections for the 28 EU Member States (2013-2060)”, European Economy 3, Brussels, May.
IHME (2016), “Global Health Data Exchange”, Institute for Health Metrics and Evaluation, available at
http://ghdx.healthdata.org/gbd-results-tool.
OECD/EU (2016), Health at a Glance: Europe 2016: State of Health in the EU Cycle, OECD Publishing, Paris,
http://dx.doi.org/10.1787/9789264265592-en.
Health Systems and Policy Monitor, http://www.hspm.org/countries/latvia08052014/
countrypage.aspx (accessed 16/05/2017)
Murtin, F. et al. (2017), “Inequalities in Longevity by Education in OECD Countries: Insights from New OECD Estimates”, OECD Statistics Working Papers, No. 2017/02, OECD Publishing, Paris, http://dx.doi.org/10.1787/6b64d9cf-en.
OECD (2017), Health at a Glance 2017: OECD Indicators, OECD Publishing, Paris, http://dx.doi.org/10.1787/health_glance-2017-en.
OECD (2016), OECD Reviews of Health Systems: Latvia 2016, OECD Publishing, Paris,
http://dx.doi.org/10.1787/9789264262787-en.
Taube, M., E. Vaskis and O. Nesterenko (2017, forthcoming), Moving Towards Universal Health Coverage: New Evidence on Financial Protection in Latvia, WHO Regional Office for Europe, Copenhagen.
Key sources
References
Austria AT Denmark DK Hungary HU Malta MT Slovenia SIBelgium BE Estonia EE Ireland IE Netherlands NL Spain ESBulgaria BG Finland FI Italy IT Poland PL Sweden SECroatia HR France FR Latvia LV Portugal PT United Kingdom UKCyprus CY Germany DE Lithuania LT Romania RO Czech Republic CZ Greece EL Luxembourg LU Slovak Republic SK
Country abbreviations

State of Health in the EUCountry Health Profile 2017
on Health Systems and Policies
European
a partnership hosted by WHO
The Country Health Profiles are an important step in the European Commission’s two-year State of Health in the EU cycle and are the result of joint work between the Organisation for Economic Co-operation and Development (OECD) and the European Observatory on Health Systems and Policies. This series was co-ordinated by the Commission and produced with the financial assistance of the European Union.
The concise, policy relevant profiles are based on a transparent, consistent methodology, using both quantitative and qualitative data, yet flexibly adapted to the context of each EU Member State. The aim is to create a means for mutual learning and voluntary exchange that supports the efforts of Member States in their evidence-based policy making.
Each Country Health Profile provides a short synthesis of:l health status l the determinants of health, focussing on behavioural risk
factorsl the organisation of the health systeml the effectiveness, accessibility and resilience of the health
system
This is the first series of biennial country profiles, published in November 2017. The Commission is complementing the key findings of these country profiles with a Companion Report.
For more information see: ec.europa.eu/health/state
Please cite this publication as:
OECD/European Observatory on Health Systems and Policies (2017), Latvia: Country Health Profile 2017, State of Health in the EU, OECD Publishing, Paris/European Observatory on Health Systems and Policies, Brussels.http://dx.doi.org/10.1787/9789264283466-en
ISBN 9789264283466 (PDF)
Series: State of Health in the EUISSN 25227041 (online)