STATE OF FLORIDA - Florida Department of … · 2004 Pay Factor Analysis ... Master Production...
22
STATE OF FLORIDA Development and Refinement of the Florida Department of Transportation’s Percent Within Limits Hot Mix Asphalt Specification Research Report FL/DOT/SMO/06-492 Gregory A. Sholar James A. Musselman Gale C. Page Howard L. Moseley March 2006 STATE MATERIALS OFFICE
-
Upload
nguyenkiet -
Category
Documents
-
view
219 -
download
0
Transcript of STATE OF FLORIDA - Florida Department of … · 2004 Pay Factor Analysis ... Master Production...
STATE OF FLORIDA
Development and Refinement of the Florida Department of
Transportation’s Percent Within Limits Hot Mix Asphalt Specification
Research Report FL/DOT/SMO/06-492
Gregory A. Sholar James A. Musselman
Gale C. Page Howard L. Moseley
March 2006
STATE MATERIALS OFFICE
i
TABLE OF CONTENTS
List of Tables ............................................................................................................................ ii
Abstract .................................................................................................................................... iii
Introduction................................................................................................................................1
Summary of 2001 Analysis........................................................................................................1
2004 Analysis Plan ....................................................................................................................5
2004 Variability Analysis ..........................................................................................................6
2004 Pay Factor Analysis ..........................................................................................................8
PWL Pay Factor Analysis..............................................................................................9
Small Quantity Pay Factor Analysis ..............................................................................9
Specification Changes..............................................................................................................10
PWL Specification .......................................................................................................10
Small Quantity Pay Table ............................................................................................12
Master Production Range.............................................................................................14
Contractor Quality Control Data Compared to FDOT Verification Data................................15
Conclusions..............................................................................................................................16
Recommendations....................................................................................................................17
References................................................................................................................................18
ii
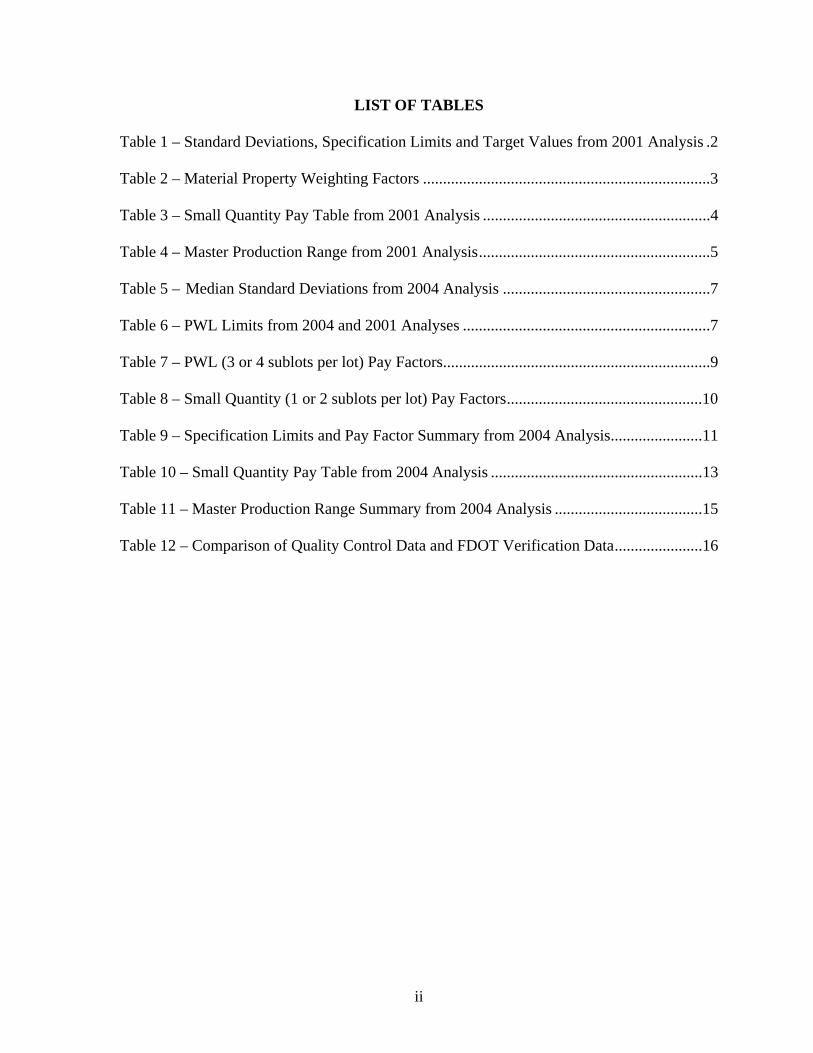
LIST OF TABLES
Table 1 – Standard Deviations, Specification Limits and Target Values from 2001 Analysis .2
Table 2 – Material Property Weighting Factors ........................................................................3
Table 3 – Small Quantity Pay Table from 2001 Analysis .........................................................4
Table 4 – Master Production Range from 2001 Analysis..........................................................5
Table 5 – Median Standard Deviations from 2004 Analysis ....................................................7
Table 6 – PWL Limits from 2004 and 2001 Analyses ..............................................................7
Table 7 – PWL (3 or 4 sublots per lot) Pay Factors...................................................................9
Table 8 – Small Quantity (1 or 2 sublots per lot) Pay Factors.................................................10
Table 9 – Specification Limits and Pay Factor Summary from 2004 Analysis.......................11
Table 10 – Small Quantity Pay Table from 2004 Analysis .....................................................13
Table 11 – Master Production Range Summary from 2004 Analysis .....................................15
Table 12 – Comparison of Quality Control Data and FDOT Verification Data......................16
iii
ABSTRACT
In July 2002, the Florida Department of Transportation (FDOT) implemented a statistically
based, percent within limits (PWL) specification for the acceptance and payment of hot mix
asphalt. The Specification also addressed small quantities as well as single test pass/fail
criteria. The same year FDOT also adopted a Contractor Quality Control (CQC) system
where acceptance was based on the contractor’s quality control data. The PWL specification
criteria were developed based on data collected from FDOT construction projects built under
the previous Quality Assurance (QA) System, where acceptance and payment were based on
tests conducted by FDOT personnel.
In 2004, FDOT conducted a study to assess the PWL specifications after two years of
use. The study was conducted to compare the variances generated under the old QA system
to variances generated under the new CQC system. Data was collected from 79 recently
completed CQC projects and analyzed. The analysis examined variances of various mixture
characteristics, including roadway density, percent air voids, asphalt binder content, percent
passing the No. 8 (2.36 mm) sieve, and percent passing the No. 200 (0.075 mm) sieve. The
analysis also examined individual mixture characteristic pay factors and composite pay
factors generated under the CQC System.
FDOT concluded that, in general, the variances and pay factor system based on data
from the old QA system reflected typical values identified under the new CQC system. Only
a few of the PWL specification criteria needed slight modifications to better reflect current
variances. Refinements were also made to the small quantity payment system as well as the
pass/fail criteria for single test results.
1
INTRODUCTION
The Florida Department of Transportation, herein referred to as FDOT, decided in 2001 to
modify its current procedure for acceptance and payment of hot mix asphalt. Contractors’
test results would be used for acceptance and a statistically based percent within limits
(PWL) specification would be used to determine payment. An extensive data analysis was
conducted to determine the variability of the asphalt properties used in the payment
determination, and in July 2002, the new system was implemented. FDOT conducted a
second analysis in 2004 to examine the effectiveness of the new system. This paper will
present a brief background of the original analysis conducted in 2001 and will explain in
detail the results of the second analysis and modifications made to FDOT specifications.
SUMMARY OF 2001 ANALYSIS
Data for the following hot mix asphalt properties was analyzed: 1) roadway density, 2)
percent air voids, 3) asphalt binder content, 4) percent passing the No. 8 sieve, and 5) percent
passing the No. 200 sieve. A total of 4377 cores were used in the analysis of roadway
density and 1920 test results were used in the analysis for each of the other four properties.
Data from a wide range of contractors and mixture types was included. Median lot standard
deviations were calculated for each material property. A typical lot is defined as four 1000-
ton sublots and contains one test result per sublot for percent air voids, asphalt binder
content, percent passing the No. 8 sieve, and percent passing the No. 200 sieve. For roadway
density, five cores are obtained per sublot and are averaged to obtain one density value per
sublot.
2
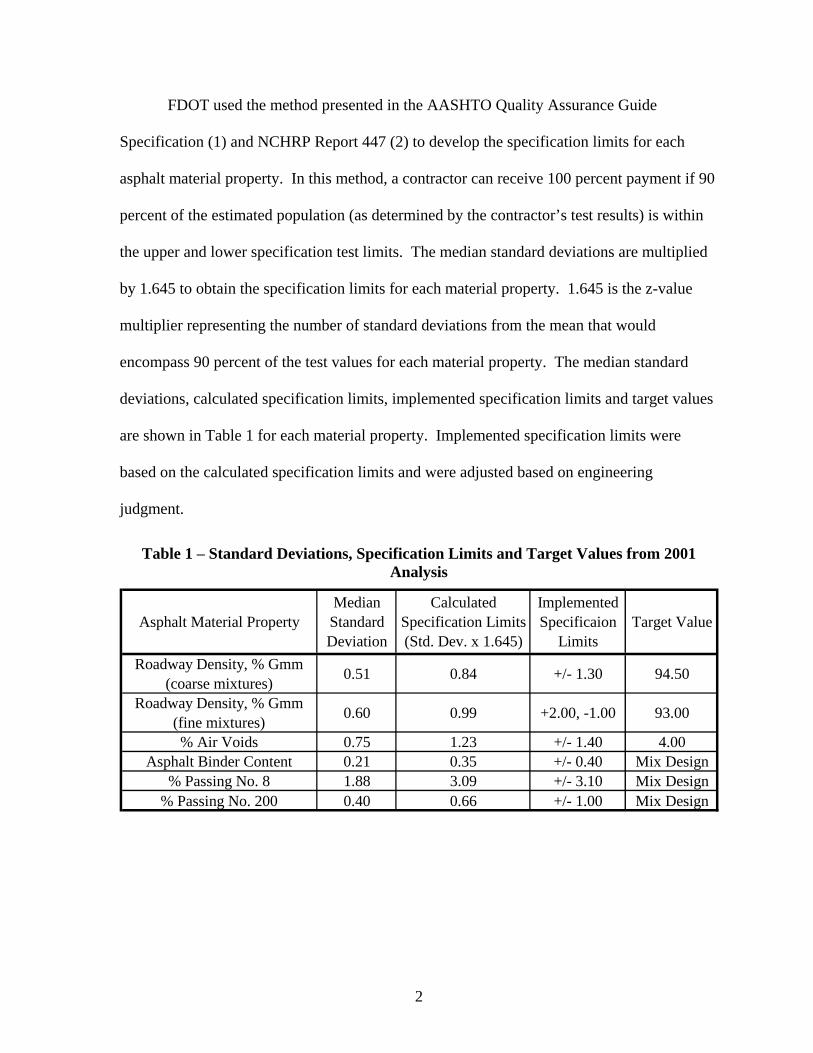
FDOT used the method presented in the AASHTO Quality Assurance Guide
Specification (1) and NCHRP Report 447 (2) to develop the specification limits for each
asphalt material property. In this method, a contractor can receive 100 percent payment if 90
percent of the estimated population (as determined by the contractor’s test results) is within
the upper and lower specification test limits. The median standard deviations are multiplied
by 1.645 to obtain the specification limits for each material property. 1.645 is the z-value
multiplier representing the number of standard deviations from the mean that would
encompass 90 percent of the test values for each material property. The median standard
deviations, calculated specification limits, implemented specification limits and target values
are shown in Table 1 for each material property. Implemented specification limits were
based on the calculated specification limits and were adjusted based on engineering
judgment.
Table 1 – Standard Deviations, Specification Limits and Target Values from 2001 Analysis
Asphalt Material PropertyMedian Standard Deviation
Calculated Specification Limits (Std. Dev. x 1.645)
Implemented Specificaion
LimitsTarget Value
Roadway Density, % Gmm (coarse mixtures) 0.51 0.84 +/- 1.30 94.50
Roadway Density, % Gmm (fine mixtures) 0.60 0.99 +2.00, -1.00 93.00
% Air Voids 0.75 1.23 +/- 1.40 4.00Asphalt Binder Content 0.21 0.35 +/- 0.40 Mix Design
% Passing No. 8 1.88 3.09 +/- 3.10 Mix Design% Passing No. 200 0.40 0.66 +/- 1.00 Mix Design
3
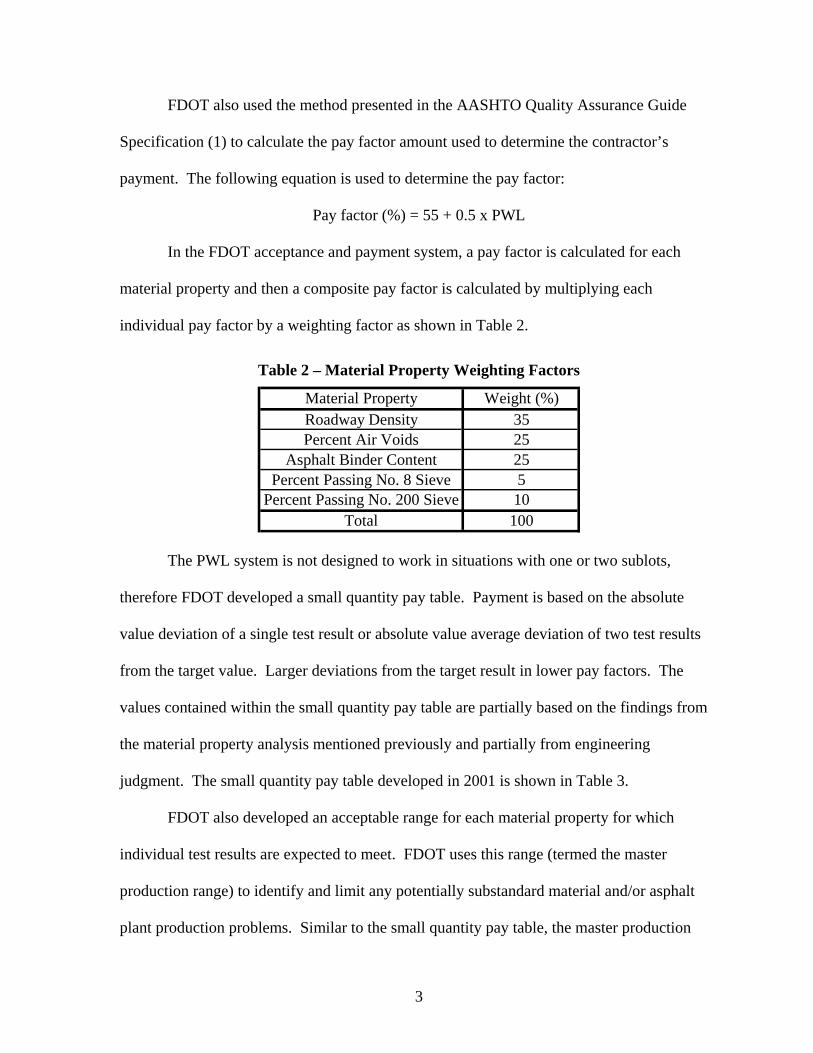
FDOT also used the method presented in the AASHTO Quality Assurance Guide
Specification (1) to calculate the pay factor amount used to determine the contractor’s
payment. The following equation is used to determine the pay factor:
Pay factor (%) = 55 + 0.5 x PWL
In the FDOT acceptance and payment system, a pay factor is calculated for each
material property and then a composite pay factor is calculated by multiplying each
individual pay factor by a weighting factor as shown in Table 2.
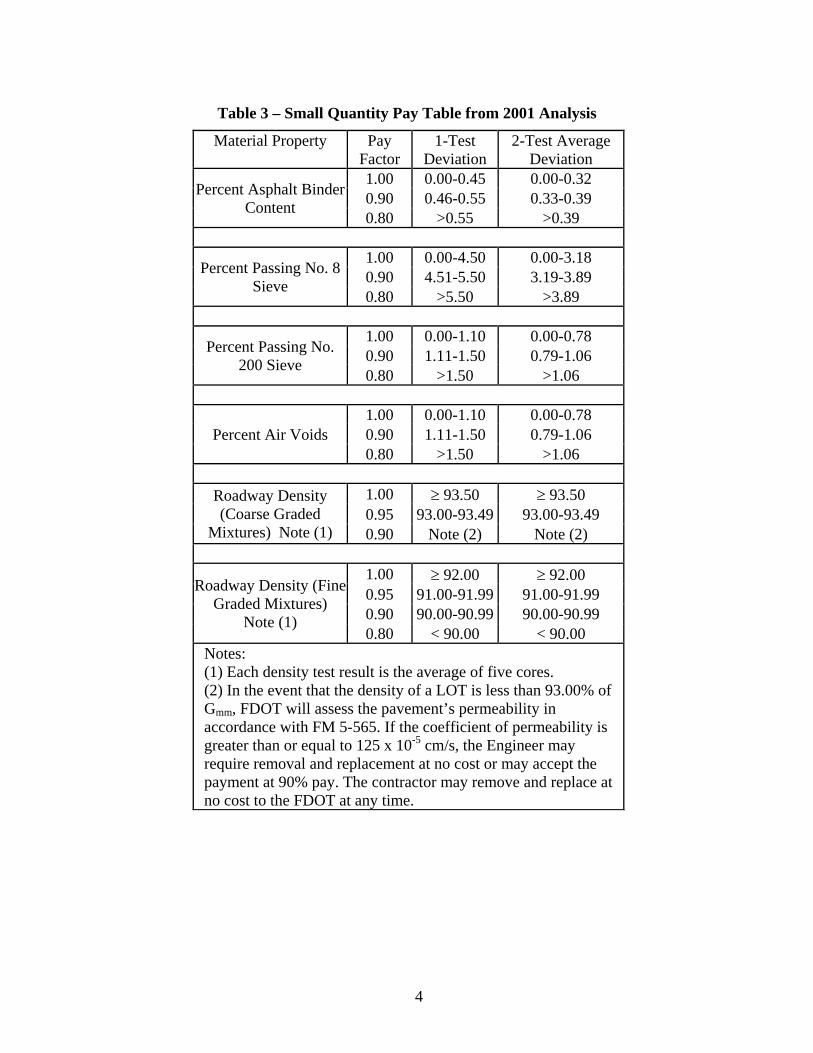
The PWL system is not designed to work in situations with one or two sublots,
therefore FDOT developed a small quantity pay table. Payment is based on the absolute
value deviation of a single test result or absolute value average deviation of two test results
from the target value. Larger deviations from the target result in lower pay factors. The
values contained within the small quantity pay table are partially based on the findings from
the material property analysis mentioned previously and partially from engineering
judgment. The small quantity pay table developed in 2001 is shown in Table 3.
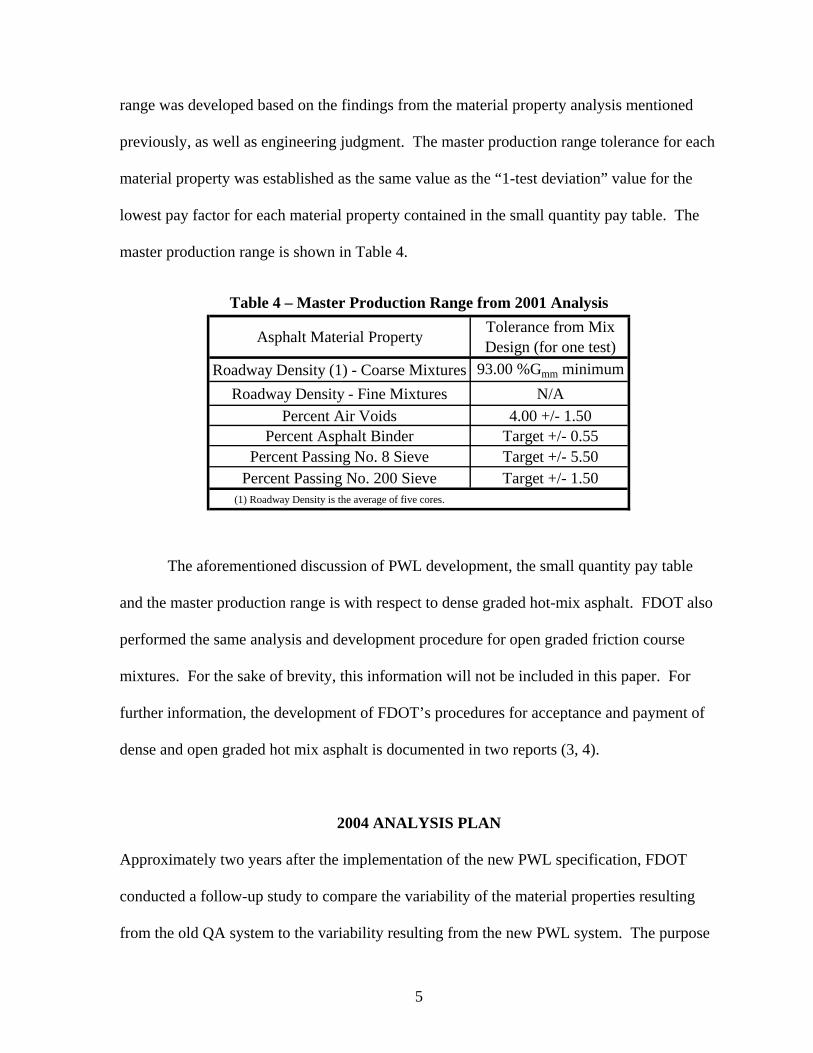
FDOT also developed an acceptable range for each material property for which
individual test results are expected to meet. FDOT uses this range (termed the master
production range) to identify and limit any potentially substandard material and/or asphalt
plant production problems. Similar to the small quantity pay table, the master production
Table 2 – Material Property Weighting Factors
Material Property Weight (%)Roadway Density 35Percent Air Voids 25
Asphalt Binder Content 25Percent Passing No. 8 Sieve 5
Percent Passing No. 200 Sieve 10Total 100
4
Table 3 – Small Quantity Pay Table from 2001 Analysis
Material Property Pay Factor
1-Test Deviation
2-Test Average Deviation
Percent Asphalt Binder Content
1.00 0.00-0.45 0.00-0.32 0.90 0.46-0.55 0.33-0.39 0.80 >0.55 >0.39
Percent Passing No. 8 Sieve
1.00 0.00-4.50 0.00-3.18 0.90 4.51-5.50 3.19-3.89 0.80 >5.50 >3.89
Percent Passing No. 200 Sieve
1.00 0.00-1.10 0.00-0.78 0.90 1.11-1.50 0.79-1.06 0.80 >1.50 >1.06
Percent Air Voids 1.00 0.00-1.10 0.00-0.78 0.90 1.11-1.50 0.79-1.06 0.80 >1.50 >1.06
Roadway Density (Coarse Graded
Mixtures) Note (1)
1.00 ≥ 93.50 ≥ 93.50 0.95 93.00-93.49 93.00-93.49 0.90 Note (2) Note (2)
Roadway Density (Fine Graded Mixtures)
Note (1)
1.00 ≥ 92.00 ≥ 92.00 0.95 91.00-91.99 91.00-91.99 0.90 90.00-90.99 90.00-90.99 0.80 < 90.00 < 90.00
Notes: (1) Each density test result is the average of five cores. (2) In the event that the density of a LOT is less than 93.00% of Gmm, FDOT will assess the pavement’s permeability in accordance with FM 5-565. If the coefficient of permeability is greater than or equal to 125 x 10-5 cm/s, the Engineer may require removal and replacement at no cost or may accept the payment at 90% pay. The contractor may remove and replace at no cost to the FDOT at any time.
5
range was developed based on the findings from the material property analysis mentioned
previously, as well as engineering judgment. The master production range tolerance for each
material property was established as the same value as the “1-test deviation” value for the
lowest pay factor for each material property contained in the small quantity pay table. The
master production range is shown in Table 4.
The aforementioned discussion of PWL development, the small quantity pay table
and the master production range is with respect to dense graded hot-mix asphalt. FDOT also
performed the same analysis and development procedure for open graded friction course
mixtures. For the sake of brevity, this information will not be included in this paper. For
further information, the development of FDOT’s procedures for acceptance and payment of
dense and open graded hot mix asphalt is documented in two reports (3, 4).
2004 ANALYSIS PLAN
Approximately two years after the implementation of the new PWL specification, FDOT
conducted a follow-up study to compare the variability of the material properties resulting
from the old QA system to the variability resulting from the new PWL system. The purpose
Table 4 – Master Production Range from 2001 Analysis
Asphalt Material Property Tolerance from Mix Design (for one test)
Roadway Density (1) - Coarse Mixtures 93.00 %Gmm minimumRoadway Density - Fine Mixtures N/A
Percent Air Voids 4.00 +/- 1.50Percent Asphalt Binder Target +/- 0.55
Percent Passing No. 8 Sieve Target +/- 5.50Percent Passing No. 200 Sieve Target +/- 1.50
(1) Roadway Density is the average of five cores.
6
of the study was to assess the functionality and performance of the new system and make
modifications as necessary.
The analysis plan consisted of compiling and analyzing test result and pay factor data
from projects constructed under the new PWL specification. The data included all mix
design types utilized in Florida, large and small tonnage projects and included data from a
wide range of asphalt contractors. Following the analysis, meetings were held with
representatives of FDOT, Industry and the Federal Highway Administration to discuss the
analysis results and agree upon modifications to the specifications.
2004 VARIABILITY ANALYSIS
Data was collected throughout Florida from 18 contractors and represented 79 projects, 152
mix designs, 480 lots and 1848 sublots. For each project and mix design, the within-lot
variance was determined. Data from different mix designs within the same project was not
intermingled. The variance between lots, commonly known as “target miss”, was also
calculated. The two variance values, within-lot and target miss, were summed to result in the
total lot variance for a particular mix design for a project. This procedure is discussed in
AASHTO document R 9-04 (5) and FHWA publication RD-02-095 (6). This process was
completed for all 152 mix designs. The median variance was then determined and was
converted to a median standard deviation for each material property. The results of the
analysis are shown in Table 5.
7
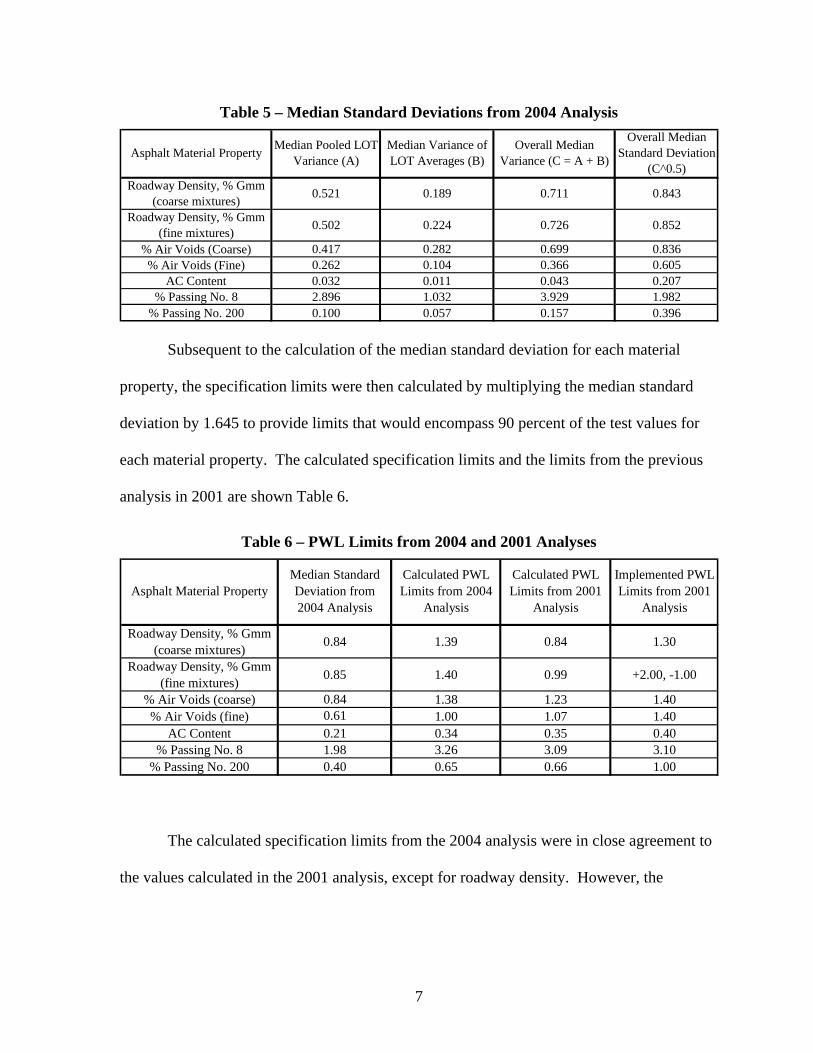
Subsequent to the calculation of the median standard deviation for each material
property, the specification limits were then calculated by multiplying the median standard
deviation by 1.645 to provide limits that would encompass 90 percent of the test values for
each material property. The calculated specification limits and the limits from the previous
analysis in 2001 are shown Table 6.
The calculated specification limits from the 2004 analysis were in close agreement to
the values calculated in the 2001 analysis, except for roadway density. However, the
Table 5 – Median Standard Deviations from 2004 Analysis
% Air Voids (Coarse) 0.417 0.282 0.699 0.836% Air Voids (Fine) 0.262 0.104 0.366 0.605
AC Content 0.032 0.011 0.043 0.207% Passing No. 8 2.896 1.032 3.929 1.982
% Passing No. 200 0.100 0.057 0.157 0.396
0.726
0.843
0.852
Overall Median Variance (C = A + B)
Roadway Density, % Gmm (fine mixtures)
Median Pooled LOT Variance (A)
0.521
0.502
Asphalt Material Property
Roadway Density, % Gmm (coarse mixtures) 0.189
Median Variance of LOT Averages (B)
0.224
Overall Median Standard Deviation
(C^0.5)
0.711
Table 6 – PWL Limits from 2004 and 2001 Analyses
Roadway Density, % Gmm (coarse mixtures) 0.84 1.39 0.84 1.30
Roadway Density, % Gmm (fine mixtures) 0.85 1.40 0.99 +2.00, -1.00
% Air Voids (coarse) 0.84 1.38 1.23 1.40% Air Voids (fine) 0.61 1.00 1.07 1.40
AC Content 0.21 0.34 0.35 0.40% Passing No. 8 1.98 3.26 3.09 3.10
% Passing No. 200 0.40 0.65 0.66 1.00
Calculated PWL Limits from 2001
AnalysisAsphalt Material Property
Median Standard Deviation from 2004 Analysis
Calculated PWL Limits from 2004
Analysis
Implemented PWL Limits from 2001
Analysis
8
roadway density specification limits that were actually implemented as a result of the 2001
analysis were in agreement with the 2004 calculated specification limits.
The reasons for the discrepancy between the calculated density specification limits of
the 2001 and 2004 analyses are not completely certain. In the previous QA system, roadway
density testing was performed by FDOT personnel and roadway lots were defined differently
from plant lots. Density was determined for one roadway core per sublot (1000 linear feet)
and a lot was defined as five sublots (5000 linear feet). Furthermore, the target density value
was based on a minimum value with no maximum density value specified. The variances
calculated with this QA data were then mathematically manipulated to obtain variance values
that would apply to the new sublot and lot definitions under the new PWL system.
Both analyses showed that air voids measured in gyratory compacted specimens at
the asphalt plant were less variable for fine graded mixtures than coarse graded mixtures.
Variability of roadway density was equal for fine graded and coarse graded mixtures in the
2004 analysis.
2004 PAY FACTOR ANALYSIS
Pay factor data was collected throughout Florida from 22 contractors and represented
143 projects, 237 mix designs, 778 lots and 2,480 sublots. The data was categorized by lot
size, i.e. three or more sublots representing payment with the PWL system and two or less
sublots representing payment with the small quantity pay table. Data was further categorized
by gradation type, coarse or fine, determined by the primary control sieve point.
9
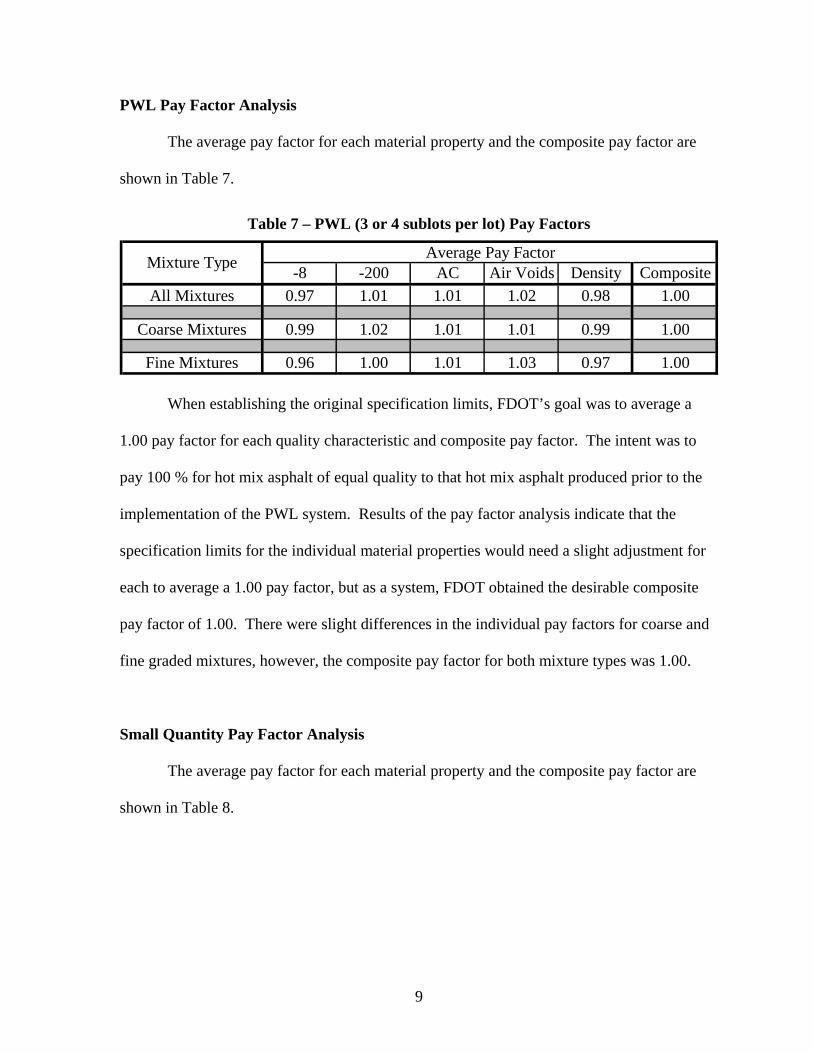
PWL Pay Factor Analysis
The average pay factor for each material property and the composite pay factor are
shown in Table 7.
When establishing the original specification limits, FDOT’s goal was to average a
1.00 pay factor for each quality characteristic and composite pay factor. The intent was to
pay 100 % for hot mix asphalt of equal quality to that hot mix asphalt produced prior to the
implementation of the PWL system. Results of the pay factor analysis indicate that the
specification limits for the individual material properties would need a slight adjustment for
each to average a 1.00 pay factor, but as a system, FDOT obtained the desirable composite
pay factor of 1.00. There were slight differences in the individual pay factors for coarse and
fine graded mixtures, however, the composite pay factor for both mixture types was 1.00.
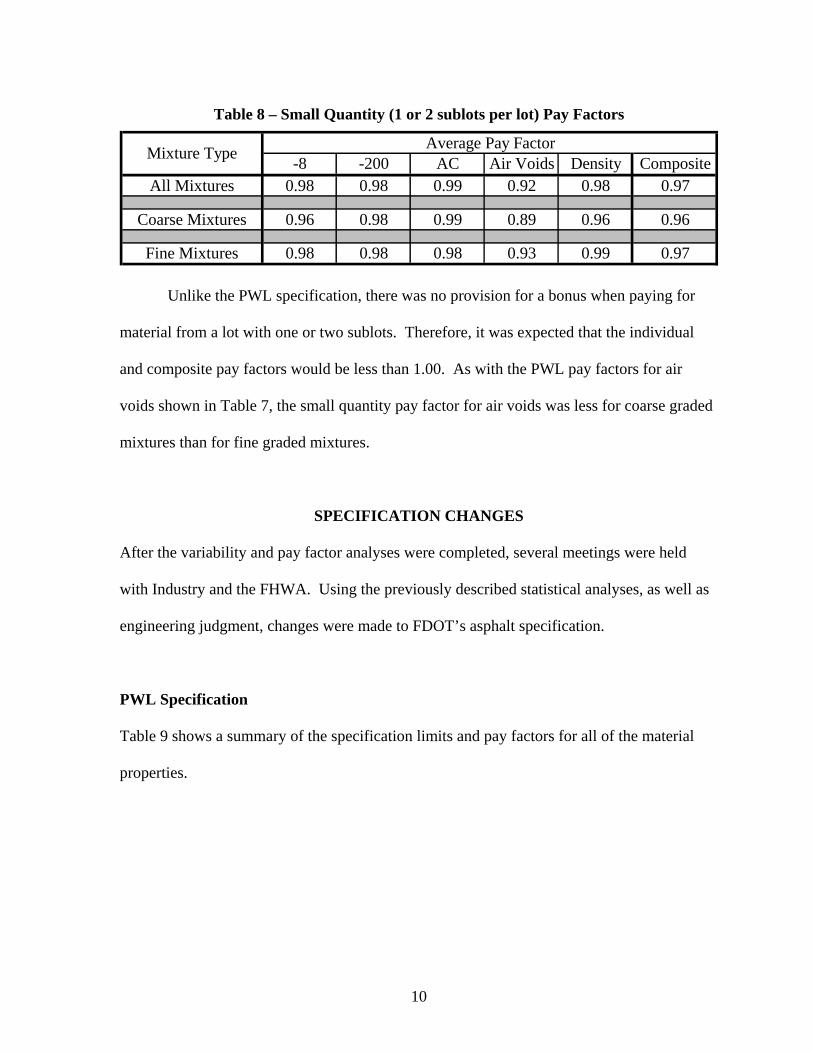
Small Quantity Pay Factor Analysis
The average pay factor for each material property and the composite pay factor are
shown in Table 8.
Table 7 – PWL (3 or 4 sublots per lot) Pay Factors
Average Pay Factor-8 -200 AC Air Voids Density Composite
All Mixtures 0.97 1.01 1.01 1.02 0.98 1.00
Coarse Mixtures 0.99 1.02 1.01 1.01 0.99 1.00
Fine Mixtures 0.96 1.00 1.01 1.03 0.97 1.00
Mixture Type
10
Unlike the PWL specification, there was no provision for a bonus when paying for
material from a lot with one or two sublots. Therefore, it was expected that the individual
and composite pay factors would be less than 1.00. As with the PWL pay factors for air
voids shown in Table 7, the small quantity pay factor for air voids was less for coarse graded
mixtures than for fine graded mixtures.
SPECIFICATION CHANGES
After the variability and pay factor analyses were completed, several meetings were held
with Industry and the FHWA. Using the previously described statistical analyses, as well as
engineering judgment, changes were made to FDOT’s asphalt specification.
PWL Specification
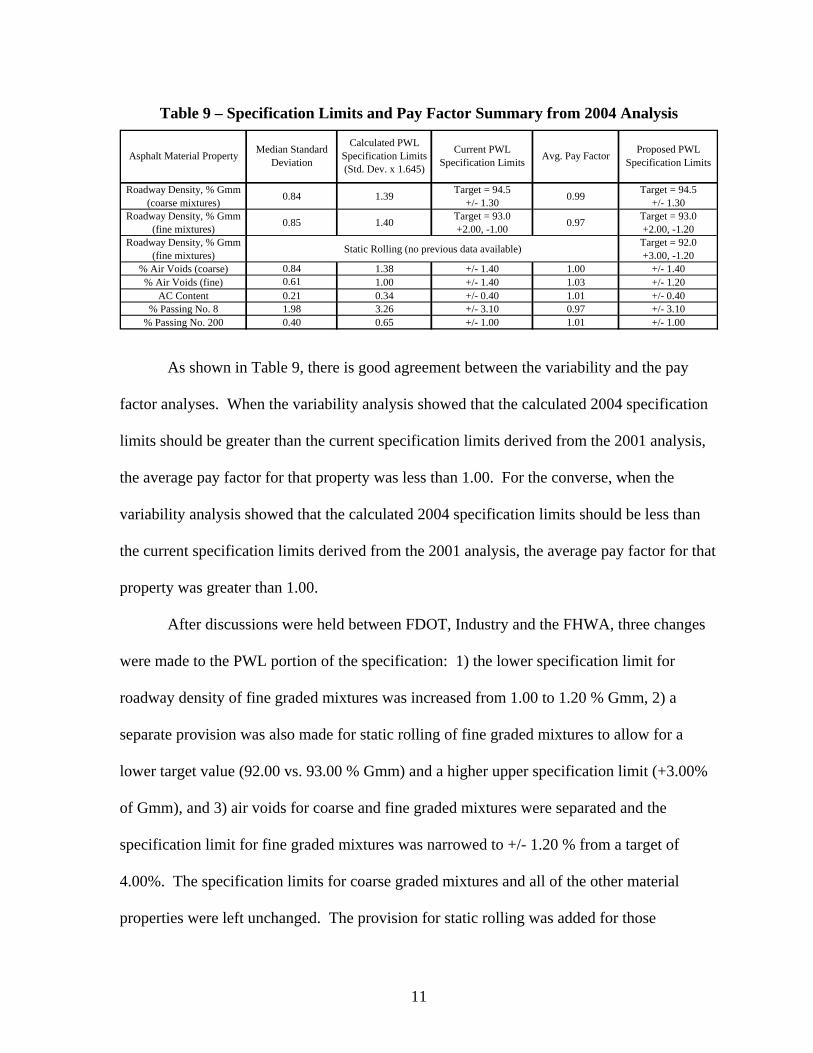
Table 9 shows a summary of the specification limits and pay factors for all of the material
properties.
Table 8 – Small Quantity (1 or 2 sublots per lot) Pay Factors
Average Pay Factor-8 -200 AC Air Voids Density Composite
All Mixtures 0.98 0.98 0.99 0.92 0.98 0.97
Coarse Mixtures 0.96 0.98 0.99 0.89 0.96 0.96
Fine Mixtures 0.98 0.98 0.98 0.93 0.99 0.97
Mixture Type
11
As shown in Table 9, there is good agreement between the variability and the pay
factor analyses. When the variability analysis showed that the calculated 2004 specification
limits should be greater than the current specification limits derived from the 2001 analysis,
the average pay factor for that property was less than 1.00. For the converse, when the
variability analysis showed that the calculated 2004 specification limits should be less than
the current specification limits derived from the 2001 analysis, the average pay factor for that
property was greater than 1.00.
After discussions were held between FDOT, Industry and the FHWA, three changes
were made to the PWL portion of the specification: 1) the lower specification limit for
roadway density of fine graded mixtures was increased from 1.00 to 1.20 % Gmm, 2) a
separate provision was also made for static rolling of fine graded mixtures to allow for a
lower target value (92.00 vs. 93.00 % Gmm) and a higher upper specification limit (+3.00%
of Gmm), and 3) air voids for coarse and fine graded mixtures were separated and the
specification limit for fine graded mixtures was narrowed to +/- 1.20 % from a target of
4.00%. The specification limits for coarse graded mixtures and all of the other material
properties were left unchanged. The provision for static rolling was added for those
Table 9 – Specification Limits and Pay Factor Summary from 2004 Analysis
Roadway Density, % Gmm (coarse mixtures) 0.84 1.39 Target = 94.5
+/- 1.30 0.99 Target = 94.5 +/- 1.30
Roadway Density, % Gmm (fine mixtures) 0.85 1.40 Target = 93.0
+2.00, -1.00 0.97 Target = 93.0 +2.00, -1.20
Roadway Density, % Gmm (fine mixtures) Static Rolling (no previous data available) Target = 92.0
+3.00, -1.20% Air Voids (coarse) 0.84 1.38 +/- 1.40 1.00 +/- 1.40% Air Voids (fine) 0.61 1.00 +/- 1.40 1.03 +/- 1.20
AC Content 0.21 0.34 +/- 0.40 1.01 +/- 0.40% Passing No. 8 1.98 3.26 +/- 3.10 0.97 +/- 3.10
% Passing No. 200 0.40 0.65 +/- 1.00 1.01 +/- 1.00
Asphalt Material Property Median Standard Deviation
Calculated PWL Specification Limits (Std. Dev. x 1.645)
Avg. Pay Factor Proposed PWL Specification Limits
Current PWL Specification Limits
12
construction projects that contained vibration sensitive areas (underlying utilities, historic
buildings, medical offices, etc.). The target density level was lowered by 1.00 % to account
for the more difficult nature in obtaining density using static rolling as compared to vibratory
rolling.
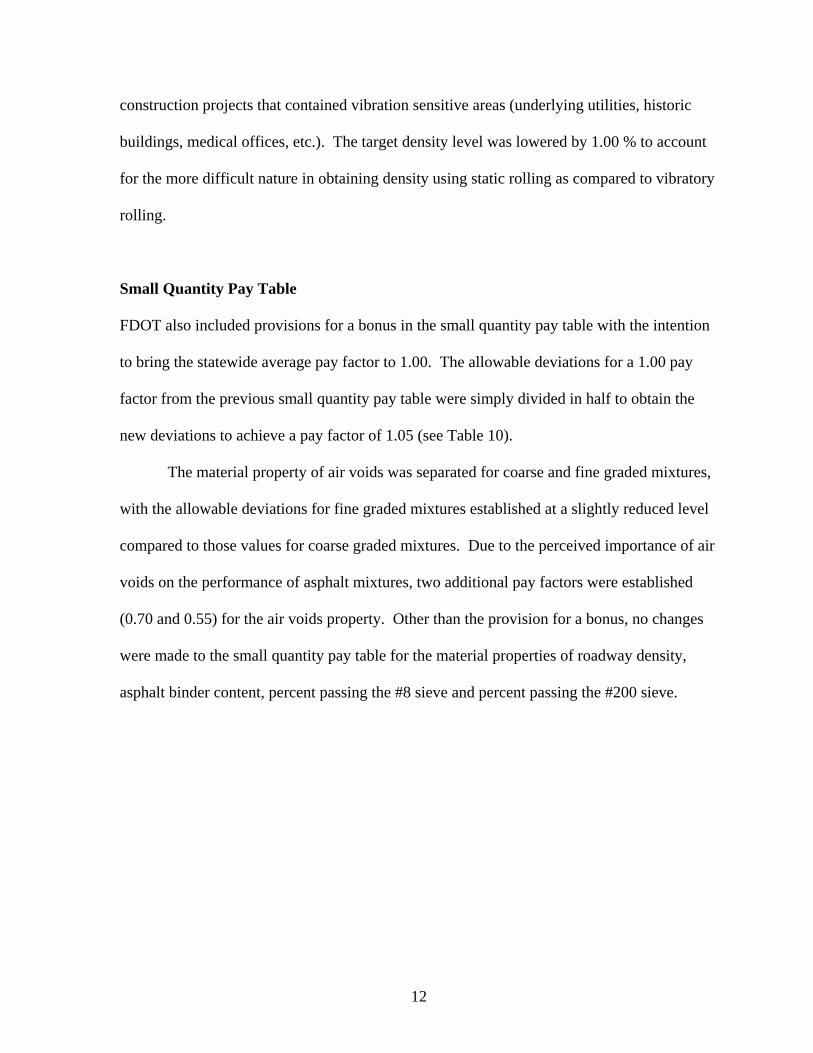
Small Quantity Pay Table
FDOT also included provisions for a bonus in the small quantity pay table with the intention
to bring the statewide average pay factor to 1.00. The allowable deviations for a 1.00 pay
factor from the previous small quantity pay table were simply divided in half to obtain the
new deviations to achieve a pay factor of 1.05 (see Table 10).
The material property of air voids was separated for coarse and fine graded mixtures,
with the allowable deviations for fine graded mixtures established at a slightly reduced level
compared to those values for coarse graded mixtures. Due to the perceived importance of air
voids on the performance of asphalt mixtures, two additional pay factors were established
(0.70 and 0.55) for the air voids property. Other than the provision for a bonus, no changes
were made to the small quantity pay table for the material properties of roadway density,
asphalt binder content, percent passing the #8 sieve and percent passing the #200 sieve.
13
Table 10 – Small Quantity Pay Table from 2004 Analysis Pay Factor 1-Test Deviation 2-Test Average Deviation
Asphalt Binder Content1.05 0.00 - 0.23 0.00 - 0.161.00 0.24 - 0.45 0.17 - 0.320.90 0.46 - 0.55 0.33 - 0.390.80 > 0.55 > 0.39
No. 8 [2.36 mm] Sieve1.05 0.00 - 2.25 0.00 - 1.591.00 2.26 - 4.50 1.60 - 3.180.90 4.51 - 5.50 3.19 - 3.890.80 > 5.50 > 3.89
No. 200 [75 µm] Sieve1.05 0.00 - 0.55 0.00 - 0.391.00 0.56 - 1.10 0.40 - 0.780.90 1.11 - 1.50 0.79 - 1.060.80 > 1.50 > 1.06
Air Voids (coarse)1.05 0.00 - 0.55 0.00 - 0.391.00 0.56 - 1.10 0.40 - 0.780.90 1.11 - 2.00 0.79 - 1.410.80 2.01 - 2.25 1.42 - 1.590.70 2.26 - 2.50 1.60 - 1.770.55 > 2.50 > 1.77
Air Voids (fine)1.05 0.00 - 0.50 0.00 - 0.351.00 0.51 - 1.00 0.36 - 0.710.90 1.01 - 1.70 0.72 - 1.200.80 1.71 - 2.00 1.21 - 1.410.70 2.01 - 2.50 1.42 - 1.770.55 > 2.50 > 1.77
Density (Coarse Graded Mixtures) Note (1)1.05 0.00 - 0.50 0.00 - 0.351.00 0.51 - 1.00 0.36 - 0.710.95 1.01 - 1.50 0.72 - 1.060.90 > 1.50 > 1.06
Density (Fine Graded Mixtures) Note (1)1.05 0.00 - 0.50 0.00 - 0.351.00 0.51 - 1.00 0.36 - 0.710.95 1.01 - 2.00 0.72 - 1.410.90 2.01 - 3.00 1.42 - 2.120.80 > 3.00 > 2.12
Notes:(1) Each density test result is the average of five cores. The target density for coarse graded mixtures is 94.5 percent of Gmm. The target density for fine graded mixtures is 93.00 percent of Gmm (92.00 percent when compaction is limited to static mode).
14
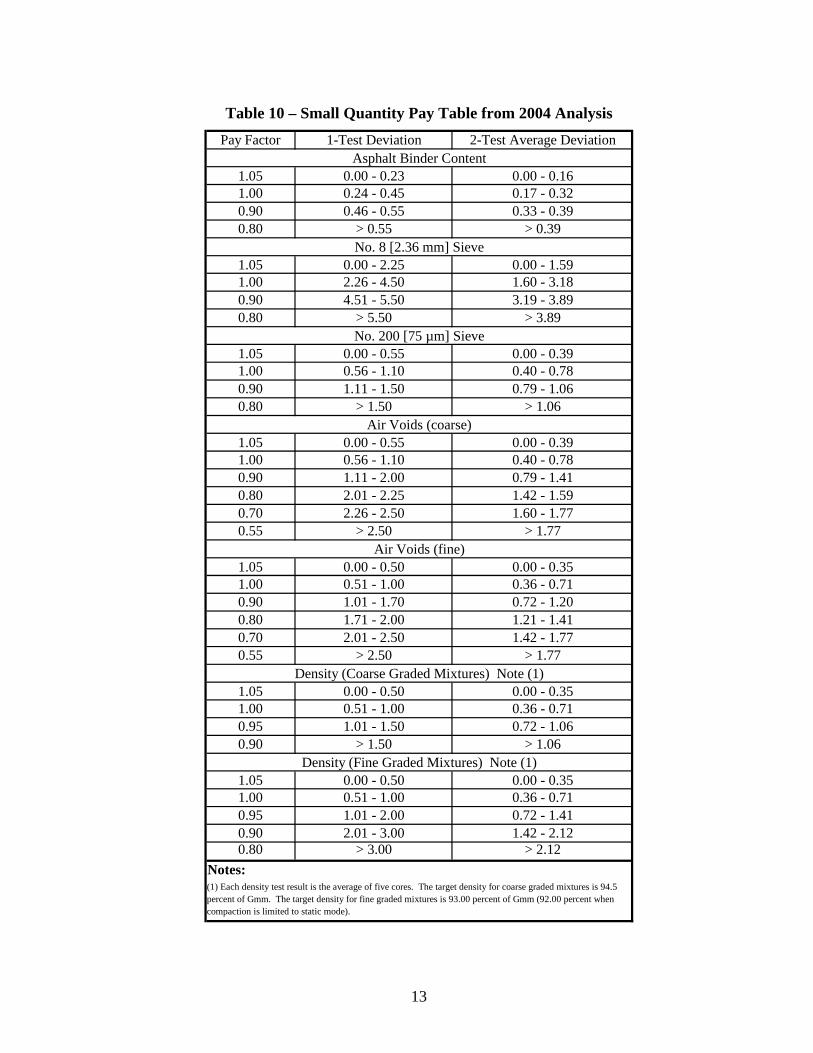
Master Production Range
The median standard deviations for each material property were multiplied by three to obtain
ranges that would theoretically encompass over 99 percent of the population. These values
were used as a guide to evaluate the master production range limits. Table 11 shows the
previous master production range values, 3x standard deviation values and the master
production range values agreed upon during committee meetings.
Changes were made to the limits for air voids due to the observed variability and the
excessively high rate of master production range failures that occurred while using the values
implemented after the 2001 analysis. Additionally, a minimum roadway density level was
added for fine graded mixtures. No other changes were made to the master production range.
Table 11 – Master Production Range Summary from 2004 Analysis
Roadway Density, % Gmm (coarse mixtures) 93.00 minimum 2.53 93.00 minimum
Roadway Density, % Gmm (fine mixtures) n/a 2.56 90.00 minimum
% Air Voids (coarse) +/- 1.50 2.51 +/- 2.00% Air Voids (fine) +/- 1.50 1.82 +2.00, -1.70
Asphalt Binder Content +/- 0.55 0.62 +/- 0.55% Passing No. 8 +/- 5.50 5.95 +/- 5.50
% Passing No. 200 +/- 1.50 1.19 +/- 1.50
MPR from 2004 Analysis
MPR from 2001 AnalysisAsphalt Material Property Median Standard
Deviation x 3
15
CONTRACTOR QUALITY CONTROL DATA COMPARED TO FDOT
VERIFICATION DATA
The system implemented in 2002 was a major departure from the previous system the FDOT
was using with respect to the test data used to determine payment. Under the previous
system, material acceptance was based on FDOT test results. Under the new system,
material acceptance is based on contractor quality control test results, provided that the test
results are verified by FDOT tests. FDOT personnel perform verification testing on a
random basis at a frequency of one test per lot, with a typical lot consisting of four sublots.
Quality control and FDOT test results are compared and evaluated using accepted precision
values.
Quality control and FDOT verification test results should be equivalent over a wide
range of projects if the system is working correctly, there is no bias in equipment or testing
and no data misrepresentation is occurring. Furthermore, the average difference and standard
deviation of the differences can be calculated to develop 95% confidence intervals for future
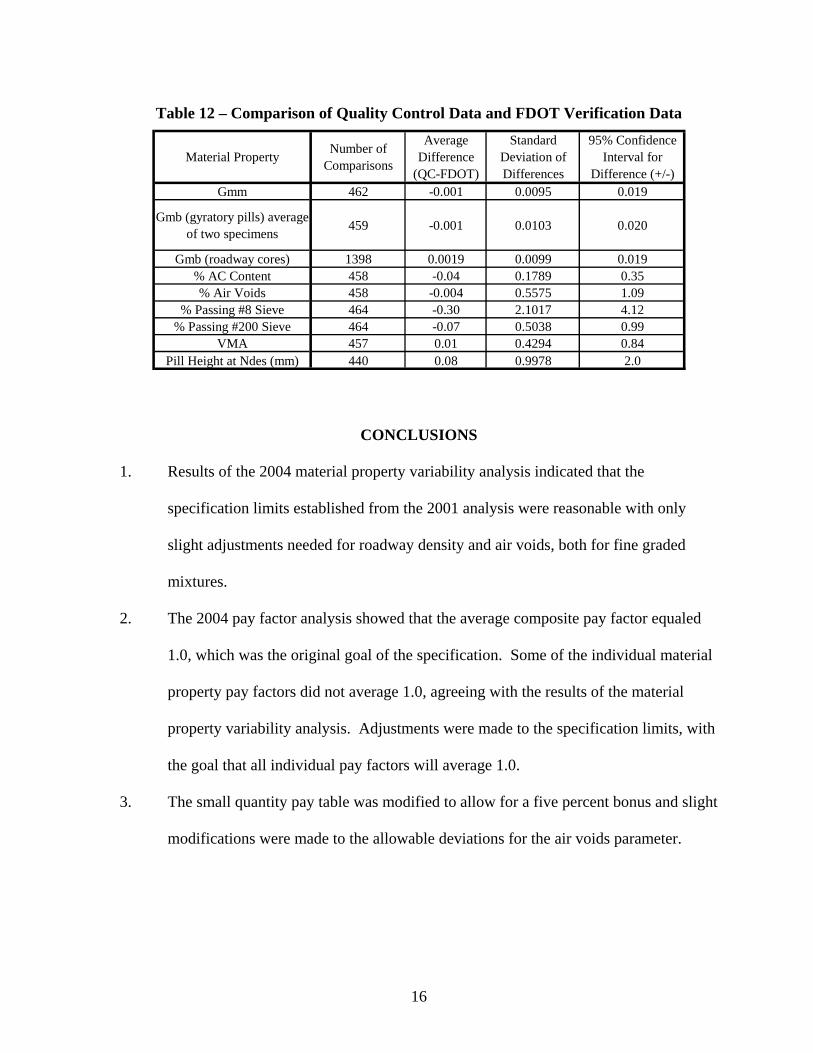
test result comparisons between quality control and FDOT test data. Table 12 shows the
results of the aforementioned analysis. The average difference is essentially equal to zero for
all of the properties.
16
CONCLUSIONS
1. Results of the 2004 material property variability analysis indicated that the
specification limits established from the 2001 analysis were reasonable with only
slight adjustments needed for roadway density and air voids, both for fine graded
mixtures.
2. The 2004 pay factor analysis showed that the average composite pay factor equaled
1.0, which was the original goal of the specification. Some of the individual material
property pay factors did not average 1.0, agreeing with the results of the material
property variability analysis. Adjustments were made to the specification limits, with
the goal that all individual pay factors will average 1.0.
3. The small quantity pay table was modified to allow for a five percent bonus and slight
modifications were made to the allowable deviations for the air voids parameter.
Table 12 – Comparison of Quality Control Data and FDOT Verification Data
Material Property Number of Comparisons
Average Difference
(QC-FDOT)
Standard Deviation of Differences
95% Confidence Interval for
Difference (+/-)Gmm 462 -0.001 0.0095 0.019
Gmb (gyratory pills) average of two specimens 459 -0.001 0.0103 0.020
Gmb (roadway cores) 1398 0.0019 0.0099 0.019% AC Content 458 -0.04 0.1789 0.35% Air Voids 458 -0.004 0.5575 1.09
% Passing #8 Sieve 464 -0.30 2.1017 4.12% Passing #200 Sieve 464 -0.07 0.5038 0.99
VMA 457 0.01 0.4294 0.84Pill Height at Ndes (mm) 440 0.08 0.9978 2.0
17
4. The air voids parameter limits were increased for the master production range to
reduce the large number of failures that occurred while using the limits from the
previous specification.
5. A comparison of contractor quality control and FDOT verification data showed
excellent agreement between test values.
RECOMMENDATIONS
1. The FDOT should continue to periodically examine the material property variability
and pay factor distribution and make modifications to the specification as necessary.
2. Analysis and assessment of the FDOT’s and contractor’s risk is needed.
18
REFERENCES
1. “Quality Assurance Guide Specification.” American Association of State Highway
and Transportation Officials, Washington, D.C., February 1996.
2. J. S. Russell, A. S. Hanna, E. V. Nordheim. “Testing and Inspection Levels for Hot-
Mix Asphaltic Concrete Overlays.” National Cooperative Highway Research
Program Report 447, Transportation Research Board, National Research Council,
Washington, D.C., 2001.
3. G. A. Sholar, G. C. Page, J. A. Musselman, P. B. Upshaw, H. L. Moseley.
“Development of the Florida Department of Transportation’s Percent Within Limits
Hot-Mix Asphalt Specification.” Transportation Research Record 1907,
Transportation Research Board, National Research Council, 2005, pp. 43-51.
4. G. A. Sholar, G. C. Page, J. A. Musselman, P. B. Upshaw, H. L. Moseley.
“Development of the Florida Department of Transportation’s Percent Within Limits
Hot-Mix Asphalt Specification.” Research Report FL/DOT/SMO/03-467, Florida
Department of Transportation, Gainesville, FL., October 2003.
5. “Standard Recommended Practice for Acceptance Sampling Plans for Highway
Construction.” American Association of State Highway and Transportation Officials,
R 9-04, Washington, D.C., 2004.
6. J. L. Burati, R. M. Weed, C. S. Hughes, H. S. Hill. “Optimal Procedures for Quality
Assurance Specifications.” Federal Highway Administration Report FHWA-RD-02-
095, McLean, VA, April 2003