STARLight PDR 3 Oct ‘01H.1 Miller STARLight Sensor Signal Processing Ryan Miller STARLight...
30
STARLight PDR 3 Oct ‘01 H.1 Miller STARLight STARLight Sensor Signal Processing Ryan Miller STARLight Electrical Engineer (734) 763-5373 [email protected]
-
date post
21-Dec-2015 -
Category
Documents
-
view
223 -
download
1
Transcript of STARLight PDR 3 Oct ‘01H.1 Miller STARLight Sensor Signal Processing Ryan Miller STARLight...
STARLight PDR 3 Oct ‘01 H.1 Miller
STARLightSTARLight
Sensor Signal Processing
Ryan Miller
STARLight Electrical Engineer
(734) 763-5373
STARLight PDR 3 Oct ‘01 H.2 Miller
STARLightSTARLightOverview
• Sensor Requirements
• Signal Processing Chain Overview
• Sampling
• Digital Signal Processing
• Data Formatting and Rates
• Hardware Overview
• Power Summary
STARLight PDR 3 Oct ‘01 H.3 Miller
STARLightSTARLightSensor Requirements
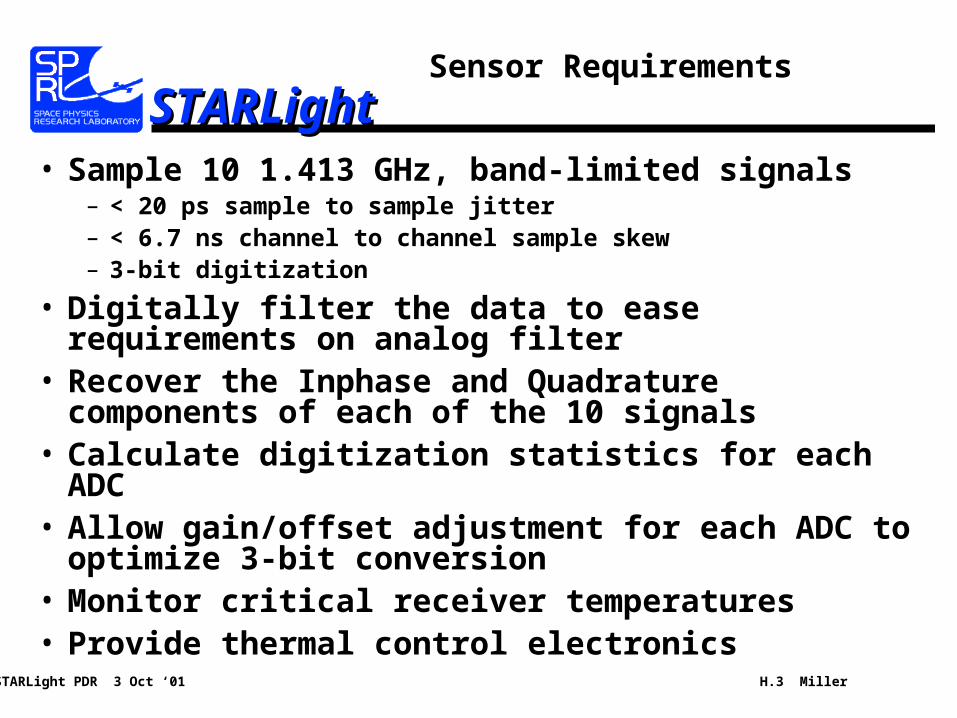
• Sample 10 1.413 GHz, band-limited signals– < 20 ps sample to sample jitter– < 6.7 ns channel to channel sample skew– 3-bit digitization
• Digitally filter the data to ease requirements on analog filter
• Recover the Inphase and Quadrature components of each of the 10 signals
• Calculate digitization statistics for each ADC• Allow gain/offset adjustment for each ADC to optimize
3-bit conversion• Monitor critical receiver temperatures• Provide thermal control electronics

STARLight PDR 3 Oct ‘01 H.4 Miller
STARLightSTARLightSystem Block Diagram
DIGITALCORRELATOR
CONTROLCOMPUTER
PENTIUMPC
POWERCONDITIONING
ANDSUPPLIES
+12 VDC @ 400 W
AIRCRAFTAVIONICS1. GPS2. ALTIM3. GYRO4. HEADING
DATASTORAGE
(REMOVABLE)
SENSOR MODULE CONTROL MODULE
REMOTE ON/OFF
SCENE
IR PROFILER
AIRCRAFTPOWER
I/OINTERFACES
PILOTCONTROL
BOX
SYSTEM GO/NO GO
GSE
WARM& COLD
CALSOURCES
IR SCENE
ANTENNAARRAY
LIQUIDHEAT
EXCHANGER
10 DIRECTSAMPLING
DIGITALRECEIVERS
10 THERMALCONTROL PLATES
COLD PLATE
STARLight PDR 3 Oct ‘01 H.5 Miller
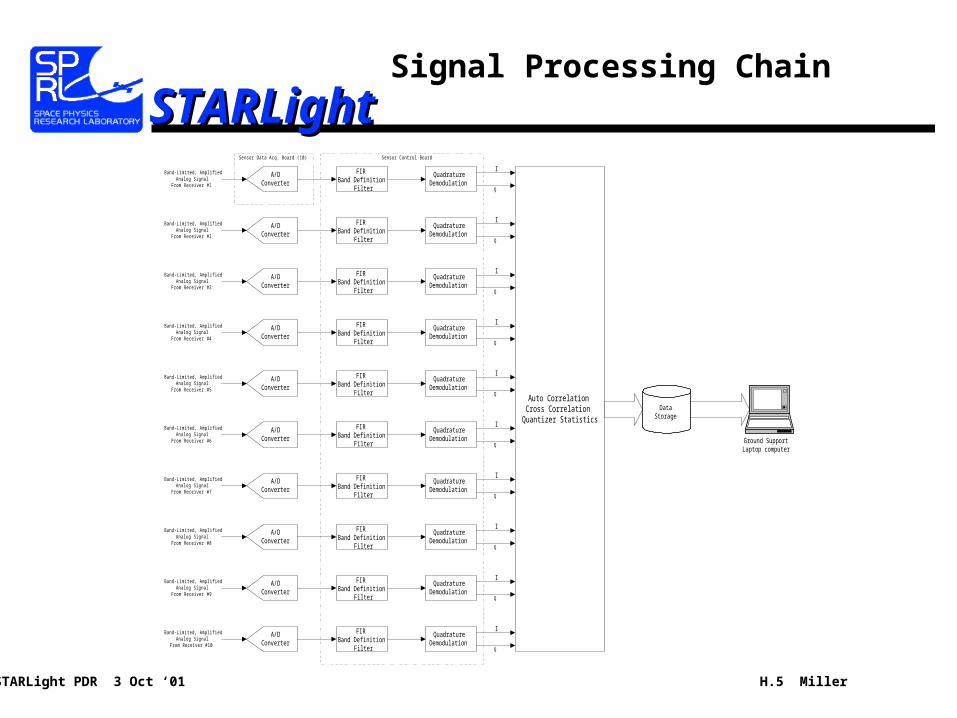
STARLightSTARLightSignal Processing Chain
A/DConverter
Band-Limited, AmplifiedAnalog Signal
From Receiver #1
A/DConverter
Band-Limited, AmplifiedAnalog Signal
From Receiver #2
A/DConverter
Band-Limited, AmplifiedAnalog Signal
From Receiver #3
A/DConverter
Band-Limited, AmplifiedAnalog Signal
From Receiver #4
A/DConverter
Band-Limited, AmplifiedAnalog Signal
From Receiver #5
A/DConverter
Band-Limited, AmplifiedAnalog Signal
From Receiver #6
A/DConverter
Band-Limited, AmplifiedAnalog Signal
From Receiver #7
A/DConverter
Band-Limited, AmplifiedAnalog Signal
From Receiver #8
A/DConverter
Band-Limited, AmplifiedAnalog Signal
From Receiver #9
A/DConverter
Band-Limited, AmplifiedAnalog Signal
From Receiver #10
FIRBand Definition
Filter
QuadratureDemodulation
I
Q
FIRBand Definition
Filter
QuadratureDemodulation
I
Q
FIRBand Definition
Filter
QuadratureDemodulation
I
Q
FIRBand Definition
Filter
QuadratureDemodulation
I
Q
FIRBand Definition
Filter
QuadratureDemodulation
I
Q
FIRBand Definition
Filter
QuadratureDemodulation
I
Q
FIRBand Definition
Filter
QuadratureDemodulation
I
Q
FIRBand Definition
Filter
QuadratureDemodulation
I
Q
FIRBand Definition
Filter
QuadratureDemodulation
I
Q
FIRBand Definition
Filter
QuadratureDemodulation
I
Q
Auto CorrelationCross Correlation
Quantizer Statistics
Ground SupportLaptop computer
DataStorage
Sensor Control BoardSensor Data Acq. Board (10)
STARLight PDR 3 Oct ‘01 H.6 Miller
STARLightSTARLightSampling
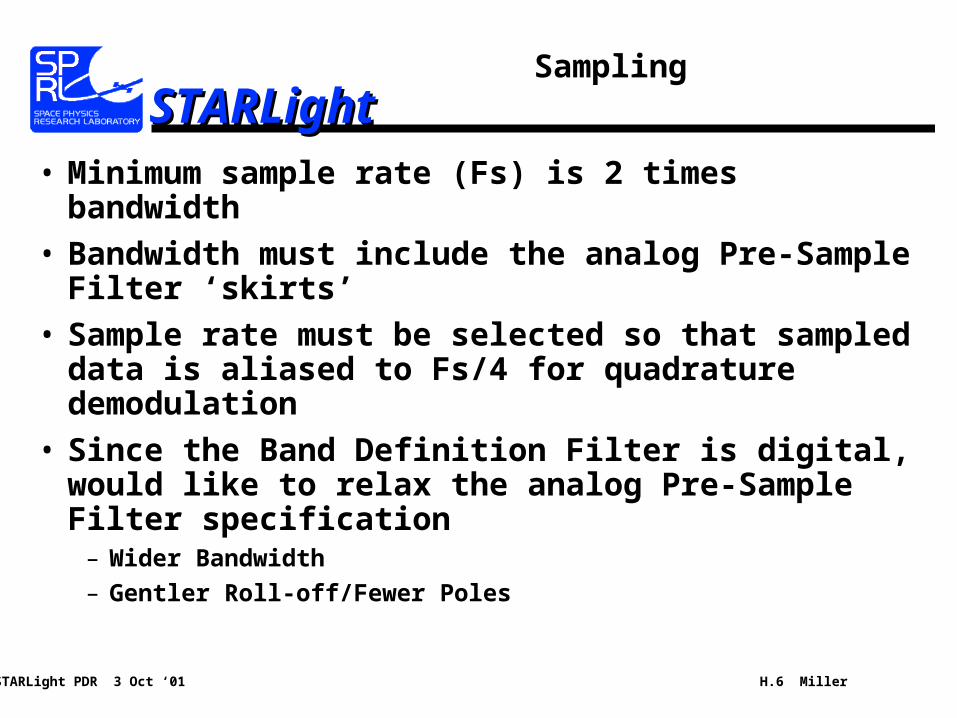
• Minimum sample rate (Fs) is 2 times bandwidth
• Bandwidth must include the analog Pre-Sample Filter ‘skirts’
• Sample rate must be selected so that sampled data is aliased to Fs/4 for quadrature demodulation
• Since the Band Definition Filter is digital, would like to relax the analog Pre-Sample Filter specification
– Wider Bandwidth
– Gentler Roll-off/Fewer Poles
STARLight PDR 3 Oct ‘01 H.7 Miller
STARLightSTARLightSample Rate Calculations
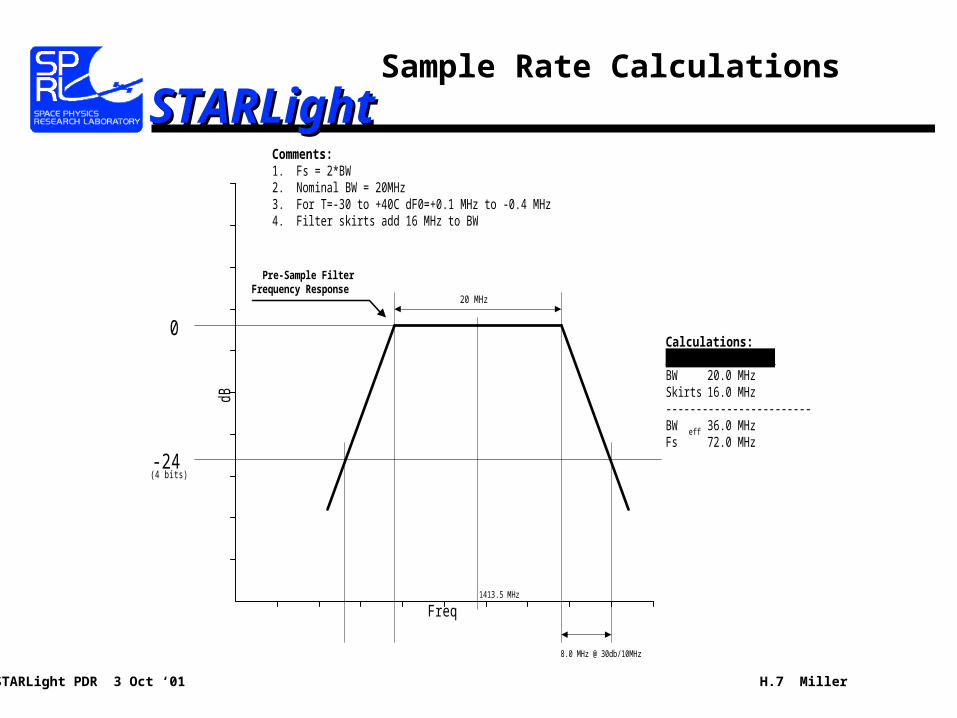
Pre-Sample FilterFrequency Response
Calculations:4-bits,30dB/decadeBW 20.0 MHzSkirts 16.0 MHz------------------------BW eff 36.0 MHzFs 72.0 MHz
dB
Freq
0
-24(4 bits)
8.0 MHz @ 30db/10MHz
Comments:1. Fs = 2*BW2. Nominal BW = 20MHz3. For T=-30 to +40C dF0=+0.1 MHz to -0.4 MHz4. Filter skirts add 16 MHz to BW
20 MHz
1413.5 MHz
STARLight PDR 3 Oct ‘01 H.8 Miller
STARLightSTARLightPossible Sample Rates
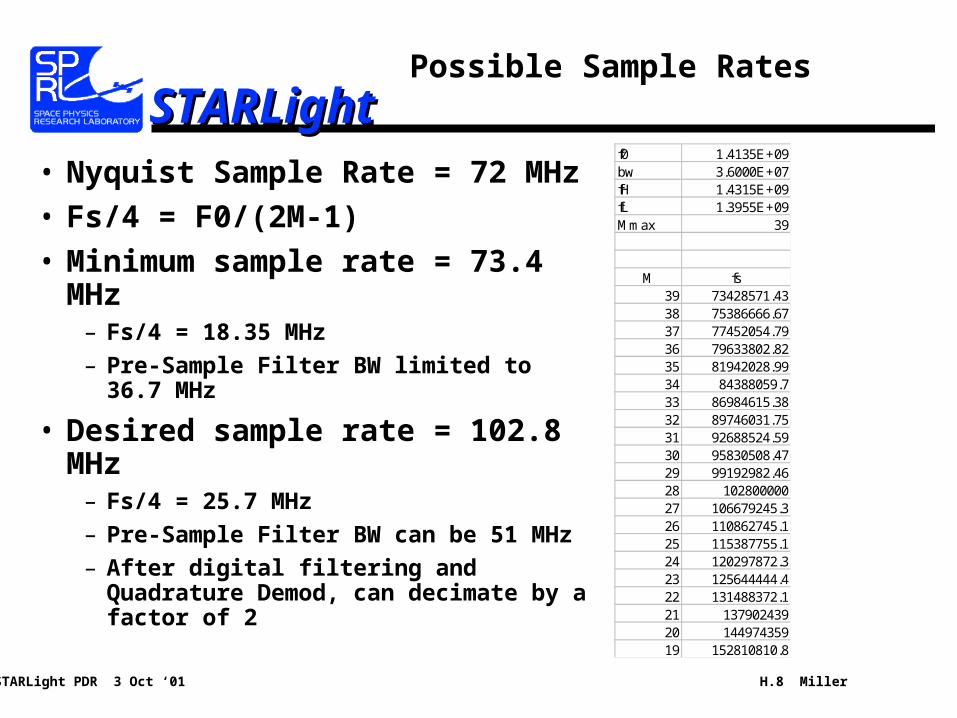
f0 1.4135E+09bw 3.6000E+07fH 1.4315E+09fL 1.3955E+09Mmax 39
M fs39 73428571.4338 75386666.6737 77452054.7936 79633802.8235 81942028.9934 84388059.733 86984615.3832 89746031.7531 92688524.5930 95830508.4729 99192982.4628 10280000027 106679245.326 110862745.125 115387755.124 120297872.323 125644444.422 131488372.121 13790243920 14497435919 152810810.8
• Nyquist Sample Rate = 72 MHz
• Fs/4 = F0/(2M-1)
• Minimum sample rate = 73.4 MHz– Fs/4 = 18.35 MHz
– Pre-Sample Filter BW limited to 36.7 MHz
• Desired sample rate = 102.8 MHz– Fs/4 = 25.7 MHz
– Pre-Sample Filter BW can be 51 MHz
– After digital filtering and Quadrature Demod, can decimate by a factor of 2
STARLight PDR 3 Oct ‘01 H.9 Miller
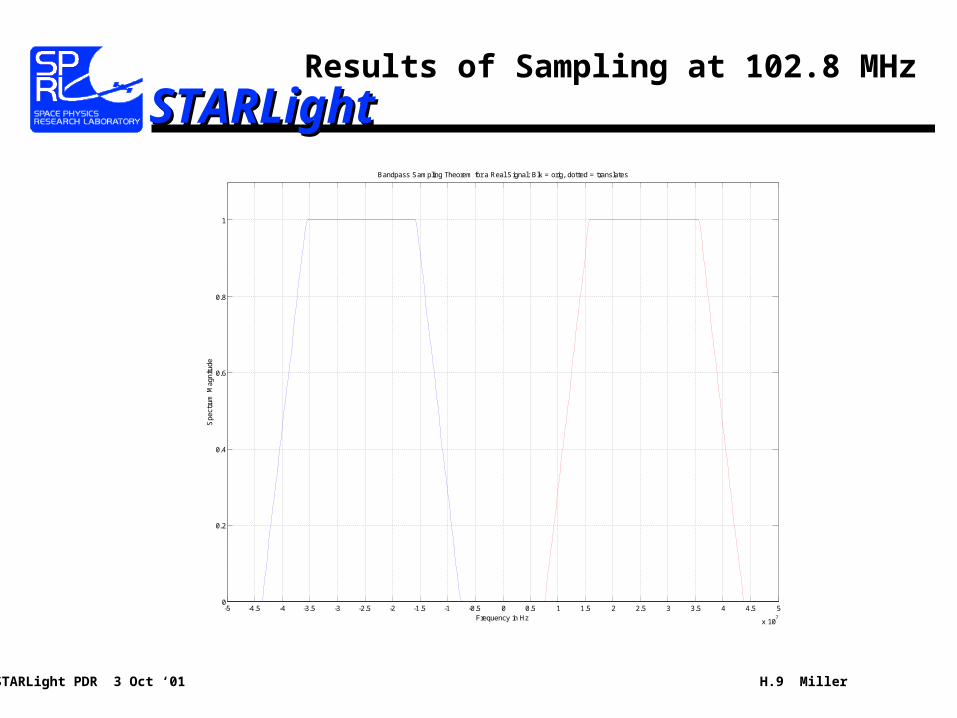
STARLightSTARLightResults of Sampling at 102.8 MHz
-5 -4.5 -4 -3.5 -3 -2.5 -2 -1.5 -1 -0.5 0 0.5 1 1.5 2 2.5 3 3.5 4 4.5 5
x 107
0
0.2
0.4
0.6
0.8
1
Bandpass Sampling Theorem for a Real Signal: Blk = orig, dotted = translates
Spe
ctru
m M
agni
tude
Frequency in Hz

STARLight PDR 3 Oct ‘01 H.10 Miller
STARLightSTARLightThe Next Step…
• Digital Filter before Quadrature Demodulation– PRO:
Only need 10 filters
– CON:
Must operate at 100+ MHz
Filter must be band-pass
• Quadrature Demodulation before Digital Filter– PRO:
Reduces data rate by factor of 2
Digital Filter becomes low-pass
Quadrature Demod includes FIRs – might be able to combine
– CON:
Need 20 digital filters

STARLight PDR 3 Oct ‘01 H.11 Miller
STARLightSTARLightDigital Filtering then Quad Demod.
• Reduced hardware complexity– Fewer filters = less hardware
– Band-pass FIR may require more stages, but not twice as many
• Speed– Depends on FPGA specifications and implementation
– I/O is spec’d at 300 MHz
– Implementation is flexible, Transposed form FIR relies on fast adders
– Xilnx FPGAs have built in adder support
– 64-bit ADD spec’d at 150 MHz

STARLight PDR 3 Oct ‘01 H.12 Miller
STARLightSTARLightDigital Filtering First
• Define the final signal bandwidth using a digital filter– Allows identical filters to be used on all channels
– Allows some relaxation of analog Pre-Sample Filter and minimizes channel to channel matching requirements
• Requires at least 30 stage bandpass FIR
• For 30 Stage, 16-bit (approx.): – 30*16+30*3 = 570 Registers/Filter
– 10 Filters require 5700 registers
– Xilinx XCV600 has over 15,000 registers
STARLight PDR 3 Oct ‘01 H.13 Miller
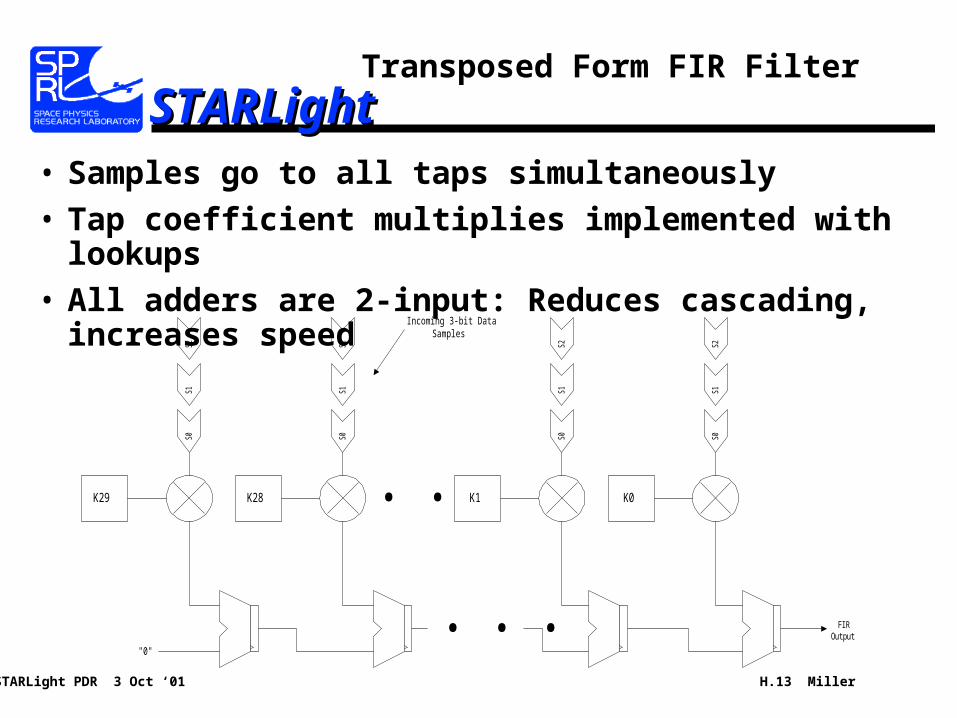
STARLightSTARLightTransposed Form FIR Filter
K29
S0S1
S2
K28
S0S1
S2
. . . K1
S0S1
S2
K0
S0S1
S2
"0"
. . . FIROutput
Incoming 3-bit DataSamples
• Samples go to all taps simultaneously
• Tap coefficient multiplies implemented with lookups
• All adders are 2-input: Reduces cascading, increases speed

STARLight PDR 3 Oct ‘01 H.14 Miller
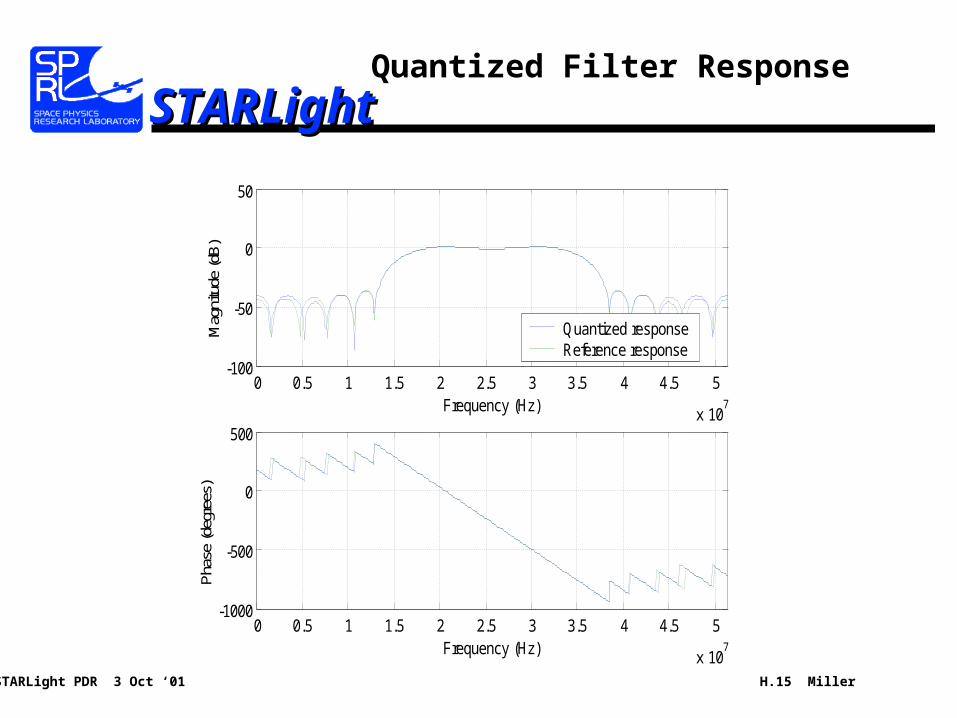
STARLightSTARLightMatlab Designed Quantized FIR
• Used Matlab Filter Design Toolbox
• Designed for quantized 10-bit coefficients
• Sample filter design with 31 taps
• Filter is symmetric
• Filter is linear phase
• Can save hardware since half the coefficients are zero
Quantized Reference IntegerNum Coefficients Coefficients (* 1024)
1 0 -4.899E-15 02 -0.01171875 -0.01160884 -123 0 1.1757E-14 04 0.00390625 0.004617497 45 0 -1.6483E-14 06 0.03515625 0.03546132 367 0 1.4359E-14 08 -0.07421875 -0.0737723 -769 0 -5.407E-15 0
10 0.03515625 0.03572853 3611 0 -4.599E-15 012 0.111328125 0.111258374 11413 0 8.573E-15 014 -0.29296875 -0.29322992 -30015 0 -4.158E-15 016 0.376953125 0.376352935 38617 0 -4.158E-15 018 -0.29296875 -0.29322992 -30019 0 8.573E-15 020 0.111328125 0.111258374 11421 0 -4.599E-15 022 0.03515625 0.03572853 3623 0 -5.407E-15 024 -0.07421875 -0.0737723 -7625 0 1.4359E-14 026 0.03515625 0.03546132 3627 0 -1.6483E-14 028 0.00390625 0.004617497 429 0 1.1757E-14 030 -0.01171875 -0.01160884 -1231 0 -4.899E-15 0
STARLight PDR 3 Oct ‘01 H.15 Miller
STARLightSTARLightQuantized Filter Response
0 0.5 1 1.5 2 2.5 3 3.5 4 4.5 5
x 107
-1000
-500
0
500
Frequency (Hz)
Pha
se (d
egre
es)
0 0.5 1 1.5 2 2.5 3 3.5 4 4.5 5
x 107
-100
-50
0
50
Frequency (Hz)
Mag
nitu
de (d
B)
Quantized responseReference response
STARLight PDR 3 Oct ‘01 H.16 Miller
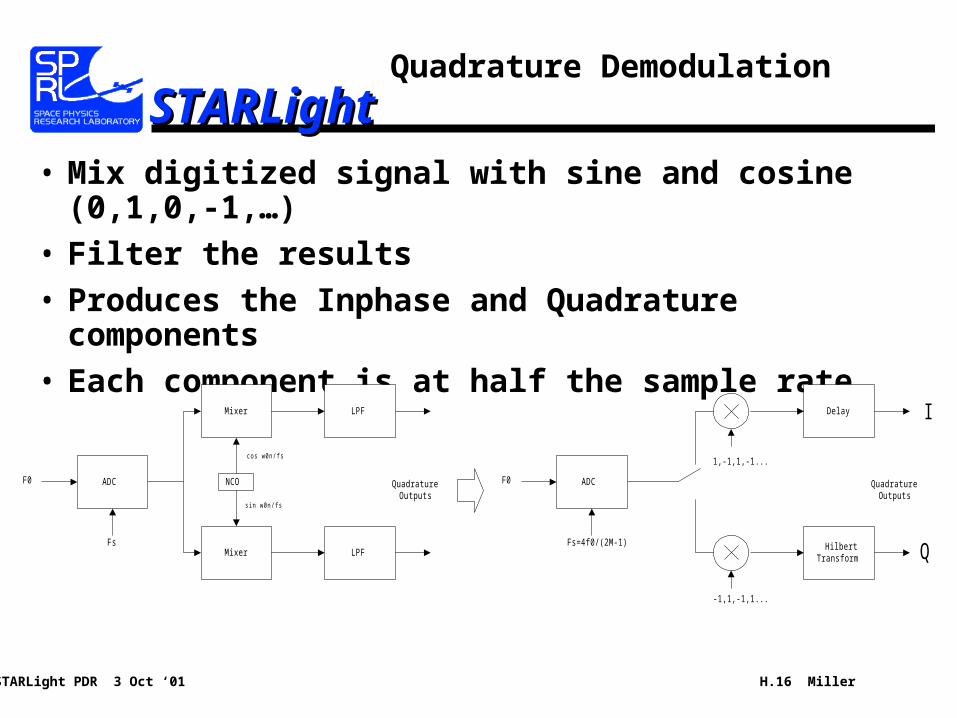
STARLightSTARLightQuadrature Demodulation
• Mix digitized signal with sine and cosine (0,1,0,-1,…)
• Filter the results
• Produces the Inphase and Quadrature components
• Each component is at half the sample rate
ADC NCO
Mixer LPF
LPFMixer
Fs
F0
cos w0n/fs
sin w0n/fs
QuadratureOutputs
ADC
HilbertTransform
Delay
Fs=4f0/(2M-1)
F0 QuadratureOutputs
1,-1,1,-1...
-1,1,-1,1...
I
Q
STARLight PDR 3 Oct ‘01 H.17 Miller
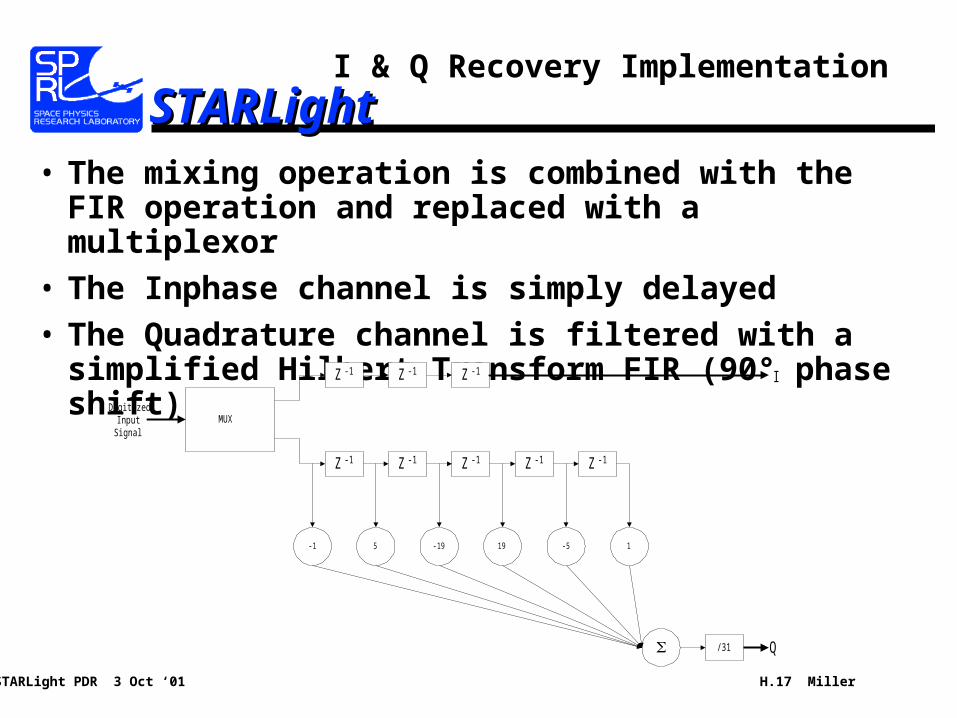
STARLightSTARLightI & Q Recovery Implementation
• The mixing operation is combined with the FIR operation and replaced with a multiplexor
• The Inphase channel is simply delayed
• The Quadrature channel is filtered with a simplified Hilbert Transform FIR (90° phase shift)
MUX
-1 5 -19 19 -5
Z -1 Z -1 Z -1 Z -1 Z -1
1
Z -1 Z -1 Z -1
DigitizedInput
Signal
I
Q/31

STARLight PDR 3 Oct ‘01 H.18 Miller
STARLightSTARLightSampling Summary
• Resulting 12 MHz bandwidth of I and Q channels requires only 24 MHz Sample rate per channel (25.7 MHz)
1.4135 GHz
36 MHz
freq
Mag
25.7 MHz
36 MHz
freq
Mag
Original Signalafter pre-sample filter
Signal after sampling atFs=102.8 MHz
25.7 MHz
24 MHz
freq
Mag
Signal after band-pass FIRfiltering
12 MHz
freq
Mag
Signal after I and Qrecovery
I II
III IV
STARLight PDR 3 Oct ‘01 H.19 Miller
STARLightSTARLightOther Sensor Functions
• Channel Totalizing Counters– 7 counters for each channel
– Count occurrences of each binary value over the integration period
• Housekeeping Data Collection– Up to 6 receiver temperature monitors
• Thermal Control– PWM plus drive electronics for heater in each receiver
STARLight PDR 3 Oct ‘01 H.20 Miller
STARLightSTARLightSensor Data Rates
• 73.4 MHz sampling– Raw bit rate: 10 channels *3 bits * 73.4 MHz = 2.2 Gbps– After I/Q Demod: 20 channels *3 bits * 36.7 MHz = 2.2 Gbps
• 102.8 MHz sampling– Raw bit rate: 10 channels *3 bits * 102.8 MHz = 3.1 Gbps– After I/Q Demod: 20 channels *3 bits * 25.7 MHz = 1.5 Gbps
• Totalizer Output (one second integration)– 10 channels * 7 bins/channel * 29 bits per bin = 2030 bits/sec
• Temperature Data– 10 channels * 6 temps/channel * 16 bits/temp = 960 bits/sec

STARLight PDR 3 Oct ‘01 H.21 Miller
STARLightSTARLightHardware Overview
Data AcquisitionBoard
Data AcquisitionBoard
Data AcquisitionBoard
Data AcquisitionBoard
Data AcquisitionBoard
Data AcquisitionBoard
Data AcquisitionBoard
Data AcquisitionBoard
Data AcquisitionBoard
Data AcquisitionBoard
SensorControlBoard
Control Module
CPU
Correlator
Data Acquisition
Power Supplies
Sample Clock3-bit DataSerial I/OPower
High-Speed, Optical Serial Data
Low-Speed Status/Control
Power
Filte
red,
Ana
log
Inpu
tFr
om R
ecei
vers
IRProfiler
MicroINS
STARLight PDR 3 Oct ‘01 H.22 Miller
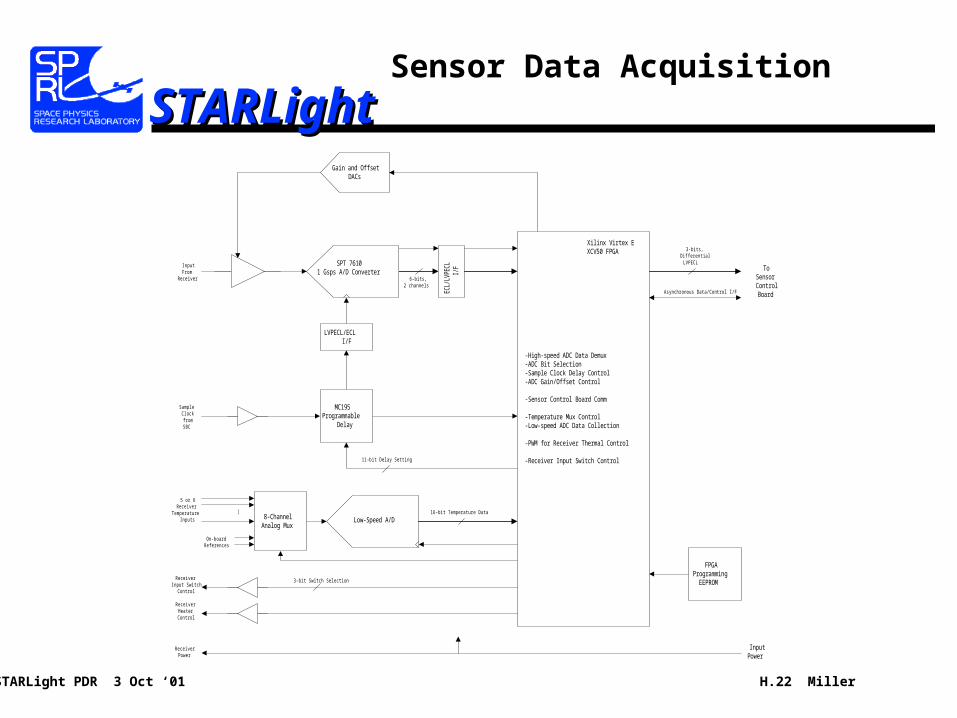
STARLightSTARLightSensor Data Acquisition
EC
L/LV
PE
CL
I/F
6-bits,2 channels
SPT 76101 Gsps A/D Converter
SampleClockfromSBC
MC195Programmable
Delay
LVPECL/ECLI/F
InputFrom
Receiver
Gain and OffsetDACs
11-bit Delay Setting
8-ChannelAnalog Mux
Low-Speed A/D16-bit Temperature Data
...
On-boardReferences
5 or 6Receiver
TemperatureInputs
ReceiverHeaterControl
3-bits,Differential
LVPECL
Asynchronous Data/Control I/F
ToSensorControlBoard
Xilinx Virtex EXCV50 FPGA
FPGAProgramming
EEPROM
-High-speed ADC Data Demux-ADC Bit Selection-Sample Clock Delay Control-ADC Gain/Offset Control
-Sensor Control Board Comm
-Temperature Mux Control-Low-speed ADC Data Collection
-PWM for Receiver Thermal Control
-Receiver Input Switch Control
ReceiverPower
InputPower
ReceiverInput Switch
Control
3-bit Switch Selection
STARLight PDR 3 Oct ‘01 H.23 Miller
STARLightSTARLightA/D Converter Comparison
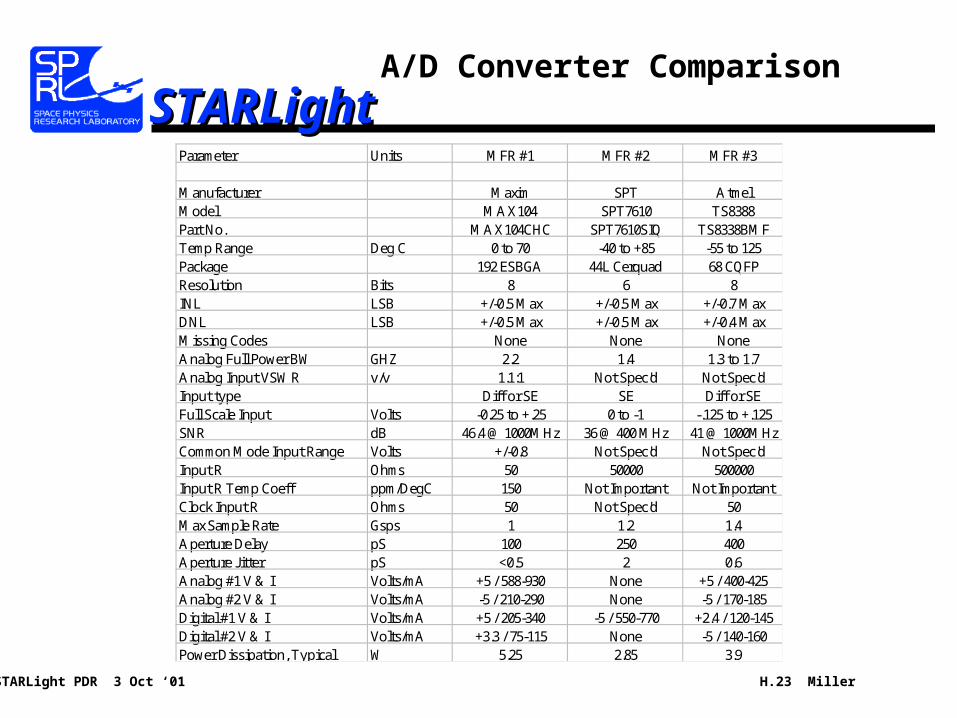
Parameter Units MFR #1 MFR #2 MFR #3
Manufacturer Maxim SPT AtmelModel MAX104 SPT7610 TS8388Part No. MAX104CHC SPT7610SIQ TS8338BMFTemp Range Deg C 0 to 70 -40 to +85 -55 to 125Package 192 ESBGA 44L Cerquad 68 CQFPResolution Bits 8 6 8INL LSB +/-0.5 Max +/-0.5 Max +/-0.7 MaxDNL LSB +/-0.5 Max +/-0.5 Max +/-0.4 MaxMissing Codes None None NoneAnalog Full Power BW GHZ 2.2 1.4 1.3 to 1.7Analog Input VSWR v/v 1.1:1 Not Spec'd Not Spec'dInput type Diff or SE SE Diff or SEFull Scale Input Volts -0.25 to +.25 0 to -1 -.125 to +.125SNR dB 46.4 @ 1000MHz 36 @ 400 MHz 41 @ 1000MHzCommon Mode Input Range Volts +/-0.8 Not Spec'd Not Spec'dInput R Ohms 50 50000 500000Input R Temp Coeff ppm/DegC 150 Not Important Not ImportantClock Input R Ohms 50 Not Spec'd 50Max Sample Rate Gsps 1 1.2 1.4Aperture Delay pS 100 250 400Aperture Jitter pS <0.5 2 0.6Analog #1 V & I Volts/mA +5 / 588-930 None +5 / 400-425Analog #2 V & I Volts/mA -5 / 210-290 None -5 / 170-185Digital #1 V & I Volts/mA +5 / 205-340 -5 / 550-770 +2.4 / 120-145Digital #2 V & I Volts/mA +3.3 / 75-115 None -5 / 140-160Power Dissipation, Typical W 5.25 2.85 3.9
STARLight PDR 3 Oct ‘01 H.24 Miller
STARLightSTARLightSPT 7610 A/D Selected
• Power– Lowest power of the 3 available
• Package– Flat-pack package
– Maxim only available in Ball-Grid Array Package
• Temperature Range– Available in Industrial Temp. Range (-40 to +85C)
– Maxim only available in Commercial Temp. Range (0 to 70C)
• Availability– Parts in-house
– Atmel: $888.00 ea, Minimum order of 4, 16-week lead time

STARLight PDR 3 Oct ‘01 H.25 Miller
STARLightSTARLightSensor Control Board
Digitized Datafrom Sensor Data
Acquisition Boards
Low
-Ske
wC
lock
Buf
fer
CrystalOscillator
SampleClock 2
SampleClock 10
Xilinx Virtex E XCV600FPGA
SampleClock
SampleClock 1
MAX38902.5Gbps 16:1
Serializer
PowerInput
MAX3867Laser Driver
Clk/Ctrl
2.5 GbpsFiber Optic
Channel
Low-Speed SerialControl/Data
Interface
Low-SpeedStatus/Control
Serial Status andControl
.
.
.
.
.
.
.
.
.
-High-Speed ADC Data Acquisition-Digital Filtering-I and Q Recovery-Quantizer Statistics
-Integration Period Control-High-Level Sensor HK Sample Ctl-Sensor HK Data Acquisition
-High-Speed Data Formatting-High-Speed Data Transmission
STARLight PDR 3 Oct ‘01 H.26 Miller
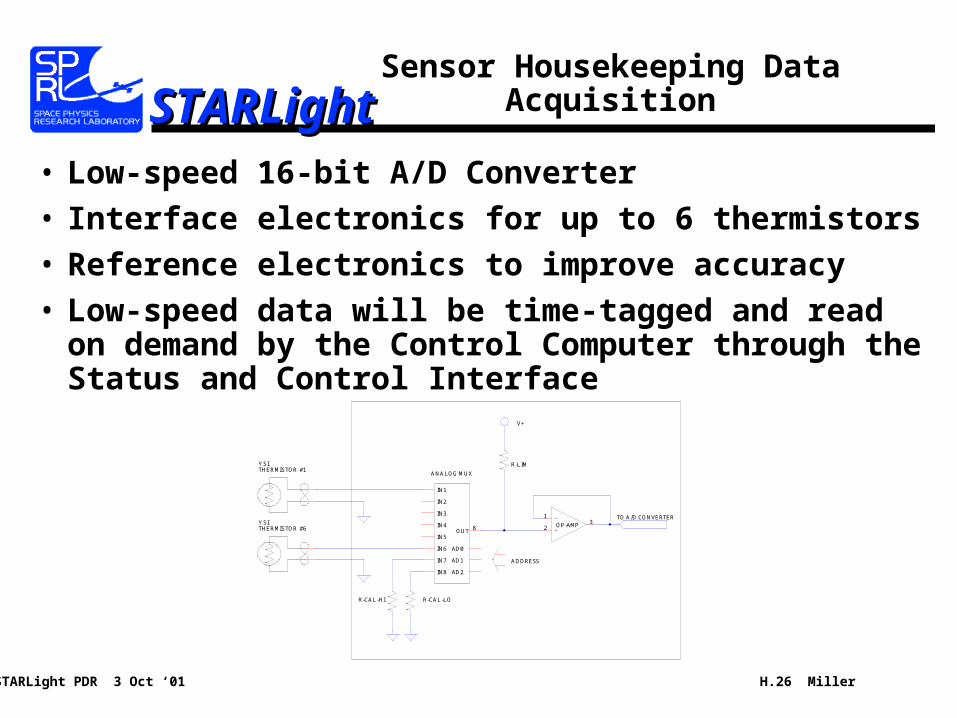
STARLightSTARLightSensor Housekeeping Data Acquisition
• Low-speed 16-bit A/D Converter
• Interface electronics for up to 6 thermistors
• Reference electronics to improve accuracy
• Low-speed data will be time-tagged and read on demand by the Control Computer through the Status and Control Interface
IN8
IN7
IN6
IN5OUT
IN1
IN2
IN3
IN4
AD0
AD1
AD2
8
ANALOG MUX
OP-AMP
1
23
R-CAL-LOR-CAL-HI
R-LIM
V+
THERMISTORYSI
TO A/D CONVERTER
THERMISTORYSI
ADDRESS
#1
#6
STARLight PDR 3 Oct ‘01 H.27 Miller
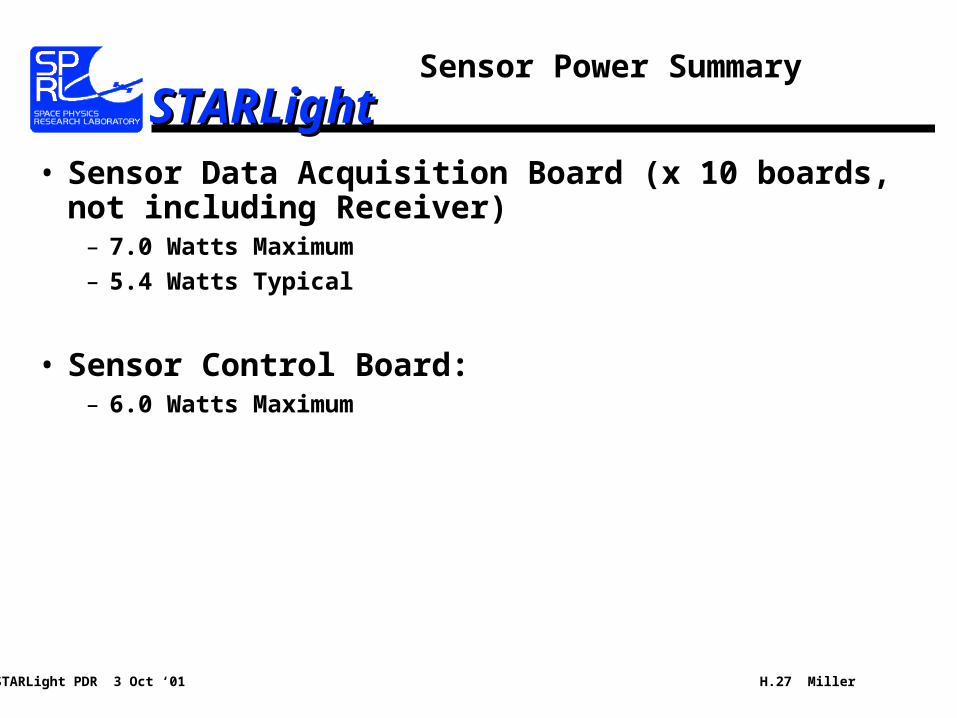
STARLightSTARLightSensor Power Summary
• Sensor Data Acquisition Board (x 10 boards, not including Receiver)
– 7.0 Watts Maximum
– 5.4 Watts Typical
• Sensor Control Board:– 6.0 Watts Maximum
STARLight PDR 3 Oct ‘01 H.28 Miller
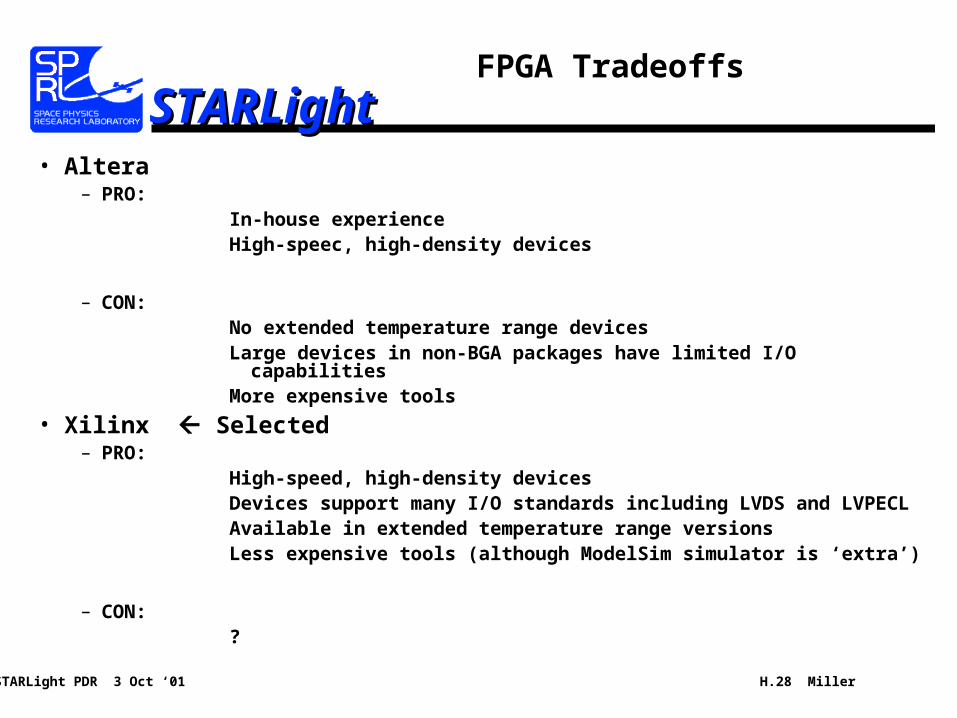
STARLightSTARLightFPGA Tradeoffs
• Altera– PRO:
In-house experienceHigh-speec, high-density devices
– CON:No extended temperature range devicesLarge devices in non-BGA packages have limited I/O capabilitiesMore expensive tools
• Xilinx Selected– PRO:
High-speed, high-density devicesDevices support many I/O standards including LVDS and LVPECLAvailable in extended temperature range versionsLess expensive tools (although ModelSim simulator is ‘extra’)
– CON:?
STARLight PDR 3 Oct ‘01 H.29 Miller
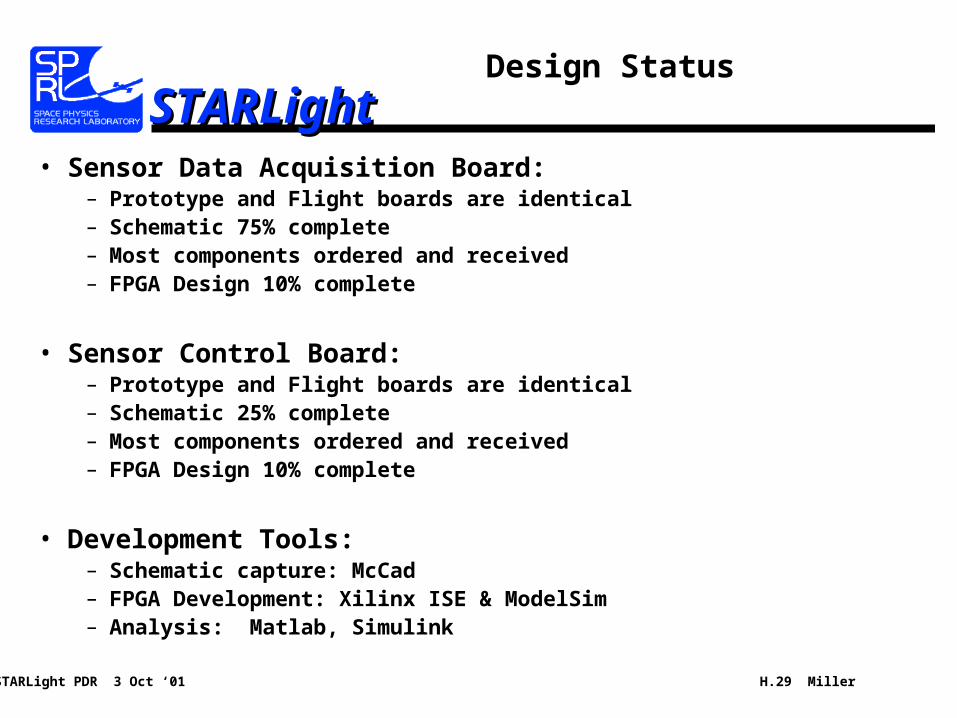
STARLightSTARLightDesign Status
• Sensor Data Acquisition Board:– Prototype and Flight boards are identical– Schematic 75% complete– Most components ordered and received– FPGA Design 10% complete
• Sensor Control Board:– Prototype and Flight boards are identical– Schematic 25% complete– Most components ordered and received– FPGA Design 10% complete
• Development Tools:– Schematic capture: McCad– FPGA Development: Xilinx ISE & ModelSim– Analysis: Matlab, Simulink

STARLight PDR 3 Oct ‘01 H.30 Miller
STARLightSTARLightSchedule
Task Description Date Complete
Sensor DA Board Nov-01 Dec-01 Jan-02 Feb-02 Mar-02 Apr-02Schematic 15-Nov-01FPGA Design 1-Dec-01FPGA Code 15-Dec-01PCB Layout 1-Dec-01PCB Parts List 15-Nov-01Order Remaining Parts 1-Dec-01Cable Net Lists 1-Dec-01Cable Parts Lists 1-Dec-01Assemble Cables 15-Dec-01Assemble PCB 1-Jan-02Program FPGA 1-Jan-02Initial Standalone Tests 15-Jan-02
Sensor Controller BoardSchematic 1-Dec-01FPGA Design 15-Dec-01FPGA Code 1-Jan-02PCB Layout 15-Dec-01PCB Parts List 1-Dec-01Order Remaining Parts 1-Dec-01Cable Net Lists 15-Dec-01Cable Parts Lists 15-Dec-01Assemble Cables 1-Jan-01Assemble PCB 15-Jan-02Program FPGA 15-Jan-02Initial Standalone Tests 1-Feb-02Integration Tests with DA Board 15-Feb-02