starbucks ar01_financials
36
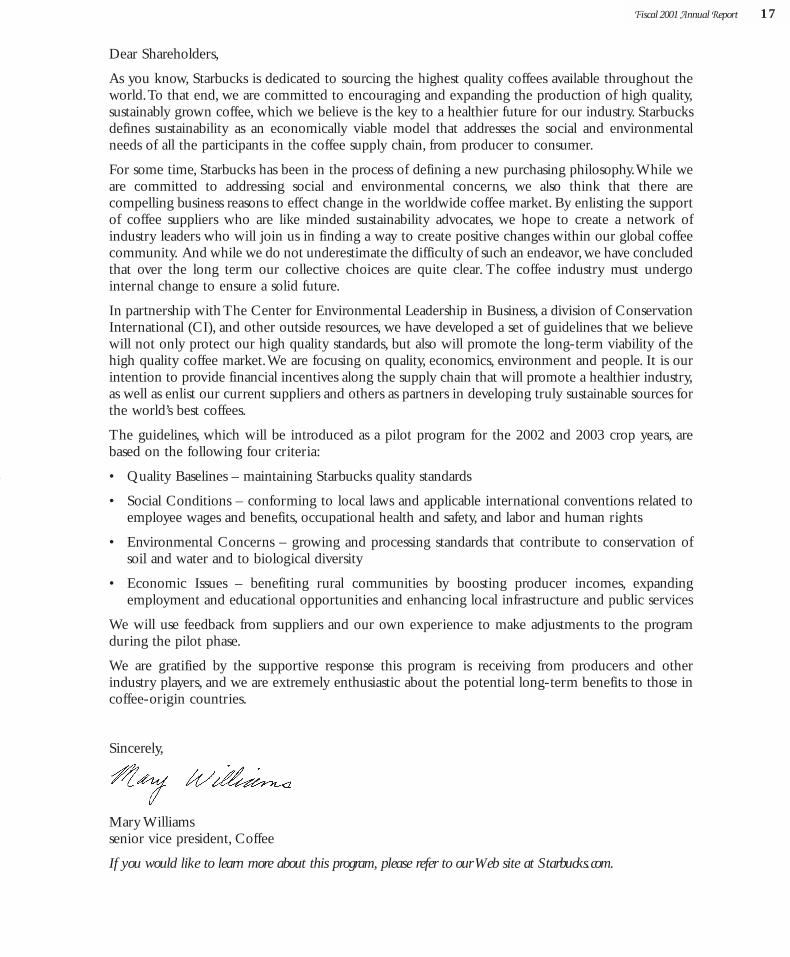
Fiscal 2001 Annual Report 17 Dear Shareholders, As you know,Starbucks is dedicated to sourcing the highest quality coffees available throughout the world.To that end,we are committed to encouraging and expanding the production of high quality, sustainably grown coffee,which we believe is the key to a healthier future for our industry.Starbucks defines sustainability as an economically viable model that addresses the social and environmental needs of all the participants in the coffee supply chain, from producer to consumer. For some time,Starbucks has been in the process of defining a new purchasing philosophy.While we are committed to addressing social and environmental concerns, we also think that there are compelling business reasons to effect change in the worldwide coffee market. By enlisting the support of coffee suppliers who are like minded sustainability advocates, we hope to create a network of industry leaders who will join us in finding a way to create positive changes within our global coffee community. And while we do not underestimate the difficulty of such an endeavor,we have concluded that over the long term our collective choices are quite clear. The coffee industry must undergo internal change to ensure a solid future. In partnership with The Center for Environmental Leadership in Business, a division of Conservation International (CI), and other outside resources, we have developed a set of guidelines that we believe will not only protect our high quality standards, but also will promote the long-term viability of the high quality coffee market.We are focusing on quality, economics, environment and people. It is our intention to provide financial incentives along the supply chain that will promote a healthier industry, as well as enlist our current suppliers and others as partners in developing truly sustainable sources for the world’s best coffees. The guidelines, which will be introduced as a pilot program for the 2002 and 2003 crop years, are based on the following four criteria: • Quality Baselines – maintaining Starbucks quality standards • Social Conditions – conforming to local laws and applicable international conventions related to employee wages and benefits, occupational health and safety, and labor and human rights • Environmental Concerns – growing and processing standards that contribute to conservation of soil and water and to biological diversity • Economic Issues – benefiting rural communities by boosting producer incomes, expanding employment and educational opportunities and enhancing local infrastructure and public services We will use feedback from suppliers and our own experience to make adjustments to the program during the pilot phase. We are gratified by the supportive response this program is receiving from producers and other industry players, and we are extremely enthusiastic about the potential long-term benefits to those in coffee-origin countries. Sincerely, Mary Williams senior vice president, Coffee If you would like to learn more about this program,please refer to our Web site at Starbucks.com.
-
Upload
finance41 -
Category
Economy & Finance
-
view
674 -
download
0
Transcript of starbucks ar01_financials
Fiscal 2001 Annual Report 17
Dear Shareholders,
As you know, Starbucks is dedicated to sourcing the highest quality coffees available throughout theworld.To that end, we are committed to encouraging and expanding the production of high quality,sustainably grown coffee, which we believe is the key to a healthier future for our industry. Starbucksdefines sustainability as an economically viable model that addresses the social and environmentalneeds of all the participants in the coffee supply chain, from producer to consumer.
For some time, Starbucks has been in the process of defining a new purchasing philosophy.While weare committed to addressing social and environmental concerns, we also think that there arecompelling business reasons to effect change in the worldwide coffee market. By enlisting the supportof coffee suppliers who are like minded sustainability advocates, we hope to create a network ofindustry leaders who will join us in finding a way to create positive changes within our global coffeecommunity. And while we do not underestimate the difficulty of such an endeavor,we have concludedthat over the long term our collective choices are quite clear. The coffee industry must undergointernal change to ensure a solid future.
In partnership with The Center for Environmental Leadership in Business, a division of ConservationInternational (CI), and other outside resources, we have developed a set of guidelines that we believewill not only protect our high quality standards, but also will promote the long-term viability of thehigh quality coffee market.We are focusing on quality, economics, environment and people. It is ourintention to provide financial incentives along the supply chain that will promote a healthier industry,as well as enlist our current suppliers and others as partners in developing truly sustainable sources forthe world’s best coffees.
The guidelines, which will be introduced as a pilot program for the 2002 and 2003 crop years, arebased on the following four criteria:
• Quality Baselines – maintaining Starbucks quality standards
• Social Conditions – conforming to local laws and applicable international conventions related toemployee wages and benefits, occupational health and safety, and labor and human rights
• Environmental Concerns – growing and processing standards that contribute to conservation ofsoil and water and to biological diversity
• Economic Issues – benefiting rural communities by boosting producer incomes, expandingemployment and educational opportunities and enhancing local infrastructure and public services
We will use feedback from suppliers and our own experience to make adjustments to the programduring the pilot phase.
We are gratified by the supportive response this program is receiving from producers and otherindustry players, and we are extremely enthusiastic about the potential long-term benefits to those incoffee-origin countries.
Sincerely,
Mary Williamssenior vice president, Coffee
If you would like to learn more about this program, please refer to our Web site at Starbucks.com.
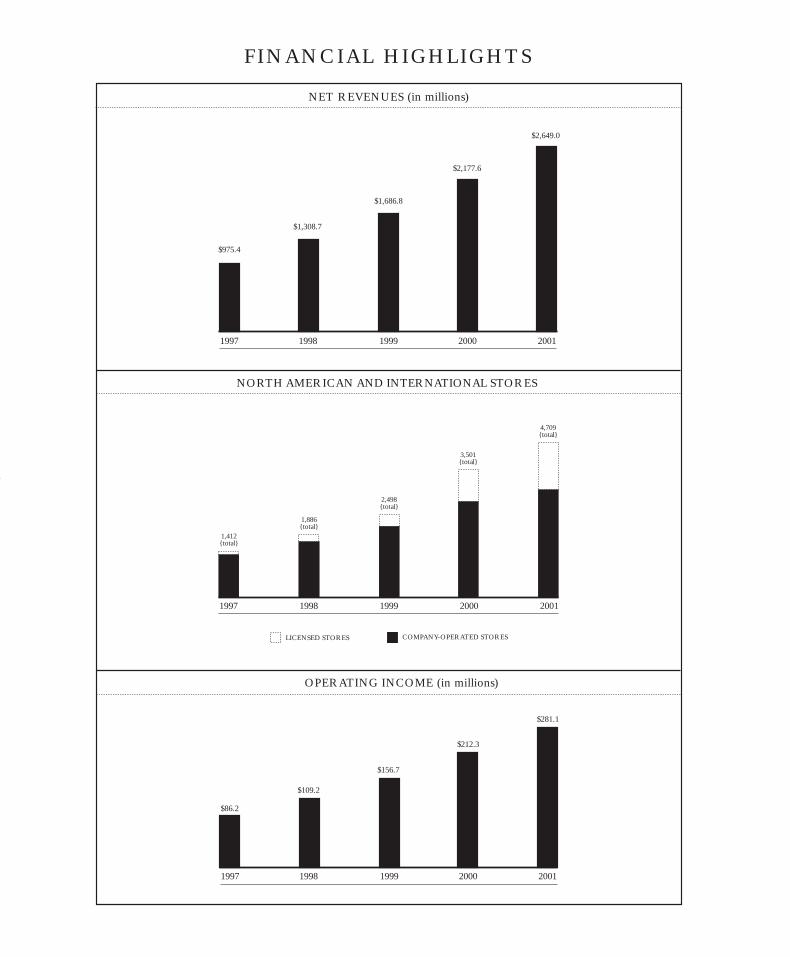
NET REVENUES (in millions)
NORTH AMERICAN AND INTERNATIONAL STORES
OPERATING INCOME (in millions)
FINANCIAL HIGHLIGHTS
1997
$975.4
$1,308.7
1998
$1,686.8
1999
$2,177.6
2000
$2,649.0
2001
1997
$86.2
$109.2
1998
$156.7
1999
$212.3
2000
$281.1
2001
LICENSED STORES COMPANY-OPERATED STORES
4,709{total}
2001
3,501{total}
2000
2,498{total}
1999
1,886{total}
19981997
1,412{total}
Fiscal 2001 Annual Report 19
Cautionary Statement Pursuant to the Private Securities Litigation Reform Act of 1995
Certain statements set forth in or incorporated by reference into this Annual Report on Form 10-K,including anticipated store and market openings, planned capital expenditures and trends in orexpectations regarding the Company’s operations, constitute “forward-looking statements” within themeaning of the Private Securities Litigation Reform Act of 1995. Such statements are based oncurrently available operating, financial and competitive information and are subject to various risksand uncertainties. Actual future results and trends may differ materially depending on a variety offactors, including, but not limited to, coffee and other raw materials prices and availability, successfulexecution of internal performance and expansion plans, the effect of slowing United States andinternational economies, the economic ramifications of the September 11, 2001, terrorist attacks andthe governmental response thereto, the impact of competition, the effect of legal proceedings and otherrisks detailed herein.
Business
Starbucks Corporation (together with its subsidiaries, “Starbucks” or the “Company”) purchases androasts high-quality whole bean coffees and sells them, along with fresh, rich-brewed coffees, Italian-style espresso beverages, cold blended beverages, a variety of pastries and confections, coffee-relatedaccessories and equipment, a selection of premium teas and a line of compact disks primarily throughits Company-operated retail stores. In addition to sales through its Company-operated retail stores,Starbucks sells coffee and tea products through other channels of distribution including the BusinessAlliances business unit and other specialty operations (collectively,“Specialty Operations”). Starbucks,through its joint venture partnerships, also produces and sells bottled Frappuccino® coffee drink anda line of premium ice creams.The Company’s objective is to establish Starbucks as the most recognizedand respected brand in the world. To achieve this goal, the Company plans to continue to rapidlyexpand its retail operations, grow its Specialty Operations and selectively pursue other opportunitiesto leverage the Starbucks brand through the introduction of new products and the development ofnew distribution channels.
The Company’s retail goal is to become the leading retailer and brand of coffee in each of its targetmarkets by selling the finest quality coffee and related products and by providing superior customerservice, thereby building a high degree of customer loyalty. Starbucks strategy for expanding its retailbusiness is to increase its market share in existing markets and to open stores in new markets wherethe opportunity exists to become the leading specialty coffee retailer. In support of this strategy, theCompany opened 647 new stores during fiscal year ended September 30, 2001 (“fiscal 2001”).At fiscalyear end, Starbucks had 2,971 Company-operated stores in 38 states, the District of Columbia andfive Canadian provinces (which comprise the Company-operated North American retail operations)as well as 252 stores in the United Kingdom, 25 stores in Thailand and 18 stores in Australia (whichcomprise the Company-operated international retail operations). Company-operated retail storesaccounted for approximately 84% of net revenues during fiscal 2001.
Starbucks Specialty Operations strive to develop the Starbucks brand outside the Company-operatedretail store environment through a number of channels. Starbucks strategy is to reach customers wherethey work, travel, shop and dine by establishing relationships with prominent third parties who shareStarbucks values and commitment to quality. These relationships take various forms, includingarrangements with foodservice companies and retail store licensing agreements for North Americanlocations (which together comprise the Business Alliances business unit), grocery channel licensingagreements, warehouse club accounts, international retail store licensing agreements, direct-to-consumer market channels, joint ventures and other initiatives related to the Company’s corebusinesses. In certain licensing situations, the licensee is a joint venture in which Starbucks has anequity ownership interest.During fiscal 2001, specialty revenues (which include royalties and fees fromlicensees as well as product sales) accounted for approximately 16% of the Company’s net revenues.

Selected Financial Data In thousands, except earnings per share and store operating data
The following selected financial data have been derived from the consolidated financial statements ofthe Company.The data set forth below should be read in conjunction with “Management’s Discussionand Analysis of Financial Condition and Results of Operations” and the Company’s consolidatedfinancial statements and notes thereto.
As of and for the Sept 30, 2001 Oct 1, 2000 Oct 3, 1999 Sept 27, 1998 Sept 28, 1997fiscal year ended (1) (52 Wks) (52 Wks) (53 Wks) (52 Wks) (52 Wks)RESULTS OF OPERATIONS DATANet revenues:
Retail $ 2,229,594 $ 1,823,607 $ 1,423,389 $ 1,102,574 $ 836,291Specialty 419,386 354,007 263,439 206,128 139,098
Total net revenues 2,648,980 2,177,614 1,686,828 1,308,702 975,389Merger expenses (2) - - - 8,930 -Operating income 281,094 212,252 156,711 109,216 86,199Internet-related investment losses (3) 2,940 58,792 - - -Net earnings $ 181,210 $ 94,564 $ 101,693 $ 68,372 $ 55,211Net earnings per common share – diluted (4) $ 0.46 $ 0.24 $ 0.27 $ 0.19 $ 0.17Cash dividends per share - - - - -BALANCE SHEET DATAWorking capital $ 148,661 $ 146,568 $ 135,303 $ 157,805 $ 172,079Total assets 1,851,039 1,491,546 1,252,514 992,755 857,152Long-term debt (including current portion) 6,483 7,168 7,691 1,803 168,832Shareholders’ equity 1,375,927 1,148,399 961,013 794,297 533,710STORE OPERATING DATAPercentage change in comparable store sales (5) 5% 9% 6% 5% 5%Stores open at year-end:
Continental North AmericaCompany-operated stores 2,971 2,446 2,038 1,622 1,270Licensed stores 809 530 179 133 94
InternationalCompany-operated stores 295 173 97 66 31Licensed stores 634 352 184 65 17
Total stores 4,709 3,501 2,498 1,886 1,412
(1) The Company’s fiscal year ends on the Sunday closest to September 30.All fiscal years presented include 52 weeks,except fiscal 1999, which includes 53 weeks.
(2) Merger expenses relate to the business combination with Seattle Coffee Holdings Limited.(3) See Notes to Consolidated Financial Statements (Notes 4 and 8).(4) See Notes to Consolidated Financial Statements (Note 1). Earnings per share data for fiscal years presented have been
restated to reflect the two-for-one stock splits in fiscal 2001 and 1999.(5) Includes only Company-operated stores open 13 months or longer.
Fiscal 2001 Annual Report 21
Management’s Discussion and Analysis of Financial Condition and Results of Operations
GENERAL Starbucks presently derives approximately 84% of net revenues from its Company-operated retailstores.The remaining 16% of net revenues is derived from the Company’s Specialty Operations, whichinclude sales to wholesale channels and licensees, royalty and license fee income and sales through itsdirect-to-consumer business.The Company’s fiscal year ends on the Sunday closest to September 30.Fiscal years 2001 and 2000 each had 52 weeks, and fiscal 1999 had 53 weeks.The fiscal year endingon September 29, 2002, will include 52 weeks.
The Company’s consolidated net revenues increased 22% from $2.2 billion in fiscal 2000 to $2.6billion in fiscal 2001, primarily due to the Company’s store expansion program and comparable storesales increases. Comparable store sales increased by 5%, 9% and 6% in fiscal 2001, 2000 and 1999,respectively. As part of its expansion strategy of clustering stores in existing markets, Starbucks hasexperienced a certain level of cannibalization of sales of existing stores by new stores as storeconcentration has increased. However, management believes such cannibalization has been justified bythe incremental sales and return on new store investments.This cannibalization, as well as increasedcompetition and other factors, may put downward pressure on the Company’s comparable store salesgrowth in future periods.
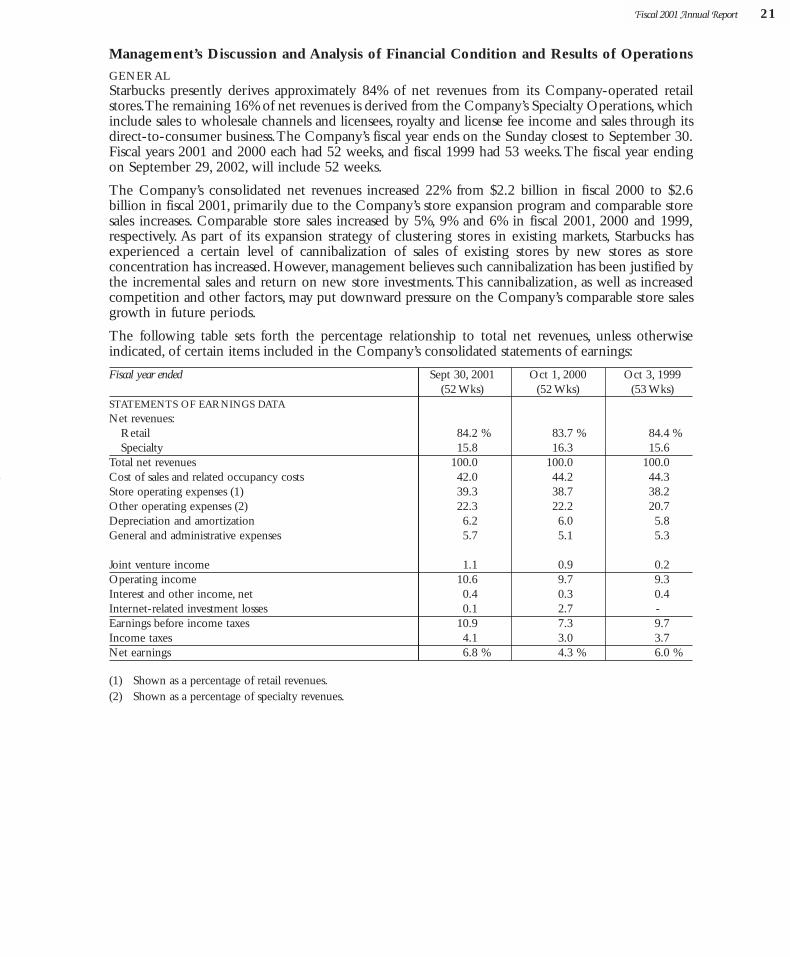
The following table sets forth the percentage relationship to total net revenues, unless otherwiseindicated, of certain items included in the Company’s consolidated statements of earnings:
Fiscal year ended Sept 30, 2001 Oct 1, 2000 Oct 3, 1999(52 Wks) (52 Wks) (53 Wks)
STATEMENTS OF EARNINGS DATANet revenues:
Retail 84.2 % 83.7 % 84.4 %Specialty 15.8 16.3 15.6
Total net revenues 100.0 100.0 100.0Cost of sales and related occupancy costs 42.0 44.2 44.3Store operating expenses (1) 39.3 38.7 38.2Other operating expenses (2) 22.3 22.2 20.7Depreciation and amortization 6.2 6.0 5.8General and administrative expenses 5.7 5.1 5.3
Joint venture income 1.1 0.9 0.2Operating income 10.6 9.7 9.3Interest and other income, net 0.4 0.3 0.4Internet-related investment losses 0.1 2.7 -Earnings before income taxes 10.9 7.3 9.7Income taxes 4.1 3.0 3.7Net earnings 6.8 % 4.3 % 6.0 %
(1) Shown as a percentage of retail revenues.(2) Shown as a percentage of specialty revenues.
BUSINESS COMBINATIONS During fiscal 2000, Starbucks acquired the outstanding stock of Tympanum, Inc. (d/b/a “HearMusic”), a music retailer, and of Coffee Partners Co. Ltd., the company licensed to operate Starbucksstores in Thailand.The combined purchase price for these two acquisitions was $14.1 million. Duringfiscal 1999, Starbucks acquired the net assets of Tazo, L.L.C., a Portland, Oregon-based tea companythat produces premium tea products, and Pasqua Inc., a San Francisco, California-based roaster andretailer of specialty coffee.The combined purchase price for these two acquisitions was $16.5 million.All of the above acquisitions were accounted for under the purchase method of accounting. Resultsof operations of the acquired companies are included on the accompanying consolidated financialstatements from the dates of acquisition.
RESULTS OF OPERATIONS—FISCAL 2001 COMPARED TO FISCAL 2000
Systemwide Retail Store Sales Systemwide retail store sales, which include net sales for both Company-operated and licensed retailstores, were $3.0 billion for fiscal 2001, an increase of 31% from $2.3 billion in fiscal 2000, primarilydue to the opening of an additional 1,208 stores. Systemwide retail store sales provides a broadperspective of global brand sales; however, it excludes net revenues from non-retail channels.Revenues Consolidated net revenues increased 22% to $2.6 billion for fiscal 2001, compared to $2.2 billion forfiscal 2000. Retail revenues increased 22% to $2.2 billion from $1.8 billion. The increase in retailrevenues was due to the addition of new Company-operated stores and comparable store sales growthof 5%.The increase in comparable store sales resulted from a 2% increase in the number of transactionsand a 3% increase in the average dollar value per transaction. During fiscal 2001, the Company opened525 stores in continental North America, 96 stores in the United Kingdom, 10 in Thailand and 16 inAustralia. As of fiscal year-end, there were 2,971 Company-operated stores in continental NorthAmerica, 252 in the United Kingdom, 25 in Thailand and 18 in Australia. During fiscal 2002, theCompany expects to open at least 525 Company-operated stores in North America and 100 ininternational markets.
Specialty revenues increased 18% to $419 million for fiscal 2001 from $354 million for fiscal 2000.The increase was driven primarily by higher sales to retail licensees, the Company’s grocery channeland foodservice accounts. Licensees (including those in which the Company is a joint venture partner)opened 282 stores in international markets and 279 stores in continental North America, of whichover 180 stores related to the Company’s expansion into grocery stores.The Company ended the yearwith 809 licensed stores in continental North America and 634 licensed stores in internationalmarkets. During fiscal 2002, the Company expects to open at least 300 licensed stores in NorthAmerica and 275 in international markets.Expenses Cost of sales and related occupancy costs decreased to 42.0% of net revenues for fiscal 2001 from44.2% in fiscal 2000.The decrease resulted from several factors, including lower green coffee costs, theimpact of retail beverage sales price increases, continued cost savings from procurement initiatives andshifts in sales mix to higher-margin products.These factors were partially offset by higher occupancycosts as a result of higher average rent expense per square foot as well as the expansion of Company-operated stores into international markets that have higher occupancy costs as a percentage of revenuesthan North American retail operations.
Store operating expenses as a percentage of retail revenues increased to 39.3% for fiscal 2001 from38.7% for fiscal 2000.The increase was primarily due to higher payroll-related expenditures resultingfrom higher average wage rates and the continuing shift to more labor-intensive handcrafted beverages,partially offset by leverage gained from regional overhead expenses distributed over an expandedrevenue base and reductions in advertising expenses.
Other operating expenses (expenses associated with the Company’s Specialty Operations) were 22.3%of specialty revenues during fiscal 2001, compared to 22.2% for fiscal 2000.The increase is attributableto the Company’s licensee channels, both international and domestic, as the Company expands thesebusinesses geographically and continues to develop its internal resources for future growth.These costs,which are expected to increase through 2002, were partially offset by lower advertising expenses forthe Company’s direct-to-consumer business.
Fiscal 2001 Annual Report 23
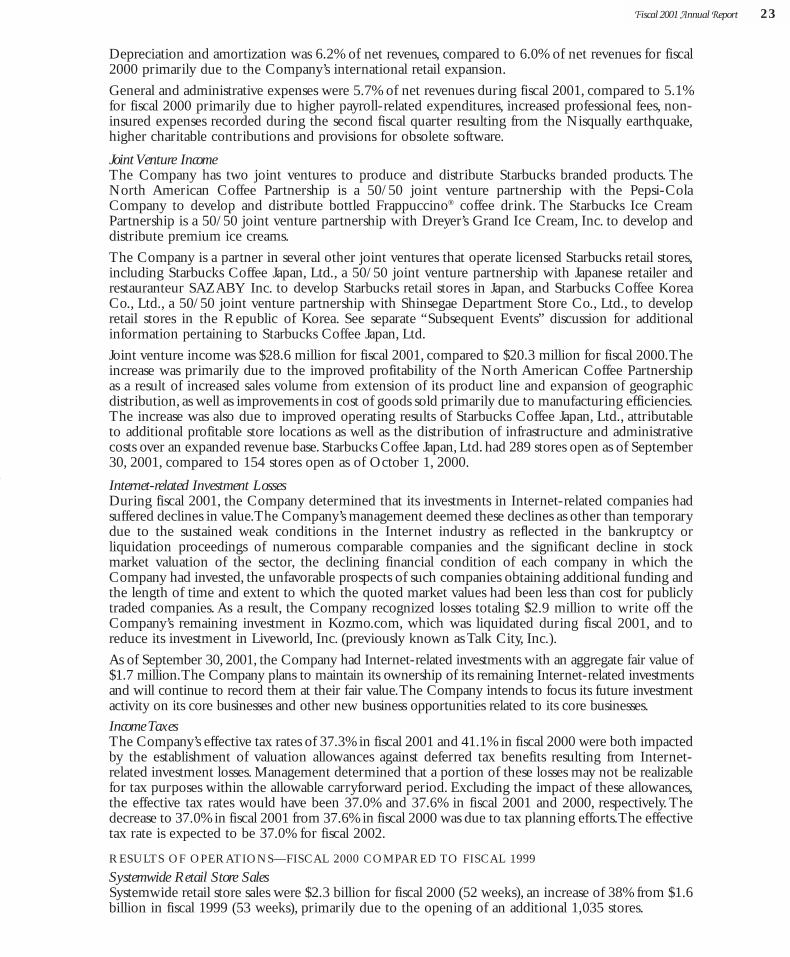
Depreciation and amortization was 6.2% of net revenues, compared to 6.0% of net revenues for fiscal2000 primarily due to the Company’s international retail expansion.
General and administrative expenses were 5.7% of net revenues during fiscal 2001, compared to 5.1%for fiscal 2000 primarily due to higher payroll-related expenditures, increased professional fees, non-insured expenses recorded during the second fiscal quarter resulting from the Nisqually earthquake,higher charitable contributions and provisions for obsolete software.
Joint Venture IncomeThe Company has two joint ventures to produce and distribute Starbucks branded products. TheNorth American Coffee Partnership is a 50/50 joint venture partnership with the Pepsi-ColaCompany to develop and distribute bottled Frappuccino® coffee drink. The Starbucks Ice CreamPartnership is a 50/50 joint venture partnership with Dreyer’s Grand Ice Cream, Inc. to develop anddistribute premium ice creams.
The Company is a partner in several other joint ventures that operate licensed Starbucks retail stores,including Starbucks Coffee Japan, Ltd., a 50/50 joint venture partnership with Japanese retailer andrestauranteur SAZABY Inc. to develop Starbucks retail stores in Japan, and Starbucks Coffee KoreaCo., Ltd., a 50/50 joint venture partnership with Shinsegae Department Store Co., Ltd., to developretail stores in the Republic of Korea. See separate “Subsequent Events” discussion for additionalinformation pertaining to Starbucks Coffee Japan, Ltd.
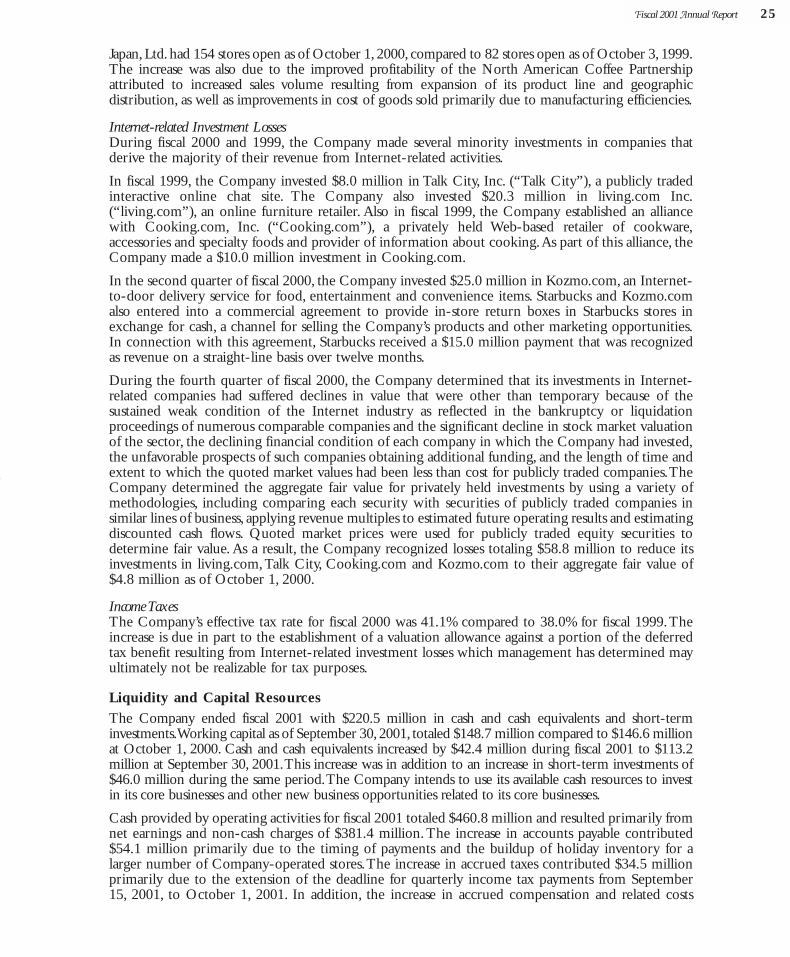
Joint venture income was $28.6 million for fiscal 2001, compared to $20.3 million for fiscal 2000.Theincrease was primarily due to the improved profitability of the North American Coffee Partnershipas a result of increased sales volume from extension of its product line and expansion of geographicdistribution, as well as improvements in cost of goods sold primarily due to manufacturing efficiencies.The increase was also due to improved operating results of Starbucks Coffee Japan, Ltd., attributableto additional profitable store locations as well as the distribution of infrastructure and administrativecosts over an expanded revenue base. Starbucks Coffee Japan, Ltd. had 289 stores open as of September30, 2001, compared to 154 stores open as of October 1, 2000.
Internet-related Investment LossesDuring fiscal 2001, the Company determined that its investments in Internet-related companies hadsuffered declines in value.The Company’s management deemed these declines as other than temporarydue to the sustained weak conditions in the Internet industry as reflected in the bankruptcy orliquidation proceedings of numerous comparable companies and the significant decline in stockmarket valuation of the sector, the declining financial condition of each company in which theCompany had invested, the unfavorable prospects of such companies obtaining additional funding andthe length of time and extent to which the quoted market values had been less than cost for publiclytraded companies. As a result, the Company recognized losses totaling $2.9 million to write off theCompany’s remaining investment in Kozmo.com, which was liquidated during fiscal 2001, and toreduce its investment in Liveworld, Inc. (previously known as Talk City, Inc.).
As of September 30, 2001, the Company had Internet-related investments with an aggregate fair value of$1.7 million.The Company plans to maintain its ownership of its remaining Internet-related investmentsand will continue to record them at their fair value.The Company intends to focus its future investmentactivity on its core businesses and other new business opportunities related to its core businesses.Income Taxes The Company’s effective tax rates of 37.3% in fiscal 2001 and 41.1% in fiscal 2000 were both impactedby the establishment of valuation allowances against deferred tax benefits resulting from Internet-related investment losses. Management determined that a portion of these losses may not be realizablefor tax purposes within the allowable carryforward period. Excluding the impact of these allowances,the effective tax rates would have been 37.0% and 37.6% in fiscal 2001 and 2000, respectively.Thedecrease to 37.0% in fiscal 2001 from 37.6% in fiscal 2000 was due to tax planning efforts.The effectivetax rate is expected to be 37.0% for fiscal 2002.
RESULTS OF OPERATIONS—FISCAL 2000 COMPARED TO FISCAL 1999
Systemwide Retail Store Sales Systemwide retail store sales were $2.3 billion for fiscal 2000 (52 weeks), an increase of 38% from $1.6billion in fiscal 1999 (53 weeks), primarily due to the opening of an additional 1,035 stores.
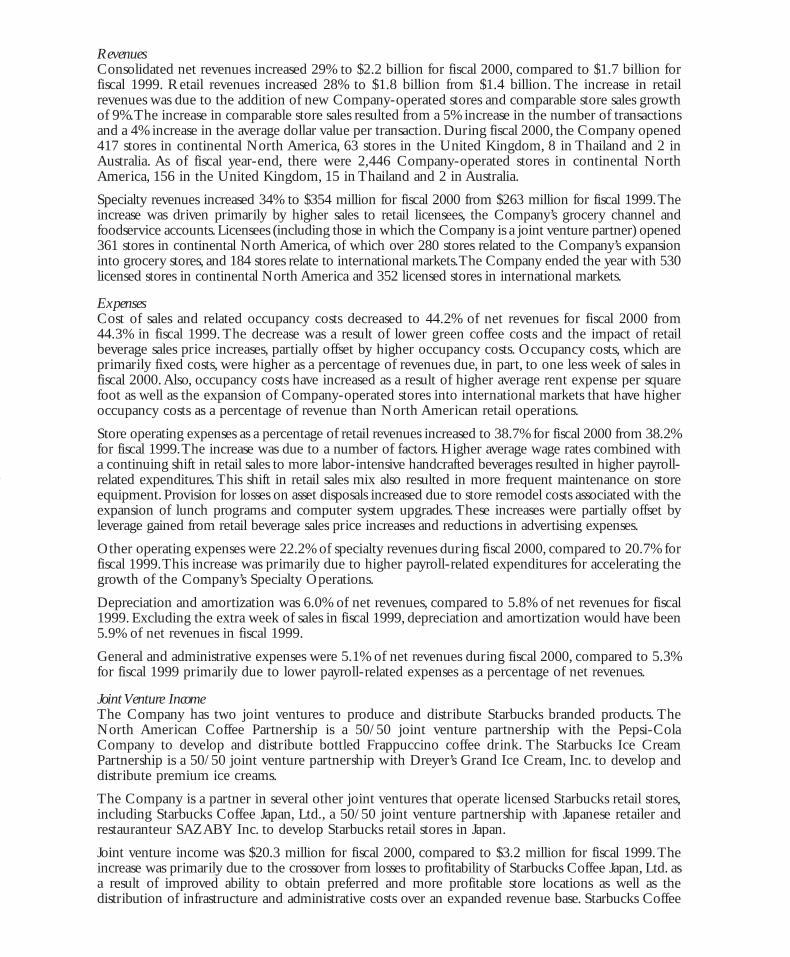
Revenues Consolidated net revenues increased 29% to $2.2 billion for fiscal 2000, compared to $1.7 billion forfiscal 1999. Retail revenues increased 28% to $1.8 billion from $1.4 billion. The increase in retailrevenues was due to the addition of new Company-operated stores and comparable store sales growthof 9%.The increase in comparable store sales resulted from a 5% increase in the number of transactionsand a 4% increase in the average dollar value per transaction. During fiscal 2000, the Company opened417 stores in continental North America, 63 stores in the United Kingdom, 8 in Thailand and 2 inAustralia. As of fiscal year-end, there were 2,446 Company-operated stores in continental NorthAmerica, 156 in the United Kingdom, 15 in Thailand and 2 in Australia.
Specialty revenues increased 34% to $354 million for fiscal 2000 from $263 million for fiscal 1999.Theincrease was driven primarily by higher sales to retail licensees, the Company’s grocery channel andfoodservice accounts.Licensees (including those in which the Company is a joint venture partner) opened361 stores in continental North America, of which over 280 stores related to the Company’s expansioninto grocery stores, and 184 stores relate to international markets.The Company ended the year with 530licensed stores in continental North America and 352 licensed stores in international markets.
Expenses Cost of sales and related occupancy costs decreased to 44.2% of net revenues for fiscal 2000 from44.3% in fiscal 1999.The decrease was a result of lower green coffee costs and the impact of retailbeverage sales price increases, partially offset by higher occupancy costs. Occupancy costs, which areprimarily fixed costs, were higher as a percentage of revenues due, in part, to one less week of sales infiscal 2000.Also, occupancy costs have increased as a result of higher average rent expense per squarefoot as well as the expansion of Company-operated stores into international markets that have higheroccupancy costs as a percentage of revenue than North American retail operations.
Store operating expenses as a percentage of retail revenues increased to 38.7% for fiscal 2000 from 38.2%for fiscal 1999.The increase was due to a number of factors. Higher average wage rates combined witha continuing shift in retail sales to more labor-intensive handcrafted beverages resulted in higher payroll-related expenditures.This shift in retail sales mix also resulted in more frequent maintenance on storeequipment.Provision for losses on asset disposals increased due to store remodel costs associated with theexpansion of lunch programs and computer system upgrades. These increases were partially offset byleverage gained from retail beverage sales price increases and reductions in advertising expenses.
Other operating expenses were 22.2% of specialty revenues during fiscal 2000, compared to 20.7% forfiscal 1999.This increase was primarily due to higher payroll-related expenditures for accelerating thegrowth of the Company’s Specialty Operations.
Depreciation and amortization was 6.0% of net revenues, compared to 5.8% of net revenues for fiscal1999. Excluding the extra week of sales in fiscal 1999, depreciation and amortization would have been5.9% of net revenues in fiscal 1999.
General and administrative expenses were 5.1% of net revenues during fiscal 2000, compared to 5.3%for fiscal 1999 primarily due to lower payroll-related expenses as a percentage of net revenues.
Joint Venture IncomeThe Company has two joint ventures to produce and distribute Starbucks branded products. TheNorth American Coffee Partnership is a 50/50 joint venture partnership with the Pepsi-ColaCompany to develop and distribute bottled Frappuccino coffee drink. The Starbucks Ice CreamPartnership is a 50/50 joint venture partnership with Dreyer’s Grand Ice Cream, Inc. to develop anddistribute premium ice creams.
The Company is a partner in several other joint ventures that operate licensed Starbucks retail stores,including Starbucks Coffee Japan, Ltd., a 50/50 joint venture partnership with Japanese retailer andrestauranteur SAZABY Inc. to develop Starbucks retail stores in Japan.
Joint venture income was $20.3 million for fiscal 2000, compared to $3.2 million for fiscal 1999.Theincrease was primarily due to the crossover from losses to profitability of Starbucks Coffee Japan, Ltd. asa result of improved ability to obtain preferred and more profitable store locations as well as thedistribution of infrastructure and administrative costs over an expanded revenue base. Starbucks Coffee
Fiscal 2001 Annual Report 25
Japan,Ltd. had 154 stores open as of October 1, 2000, compared to 82 stores open as of October 3, 1999.The increase was also due to the improved profitability of the North American Coffee Partnershipattributed to increased sales volume resulting from expansion of its product line and geographicdistribution, as well as improvements in cost of goods sold primarily due to manufacturing efficiencies.
Internet-related Investment LossesDuring fiscal 2000 and 1999, the Company made several minority investments in companies thatderive the majority of their revenue from Internet-related activities.
In fiscal 1999, the Company invested $8.0 million in Talk City, Inc. (“Talk City”), a publicly tradedinteractive online chat site. The Company also invested $20.3 million in living.com Inc.(“living.com”), an online furniture retailer. Also in fiscal 1999, the Company established an alliancewith Cooking.com, Inc. (“Cooking.com”), a privately held Web-based retailer of cookware,accessories and specialty foods and provider of information about cooking.As part of this alliance, theCompany made a $10.0 million investment in Cooking.com.
In the second quarter of fiscal 2000, the Company invested $25.0 million in Kozmo.com, an Internet-to-door delivery service for food, entertainment and convenience items. Starbucks and Kozmo.comalso entered into a commercial agreement to provide in-store return boxes in Starbucks stores inexchange for cash, a channel for selling the Company’s products and other marketing opportunities.In connection with this agreement, Starbucks received a $15.0 million payment that was recognizedas revenue on a straight-line basis over twelve months.
During the fourth quarter of fiscal 2000, the Company determined that its investments in Internet-related companies had suffered declines in value that were other than temporary because of thesustained weak condition of the Internet industry as reflected in the bankruptcy or liquidationproceedings of numerous comparable companies and the significant decline in stock market valuationof the sector, the declining financial condition of each company in which the Company had invested,the unfavorable prospects of such companies obtaining additional funding, and the length of time andextent to which the quoted market values had been less than cost for publicly traded companies.TheCompany determined the aggregate fair value for privately held investments by using a variety ofmethodologies, including comparing each security with securities of publicly traded companies insimilar lines of business, applying revenue multiples to estimated future operating results and estimatingdiscounted cash flows. Quoted market prices were used for publicly traded equity securities todetermine fair value. As a result, the Company recognized losses totaling $58.8 million to reduce itsinvestments in living.com,Talk City, Cooking.com and Kozmo.com to their aggregate fair value of$4.8 million as of October 1, 2000.
Income Taxes The Company’s effective tax rate for fiscal 2000 was 41.1% compared to 38.0% for fiscal 1999.Theincrease is due in part to the establishment of a valuation allowance against a portion of the deferredtax benefit resulting from Internet-related investment losses which management has determined mayultimately not be realizable for tax purposes.
Liquidity and Capital Resources
The Company ended fiscal 2001 with $220.5 million in cash and cash equivalents and short-terminvestments.Working capital as of September 30,2001, totaled $148.7 million compared to $146.6 millionat October 1, 2000. Cash and cash equivalents increased by $42.4 million during fiscal 2001 to $113.2million at September 30, 2001.This increase was in addition to an increase in short-term investments of$46.0 million during the same period.The Company intends to use its available cash resources to investin its core businesses and other new business opportunities related to its core businesses.
Cash provided by operating activities for fiscal 2001 totaled $460.8 million and resulted primarily fromnet earnings and non-cash charges of $381.4 million.The increase in accounts payable contributed$54.1 million primarily due to the timing of payments and the buildup of holiday inventory for alarger number of Company-operated stores.The increase in accrued taxes contributed $34.5 millionprimarily due to the extension of the deadline for quarterly income tax payments from September15, 2001, to October 1, 2001. In addition, the increase in accrued compensation and related costs
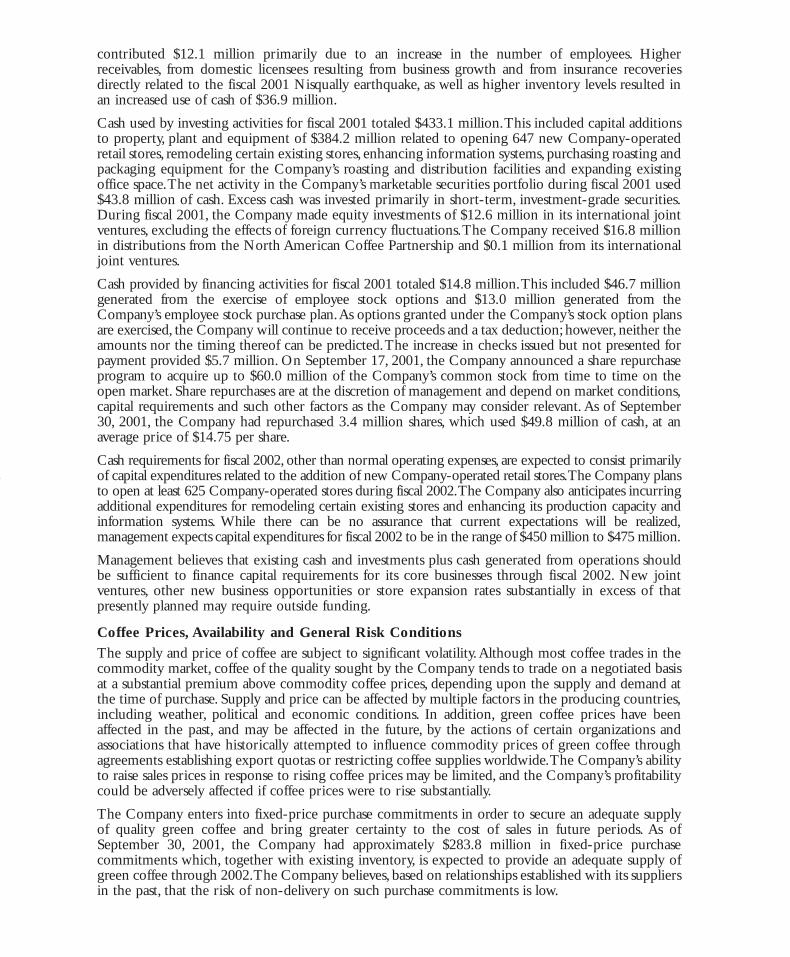
contributed $12.1 million primarily due to an increase in the number of employees. Higherreceivables, from domestic licensees resulting from business growth and from insurance recoveriesdirectly related to the fiscal 2001 Nisqually earthquake, as well as higher inventory levels resulted inan increased use of cash of $36.9 million.
Cash used by investing activities for fiscal 2001 totaled $433.1 million.This included capital additionsto property, plant and equipment of $384.2 million related to opening 647 new Company-operatedretail stores, remodeling certain existing stores, enhancing information systems, purchasing roasting andpackaging equipment for the Company’s roasting and distribution facilities and expanding existingoffice space.The net activity in the Company’s marketable securities portfolio during fiscal 2001 used$43.8 million of cash. Excess cash was invested primarily in short-term, investment-grade securities.During fiscal 2001, the Company made equity investments of $12.6 million in its international jointventures, excluding the effects of foreign currency fluctuations.The Company received $16.8 millionin distributions from the North American Coffee Partnership and $0.1 million from its internationaljoint ventures.
Cash provided by financing activities for fiscal 2001 totaled $14.8 million.This included $46.7 milliongenerated from the exercise of employee stock options and $13.0 million generated from theCompany’s employee stock purchase plan.As options granted under the Company’s stock option plansare exercised, the Company will continue to receive proceeds and a tax deduction; however, neither theamounts nor the timing thereof can be predicted.The increase in checks issued but not presented forpayment provided $5.7 million. On September 17, 2001, the Company announced a share repurchaseprogram to acquire up to $60.0 million of the Company’s common stock from time to time on theopen market. Share repurchases are at the discretion of management and depend on market conditions,capital requirements and such other factors as the Company may consider relevant. As of September30, 2001, the Company had repurchased 3.4 million shares, which used $49.8 million of cash, at anaverage price of $14.75 per share.
Cash requirements for fiscal 2002, other than normal operating expenses, are expected to consist primarilyof capital expenditures related to the addition of new Company-operated retail stores.The Company plansto open at least 625 Company-operated stores during fiscal 2002.The Company also anticipates incurringadditional expenditures for remodeling certain existing stores and enhancing its production capacity andinformation systems. While there can be no assurance that current expectations will be realized,management expects capital expenditures for fiscal 2002 to be in the range of $450 million to $475 million.
Management believes that existing cash and investments plus cash generated from operations shouldbe sufficient to finance capital requirements for its core businesses through fiscal 2002. New jointventures, other new business opportunities or store expansion rates substantially in excess of thatpresently planned may require outside funding.
Coffee Prices, Availability and General Risk Conditions
The supply and price of coffee are subject to significant volatility.Although most coffee trades in thecommodity market, coffee of the quality sought by the Company tends to trade on a negotiated basisat a substantial premium above commodity coffee prices, depending upon the supply and demand atthe time of purchase. Supply and price can be affected by multiple factors in the producing countries,including weather, political and economic conditions. In addition, green coffee prices have beenaffected in the past, and may be affected in the future, by the actions of certain organizations andassociations that have historically attempted to influence commodity prices of green coffee throughagreements establishing export quotas or restricting coffee supplies worldwide.The Company’s abilityto raise sales prices in response to rising coffee prices may be limited, and the Company’s profitabilitycould be adversely affected if coffee prices were to rise substantially.
The Company enters into fixed-price purchase commitments in order to secure an adequate supplyof quality green coffee and bring greater certainty to the cost of sales in future periods. As ofSeptember 30, 2001, the Company had approximately $283.8 million in fixed-price purchasecommitments which, together with existing inventory, is expected to provide an adequate supply ofgreen coffee through 2002.The Company believes, based on relationships established with its suppliersin the past, that the risk of non-delivery on such purchase commitments is low.
Fiscal 2001 Annual Report 27
In addition to fluctuating coffee prices, management believes that the Company’s future results ofoperations and earnings could be significantly impacted by other factors such as increased competitionwithin the specialty coffee industry, the Company’s ability to find optimal store locations at favorablelease rates, increased costs associated with opening and operating retail stores and the Company’scontinued ability to hire, train and retain qualified personnel.
Financial Risk Management
The Company is exposed to market risk related to foreign currency exchange rates, equity securityprices and changes in interest rates.
FOREIGN CURRENCY EXCHANGE RISKThe majority of the Company’s revenue, expense and capital purchasing activities are transacted inUnited States dollars. However, because a portion of the Company’s operations consists of activitiesoutside of the United States, the Company has transactions in other currencies, primarily the Canadiandollar, British pound and Japanese yen. As part of its risk management strategy, the Companyfrequently evaluates its foreign currency exchange risk by monitoring market data and external factorsthat may influence exchange rate fluctuations. As a result, the Company may engage in transactionsinvolving various derivative instruments, with maturities generally not exceeding five years, to hedgeassets, liabilities, revenues and purchases denominated in foreign currencies. During fiscal 2001, theCompany entered into forward foreign exchange contracts that qualify as cash flow hedges underStatement of Financial Accounting Standards No. 133, “Accounting for Derivative Instruments andHedging Activities,” to hedge a portion of anticipated international revenue. In addition, the Companyentered into a forward foreign exchange contract that qualifies as a hedge of a net investment in aforeign operation.These contracts expire within 14 months.
EQUITY SECURITY PRICE RISKThe Company has minimal exposure to price fluctuations on equity mutual funds within the tradingportfolio. The trading securities are designated to approximate the Company’s liability under theManagement Deferred Compensation Plan (“MDCP”). A corresponding liability is included in“Accrued compensation and related costs” on the accompanying consolidated balance sheets.Theseinvestments are recorded at fair value with unrealized gains and losses recognized in “Interest andother income, net.” The offsetting changes in the MDCP liability are recorded in “General andadministrative expenses” on the accompanying consolidated statements of earnings.
The Company also has an equity investment in a privately held company, Cooking.com, which is stillin the development stage. The Company could lose its entire investment because this type of companyis inherently risky.The investment is recorded on the accompanying consolidated balance sheet at afair value of $1.6 million as of September 30, 2001.
INTEREST RATE RISKThe Company’s diversified available-for-sale portfolio consists mainly of fixed income instruments.The primary objectives of these investments are to preserve capital and liquidity. Available-for-salesecurities are of investment grade and are recorded on the balance sheet at fair value with unrealizedgains and losses reported as a separate component of accumulated other comprehensive gain/loss.TheCompany does not hedge its interest rate exposure.
Seasonality and Quarterly Results
The Company’s business is subject to seasonal fluctuations. Significant portions of the Company’s netrevenues and profits are realized during the first quarter of the Company’s fiscal year, which includesthe December holiday season. In addition, quarterly results are affected by the timing of the openingof new stores, and the Company’s rapid growth may conceal the impact of other seasonal influences.Because of the seasonality of the Company’s business, results for any quarter are not necessarilyindicative of the results that may be achieved for the full fiscal year.
New Accounting Standards
In September 2000, the Emerging Issues Task Force (“EITF”) reached a consensus regarding Issue No.00-10, “Accounting for Shipping and Handling Fees and Costs,” which requires any shipping andhandling costs billed to customers in a sale transaction to be classified as revenue. The Company
adopted Issue No. 00-10 on October 2, 2000, and restated all prior period disclosures. Issue No. 00-10 did not have a material impact on the Company’s consolidated financial statements.
In July 2001, the Financial Accounting Standards Board (“FASB”) issued Statement of FinancialAccounting Standards (“SFAS”) No. 141,“Business Combinations,” and SFAS No. 142,“Goodwill andOther Intangible Assets.” SFAS No. 141 requires the use of the purchase method of accounting forbusiness combinations initiated after June 30,2001,and eliminates the pooling-of-interests method.SFASNo. 142 requires, among other things, the use of a nonamortization approach for purchased goodwilland certain intangibles. Under a nonamortization approach, goodwill and certain intangibles will not beamortized into earnings, but instead will be reviewed for impairment at least annually.The Companywill adopt SFAS No. 142 effective September 30, 2002. The Company’s management has not yetdetermined the impact of adoption on its consolidated financial position and results of operations.As ofSeptember 30, 2001, the Company had goodwill and other intangible assets, net of accumulatedamortization, of $21.8 million and $7.7 million, respectively, which would be subject to the transitionalassessment provisions of SFAS No. 142.Amortization expense related to goodwill and other intangibleassets was $3.0 million for the fiscal year ended September 30, 2001.
In June 2001, the FASB issued SFAS No. 143,“Accounting for Asset Retirement Obligations.” SFASNo. 143 requires that the fair value of a liability for an asset retirement obligation be recognized inthe period in which it is incurred if a reasonable estimate of fair value can be made.The associatedasset retirement costs are capitalized as part of the carrying amount of the long-lived asset. TheCompany will adopt SFAS No. 143 effective September 30, 2002, and does not expect it to have amaterial impact on the Company’s consolidated results of operations, financial position or cash flows.
In August 2001, the FASB issued SFAS No.144,“Accounting for the Impairment or Disposal of Long-Lived Assets,” which supercedes SFAS No. 121,“Accounting for the Impairment of Long-Lived Assetsand for Long-Lived Assets to Be Disposed Of.” SFAS No. 144 retains the fundamental provisions ofSFAS No. 121 but sets forth new criteria for asset classification and broadens the scope of qualifyingdiscontinued operations. The Company will adopt SFAS No. 144 as of September 30, 2002. TheCompany’s management has not yet determined the impact of adoption on its consolidated financialposition and results of operations.
In September 2001, the EITF reached a consensus regarding Issue No. 01-10, “Accounting for theImpact of the Terrorist Attacks of September 11, 2001,” which requires that losses and other costsincurred as a result of the September 11, 2001, events be classified as part of income from continuingoperations in the statement of operations. Additionally, certain disclosures are required in all periodsaffected. As a result of the events of September 11, 2001, the Company closed its North AmericanCompany-operated retail stores and other North American facilities for the remainder of that day.None of the Company’s employees were injured, and the Company did not sustain significant propertyloss or incur significant costs as a result of the attacks. However, the aftermath of these events, togetherwith the slowing economy, have had a moderately negative impact on the Company’s SpecialtyOperations, which derives approximately 9.0% of its revenue from the travel and hospitality industries.At this time, management believes that the events of September 11, 2001, will not have a materialimpact on the Company’s financial position, results of operations or cash flows in fiscal 2002.
Subsequent Events
On October 10, 2001, the Company sold 30,000 of its shares of Starbucks Coffee Japan, Ltd.(“Starbucks Japan”) at approximately $495.00 per share, net of related costs. In connection with thissale, the Company received cash proceeds of $15 million. The Company’s ownership interest inStarbucks Japan was reduced from 50.0% to 47.5% following the sale of the aforementioned shares.The Company recorded a gain from this sale of $13 million.
Also on October 10, 2001, Starbucks Japan issued and sold 220,000 shares of common stock atapproximately $495.00 per share, net of related costs, in an initial public offering in Japan. Inconnection with this offering, the Company’s ownership interest in Starbucks Japan was reduced from47.5% to 40.1%.The Company recorded a credit to shareholders’ equity of $39 million, reflecting theincrease in value of its share of the net assets of Starbucks Japan related to the stock offering.
Fiscal 2001 Annual Report 29
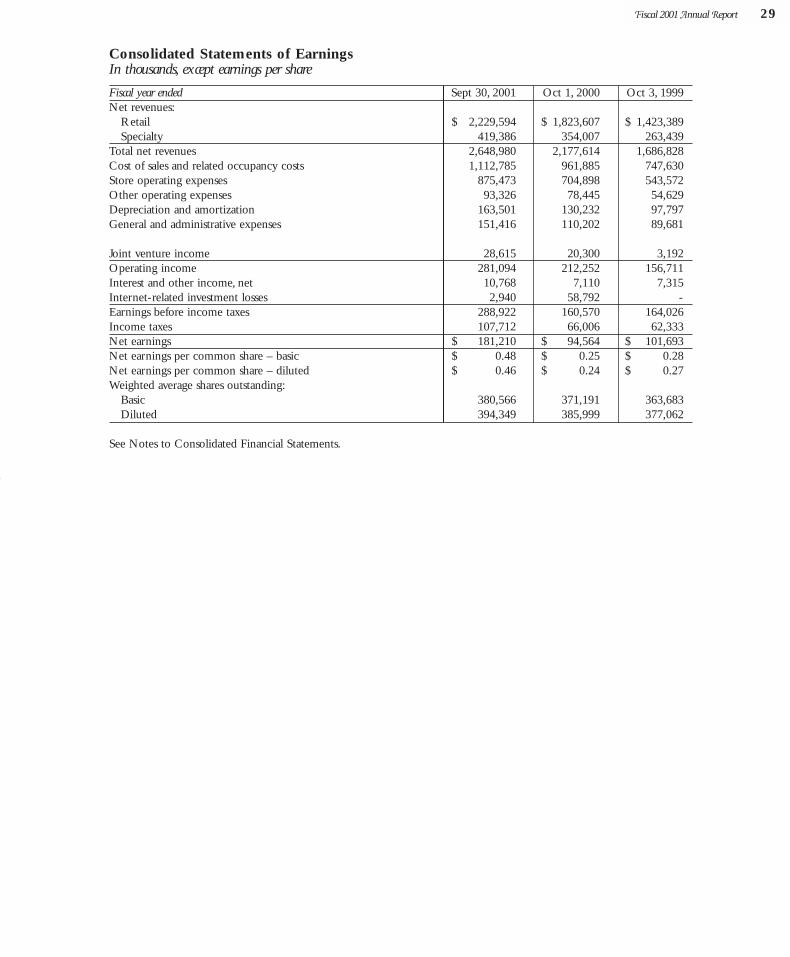
Consolidated Statements of Earnings In thousands, except earnings per share
Fiscal year ended Sept 30, 2001 Oct 1, 2000 Oct 3, 1999Net revenues:
Retail $ 2,229,594 $ 1,823,607 $ 1,423,389Specialty 419,386 354,007 263,439
Total net revenues 2,648,980 2,177,614 1,686,828Cost of sales and related occupancy costs 1,112,785 961,885 747,630Store operating expenses 875,473 704,898 543,572Other operating expenses 93,326 78,445 54,629Depreciation and amortization 163,501 130,232 97,797General and administrative expenses 151,416 110,202 89,681
Joint venture income 28,615 20,300 3,192Operating income 281,094 212,252 156,711Interest and other income, net 10,768 7,110 7,315Internet-related investment losses 2,940 58,792 -Earnings before income taxes 288,922 160,570 164,026Income taxes 107,712 66,006 62,333Net earnings $ 181,210 $ 94,564 $ 101,693Net earnings per common share – basic $ 0.48 $ 0.25 $ 0.28Net earnings per common share – diluted $ 0.46 $ 0.24 $ 0.27Weighted average shares outstanding:
Basic 380,566 371,191 363,683Diluted 394,349 385,999 377,062
See Notes to Consolidated Financial Statements.
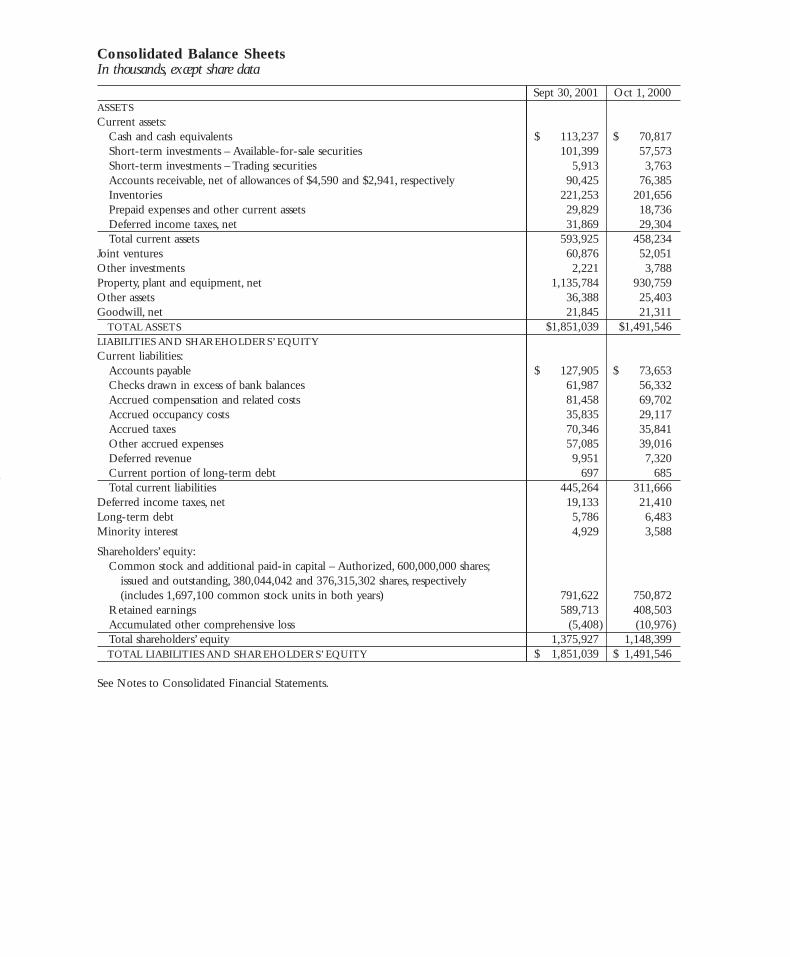
Consolidated Balance SheetsIn thousands, except share data
Sept 30, 2001 Oct 1, 2000ASSETSCurrent assets:
Cash and cash equivalents $ 113,237 $ 70,817Short-term investments – Available-for-sale securities 101,399 57,573Short-term investments – Trading securities 5,913 3,763Accounts receivable, net of allowances of $4,590 and $2,941, respectively 90,425 76,385Inventories 221,253 201,656Prepaid expenses and other current assets 29,829 18,736Deferred income taxes, net 31,869 29,304Total current assets 593,925 458,234
Joint ventures 60,876 52,051Other investments 2,221 3,788Property, plant and equipment, net 1,135,784 930,759Other assets 36,388 25,403Goodwill, net 21,845 21,311
TOTAL ASSETS $1,851,039 $1,491,546LIABILITIES AND SHAREHOLDERS’ EQUITYCurrent liabilities:
Accounts payable $ 127,905 $ 73,653Checks drawn in excess of bank balances 61,987 56,332Accrued compensation and related costs 81,458 69,702Accrued occupancy costs 35,835 29,117Accrued taxes 70,346 35,841Other accrued expenses 57,085 39,016Deferred revenue 9,951 7,320Current portion of long-term debt 697 685Total current liabilities 445,264 311,666
Deferred income taxes, net 19,133 21,410Long-term debt 5,786 6,483Minority interest 4,929 3,588
Shareholders’ equity:Common stock and additional paid-in capital – Authorized, 600,000,000 shares;
issued and outstanding, 380,044,042 and 376,315,302 shares, respectively(includes 1,697,100 common stock units in both years) 791,622 750,872
Retained earnings 589,713 408,503Accumulated other comprehensive loss (5,408) (10,976)Total shareholders’ equity 1,375,927 1,148,399TOTAL LIABILITIES AND SHAREHOLDERS’ EQUITY $ 1,851,039 $ 1,491,546
See Notes to Consolidated Financial Statements.
Fiscal 2001 Annual Report 31
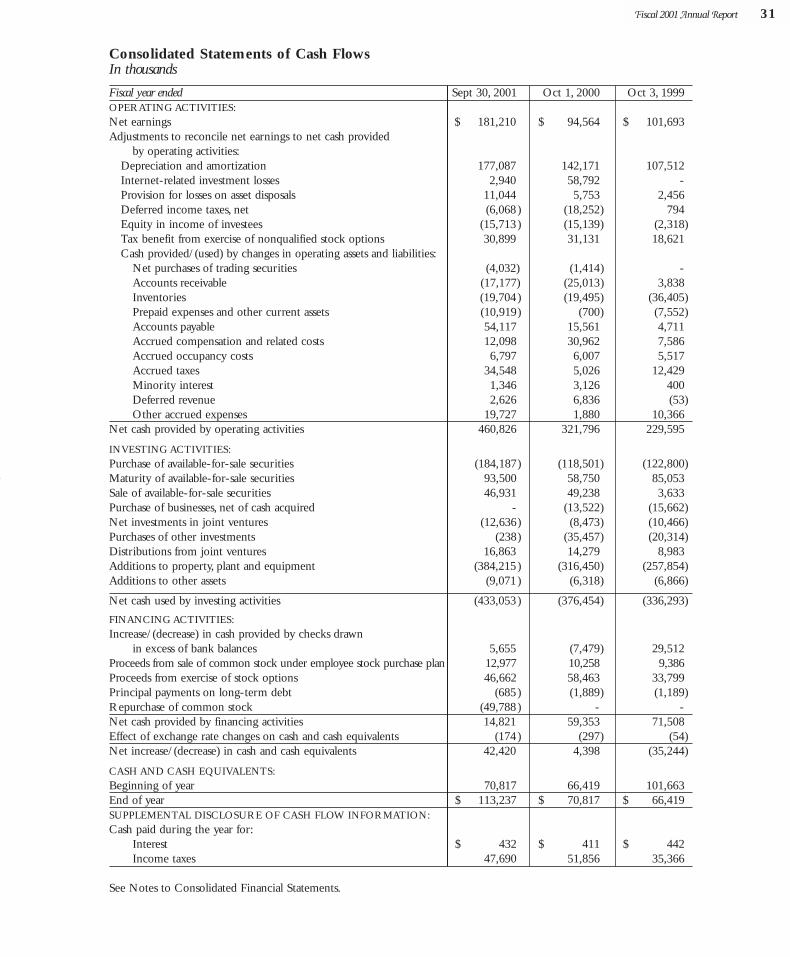
Consolidated Statements of Cash FlowsIn thousands
Fiscal year ended Sept 30, 2001 Oct 1, 2000 Oct 3, 1999OPERATING ACTIVITIES:Net earnings $ 181,210 $ 94,564 $ 101,693Adjustments to reconcile net earnings to net cash provided
by operating activities:Depreciation and amortization 177,087 142,171 107,512Internet-related investment losses 2,940 58,792 -Provision for losses on asset disposals 11,044 5,753 2,456Deferred income taxes, net (6,068) (18,252) 794Equity in income of investees (15,713) (15,139) (2,318)Tax benefit from exercise of nonqualified stock options 30,899 31,131 18,621Cash provided/(used) by changes in operating assets and liabilities:
Net purchases of trading securities (4,032) (1,414) -Accounts receivable (17,177) (25,013) 3,838Inventories (19,704) (19,495) (36,405)Prepaid expenses and other current assets (10,919) (700) (7,552)Accounts payable 54,117 15,561 4,711Accrued compensation and related costs 12,098 30,962 7,586Accrued occupancy costs 6,797 6,007 5,517Accrued taxes 34,548 5,026 12,429Minority interest 1,346 3,126 400Deferred revenue 2,626 6,836 (53)Other accrued expenses 19,727 1,880 10,366
Net cash provided by operating activities 460,826 321,796 229,595
INVESTING ACTIVITIES:Purchase of available-for-sale securities (184,187) (118,501) (122,800)Maturity of available-for-sale securities 93,500 58,750 85,053Sale of available-for-sale securities 46,931 49,238 3,633Purchase of businesses, net of cash acquired - (13,522) (15,662)Net investments in joint ventures (12,636) (8,473) (10,466)Purchases of other investments (238) (35,457) (20,314)Distributions from joint ventures 16,863 14,279 8,983Additions to property, plant and equipment (384,215) (316,450) (257,854)Additions to other assets (9,071) (6,318) (6,866)
Net cash used by investing activities (433,053) (376,454) (336,293)
FINANCING ACTIVITIES:Increase/(decrease) in cash provided by checks drawn
in excess of bank balances 5,655 (7,479) 29,512Proceeds from sale of common stock under employee stock purchase plan 12,977 10,258 9,386Proceeds from exercise of stock options 46,662 58,463 33,799Principal payments on long-term debt (685) (1,889) (1,189)Repurchase of common stock (49,788) - -Net cash provided by financing activities 14,821 59,353 71,508Effect of exchange rate changes on cash and cash equivalents (174) (297) (54)Net increase/(decrease) in cash and cash equivalents 42,420 4,398 (35,244)
CASH AND CASH EQUIVALENTS:Beginning of year 70,817 66,419 101,663End of year $ 113,237 $ 70,817 $ 66,419SUPPLEMENTAL DISCLOSURE OF CASH FLOW INFORMATION:Cash paid during the year for:
Interest $ 432 $ 411 $ 442Income taxes 47,690 51,856 35,366
See Notes to Consolidated Financial Statements.
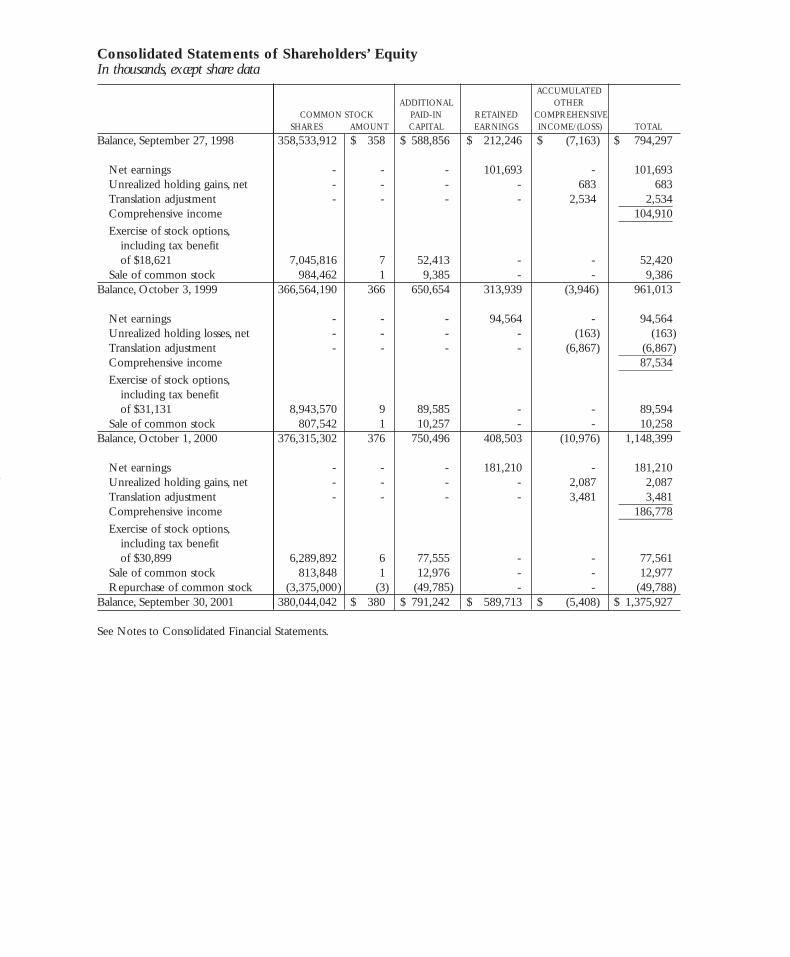
Consolidated Statements of Shareholders’ EquityIn thousands, except share data
ACCUMULATEDADDITIONAL OTHER
COMMON STOCK PAID-IN RETAINED COMPREHENSIVESHARES AMOUNT CAPITAL EARNINGS INCOME/(LOSS) TOTAL
Balance, September 27, 1998 358,533,912 $ 358 $ 588,856 $ 212,246 $ (7,163) $ 794,297
Net earnings - - - 101,693 - 101,693Unrealized holding gains, net - - - - 683 683Translation adjustment - - - - 2,534 2,534_________Comprehensive income 104,910_________Exercise of stock options,
including tax benefitof $18,621 7,045,816 7 52,413 - - 52,420
Sale of common stock 984,462 1 9,385 - - 9,386Balance, October 3, 1999 366,564,190 366 650,654 313,939 (3,946) 961,013
Net earnings - - - 94,564 - 94,564Unrealized holding losses, net - - - - (163) (163)Translation adjustment - - - - (6,867) (6,867)_________Comprehensive income 87,534_________Exercise of stock options,
including tax benefit of $31,131 8,943,570 9 89,585 - - 89,594
Sale of common stock 807,542 1 10,257 - - 10,258Balance, October 1, 2000 376,315,302 376 750,496 408,503 (10,976) 1,148,399
Net earnings - - - 181,210 - 181,210Unrealized holding gains, net - - - - 2,087 2,087Translation adjustment - - - - 3,481 3,481_________Comprehensive income 186,778_________Exercise of stock options,
including tax benefit of $30,899 6,289,892 6 77,555 - - 77,561
Sale of common stock 813,848 1 12,976 - - 12,977Repurchase of common stock (3,375,000) (3) (49,785) - - (49,788)
Balance, September 30, 2001 380,044,042 $ 380 $ 791,242 $ 589,713 $ (5,408) $ 1,375,927
See Notes to Consolidated Financial Statements.
Fiscal 2001 Annual Report 33
Notes to Consolidated Financial StatementsYears ended September 30, 2001, October 1, 2000, and October 3, 1999
Note 1: Summary of Significant Accounting Policies
DESCRIPTION OF BUSINESS Starbucks Corporation (together with its subsidiaries, “Starbucks” or the “Company”) purchases androasts high-quality whole bean coffees and sells them, along with fresh, rich-brewed coffees, Italian-style espresso beverages, cold blended beverages, a variety of pastries and confections, coffee-relatedaccessories and equipment, a selection of premium teas and a line of compact discs primarily throughits Company-operated retail stores. In addition to sales through its Company-operated retail stores,Starbucks sells coffee and tea products through other channels of distribution including the BusinessAlliances business unit and other specialty operations (collectively,“Specialty Operations”). Starbucks,through its joint venture partnerships, also produces and sells bottled Frappuccino® coffee drink anda line of premium ice creams.The Company’s objective is to establish Starbucks as the most recognizedand respected brand in the world. To achieve this goal, the Company plans to continue to rapidlyexpand its retail operations, grow its Specialty Operations and selectively pursue other opportunitiesto leverage the Starbucks brand through the introduction of new products and the development ofnew distribution channels.
PRINCIPLES OF CONSOLIDATION The consolidated financial statements reflect the financial position and operating results of Starbucks,its subsidiaries and investments in joint ventures in which the Company has significant control. Allsignificant intercompany transactions have been eliminated.
The Company has investments in unconsolidated joint ventures that are accounted for under theequity method, as the Company does not exercise control over the operating and financial policies ofsuch joint ventures.The Company also has other investments that are accounted for under the costmethod.
FISCAL YEAR-END The Company’s fiscal year ends on the Sunday closest to September 30. The fiscal years endedSeptember 30, 2001, and October 1, 2000, each included 52 weeks.The fiscal year ended October 3,1999, included 53 weeks.
ESTIMATES AND ASSUMPTIONS The preparation of financial statements in conformity with accounting principles generally acceptedin the United States of America requires management to make estimates and assumptions that affectthe reported amounts of assets, liabilities, revenues and expenses. Actual results may differ from theseestimates.
CASH AND CASH EQUIVALENTS The Company considers all highly liquid instruments with a maturity of three months or less at thetime of purchase to be cash equivalents.
CASH MANAGEMENT The Company’s cash management system provides for the reimbursement of all major bankdisbursement accounts on a daily basis. Checks issued but not presented for payment to the bank arereflected as “Checks drawn in excess of bank balances” on the accompanying consolidated financialstatements.
SHORT-TERM INVESTMENTS The Company’s investments consist primarily of investment-grade marketable debt and equitysecurities as well as bond and equity mutual funds, all of which are classified as trading or available-for-sale.Trading securities are recorded at fair value with unrealized holding gains and losses includedin earnings. Available-for-sale securities are recorded at fair value, and unrealized holding gains andlosses are recorded, net of tax, as a separate component of accumulated other comprehensive income.Unrealized losses are charged against net earnings when a decline in fair value is determined to beother than temporary. Realized gains and losses are accounted for on the specific identificationmethod. Purchases and sales are recorded on a trade date basis.
OTHER INVESTMENTSThe Company has investments in privately held equity securities that are recorded at their estimatedfair values.
FAIR VALUE OF FINANCIAL INSTRUMENTS The carrying value of cash and cash equivalents approximates fair value because of the short-termmaturity of those instruments.The fair value of the Company’s investments in marketable debt andequity securities as well as bond and equity mutual funds is based upon the quoted market price onthe last business day of the fiscal year.The fair value and amortized cost of the Company’s short-terminvestments at September 30, 2001, were $107.3 million and $107.7 million, respectively. Thefair value and amortized cost of the Company’s short-term investments at October 1, 2000, were$61.3 million and $61.0 million, respectively.
For equity securities of companies that are privately held, or where an observable quoted market pricedoes not exist, the Company estimates fair value using a variety of valuation methodologies. Suchmethodologies include comparing the security with securities of publicly traded companies in similarlines of business, applying revenue multiples to estimated future operating results for the privatecompany and estimating discounted cash flows for that company. For further information oninvestments, see Notes 4 and 8.The carrying value of long-term debt approximates fair value.
INVENTORIES Inventories are stated at the lower of cost (primarily moving average cost) or market.
PROPERTY, PLANT AND EQUIPMENT Property, plant and equipment are carried at cost less accumulated depreciation and amortization.Depreciation of property, plant and equipment, which includes amortization of assets under capitalleases, is provided on the straight-line method over estimated useful lives, generally ranging from twoto seven years for equipment and 30 to 40 years for buildings. Leasehold improvements are amortizedover the shorter of their estimated useful lives or the related lease life, generally ten years.The portionof depreciation expense related to production and distribution facilities is included in “Cost of salesand related occupancy costs” on the accompanying consolidated statements of earnings.
GOODWILL Goodwill resulting from business acquisitions represents the excess purchase price paid over net assetsof businesses acquired and is amortized on a straight-line basis over the period of expected benefit,which ranges from ten to twenty years.
LONG-LIVED ASSETS When facts and circumstances indicate that the carrying values of long-lived assets, includingintangibles, may be impaired, an evaluation of recoverability is performed by comparing the carryingvalue of the assets to projected future cash flows in addition to other quantitative and qualitativeanalyses. Upon indication that the carrying value of such assets may not be recoverable, the Companyrecognizes an impairment loss by a charge against current operations. Property, plant and equipmentassets are grouped at the lowest level for which there are identifiable cash flows when assessingimpairment. Cash flows for retail assets are identified at the individual store level.
REVENUE RECOGNITIONRetail store revenues are recognized when payment is tendered at the point of sale. Specialty revenues,consisting mainly of product sales, are generally recognized upon shipment to customers. Initial non-refundable fees required under licensing agreements are earned upon substantial performance ofservices. Royalty revenues based upon a percentage of sales and other continuing fees are recognizedwhen earned.All revenues are recognized net of any discounts.
ADVERTISING The Company expenses costs of advertising the first time the advertising campaign takes place, exceptfor direct-to-consumer advertising, which is capitalized and amortized over its expected period offuture benefit, generally six to twelve months. Net capitalized direct-to-consumer advertising costswere $0.9 million and $0.2 million as of September 30, 2001, and October 1, 2000, respectively, andare included in “Prepaid expenses and other current assets” on the accompanying consolidated balancesheets. Total advertising expenses, recorded in “Store operating expenses” and “Other operating
Fiscal 2001 Annual Report 35
expenses,” on the accompanying consolidated statements of earnings were $28.8 million, $32.6 millionand $38.4 million in 2001, 2000 and 1999, respectively.
STORE PREOPENING EXPENSES Costs incurred in connection with the start-up and promotion of new store openings are expensed asincurred.
RENT EXPENSE Certain of the Company’s lease agreements provide for scheduled rent increases during the lease termsor for rental payments commencing at a date other than the date of initial occupancy. Minimum rentalexpenses are recognized on a straight-line basis over the terms of the leases.
FOREIGN CURRENCY TRANSLATION The Company’s international operations use their local currency as their functional currency. Assetsand liabilities are translated at exchange rates in effect at the balance sheet date. Income and expenseaccounts are translated at the average monthly exchange rates during the year. Resulting translationadjustments are recorded as a separate component of accumulated other comprehensive income.
INCOME TAXES The Company computes income taxes using the asset and liability method, under which deferredincome taxes are provided for the temporary differences between the financial reporting basis and thetax basis of the Company’s assets and liabilities.
STOCK SPLIT On April 27, 2001, the Company effected a two-for-one stock split of its $0.001 par value commonstock for holders of record on March 30, 2001. All applicable share and per-share data in theseconsolidated financial statements have been restated to give effect to this stock split.
EARNINGS PER SHARE The computation of basic earnings per share is based on the weighted average number of shares andcommon stock units outstanding during the period.The computation of diluted earnings per shareincludes the dilutive effect of common stock equivalents consisting of certain shares subject to stockoptions.
RECENT ACCOUNTING PRONOUNCEMENTS In September 2000, the Emerging Issues Task Force (“EITF”) reached a consensus regarding Issue No.00-10, “Accounting for Shipping and Handling Fees and Costs,” which requires any shipping andhandling costs billed to customers in a sale transaction to be classified as revenue. The Companyadopted Issue No. 00-10 on October 2, 2000, and restated all prior period disclosures. Issue No. 00-10 did not have a material impact on the Company’s consolidated financial statements.
In July 2001, the Financial Accounting Standards Board (“FASB”) issued Statement of FinancialAccounting Standards (“SFAS”) No. 141,“Business Combinations,” and SFAS No. 142,“Goodwill andOther Intangible Assets.” SFAS No. 141 requires the use of the purchase method of accounting forbusiness combinations initiated after June 30,2001,and eliminates the pooling-of-interests method.SFASNo. 142 requires, among other things, the use of a nonamortization approach for purchased goodwilland certain intangibles. Under a nonamortization approach, goodwill and certain intangibles will not beamortized into earnings, but instead will be reviewed for impairment at least annually.The Companywill adopt SFAS No. 142 effective September 30, 2002. The Company’s management has not yetdetermined the impact of adoption on its consolidated financial position and results of operations.As ofSeptember 30, 2001, the Company had goodwill and other intangible assets, net of accumulatedamortization, of $21.8 million and $7.7 million, respectively, which would be subject to the transitionalassessment provisions of SFAS No. 142.Amortization expense related to goodwill and other intangibleassets was $3.0 million for the fiscal year ended September 30, 2001.
In June 2001, the FASB issued SFAS No. 143,“Accounting for Asset Retirement Obligations.” SFASNo. 143 requires that the fair value of a liability for an asset retirement obligation be recognized inthe period in which it is incurred if a reasonable estimate of fair value can be made.The associatedasset retirement costs are capitalized as part of the carrying amount of the long-lived asset. TheCompany will adopt SFAS No. 143 effective September 30, 2002, and does not expect it to have amaterial impact on the Company’s consolidated results of operations, financial position or cash flows.
In August 2001, the FASB issued SFAS No.144,“Accounting for the Impairment or Disposal of Long-Lived Assets,” which supercedes SFAS No. 121,“Accounting for the Impairment of Long-Lived Assetsand for Long-Lived Assets to Be Disposed Of.” SFAS No. 144 retains the fundamental provisions ofSFAS No. 121 but sets forth new criteria for asset classification and broadens the scope of qualifyingdiscontinued operations. The Company will adopt SFAS No. 144 as of September 30, 2002. TheCompany’s management has not yet determined the impact of adoption on its consolidated financialposition and results of operations.
In September 2001, the EITF reached a consensus regarding Issue No. 01-10, “Accounting for theImpact of the Terrorist Attacks of September 11, 2001,” which requires that losses and other costsincurred as a result of the September 11, 2001, events be classified as part of income from continuingoperations in the statement of operations. Additionally, certain disclosures are required in all periodsaffected. As a result of the events of September 11, 2001, the Company closed its North AmericanCompany-operated retail stores and other North American facilities for the remainder of that day.None of the Company’s employees were injured, and the Company did not sustain significant propertyloss or incur significant costs as a result of the attacks. However, the aftermath of these events, togetherwith the slowing economy, have had a moderately negative impact on the Company’s SpecialtyOperations, which derives approximately 9.0% of its revenue from the travel and hospitality industries.At this time, management believes that the events of September 11, 2001, will not have a materialimpact on the Company’s financial position, results of operations or cash flows in fiscal 2002.
RECLASSIFICATIONS Certain reclassifications of prior years’ balances have been made to conform to the fiscal 2001presentation.
Note 2: Business Combinations
During fiscal 2000, Starbucks acquired the outstanding stock of Tympanum, Inc. (d/b/a “HearMusic”), a music retailer, and of Coffee Partners Co. Ltd., the company licensed to operate Starbucksstores in Thailand.The combined purchase price for these two acquisitions was $14.1 million. Duringfiscal 1999, Starbucks acquired the net assets of Tazo, L.L.C., a Portland, Oregon-based tea companythat produces premium tea products, and Pasqua Inc., a San Francisco, California-based roaster andretailer of specialty coffee.The combined purchase price for these two acquisitions was $16.5 million.All of the above acquisitions were accounted for under the purchase method of accounting. Resultsof operations of the acquired companies are included on the accompanying consolidated financialstatements from the dates of acquisition.
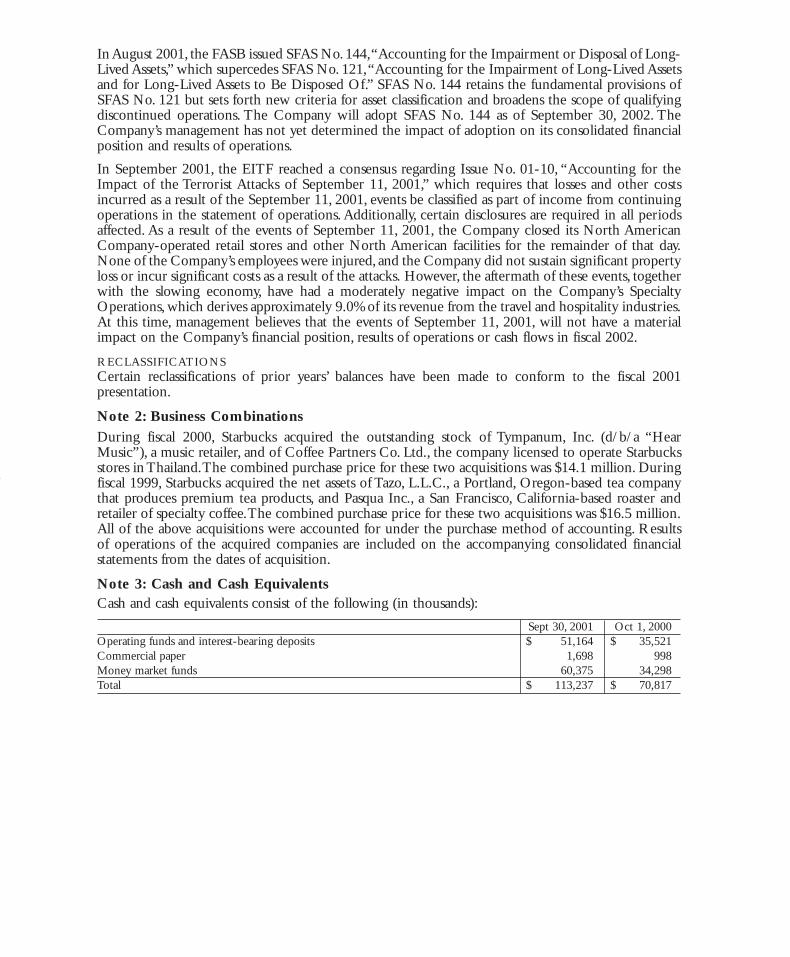
Note 3: Cash and Cash EquivalentsCash and cash equivalents consist of the following (in thousands):
Sept 30, 2001 Oct 1, 2000Operating funds and interest-bearing deposits $ 51,164 $ 35,521Commercial paper 1,698 998Money market funds 60,375 34,298Total $ 113,237 $ 70,817

Fiscal 2001 Annual Report 37
Note 4: Short-term InvestmentsThe Company’s investments consist of the following (in thousands):
GROSS GROSSUNREALIZED UNREALIZED
FAIR AMORTIZED HOLDING HOLDINGSeptember 30, 2001: VALUE COST GAINS LOSSESShort-term investments – available-for-sale securities:
U.S. Government obligations $ 2,017 $ 1,999 $ 18 $ -Mutual funds 99,332 98,000 1,332 -Marketable equity securities 50 250 - (200)
Total $ 101,399 $ 100,249 $ 1,350 $ (200)Short-term investments – trading securities 5,913_________Total short-term investments $ 107,312
GROSS GROSSUNREALIZED UNREALIZED
FAIR AMORTIZED HOLDING HOLDINGOctober 1, 2000: VALUE COST GAINS LOSSESShort-term investments – available-for-sale securities:
U.S. Government obligations $ 10,990 $ 10,996 $ 3 $ (9)Commercial paper 45,356 45,373 1 (18)Marketable equity securities 1,227 1,227 - -
Total $ 57,573 $ 57,596 $ 4 $ (27)Short-term investments – trading securities 3,763_________Total short-term investments $ 61,336
Available-for-sale securities with remaining maturities of one year or less are classified as short-terminvestments. Securities with remaining maturities longer than one year are classified as long-term andare included in the line item “Other investments”on the accompanying consolidated balance sheets.Thespecific identification method is used to determine a cost basis for computing realized gains and losses.
In fiscal 2001, 2000 and 1999,proceeds from the sale of investment securities were $46.9 million, $49.2million and $3.6 million, respectively. Gross realized gains and losses from the sale of securities werenot material in 2001, 2000 and 1999.
During fiscal 2001 and 2000, the Company recognized losses of $0.9 million and $6.8 million,respectively, on its investment in the common stock of Liveworld, Inc. (previously known as Talk City,Inc.), due to impairments that were determined by management to be other than temporary. Theremaining fair value of the investment was $50 thousand as of September 30, 2001, and $1.2 millionas of October 1, 2000.
Trading securities are classified as short-term investments.The trading securities are comprised mainlyof marketable equity mutual funds designated to approximate the Company’s liability under theManagement Deferred Compensation Plan. The corresponding deferred compensation liability of$6.0 million in fiscal 2001 and $3.8 million in fiscal 2000 is included in “Accrued compensation andrelated costs” on the accompanying consolidated balance sheets. In fiscal 2001 and fiscal 2000, thechange in net unrealized holding gains or (losses) in the trading portfolio included in earnings were($1.9) million and $0.3 million, respectively. Gross gains included in earnings associated with thetransfer of securities from the available-for-sale category to the trading category were $0.5 million infiscal 2000.
Note 5: Derivative Financial Instruments
The Company manages its exposure to foreign currency risk within the consolidated financialstatements according to a hedging policy. Under the policy, the Company may engage in transactionsinvolving various derivative instruments with maturities generally not longer than five years, to hedgeassets, liabilities, revenues and purchases denominated in foreign currencies.
On October 2, 2000, the Company adopted SFAS No. 133,“Accounting for Derivative Instrumentsand Hedging Activities,” as amended and interpreted, which requires that all derivatives be recorded
on the balance sheet at fair value.The accounting for changes in the fair value of derivative instrumentsdepends on the intended use and resulting designation.The Company designates its derivatives basedupon the criteria established by SFAS No. 133. For a derivative designated as a fair value hedge, thegain or loss generated from the change in fair value is recognized in earnings in the period of changetogether with the offsetting loss or gain on the hedged item. For a derivative designated as a cash flowhedge, the effective portion of the derivative’s gain or loss is initially reported as a component of othercomprehensive income (“OCI”) and subsequently reclassified into earnings when the hedgedexposure affects earnings. For a derivative designated as a net investment hedge, the effective portionof the derivative’s gain or loss is reported as a component of the foreign currency translationadjustment, a component of OCI. The ineffective portions of all derivatives are recognizedimmediately into earnings. For a derivative not designated as a hedging instrument, the gain or loss isrecognized in earnings in the period of change.The Company classifies the cash flows from hedgingtransactions in the same category as the cash flows from the respective hedged items.The adoption ofSFAS No. 133 did not have a material impact on the Company’s consolidated results of operations,financial position or cash flows.
During the 52-week period ended September 30, 2001, the Company entered into forward foreignexchange contracts that qualify as cash flow hedges under SFAS No. 133 to hedge a portion ofanticipated foreign currency denominated revenue. In accordance with SFAS No. 133, cash flowhedges related to anticipated transactions are designated and documented at the inception of eachhedge by matching the terms of the contract to the underlying transaction.Once established, cash flowhedges are generally not removed until maturity.The Company also entered into a forward foreignexchange contract that qualifies as a hedge of a net investment in a foreign operation.These contractsexpire within 14 months and are intended to minimize certain foreign currency exposures that canbe confidently identified and quantified.
Forward contract effectiveness for cash flow hedges is calculated by comparing the fair value of thecontract to the change in value of the anticipated transaction using forward rates on a monthly basis.Any ineffectiveness is recognized immediately in “Interest and other income,net”on the accompanyingconsolidated statement of earnings.There was no ineffectiveness related to cash flow hedges for the 52-week period ended September 30, 2001. For net investment hedges, the spot-to-spot method is usedby the Company to calculate effectiveness. As a result of using this method, net gains of $1.4 millionwere recognized in earnings during the 52-week period ended September 30, 2001.
The Company had accumulated derivative gains of $1.3 million, net of taxes, in OCI as of September30, 2001, related to cash flow and net investment hedges. Of this amount, $1.2 million is expected tobe reclassified into earnings within 12 months.
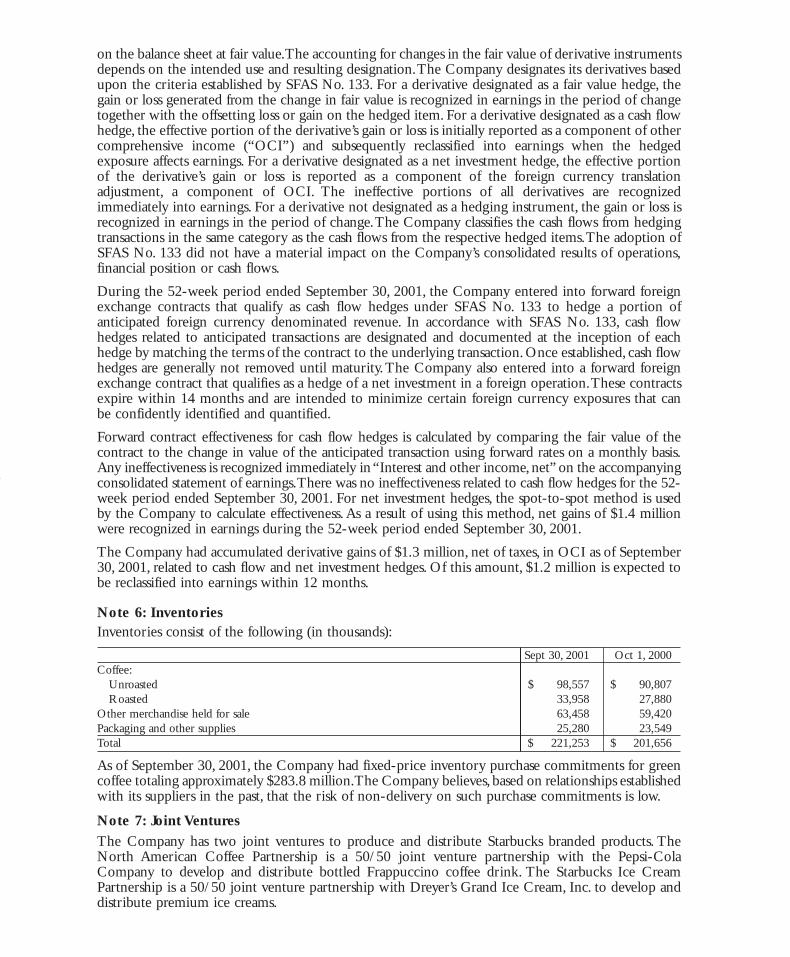
Note 6: InventoriesInventories consist of the following (in thousands):
Sept 30, 2001 Oct 1, 2000Coffee:
Unroasted $ 98,557 $ 90,807Roasted 33,958 27,880
Other merchandise held for sale 63,458 59,420Packaging and other supplies 25,280 23,549Total $ 221,253 $ 201,656
As of September 30, 2001, the Company had fixed-price inventory purchase commitments for greencoffee totaling approximately $283.8 million.The Company believes, based on relationships establishedwith its suppliers in the past, that the risk of non-delivery on such purchase commitments is low.
Note 7: Joint Ventures
The Company has two joint ventures to produce and distribute Starbucks branded products. TheNorth American Coffee Partnership is a 50/50 joint venture partnership with the Pepsi-ColaCompany to develop and distribute bottled Frappuccino coffee drink. The Starbucks Ice CreamPartnership is a 50/50 joint venture partnership with Dreyer’s Grand Ice Cream, Inc. to develop anddistribute premium ice creams.
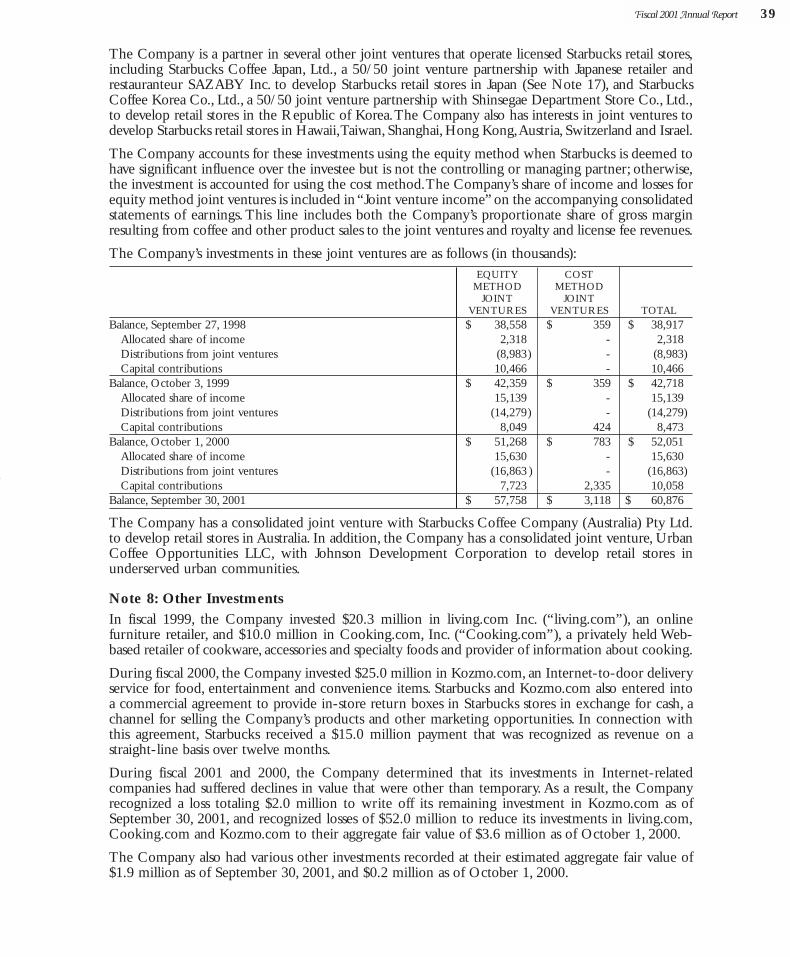
Fiscal 2001 Annual Report 39
The Company is a partner in several other joint ventures that operate licensed Starbucks retail stores,including Starbucks Coffee Japan, Ltd., a 50/50 joint venture partnership with Japanese retailer andrestauranteur SAZABY Inc. to develop Starbucks retail stores in Japan (See Note 17), and StarbucksCoffee Korea Co., Ltd., a 50/50 joint venture partnership with Shinsegae Department Store Co., Ltd.,to develop retail stores in the Republic of Korea.The Company also has interests in joint ventures todevelop Starbucks retail stores in Hawaii,Taiwan, Shanghai, Hong Kong,Austria, Switzerland and Israel.
The Company accounts for these investments using the equity method when Starbucks is deemed tohave significant influence over the investee but is not the controlling or managing partner; otherwise,the investment is accounted for using the cost method.The Company’s share of income and losses forequity method joint ventures is included in “Joint venture income”on the accompanying consolidatedstatements of earnings. This line includes both the Company’s proportionate share of gross marginresulting from coffee and other product sales to the joint ventures and royalty and license fee revenues.
The Company’s investments in these joint ventures are as follows (in thousands):EQUITY COST
METHOD METHODJOINT JOINT
VENTURES VENTURES TOTALBalance, September 27, 1998 $ 38,558 $ 359 $ 38,917
Allocated share of income 2,318 - 2,318Distributions from joint ventures (8,983) - (8,983)Capital contributions 10,466 - 10,466
Balance, October 3, 1999 $ 42,359 $ 359 $ 42,718Allocated share of income 15,139 - 15,139Distributions from joint ventures (14,279) - (14,279)Capital contributions 8,049 424 8,473
Balance, October 1, 2000 $ 51,268 $ 783 $ 52,051Allocated share of income 15,630 - 15,630Distributions from joint ventures (16,863 ) - (16,863)Capital contributions 7,723 2,335 10,058
Balance, September 30, 2001 $ 57,758 $ 3,118 $ 60,876
The Company has a consolidated joint venture with Starbucks Coffee Company (Australia) Pty Ltd.to develop retail stores in Australia. In addition, the Company has a consolidated joint venture, UrbanCoffee Opportunities LLC, with Johnson Development Corporation to develop retail stores inunderserved urban communities.
Note 8: Other Investments
In fiscal 1999, the Company invested $20.3 million in living.com Inc. (“living.com”), an onlinefurniture retailer, and $10.0 million in Cooking.com, Inc. (“Cooking.com”), a privately held Web-based retailer of cookware, accessories and specialty foods and provider of information about cooking.
During fiscal 2000, the Company invested $25.0 million in Kozmo.com, an Internet-to-door deliveryservice for food, entertainment and convenience items. Starbucks and Kozmo.com also entered intoa commercial agreement to provide in-store return boxes in Starbucks stores in exchange for cash, achannel for selling the Company’s products and other marketing opportunities. In connection withthis agreement, Starbucks received a $15.0 million payment that was recognized as revenue on astraight-line basis over twelve months.
During fiscal 2001 and 2000, the Company determined that its investments in Internet-relatedcompanies had suffered declines in value that were other than temporary. As a result, the Companyrecognized a loss totaling $2.0 million to write off its remaining investment in Kozmo.com as ofSeptember 30, 2001, and recognized losses of $52.0 million to reduce its investments in living.com,Cooking.com and Kozmo.com to their aggregate fair value of $3.6 million as of October 1, 2000.
The Company also had various other investments recorded at their estimated aggregate fair value of$1.9 million as of September 30, 2001, and $0.2 million as of October 1, 2000.
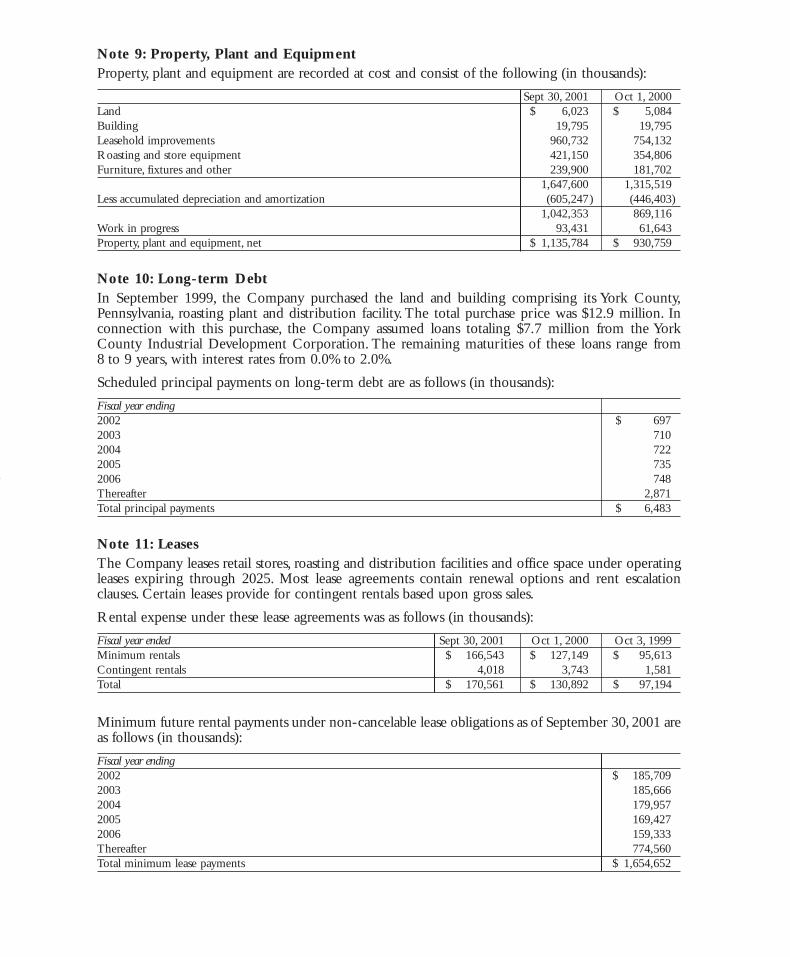
Note 9: Property, Plant and EquipmentProperty, plant and equipment are recorded at cost and consist of the following (in thousands):
Sept 30, 2001 Oct 1, 2000Land $ 6,023 $ 5,084Building 19,795 19,795Leasehold improvements 960,732 754,132Roasting and store equipment 421,150 354,806Furniture, fixtures and other 239,900 181,702
1,647,600 1,315,519Less accumulated depreciation and amortization (605,247) (446,403)
1,042,353 869,116Work in progress 93,431 61,643 Property, plant and equipment, net $ 1,135,784 $ 930,759
Note 10: Long-term DebtIn September 1999, the Company purchased the land and building comprising its York County,Pennsylvania, roasting plant and distribution facility. The total purchase price was $12.9 million. Inconnection with this purchase, the Company assumed loans totaling $7.7 million from the YorkCounty Industrial Development Corporation. The remaining maturities of these loans range from 8 to 9 years, with interest rates from 0.0% to 2.0%.
Scheduled principal payments on long-term debt are as follows (in thousands):
Fiscal year ending 2002 $ 6972003 7102004 7222005 7352006 748Thereafter 2,871Total principal payments $ 6,483
Note 11: LeasesThe Company leases retail stores, roasting and distribution facilities and office space under operatingleases expiring through 2025. Most lease agreements contain renewal options and rent escalationclauses. Certain leases provide for contingent rentals based upon gross sales.
Rental expense under these lease agreements was as follows (in thousands):
Fiscal year ended Sept 30, 2001 Oct 1, 2000 Oct 3, 1999Minimum rentals $ 166,543 $ 127,149 $ 95,613Contingent rentals 4,018 3,743 1,581 Total $ 170,561 $ 130,892 $ 97,194
Minimum future rental payments under non-cancelable lease obligations as of September 30, 2001 areas follows (in thousands):
Fiscal year ending 2002 $ 185,7092003 185,6662004 179,9572005 169,4272006 159,333Thereafter 774,560Total minimum lease payments $ 1,654,652
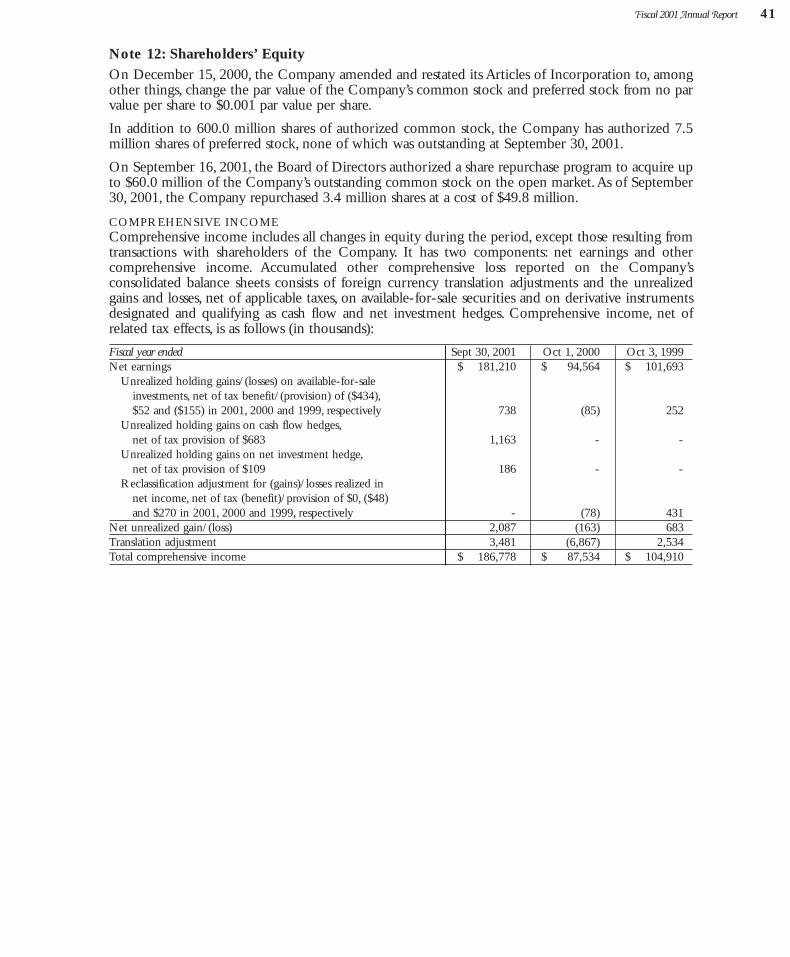
Fiscal 2001 Annual Report 41
Note 12: Shareholders’ Equity
On December 15, 2000, the Company amended and restated its Articles of Incorporation to, amongother things, change the par value of the Company’s common stock and preferred stock from no parvalue per share to $0.001 par value per share.
In addition to 600.0 million shares of authorized common stock, the Company has authorized 7.5million shares of preferred stock, none of which was outstanding at September 30, 2001.
On September 16, 2001, the Board of Directors authorized a share repurchase program to acquire upto $60.0 million of the Company’s outstanding common stock on the open market.As of September30, 2001, the Company repurchased 3.4 million shares at a cost of $49.8 million.
COMPREHENSIVE INCOME Comprehensive income includes all changes in equity during the period, except those resulting fromtransactions with shareholders of the Company. It has two components: net earnings and othercomprehensive income. Accumulated other comprehensive loss reported on the Company’sconsolidated balance sheets consists of foreign currency translation adjustments and the unrealizedgains and losses, net of applicable taxes, on available-for-sale securities and on derivative instrumentsdesignated and qualifying as cash flow and net investment hedges. Comprehensive income, net ofrelated tax effects, is as follows (in thousands):
Fiscal year ended Sept 30, 2001 Oct 1, 2000 Oct 3, 1999Net earnings $ 181,210 $ 94,564 $ 101,693
Unrealized holding gains/(losses) on available-for-sale investments, net of tax benefit/(provision) of ($434),$52 and ($155) in 2001, 2000 and 1999, respectively 738 (85) 252
Unrealized holding gains on cash flow hedges,net of tax provision of $683 1,163 - -
Unrealized holding gains on net investment hedge,net of tax provision of $109 186 - -
Reclassification adjustment for (gains)/losses realized in net income, net of tax (benefit)/provision of $0, ($48) and $270 in 2001, 2000 and 1999, respectively - (78) 431
Net unrealized gain/(loss) 2,087 (163) 683Translation adjustment 3,481 (6,867) 2,534Total comprehensive income $ 186,778 $ 87,534 $ 104,910
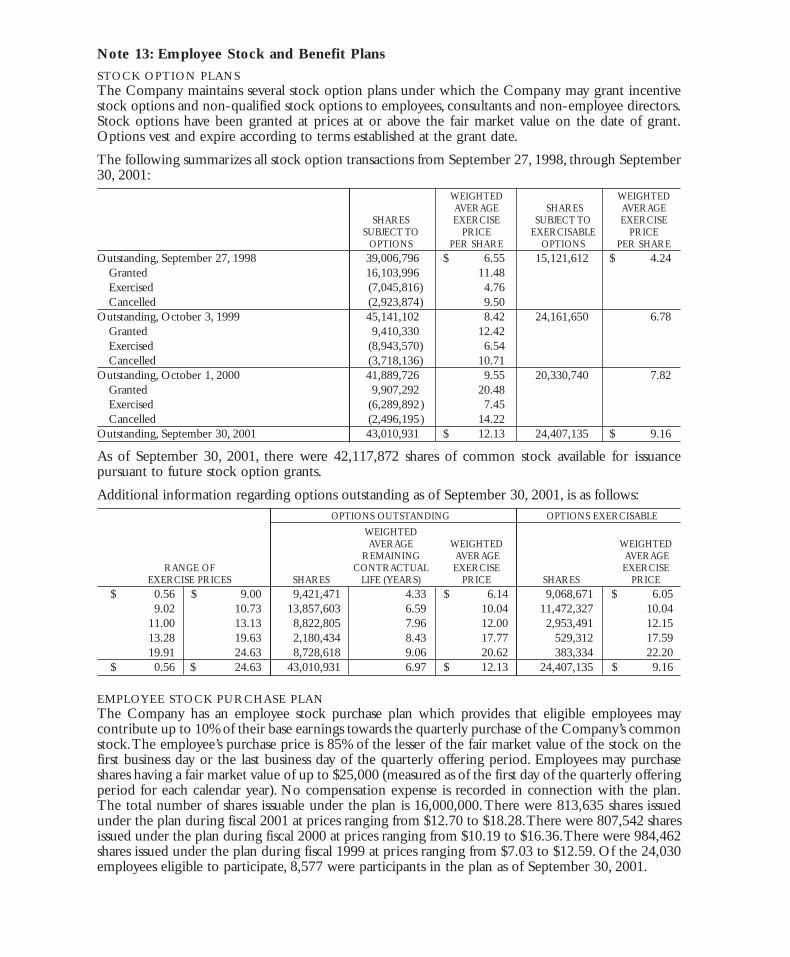
Note 13: Employee Stock and Benefit Plans
STOCK OPTION PLANS The Company maintains several stock option plans under which the Company may grant incentivestock options and non-qualified stock options to employees, consultants and non-employee directors.Stock options have been granted at prices at or above the fair market value on the date of grant.Options vest and expire according to terms established at the grant date.
The following summarizes all stock option transactions from September 27, 1998, through September30, 2001:
WEIGHTED WEIGHTEDAVERAGE SHARES AVERAGE
SHARES EXERCISE SUBJECT TO EXERCISESUBJECT TO PRICE EXERCISABLE PRICE
OPTIONS PER SHARE OPTIONS PER SHAREOutstanding, September 27, 1998 39,006,796 $ 6.55 15,121,612 $ 4.24
Granted 16,103,996 11.48Exercised (7,045,816) 4.76Cancelled (2,923,874) 9.50
Outstanding, October 3, 1999 45,141,102 8.42 24,161,650 6.78Granted 9,410,330 12.42Exercised (8,943,570) 6.54Cancelled (3,718,136) 10.71
Outstanding, October 1, 2000 41,889,726 9.55 20,330,740 7.82Granted 9,907,292 20.48Exercised (6,289,892) 7.45Cancelled (2,496,195) 14.22
Outstanding, September 30, 2001 43,010,931 $ 12.13 24,407,135 $ 9.16
As of September 30, 2001, there were 42,117,872 shares of common stock available for issuancepursuant to future stock option grants.
Additional information regarding options outstanding as of September 30, 2001, is as follows:OPTIONS OUTSTANDING OPTIONS EXERCISABLE
WEIGHTEDAVERAGE WEIGHTED WEIGHTED
REMAINING AVERAGE AVERAGERANGE OF CONTRACTUAL EXERCISE EXERCISE
EXERCISE PRICES SHARES LIFE (YEARS) PRICE SHARES PRICE$ 0.56 $ 9.00 9,421,471 4.33 $ 6.14 9,068,671 $ 6.05
9.02 10.73 13,857,603 6.59 10.04 11,472,327 10.0411.00 13.13 8,822,805 7.96 12.00 2,953,491 12.1513.28 19.63 2,180,434 8.43 17.77 529,312 17.5919.91 24.63 8,728,618 9.06 20.62 383,334 22.20
$ 0.56 $ 24.63 43,010,931 6.97 $ 12.13 24,407,135 $ 9.16
EMPLOYEE STOCK PURCHASE PLAN The Company has an employee stock purchase plan which provides that eligible employees maycontribute up to 10% of their base earnings towards the quarterly purchase of the Company’s commonstock.The employee’s purchase price is 85% of the lesser of the fair market value of the stock on thefirst business day or the last business day of the quarterly offering period. Employees may purchaseshares having a fair market value of up to $25,000 (measured as of the first day of the quarterly offeringperiod for each calendar year). No compensation expense is recorded in connection with the plan.The total number of shares issuable under the plan is 16,000,000.There were 813,635 shares issuedunder the plan during fiscal 2001 at prices ranging from $12.70 to $18.28.There were 807,542 sharesissued under the plan during fiscal 2000 at prices ranging from $10.19 to $16.36.There were 984,462shares issued under the plan during fiscal 1999 at prices ranging from $7.03 to $12.59. Of the 24,030employees eligible to participate, 8,577 were participants in the plan as of September 30, 2001.
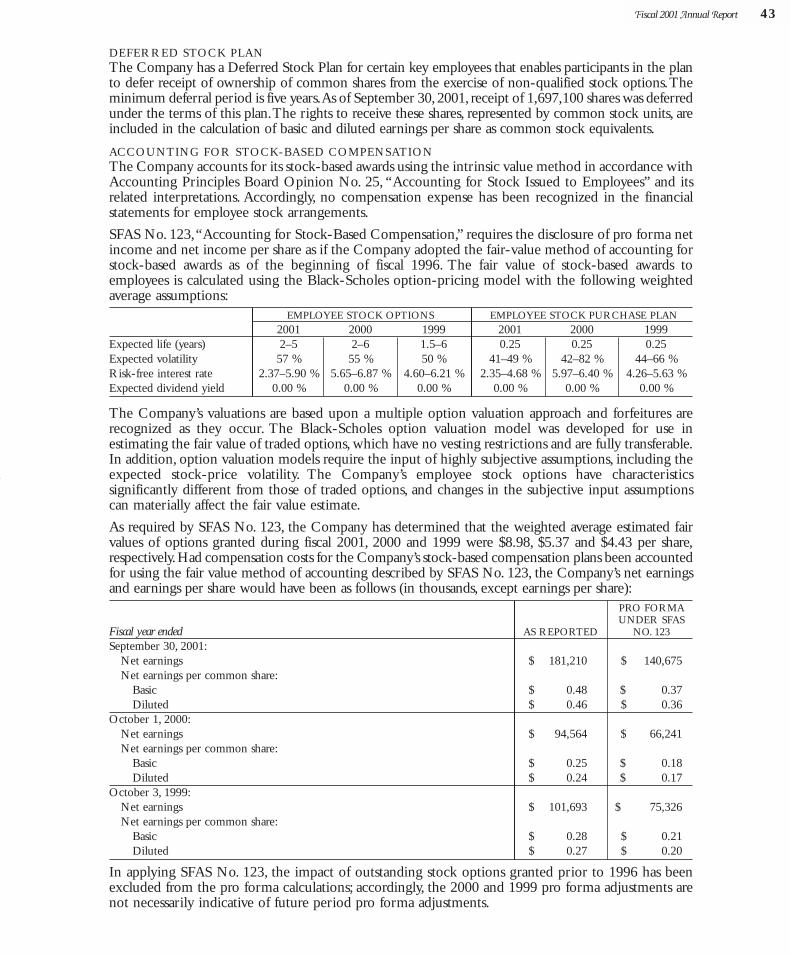
Fiscal 2001 Annual Report 43
DEFERRED STOCK PLAN The Company has a Deferred Stock Plan for certain key employees that enables participants in the planto defer receipt of ownership of common shares from the exercise of non-qualified stock options.Theminimum deferral period is five years.As of September 30,2001, receipt of 1,697,100 shares was deferredunder the terms of this plan.The rights to receive these shares, represented by common stock units, areincluded in the calculation of basic and diluted earnings per share as common stock equivalents.
ACCOUNTING FOR STOCK-BASED COMPENSATION The Company accounts for its stock-based awards using the intrinsic value method in accordance withAccounting Principles Board Opinion No. 25, “Accounting for Stock Issued to Employees” and itsrelated interpretations. Accordingly, no compensation expense has been recognized in the financialstatements for employee stock arrangements.
SFAS No. 123,“Accounting for Stock-Based Compensation,” requires the disclosure of pro forma netincome and net income per share as if the Company adopted the fair-value method of accounting forstock-based awards as of the beginning of fiscal 1996. The fair value of stock-based awards toemployees is calculated using the Black-Scholes option-pricing model with the following weightedaverage assumptions:
EMPLOYEE STOCK OPTIONS EMPLOYEE STOCK PURCHASE PLAN2001 2000 1999 2001 2000 1999
Expected life (years) 2–5 2–6 1.5–6 0.25 0.25 0.25Expected volatility 57 % 55 % 50 % 41–49 % 42–82 % 44–66 %Risk-free interest rate 2.37–5.90 % 5.65–6.87 % 4.60–6.21 % 2.35–4.68 % 5.97–6.40 % 4.26–5.63 %Expected dividend yield 0.00 % 0.00 % 0.00 % 0.00 % 0.00 % 0.00 %
The Company’s valuations are based upon a multiple option valuation approach and forfeitures arerecognized as they occur. The Black-Scholes option valuation model was developed for use inestimating the fair value of traded options, which have no vesting restrictions and are fully transferable.In addition, option valuation models require the input of highly subjective assumptions, including theexpected stock-price volatility. The Company’s employee stock options have characteristicssignificantly different from those of traded options, and changes in the subjective input assumptionscan materially affect the fair value estimate.
As required by SFAS No. 123, the Company has determined that the weighted average estimated fairvalues of options granted during fiscal 2001, 2000 and 1999 were $8.98, $5.37 and $4.43 per share,respectively.Had compensation costs for the Company’s stock-based compensation plans been accountedfor using the fair value method of accounting described by SFAS No. 123, the Company’s net earningsand earnings per share would have been as follows (in thousands, except earnings per share):
PRO FORMAUNDER SFAS
Fiscal year ended AS REPORTED NO. 123September 30, 2001:
Net earnings $ 181,210 $ 140,675Net earnings per common share:
Basic $ 0.48 $ 0.37Diluted $ 0.46 $ 0.36
October 1, 2000:Net earnings $ 94,564 $ 66,241Net earnings per common share:
Basic $ 0.25 $ 0.18Diluted $ 0.24 $ 0.17
October 3, 1999:Net earnings $ 101,693 $ 75,326Net earnings per common share:
Basic $ 0.28 $ 0.21Diluted $ 0.27 $ 0.20
In applying SFAS No. 123, the impact of outstanding stock options granted prior to 1996 has beenexcluded from the pro forma calculations; accordingly, the 2000 and 1999 pro forma adjustments arenot necessarily indicative of future period pro forma adjustments.
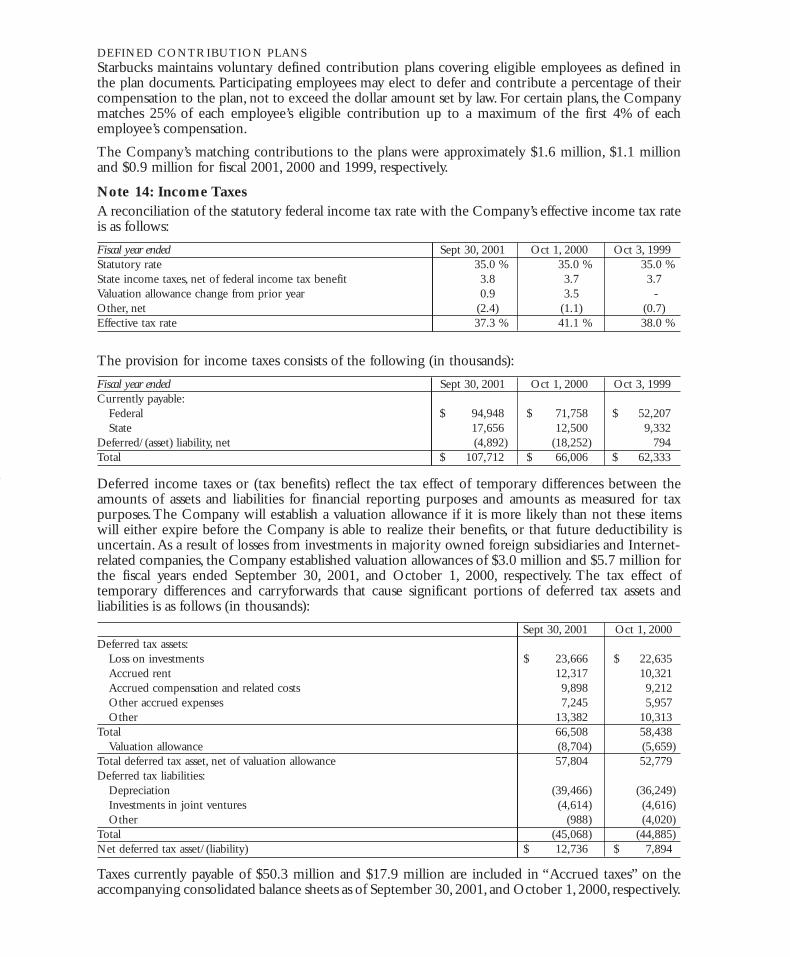
DEFINED CONTRIBUTION PLANS Starbucks maintains voluntary defined contribution plans covering eligible employees as defined inthe plan documents. Participating employees may elect to defer and contribute a percentage of theircompensation to the plan, not to exceed the dollar amount set by law. For certain plans, the Companymatches 25% of each employee’s eligible contribution up to a maximum of the first 4% of eachemployee’s compensation.
The Company’s matching contributions to the plans were approximately $1.6 million, $1.1 millionand $0.9 million for fiscal 2001, 2000 and 1999, respectively.
Note 14: Income TaxesA reconciliation of the statutory federal income tax rate with the Company’s effective income tax rateis as follows:
Fiscal year ended Sept 30, 2001 Oct 1, 2000 Oct 3, 1999Statutory rate 35.0 % 35.0 % 35.0 %State income taxes, net of federal income tax benefit 3.8 3.7 3.7Valuation allowance change from prior year 0.9 3.5 -Other, net (2.4) (1.1) (0.7)Effective tax rate 37.3 % 41.1 % 38.0 %
The provision for income taxes consists of the following (in thousands):
Fiscal year ended Sept 30, 2001 Oct 1, 2000 Oct 3, 1999Currently payable:
Federal $ 94,948 $ 71,758 $ 52,207State 17,656 12,500 9,332
Deferred/(asset) liability, net (4,892) (18,252) 794Total $ 107,712 $ 66,006 $ 62,333
Deferred income taxes or (tax benefits) reflect the tax effect of temporary differences between theamounts of assets and liabilities for financial reporting purposes and amounts as measured for taxpurposes.The Company will establish a valuation allowance if it is more likely than not these itemswill either expire before the Company is able to realize their benefits, or that future deductibility isuncertain.As a result of losses from investments in majority owned foreign subsidiaries and Internet-related companies, the Company established valuation allowances of $3.0 million and $5.7 million forthe fiscal years ended September 30, 2001, and October 1, 2000, respectively. The tax effect oftemporary differences and carryforwards that cause significant portions of deferred tax assets andliabilities is as follows (in thousands):
Sept 30, 2001 Oct 1, 2000Deferred tax assets:
Loss on investments $ 23,666 $ 22,635Accrued rent 12,317 10,321Accrued compensation and related costs 9,898 9,212Other accrued expenses 7,245 5,957Other 13,382 10,313
Total 66,508 58,438Valuation allowance (8,704) (5,659)
Total deferred tax asset, net of valuation allowance 57,804 52,779Deferred tax liabilities:
Depreciation (39,466) (36,249)Investments in joint ventures (4,614) (4,616)Other (988) (4,020)
Total (45,068) (44,885)Net deferred tax asset/(liability) $ 12,736 $ 7,894
Taxes currently payable of $50.3 million and $17.9 million are included in “Accrued taxes” on theaccompanying consolidated balance sheets as of September 30,2001, and October 1, 2000, respectively.
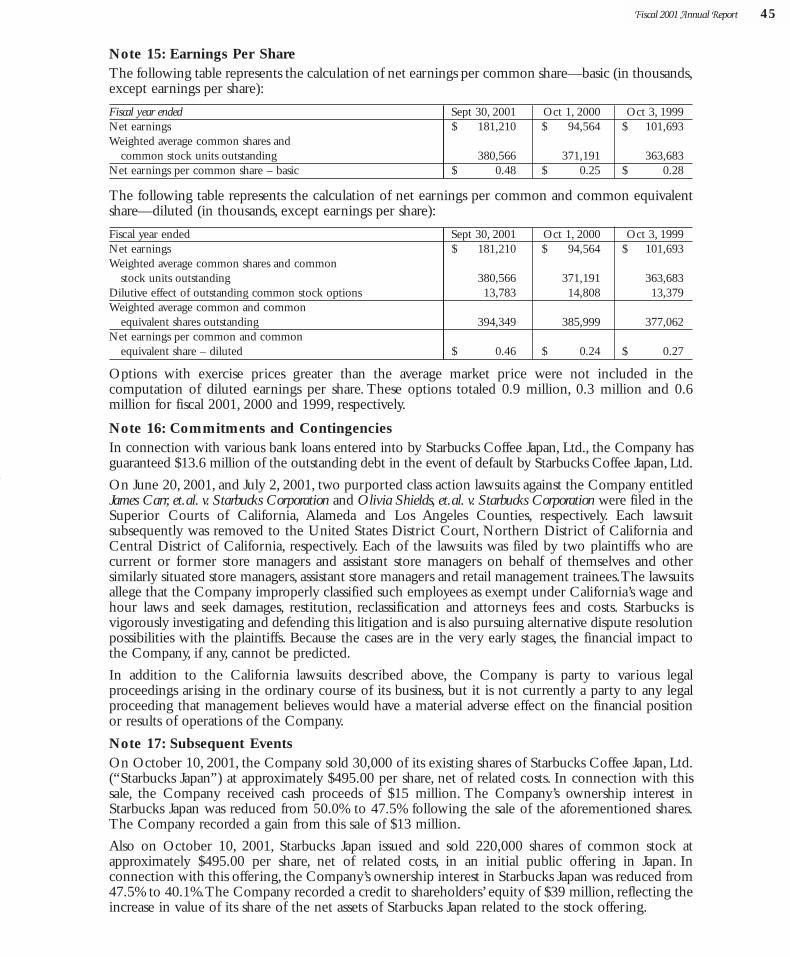
Fiscal 2001 Annual Report 45
Note 15: Earnings Per ShareThe following table represents the calculation of net earnings per common share—basic (in thousands,except earnings per share):
Fiscal year ended Sept 30, 2001 Oct 1, 2000 Oct 3, 1999Net earnings $ 181,210 $ 94,564 $ 101,693Weighted average common shares and
common stock units outstanding 380,566 371,191 363,683Net earnings per common share – basic $ 0.48 $ 0.25 $ 0.28
The following table represents the calculation of net earnings per common and common equivalentshare—diluted (in thousands, except earnings per share):
Fiscal year ended Sept 30, 2001 Oct 1, 2000 Oct 3, 1999Net earnings $ 181,210 $ 94,564 $ 101,693Weighted average common shares and common
stock units outstanding 380,566 371,191 363,683Dilutive effect of outstanding common stock options 13,783 14,808 13,379Weighted average common and common
equivalent shares outstanding 394,349 385,999 377,062Net earnings per common and common
equivalent share – diluted $ 0.46 $ 0.24 $ 0.27
Options with exercise prices greater than the average market price were not included in thecomputation of diluted earnings per share. These options totaled 0.9 million, 0.3 million and 0.6million for fiscal 2001, 2000 and 1999, respectively.
Note 16: Commitments and ContingenciesIn connection with various bank loans entered into by Starbucks Coffee Japan, Ltd., the Company hasguaranteed $13.6 million of the outstanding debt in the event of default by Starbucks Coffee Japan, Ltd.
On June 20, 2001, and July 2, 2001, two purported class action lawsuits against the Company entitledJames Carr, et.al. v. Starbucks Corporation and Olivia Shields, et.al. v. Starbucks Corporation were filed in theSuperior Courts of California, Alameda and Los Angeles Counties, respectively. Each lawsuitsubsequently was removed to the United States District Court, Northern District of California andCentral District of California, respectively. Each of the lawsuits was filed by two plaintiffs who arecurrent or former store managers and assistant store managers on behalf of themselves and othersimilarly situated store managers, assistant store managers and retail management trainees.The lawsuitsallege that the Company improperly classified such employees as exempt under California’s wage andhour laws and seek damages, restitution, reclassification and attorneys fees and costs. Starbucks isvigorously investigating and defending this litigation and is also pursuing alternative dispute resolutionpossibilities with the plaintiffs. Because the cases are in the very early stages, the financial impact tothe Company, if any, cannot be predicted.
In addition to the California lawsuits described above, the Company is party to various legalproceedings arising in the ordinary course of its business, but it is not currently a party to any legalproceeding that management believes would have a material adverse effect on the financial positionor results of operations of the Company.
Note 17: Subsequent EventsOn October 10, 2001, the Company sold 30,000 of its existing shares of Starbucks Coffee Japan, Ltd.(“Starbucks Japan”) at approximately $495.00 per share, net of related costs. In connection with thissale, the Company received cash proceeds of $15 million. The Company’s ownership interest inStarbucks Japan was reduced from 50.0% to 47.5% following the sale of the aforementioned shares.The Company recorded a gain from this sale of $13 million.
Also on October 10, 2001, Starbucks Japan issued and sold 220,000 shares of common stock atapproximately $495.00 per share, net of related costs, in an initial public offering in Japan. Inconnection with this offering, the Company’s ownership interest in Starbucks Japan was reduced from47.5% to 40.1%.The Company recorded a credit to shareholders’ equity of $39 million, reflecting theincrease in value of its share of the net assets of Starbucks Japan related to the stock offering.
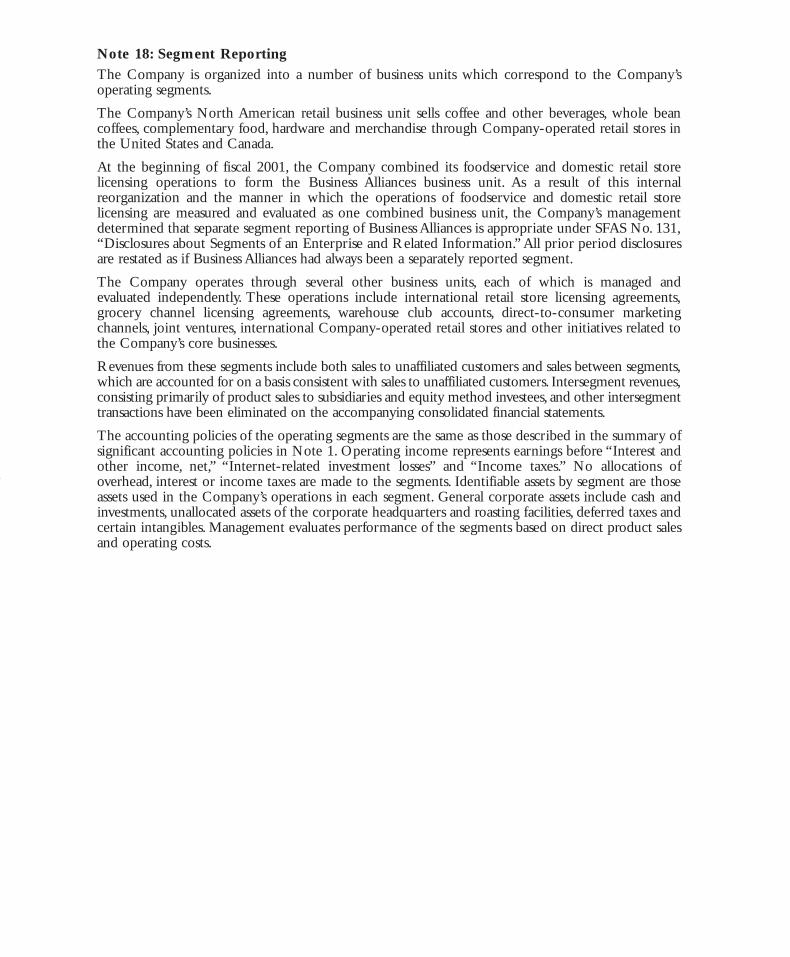
Note 18: Segment Reporting
The Company is organized into a number of business units which correspond to the Company’soperating segments.
The Company’s North American retail business unit sells coffee and other beverages, whole beancoffees, complementary food, hardware and merchandise through Company-operated retail stores inthe United States and Canada.
At the beginning of fiscal 2001, the Company combined its foodservice and domestic retail storelicensing operations to form the Business Alliances business unit. As a result of this internalreorganization and the manner in which the operations of foodservice and domestic retail storelicensing are measured and evaluated as one combined business unit, the Company’s managementdetermined that separate segment reporting of Business Alliances is appropriate under SFAS No. 131,“Disclosures about Segments of an Enterprise and Related Information.”All prior period disclosuresare restated as if Business Alliances had always been a separately reported segment.
The Company operates through several other business units, each of which is managed andevaluated independently. These operations include international retail store licensing agreements,grocery channel licensing agreements, warehouse club accounts, direct-to-consumer marketingchannels, joint ventures, international Company-operated retail stores and other initiatives related tothe Company’s core businesses.
Revenues from these segments include both sales to unaffiliated customers and sales between segments,which are accounted for on a basis consistent with sales to unaffiliated customers. Intersegment revenues,consisting primarily of product sales to subsidiaries and equity method investees, and other intersegmenttransactions have been eliminated on the accompanying consolidated financial statements.
The accounting policies of the operating segments are the same as those described in the summary ofsignificant accounting policies in Note 1. Operating income represents earnings before “Interest andother income, net,” “Internet-related investment losses” and “Income taxes.” No allocations ofoverhead, interest or income taxes are made to the segments. Identifiable assets by segment are thoseassets used in the Company’s operations in each segment. General corporate assets include cash andinvestments, unallocated assets of the corporate headquarters and roasting facilities, deferred taxes andcertain intangibles. Management evaluates performance of the segments based on direct product salesand operating costs.
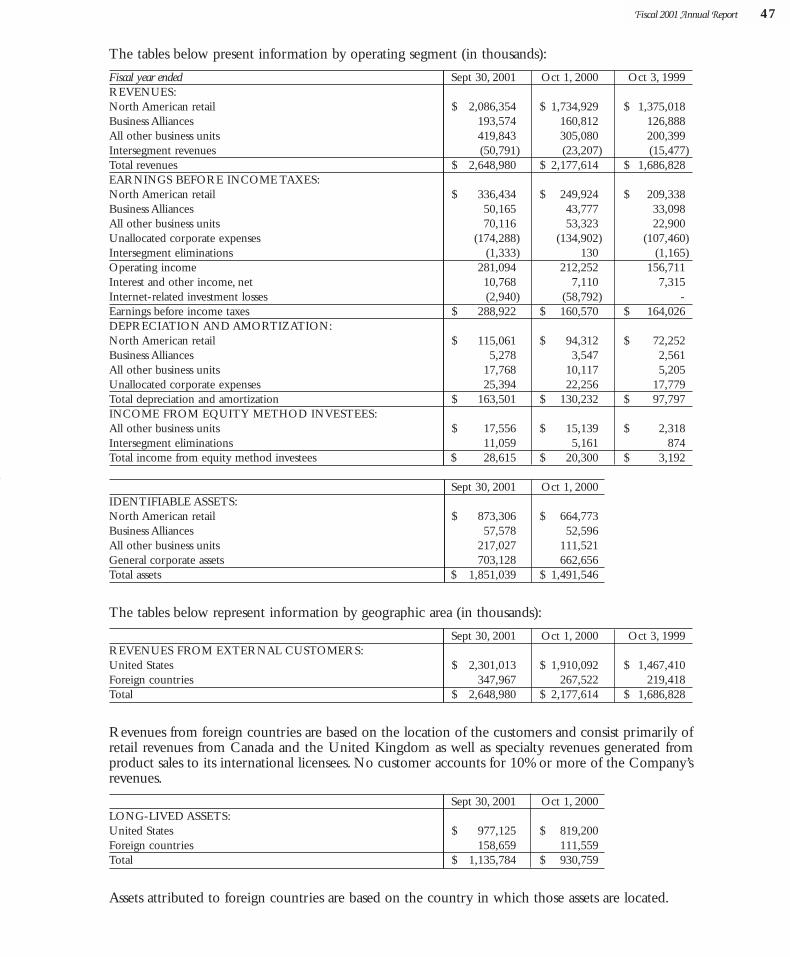
Fiscal 2001 Annual Report 47
The tables below present information by operating segment (in thousands):
Fiscal year ended Sept 30, 2001 Oct 1, 2000 Oct 3, 1999REVENUES:North American retail $ 2,086,354 $ 1,734,929 $ 1,375,018Business Alliances 193,574 160,812 126,888All other business units 419,843 305,080 200,399Intersegment revenues (50,791) (23,207) (15,477)Total revenues $ 2,648,980 $ 2,177,614 $ 1,686,828EARNINGS BEFORE INCOME TAXES:North American retail $ 336,434 $ 249,924 $ 209,338Business Alliances 50,165 43,777 33,098All other business units 70,116 53,323 22,900Unallocated corporate expenses (174,288) (134,902) (107,460)Intersegment eliminations (1,333) 130 (1,165)Operating income 281,094 212,252 156,711Interest and other income, net 10,768 7,110 7,315Internet-related investment losses (2,940) (58,792) -Earnings before income taxes $ 288,922 $ 160,570 $ 164,026DEPRECIATION AND AMORTIZATION:North American retail $ 115,061 $ 94,312 $ 72,252Business Alliances 5,278 3,547 2,561All other business units 17,768 10,117 5,205Unallocated corporate expenses 25,394 22,256 17,779Total depreciation and amortization $ 163,501 $ 130,232 $ 97,797INCOME FROM EQUITY METHOD INVESTEES:All other business units $ 17,556 $ 15,139 $ 2,318Intersegment eliminations 11,059 5,161 874Total income from equity method investees $ 28,615 $ 20,300 $ 3,192
Sept 30, 2001 Oct 1, 2000IDENTIFIABLE ASSETS:North American retail $ 873,306 $ 664,773Business Alliances 57,578 52,596All other business units 217,027 111,521General corporate assets 703,128 662,656Total assets $ 1,851,039 $ 1,491,546
The tables below represent information by geographic area (in thousands):
Sept 30, 2001 Oct 1, 2000 Oct 3, 1999 REVENUES FROM EXTERNAL CUSTOMERS:United States $ 2,301,013 $ 1,910,092 $ 1,467,410Foreign countries 347,967 267,522 219,418Total $ 2,648,980 $ 2,177,614 $ 1,686,828
Revenues from foreign countries are based on the location of the customers and consist primarily ofretail revenues from Canada and the United Kingdom as well as specialty revenues generated fromproduct sales to its international licensees. No customer accounts for 10% or more of the Company’srevenues.
Sept 30, 2001 Oct 1, 2000LONG-LIVED ASSETS:United States $ 977,125 $ 819,200Foreign countries 158,659 111,559Total $ 1,135,784 $ 930,759
Assets attributed to foreign countries are based on the country in which those assets are located.
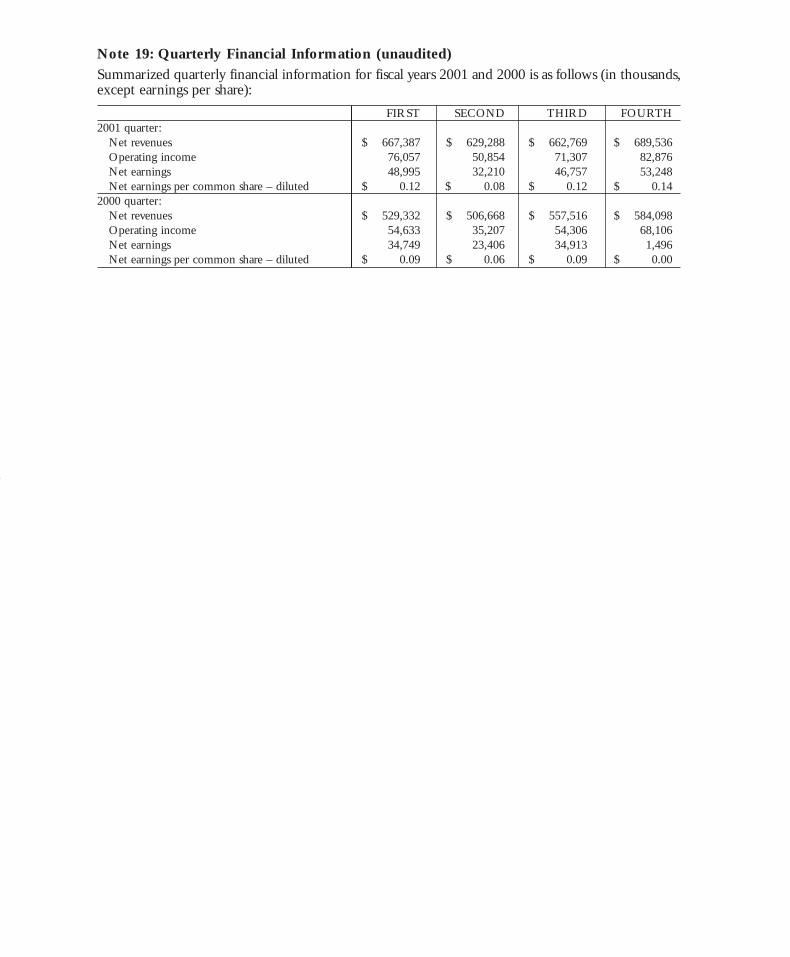
Note 19: Quarterly Financial Information (unaudited)
Summarized quarterly financial information for fiscal years 2001 and 2000 is as follows (in thousands,except earnings per share):
FIRST SECOND THIRD FOURTH 2001 quarter:
Net revenues $ 667,387 $ 629,288 $ 662,769 $ 689,536Operating income 76,057 50,854 71,307 82,876Net earnings 48,995 32,210 46,757 53,248Net earnings per common share – diluted $ 0.12 $ 0.08 $ 0.12 $ 0.14
2000 quarter:Net revenues $ 529,332 $ 506,668 $ 557,516 $ 584,098Operating income 54,633 35,207 54,306 68,106Net earnings 34,749 23,406 34,913 1,496Net earnings per common share – diluted $ 0.09 $ 0.06 $ 0.09 $ 0.00
Fiscal 2001 Annual Report 49
Management’s Responsibility for Financial Reporting
The management of Starbucks Corporation is responsible for the preparation and integrity of thefinancial statements included in this Annual Report to Shareholders. The financial statements havebeen prepared in conformity with accounting principles generally accepted in the United States ofAmerica and include amounts based on management’s best judgment where necessary. Financialinformation included elsewhere in this Annual Report is consistent with these financial statements.
Management maintains a system of internal controls and procedures designed to provide reasonableassurance that transactions are executed in accordance with proper authorization, that transactions areproperly recorded in the Company’s records, that assets are safeguarded and that accountability forassets is maintained.The concept of reasonable assurance is based on the recognition that the cost ofmaintaining our system of internal accounting controls should not exceed benefits expected to bederived from the system. Internal controls and procedures are periodically reviewed and revised, whenappropriate, due to changing circumstances and requirements.
Independent auditors are appointed by the Company’s Board of Directors and ratified by theCompany’s shareholders to audit the financial statements in accordance with auditing standardsgenerally accepted in the United States of America and to independently assess the fair presentationof the Company’s financial position, results of operations and cash flows.Their report appears in thisAnnual Report.
The Audit Committee, all of whose members are outside directors, is responsible for monitoring theCompany’s accounting and reporting practices. The Audit Committee meets periodically withmanagement and the independent auditors to ensure that each is properly discharging itsresponsibilities. The independent auditors have full and free access to the Committee without thepresence of management to discuss the results of their audits, the adequacy of internal accountingcontrols and the quality of financial reporting.
Orin C. Smith Michael Casey president and executive vice president,chief executive officer chief financial officer and
chief administrative officer
Starbucks Corporation
We have audited the accompanying consolidated balance sheets of Starbucks Corporation andsubsidiaries (the Company) as of September 30, 2001, and October 1, 2000, and the relatedconsolidated statements of earnings, shareholders’ equity and cash flows for each of the three years inthe period ended September 30, 2001. These financial statements are the responsibility of theCompany’s management. Our responsibility is to express an opinion on these financial statementsbased on our audits.
We conducted our audits in accordance with auditing standards generally accepted in the UnitedStates of America.Those standards require that we plan and perform the audit to obtain reasonableassurance about whether the financial statements are free of material misstatement.An audit includesexamining, on a test basis, evidence supporting the amounts and disclosures in the financial statements.An audit also includes assessing the accounting principles used and significant estimates made bymanagement, as well as evaluating the overall financial statement presentation. We believe that ouraudits provide a reasonable basis for our opinion.
In our opinion, such consolidated financial statements present fairly, in all material respects, thefinancial position of Starbucks Corporation and subsidiaries as of September 30, 2001, and October1, 2000, and the results of their operations and their cash flows for each of the three years in the periodended September 30, 2001, in conformity with accounting principles generally accepted in the UnitedStates of America.
Deloitte & Touche LLPSeattle,Washington December 4, 2001

Fiscal 2001 Annual Report 51
Shareholder Information
MARKET INFORMATION AND DIVIDEND POLICY The Company’s common stock is traded on the National Market tier of The Nasdaq Stock Market,Inc. (“Nasdaq”), under the symbol “SBUX.”The following table sets forth the quarterly high and lowclosing sale prices per share of the common stock as reported by Nasdaq for each quarter during thelast two fiscal years.All prices shown reflect the two-for-one stock split effected April 27, 2001.
HIGH LOWSeptember 30, 2001:
Fourth Quarter $ 22.77 $ 14.00Third Quarter 23.00 18.58Second Quarter 25.00 20.03First Quarter 24.94 19.16
October 1, 2000:Fourth Quarter $ 21.50 $ 17.56Third Quarter 21.72 14.16Second Quarter 22.41 11.94First Quarter 15.06 10.78
As of December 11, 2001, the Company had 9,650 shareholders of record.The Company has neverpaid any dividends on its common stock.The Company presently intends to retain earnings for usein its business and, therefore, does not anticipate paying a cash dividend in the near future.
The Company’s Annual Report on Form 10-K for the fiscal year ended September 30, 2001, withoutthe exhibits thereto, may be obtained without charge by accessing the Company’s filings atwww.sec.gov or by sending a request to Investor Relations at the address, phone number, or emailaddress below.
Quarterly information is available to all shareholders immediately upon its release, free of charge, viafax, by calling 1-800-239-0317 or via the Internet at www.businesswire.com/cnn/sbux.htm.
To receive a copy by mail, please send your request to:
Investor RelationsInvestor Relations – M/S S-FP1 Starbucks Corporation P.O. Box 34067 Seattle,WA 98124-1067 (206) 447-1575, ext. 87118www.starbucks.com/aboutus/investor.asp
Corporate Social Responsibility
Starbucks is committed to social responsibility.Today, with the strength of the Starbucks brand in themarketplace, the Company has an opportunity to lead by example. The Company’s responsibilitybegins with being accountable to its stakeholders—its partners, customers, suppliers, investors,community members and others—and communicating openly about its business practices andperformance. This led the Company to publish its first annual corporate social responsibility reportfor the 2001 fiscal year.
The Report can be viewed by visiting the Investor Relations’ internet address listed above.To receive a copy by mail, please call 1-800-STARBUC (1-800-782-7282), or fax your request to 1-800-782-7286.
Board of Directors and Senior Officers
Board of Directors
Howard SchultzStarbucks Corporationchairman of the board and chief global strategist
Orin C. SmithStarbucks Corporationpresident and chief executive officer
Howard BeharStarbucks Corporationpresident, North American Operations
Barbara BassGerson Bakar Foundationpresident
Craig J. FoleyWickham Capital Corp.president
Gregory B. Maffei360networks inc.president and chief executive officer
Arlen I. PrenticeKibble & Prenticeco-chairman and chief executive officer
James G. Shennan, Jr.Trinity Venturesgeneral partner
Craig E.WeatherupThe Pepsi Bottling Group, Inc.chairman and chief executive officer
Senior Officers
Peter Maslenpresident, Starbucks CoffeeInternational, Inc.
Michael Caseyexecutive vice president, chief financialofficer and chief administrative officer
Eduardo R. (Ted) Garciaexecutive vice president,Supply Chain and Coffee Operations
Shelley B. Lanzaexecutive vice president, PartnerResources, Law and Corporate Affairs,Corporate Social Responsibility,general counsel and secretary
Deidra Wagerexecutive vice president; chief retailofficer, Starbucks Coffee Japan, Ltd.
Marcia Adamssenior vice president - Central
James Allingsenior vice president,North American Retail
Martin Annesesenior vice president -Northeast/Eastern Canada
Troy Alsteadsenior vice president,Business Development and Finance,International
David N. Chichestersenior vice president, Finance
Brian Crynessenior vice president,chief information officer
Christine Daysenior vice president, North AmericanStrategic Business Systems
Lee Gelbsenior vice president, Partner Resources
Julio Gutierrezsenior vice president;president, Latin America
Wanda Herndonsenior vice president,Worldwide Public Affairs
Darren Hustonsenior vice president, New Ventures
Pedro Y.K. Mansenior vice president; president,Starbucks Coffee Asia Pacific Ltd.
Mark McKeonsenior vice president; president,Europe, Middle East and Africa
Jennifer O’Connorsenior vice president,Law and Corporate Affairs, anddeputy general counsel
Dave Olsensenior vice president,Culture and Immersion
Dennis Stefanaccisenior vice president,Corporate Social Responsibility
Henry J. Suerthsenior vice president,Business Alliances
Paul Twohigsenior vice president -Northwest/Western Canada
Mark Wesleysenior vice president, StoreDevelopment and Asset Management
Mary Williamssenior vice president, Coffee
Howard Wollnersenior vice president, Strategic Business Systems, International
Thomas Yang senior vice president,Marketing, International