Star Conference Milan - falckrenewables.eu/media/Files/F/Falck-Renewables-V2/... · % Coperta dalla...
27
Star Conference Milan Milan, 16 March 2016
Transcript of Star Conference Milan - falckrenewables.eu/media/Files/F/Falck-Renewables-V2/... · % Coperta dalla...

Star Conference Milan
Milan, 16 March 2016

Group overview
Financial Highlights FY 2015
Outlook and conclusions
2

Falck Renewables: an attractive value proposition …..
AN ATTRACTIVE PORTFOLIO… …WITH SOUND FINANCIALS
• Pure renewable player with aregionally focused strategy
• Wide experience in differenttechnologies
• Quality asset portfolio
• Proven ability to deliver projects
• Well positioned to capturegrowth opportunities
• Robust balance sheet & lowcost credit line available
• In route further efficiencyimprovements and operationalexcellence
3
2008-2014 2014-2020
Non Hydro Renew. Hydro Nuclear Fossil Fuels
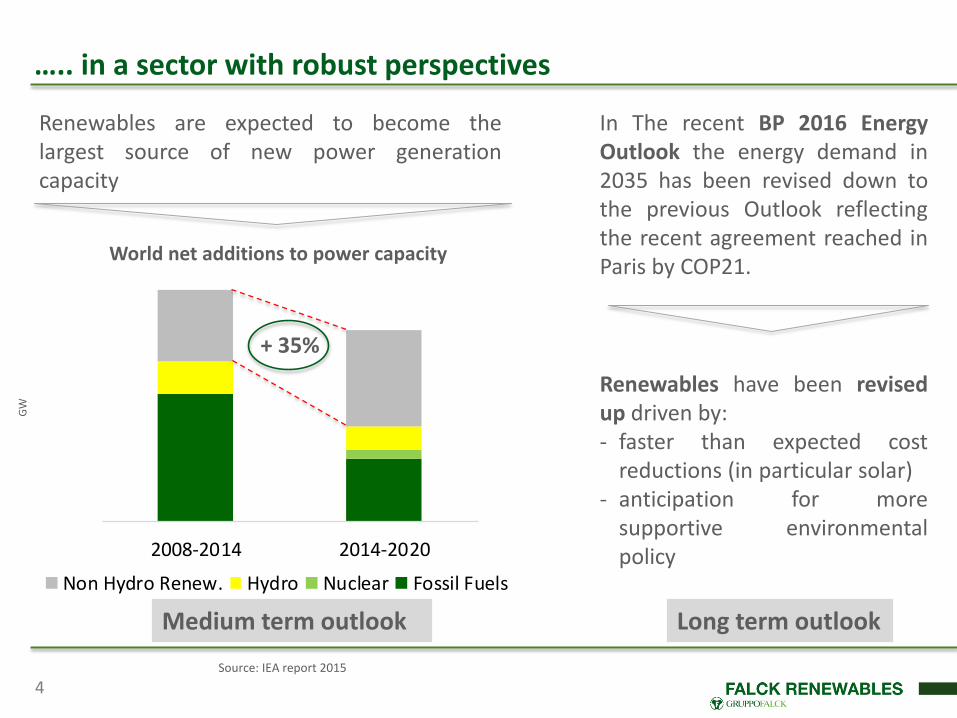
….. in a sector with robust perspectives
Medium term outlook Long term outlook
Renewables are expected to become thelargest source of new power generationcapacity
GW
In The recent BP 2016 EnergyOutlook the energy demand in2035 has been revised down tothe previous Outlook reflectingthe recent agreement reached inParis by COP21.
Renewables have been revisedup driven by:- faster than expected cost
reductions (in particular solar)- anticipation for more
supportive environmentalpolicy
World net additions to power capacity
Source: IEA report 2015
+ 35%
4

• 30MW of windin operation the UK
• 15MW of windin operation in the UK
• 83 MW under management in the UK by Vector Cuatro
• 22MW of windin operation in Italy
• 10MW of windin operation in France
Growth after the completion of the “Consolidation Project” in 2010
5
2011 2012 2013 2014 2015
• 39,6MW of wind(extensions) in operation in Scotland
• 13MW of solar in operation in Italy
• 138MW of windin operation in Italy
• 14MW of biomass in operation in Italy
• €165m corporate loan: agreementsigned
• Rights offeringcompletion(€130m)
• Buy-back planapproved by the BoD
• Sale of 49%minority interestin 6 UK windfarm to the Danish fund CII
• Vector Cuatroacquisition in Spain in the new Service sector
• €150mcorporate loanagreement signed
• Final settlementto close the Sicilian dispute
Operations
Strategy & Finance
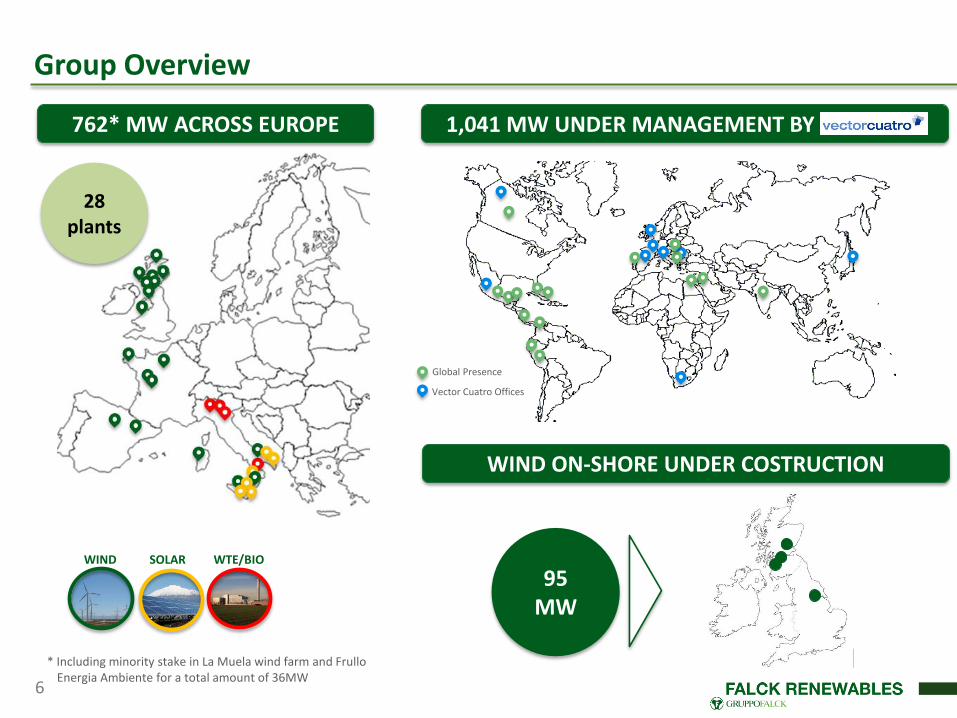
Group Overview
WIND WTE/BIOSOLAR
762* MW ACROSS EUROPE 1,041 MW UNDER MANAGEMENT BY VECTOR C.
95 MW
WIND ON-SHORE UNDER COSTRUCTION
6
Vector Cuatro Offices
Global Presence
28 plants
* Including minority stake in La Muela wind farm and Frullo Energia Ambiente for a total amount of 36MW
7
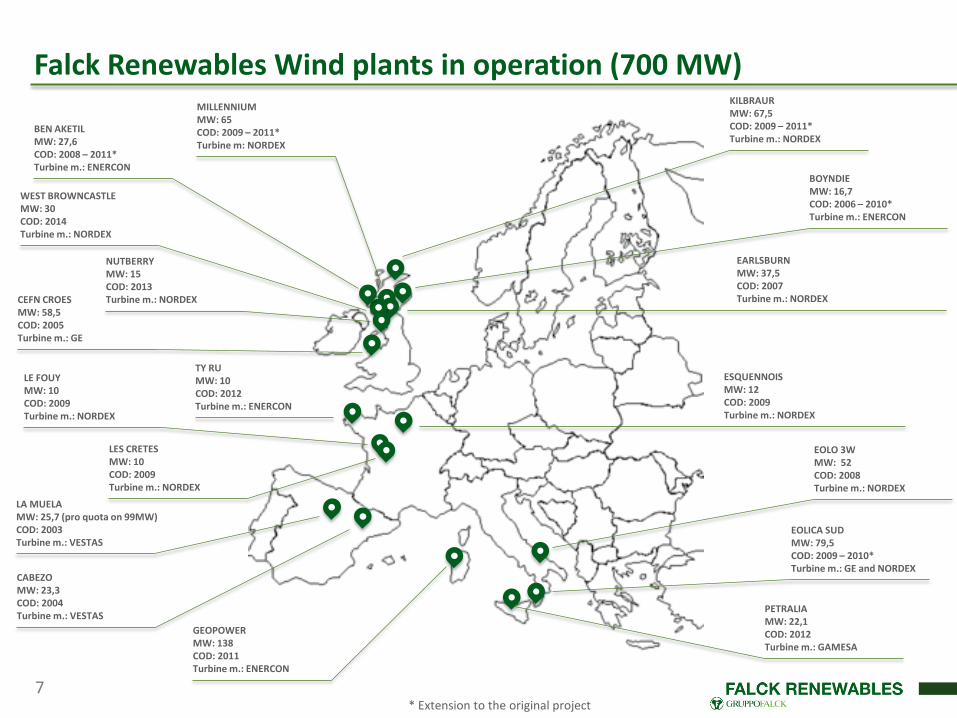
Falck Renewables Wind plants in operation (700 MW)
BEN AKETILMW: 27,6COD: 2008 – 2011*Turbine m.: ENERCON
WEST BROWNCASTLEMW: 30COD: 2014Turbine m.: NORDEX
NUTBERRYMW: 15COD: 2013Turbine m.: NORDEXCEFN CROES
MW: 58,5COD: 2005Turbine m.: GE
TY RUMW: 10COD: 2012Turbine m.: ENERCON
LE FOUYMW: 10COD: 2009Turbine m.: NORDEX
LES CRETESMW: 10COD: 2009Turbine m.: NORDEX
LA MUELAMW: 25,7 (pro quota on 99MW) COD: 2003Turbine m.: VESTAS
CABEZOMW: 23,3COD: 2004Turbine m.: VESTAS
GEOPOWERMW: 138COD: 2011Turbine m.: ENERCON
PETRALIAMW: 22,1COD: 2012Turbine m.: GAMESA
EOLICA SUDMW: 79,5COD: 2009 – 2010*Turbine m.: GE and NORDEX
EOLO 3WMW: 52COD: 2008Turbine m.: NORDEX
ESQUENNOISMW: 12COD: 2009Turbine m.: NORDEX
BOYNDIEMW: 16,7COD: 2006 – 2010*Turbine m.: ENERCON
MILLENNIUMMW: 65COD: 2009 – 2011*Turbine m: NORDEX
KILBRAURMW: 67,5COD: 2009 – 2011*Turbine m.: NORDEX
EARLSBURNMW: 37,5COD: 2007Turbine m.: NORDEX
* Extension to the original project

Focus on wind portfolio performance
8
2015: Falck Renewables load factor by country
36%
21%23% 24%
29%
10%
100%
Falck Renewables historical performance (2012 -2014) vs market averages
expected production by country
+4% +4% = +1%
2012 – 2014 market data from GSE (Italy), DECC (UK), RTE (France) and REE (Spain)
2015: Falck Renewables UK & Italy plant performance
-12%
+10%
…driven by quality wind assets

2011 20152011 2015
2011 20152011 2015
Consistent growth ….
MW evolution: 2011 – 2015
Revenues 2011 – 2015 (€m) EBITDA 2011 – 2015 (€m)
+ 78
648 726
Power Generation 2011 – 2015 (GWh)
1,441 1,852
+ 411
223 271
cagr 5%
124 152
cagr 5%
% on revenues56% 56%
Data adjusted to reflect the adoption of IFRS 119
1.78
1.21
6.50
4.13
0.00
3.50
7.00
2011 2015
NFP/Equity
NFP/Ebitda
2011 2015
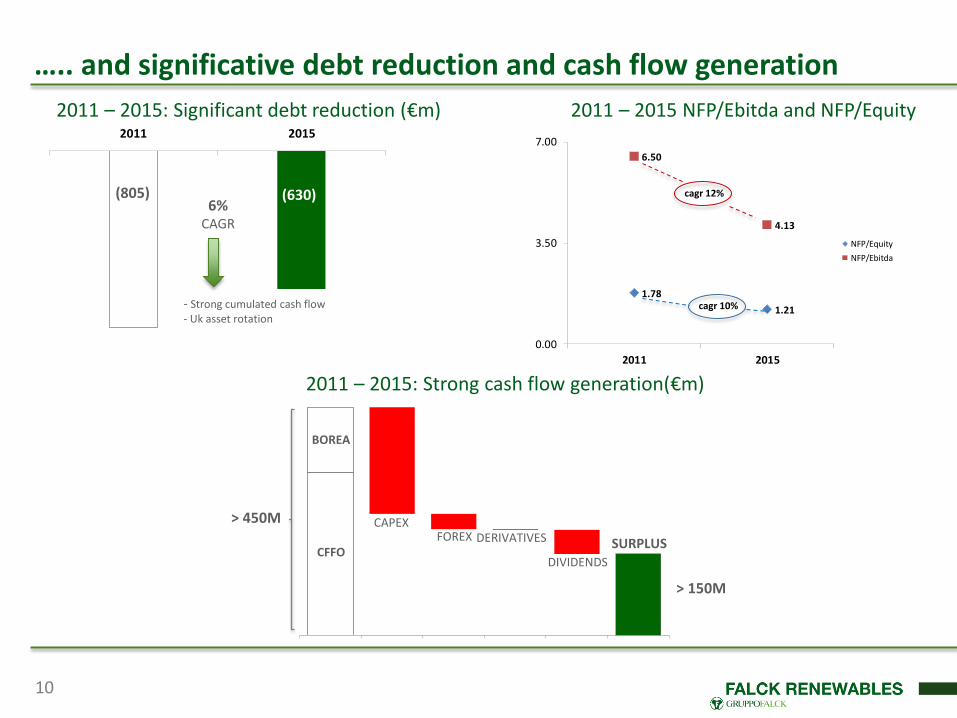
….. and significative debt reduction and cash flow generation
2011 – 2015 NFP/Ebitda and NFP/Equity2011 – 2015: Significant debt reduction (€m)
(805) (630)6%
CAGR
- Strong cumulated cash flow- Uk asset rotation
cagr 12%
cagr 10%
2011 – 2015: Strong cash flow generation(€m)
CFFO
BOREA
CAPEXFOREX DERIVATIVES
DIVIDENDS
SURPLUS
> 450M
> 150M
10

Young asset base
11
END OF 2015*
* Based on an useful life of 20 years
Technology MW
Project's residual Life 13y
Residual Debt's Life 7y 6y
Residual Incentive Life 13y
Project's residual Life 15y
Residual Debt's Life 10y 5y
Residual Incentive Life 10y
Project's residual Life 8y
Residual Debt's Life 3y 5y
Residual Incentive Life 8y
Project's residual Life 14y
Residual Debt's Life 12y 2y
Residual Incentive Life 9y 6y
Project's residual Life 15y
Residual Debt's Life 10y 6m 4y 6m
Residual Incentive Life 15y
Project's residual Life 8y
Residual Debt's Life 8y
Residual Incentive Life 1y 8m 6y 4m
Project's residual Life 15y
Residual Debt's Life 4y 11y
Residual Incentive Life 10y 5y
Project's residual Life 14y Residual Debt's Life 9y 5y
Residual Incentive Life 11y 4y
BIOMASS IT 14
TOTAL 726
WIND UK 318
WIND IT 292
+15+5 +10
WIND SP 23
YEARS
SOLAR IT 16
WIND FR 42
WTE 20
3MW
Residual Project Life
Residual Debt Life
Project cash flow after debt repayment
Wholesale price
Residual incentive life
Weighted on MW

12 * Last three months
Falck Renewables price performance
1,5 1,5
1,8
1,51,3 1,4
CONSENSUS
Falck Renewables Target Price
€ 1.016
Price per share
Upside+ 48%
Price per share (March 11th, 2016): € 1.016
Market Cap (March 11th,2016): € 296.1m
Average Daily Volume*: 388,552
All the analysts covering the stock has a BUY
recommendation
Stock price upside not priced in
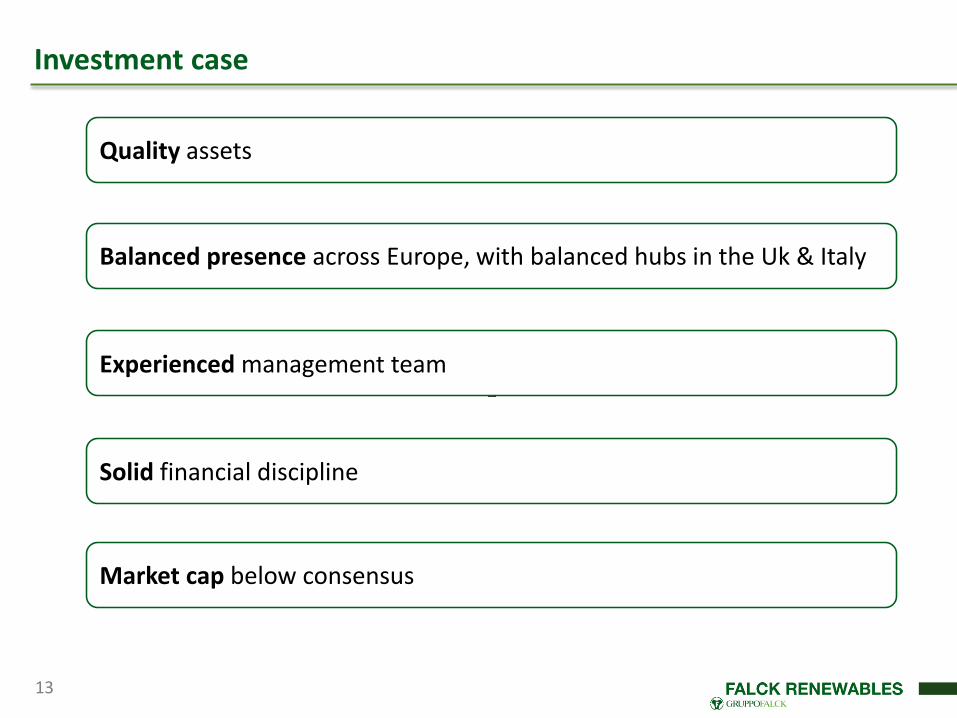
Balanced presence across Europe, with balanced hubs in the Uk & Italy
13
Investment case
Experienced management team
Market cap below consensus
Solid financial discipline
Quality assets

Group overview
Financial Highlights FY 2015
Outlook and conclusions
14

FY 2015 key factors
15
Good operating performance on windfarms across Europe
Corporate costs and opex reduction
Vector Cuatro reaches more than 1GW under management thanks toadditional 83 MW in the UK
Settlement with the Sicilian RegionalCouncil concerning the disputes forthe WtE plants
New corporate loan signed in Junewith better financial conditions
Management actions
Strong wind conditions across Europeparticularly in the UK
Positive impact on P&L from exchangerate GBP/Euro (+11% vs 2014)
Introduction of unbalancing costs forrenewables plants
Removal of LECs (Levy ExemptionCertificates) since 1 August 2015
Main external factors
Solid performance in a good year

FY 2015 - Evolution of installed capacity and production
By Technology By Country726 MW*
283271
WASTE (KTON)+4.4%
1,492 1,611
179 218 23
23
2014 2015
Solar
WTE/Biomass
Wind
271 283
2014 2015
+9.3%GWh
1,694 1,852
93.0%
4.8% 2.2%
Wind
WTE/Biomass
Solar
47.2%
43.8%
3.2%5.8%
Ita
Uk
Spa
Fra
16
* excluding minority stakes in La Muela and FEA
Significant growth of volumes ……
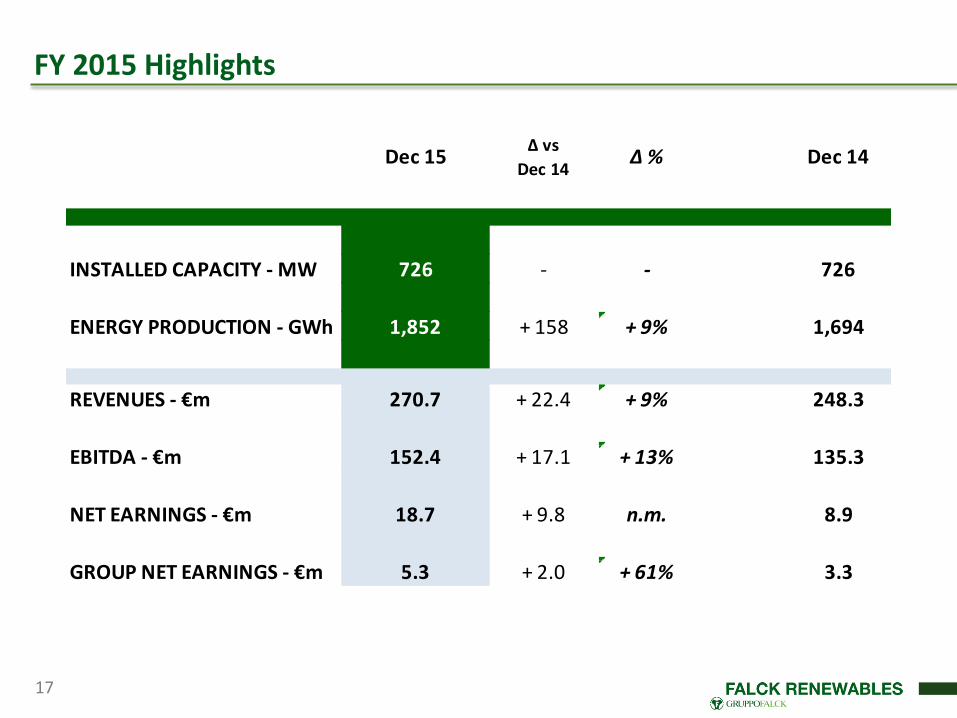
FY 2015 Highlights
17
Dec 15Δ vs
Dec 14Δ % Dec 14
INSTALLED CAPACITY - MW 726 - - 726
ENERGY PRODUCTION - GWh 1,852 + 158 + 9% 1,694
REVENUES - €m 270.7 + 22.4 + 9% 248.3
EBITDA - €m 152.4 + 17.1 + 13% 135.3
NET EARNINGS - €m 18.7 + 9.8 n.m. 8.9
GROUP NET EARNINGS - €m 5.3 + 2.0 + 61% 3.3

54.1% 45.7%
41.6% 49.3%3.4%
3.5%0.9%
1.5%
2014 2015
Spain
France
UK
Italy
58.8% 52.4%
36.8% 41.7%
2.9% 3.1%1.5%
2.1%0.6%
2014 2015
Other
Spain
France
UK
Italy
FY 2015 Financial highlights: Revenues and EBITDA
+9.0%
248.3 270.7
Revenues by technology
* Breakdown of EBITDA by technology made on total EBITDA gross of holding impact
EBITDA* by technology EBITDA by Country
Millions of euro
+12.6%
135.3 152.4
4.2%
Revenues by Country
75.3% 74.8%
19.9%18.8%
4.0% 3.2%0.8% 3.2%
2014 2015
Services
Solar
Wte/Biomass
Wind
+9.0%
248.3 270.7
89.1% 88.3%
5.3%6.4%5.3%4.5%0.3%
0.8%
2014 2015
Services
Solar
Wte/Biomass
Wind
18

EBITDA 2015 vs 2014: key factors
Millions of euro
19
135.35.1
6.2
(4.5)
3.1 6.7 1.5
(1.0)
152.4
2014 PERIMETER VOLUMES PRICES OPEX EXCH.RATE
G&A/DEVEX
NONOPERATING
ITEMS
2015
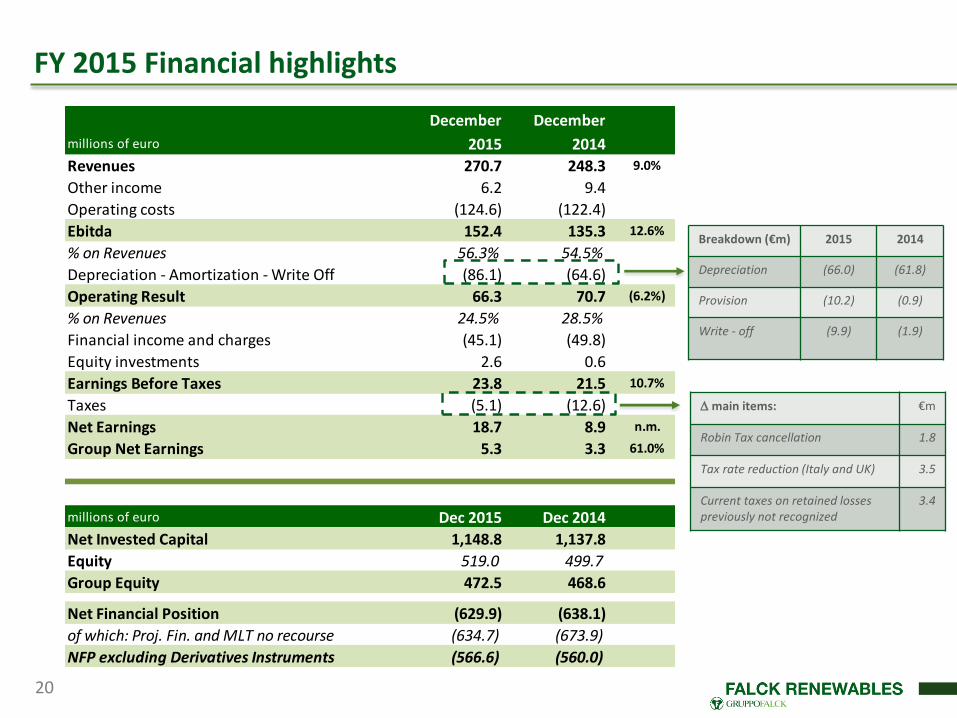
December December
millions of euro 2015 2014
Revenues 270.7 248.3 9.0%
Other income 6.2 9.4
Operating costs (124.6) (122.4)
Ebitda 152.4 135.3 12.6%
% on Revenues 56.3% 54.5%
Depreciation - Amortization - Write Off (86.1) (64.6)
Operating Result 66.3 70.7 (6.2%)
% on Revenues 24.5% 28.5%
Financial income and charges (45.1) (49.8)
Equity investments 2.6 0.6
Earnings Before Taxes 23.8 21.5 10.7%
Taxes (5.1) (12.6)
Net Earnings 18.7 8.9 n.m.
Group Net Earnings 5.3 3.3 61.0%
millions of euro Dec 2015 Dec 2014
Net Invested Capital 1,148.8 1,137.8
Equity 519.0 499.7
Group Equity 472.5 468.6
Net Financial Position (629.9) (638.1)
of which: Proj. Fin. and MLT no recourse (634.7) (673.9)
NFP excluding Derivatives Instruments (566.6) (560.0)
FY 2015 Financial highlights
D main items: €m
Robin Tax cancellation 1.8
Tax rate reduction (Italy and UK) 3.5
Current taxes on retained losses previously not recognized
3.4
20
Breakdown (€m) 2015 2014
Depreciation (66.0) (61.8)
Provision (10.2) (0.9)
Write - off (9.9) (1.9)
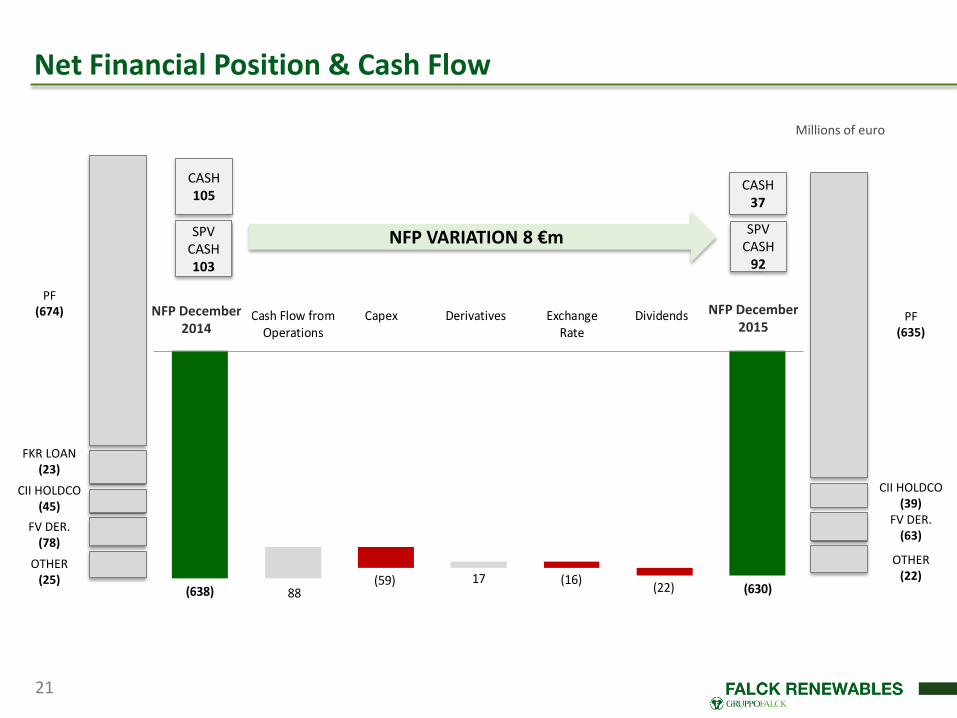
Net Financial Position & Cash Flow
21
CASH37
SPV CASH
92
NFP VARIATION 8 €m
CASH105
SPV CASH103
(638) (630)88(59) 17 (16)
(22)
NFP December2014
Cash Flow fromOperations
Capex Derivatives ExchangeRate
Dividends NFP December2015
NFP December2014
NFP December2015
PF(674)
FKR LOAN(23)
CII HOLDCO (45)
FV DER. (78)
OTHER (25)
PF(635)
CII HOLDCO (39)
FV DER. (63)
OTHER (22)
Millions of euro

Debt Breakdown
NFP Plant under construction/in operation
€ 52m
€504.1m
13%
87%
€81.6m
22
1%
91%
8%Finanziamenti con Ricorso (1%)
Finanziamenti Project Finance Senza Ricorso (91%)
Altri Finanziamenti Senza Ricorso (8%)89%
11%
% Coperture / PFN senza derivati (€566,6mln)
% Coperta dalla variazione dei tassi (89%)
% Non Coperta dalla variazione dei tassi (11%)
Gross Debt Nature without derivatives % NFP without derivatives hedged
Financing with recourse
Project Financing without recourse
Other financings without recourse
Hedged
Un-hedged
Under Development and Construction
Operating Plants
€696.8m €566.6m
€629.9m
Average interest rate 5.5% (including interest rate swap)

Group overview
Financial Highlights FY 2015
Outlook and conclusions
23

2016: Value additions to an already solid portfolio
95.25 MW under construction
SPALDINGTON 11.75MW
AUCHROBERT 36.0 MW
KINGSBURN 22.5MW
Wind farm
COD expected
Wind h. full year
Project Financing
KINGSBURN H2 2016 ~ 3,200 Q4 2016
SPALDINGTON H2 2016 ~ 2,350 Q4 2016
ASSEL VALLEY IQ 2017 ~ 3,250 2017
AUCHROBERT IQ 2017 ~ 2,900 2017
ASSEL VALLEY 25.0 MW
24
Weighted average: > 3,000 hours /y
(GWh)
2015 2016E
+3%
Expexted production
On track to complete quality, ROC based, assets

25
2016: final remarks
Portfolio of quality assets
Vector Cuatro: interesting option to further grow and consolidate presence
Close monitoring of wholesale price evolution, regulatory changes and growth opportunities
Maintained financial discipline
NEW INDUSTRIAL PLAN IN AUTUMN
Continued focus on Opex and G&A efficiency
Dividend proposal: 4.5 € cent. per share

26
Contacts
IR Manager
Giorgio BottaMilan +39 02 2433 [email protected]
Via Alberto Falck 14-1620099 Sesto San GiovanniMilano
IR Consultant
Vincenza ColucciCDR Communication SrlTel. +39 335 [email protected]
www.falckrenewables.eu
Twitter@falckrenewables
IR Contacts FKR on line
Next events
May 12th, 2016Q1 Results
August 4th, 2016H15 Results
November 10th, 2016Q3 Results

27
Disclaimer
This document has been prepared by Falck Renewables S.p.A. (the "Company") for use during meetings with investors and financialanalysts and is solely for information purposes. The information set out herein has not been verified by an independent auditcompany.Neither the Company nor any of its subsidiaries, affiliates, branches, representative offices (the “Group”), as well as any of theirdirectors, officers, employees, advisers or agents (the “Group Representatives”) accepts any responsibility for/or makes anyrepresentation or warranty, express or implied, as to the accuracy, timeliness or completeness of the information set out herein orany other related information regarding the Company and/or Group, whether written, oral or in visual or electronic form, transmittedor made available.This document may contain forward-looking statements about the Company and/or the Group based on Company’s current views,beliefs, expectations, opinions, as well as based on current plans, estimates, assumptions, projections and projects of the Companyand/or Group. These forward-looking statements are subject to significant risks, uncertainties and other factor (many of which arebeyond the Company and/or the Group’s control) which might cause actual results, performance or achievements to be materiallydifferent from any future results, performance or achievements expressed or implied by these forward-looking statements. Giventhese risks, uncertainties and other factors, you should not place undue reliance on the forward-looking statements in this document.The information set out in this document is provided as of the date indicated herein. Except as required by applicable laws andregulations, the Company assumes no obligation to provide updates of any of the aforesaid forward-looking statements or to conformthese statements to its actual results.Under no circumstances shall the Company, the Group and/or any of the Group Representatives be held liable (for negligence orotherwise) for any loss or damage howsoever arising from any use of this document or its contents or otherwise in connection withthe document or the aforesaid forward-looking statements.This document does not constitute an offer to sell or a solicitation to buy or subscribe the shares of the Company or Group andneither this entire document or a portion of it may constitute a recommendation to effect any transaction or to conclude any legal actof any kind whatsoever.This document may not be reproduced or distributed, in whole or in part, by any person other than the Company.By viewing and/or accepting a copy of this document, you agree to be bound by the foregoing limitations.