Standard Traditional Meta-Analysis Different times since start of treatment Mantel-Haenszel...
40
Standard Traditional Meta-Analysis •Different times since start of treatment •Mantel-Haenszel approach
-
Upload
harold-allison -
Category
Documents
-
view
218 -
download
0
Transcript of Standard Traditional Meta-Analysis Different times since start of treatment Mantel-Haenszel...

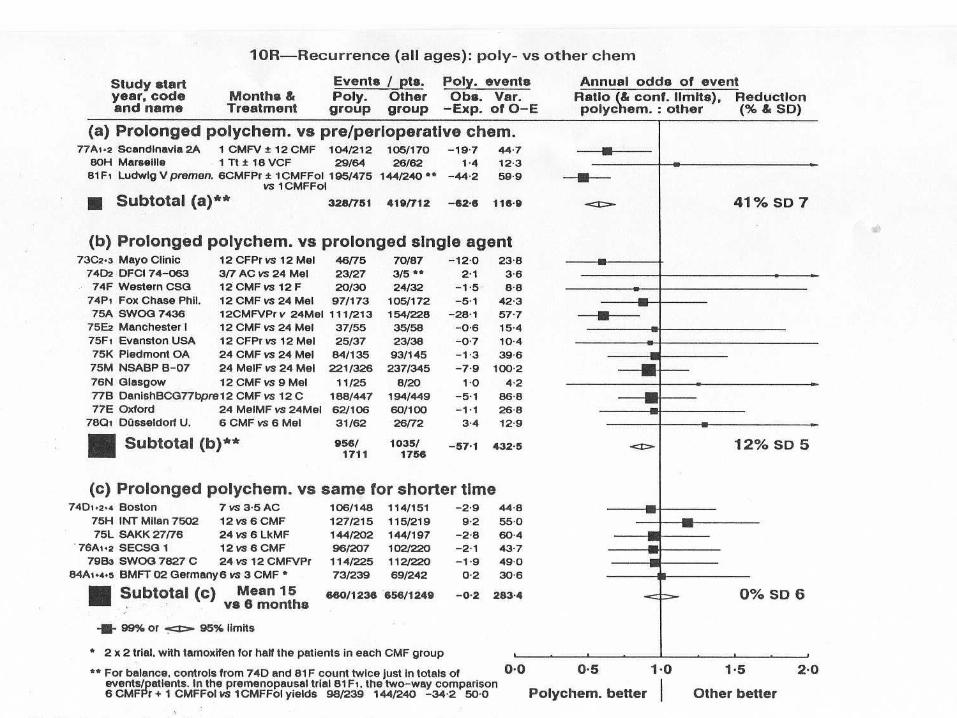
Standard Traditional Meta-Analysis
•Different times since start of treatment
•Mantel-Haenszel approach
Analysis of a Single Time Interval (1)
Treatment Deaths Survivors Total
A
B
Total
6
5
11
20
24
44
26
29
55
Treatment A: Observed deaths = 0 = 6
Expected deaths = E = (11 × 26)/55
= 5.200
Variance = V = (11 × 44 × 26 × 29)/552 × 54) = 2.234
Odds ratio = OR = (6/20)/5/24)
= 1.440
Log (OR) = LOR = 0.365
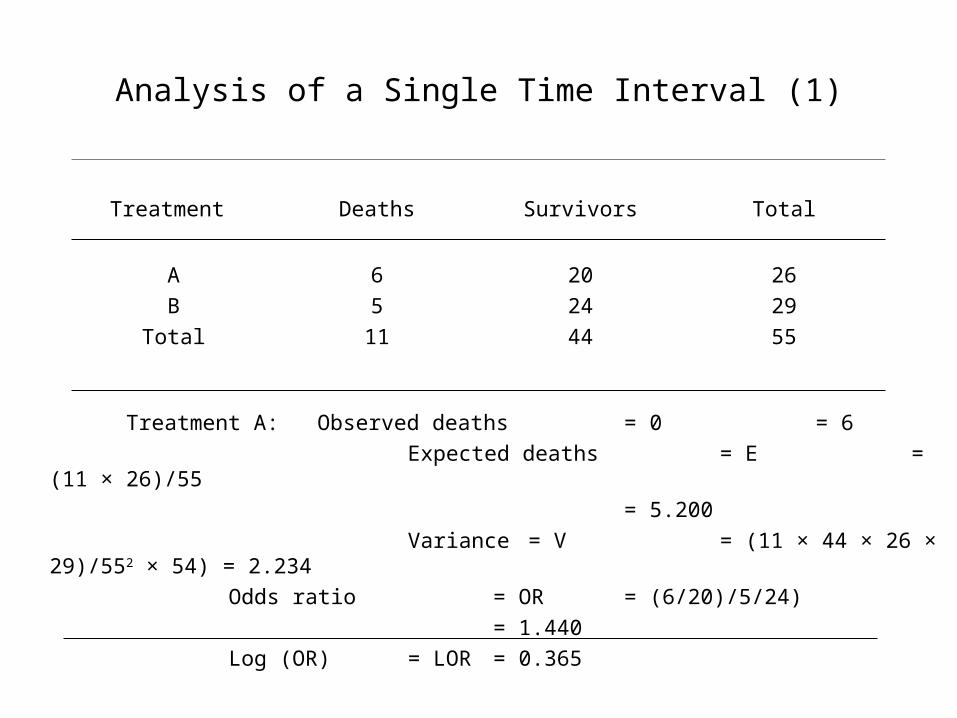
Analysis of a Single Time Interval (2)
Log (OR) = 0.365
LORapprox = (0 – E)/V = 0.358
Variance (LOR) = 1/V = 0.448
SD = 0.669
95% CI (LOR) = (0.358 – 1.96 × 0.669)
to
(0.358 + 1.96 × 0.669)
= (- 0.953, 1.669)
95% CI (OR) = (0.38, 5.41)

Analysis of Multiple Time Intervals
Time Interval 0 E V
1
2
3
:
01
02
03
:
E1
E2
E3
:
V1
V2
V3
:
Meta-analysis 0 E V
log (OR) = (0 - E)/V
etc.

Standard Traditional Meta-Analysis
•Different hospitals within a trial

Standard Traditional Meta-Analysis
•Checking the assumptions: is the hazard ratio between treatments constant between different circumstances (time since treatment began, prognostic factors, hospitals, etc)?
•Power to test these assumptions is generally weak - need biological insight: e.g. ER+ve vs ER-ve

(1) Make bold, simplifying assumptions; look at as wide arange of data as possible; be critical but notpernickety. Do not be disturbed if the data does notexactly fit the model.
(2) It is important not to place too much reliance on anysingle piece of evidence, since some data is bound tobe misleading if not plain wrong.
(3) Make no assumptions that can not be doubted fromtime to time.
(4) Almost all aspects of life are engineered at themolecular level, and without understanding moleculeswe can only have a very sketchy understanding of lifeitself.
See Francis Crick "What Mad Pursuit".
‘New’ Forms of Meta-Analysis
•Different trials
•Different trials with ‘slightly’ different regimens
•Different trials with ‘slightly’ different definitions of prognostic factors that influence drug response

‘New’ Forms of Meta-Analysis
•What contributes to differences between trials?
•Regimens used?
•General health of patients?
•Support services?
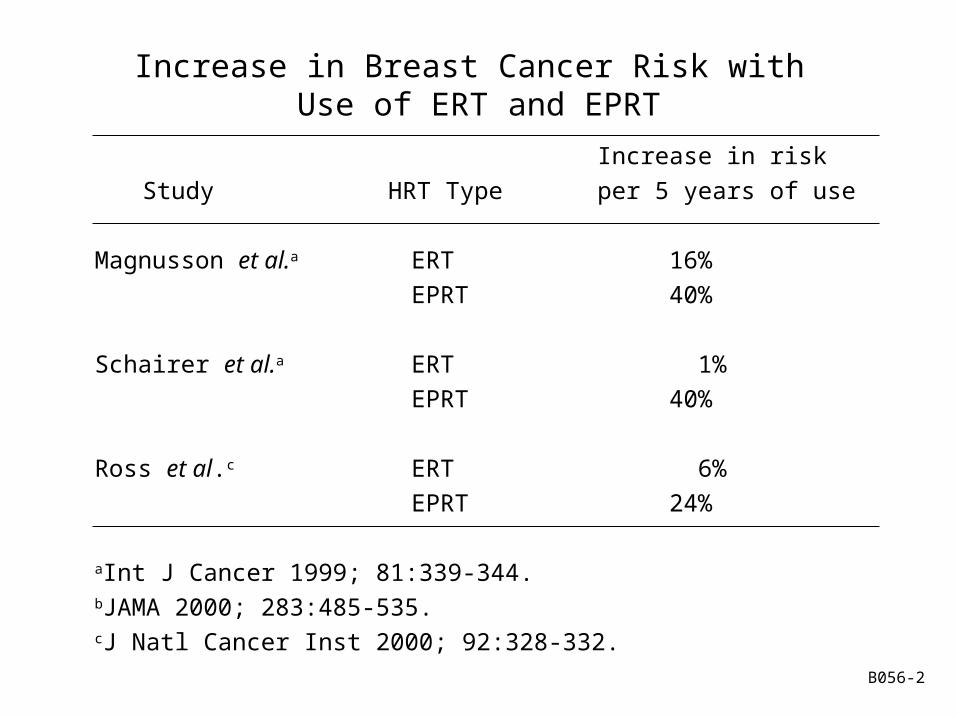
Increase in Breast Cancer Risk with Use of ERT and EPRT
Increase in risk
Study HRT Type per 5 years of use
Magnusson et al.a ERT 16%
EPRT 40%
Schairer et al.a ERT 1%
EPRT 40%
Ross et al.c ERT 6%
EPRT 24%
aInt J Cancer 1999; 81:339-344.bJAMA 2000; 283:485-535.cJ Natl Cancer Inst 2000; 92:328-332.
B056-2
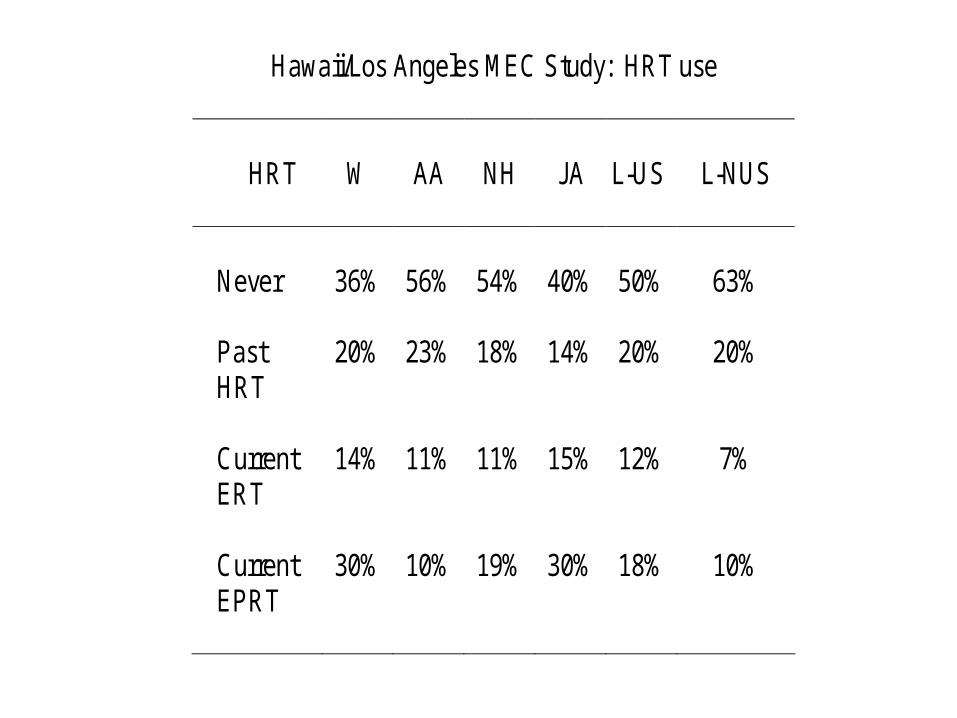
Hawaii/Los Angeles MEC Study: HRT use
HRT W AA NH JA L-US L-NUS
Never 36% 56% 54% 40% 50% 63% Past HRT
20% 23% 18% 14% 20% 20%
Current ERT
14% 11% 11% 15% 12% 7%
Current EPRT
30% 10% 19% 30% 18% 10%
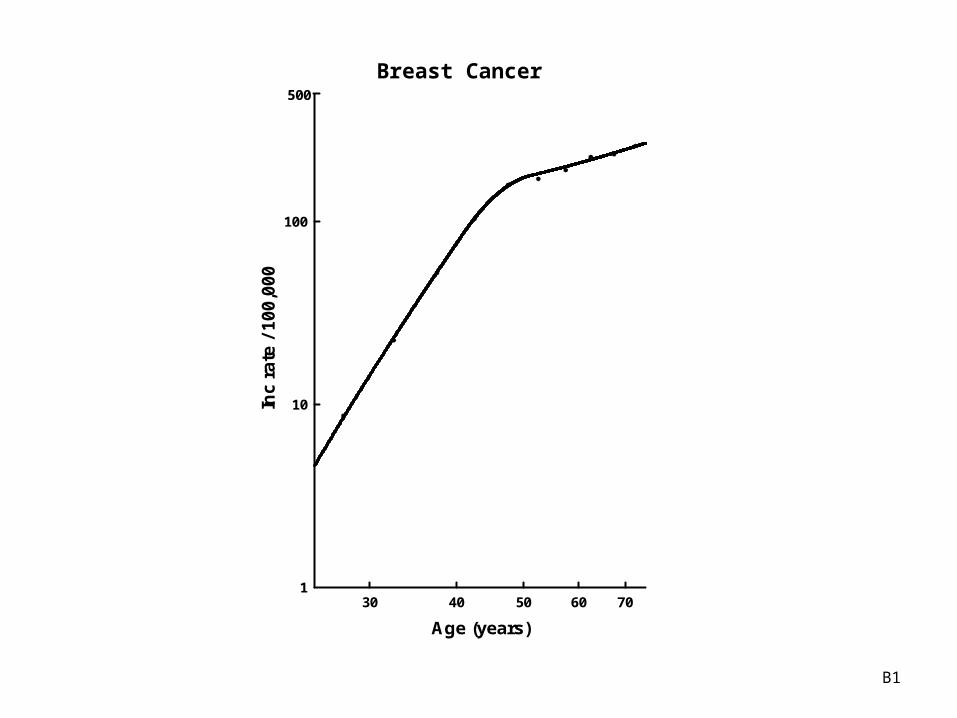
Age (years)
30 40 50 60 70
Inc
ra
te /
10
0,0
00
1
10
100
500
Breast Cancer
B1
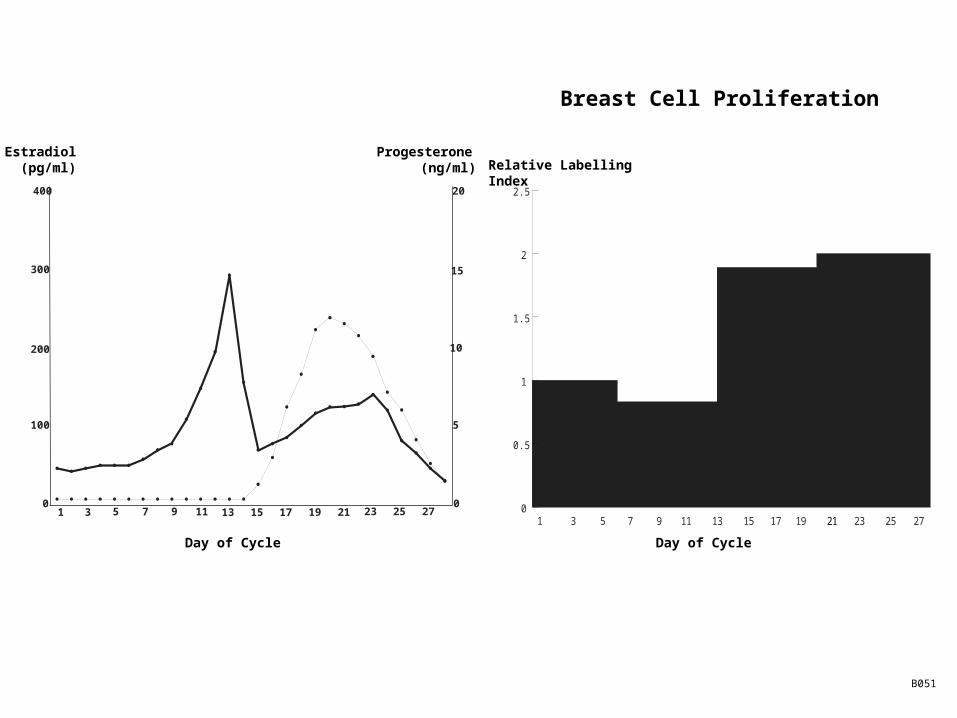
Day of Cycle
Estradiol (pg/ml)
Progesterone (ng/ml)
Day of Cycle
0
0.5
1
1.5
2
2.5
1 3 5 7 9 11 13 15 17 19 21 23 25 271 5 7 9 13 17 19 23
Relative Labelling Index
3 5 7 9 11 13 15 17 19 21 23 25 271
400
300
200
100
0 0
5
10
15
20
Breast Cell Proliferation
B051

Breast cell mitotic rate on continuous-combined estrogen-progestin replacement therapy is more than double that of estrogen replacement therapy.
Hofseth et al. (JCEM 1999; 84:4559-4565).

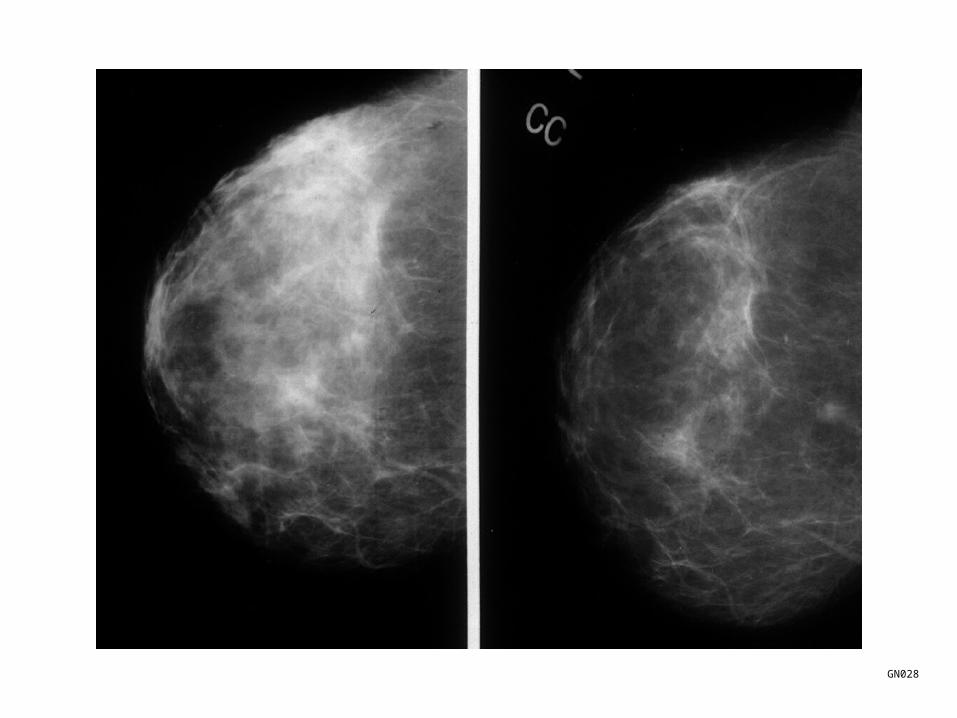
HRT and Mammographic Densities: BI-RADS Changes in the PEPI Trial*
BI-RADS Categorization: (1) Entirely fatty (2) Fatty with scattered fibroglandular tissue (3) Heterogeneously dense (4) Extremely dense
Women with an increase in Estrogen† Progestin‡ BI-RADS Category after 12 months ________________________________________________________________________
Placebo Placebo 0% CEE (0.625 mg/d) Placebo 3.5% CEE (0.625 mg/d) MPA (10 mg/d; 12 days/mo) 23.5% CEE (0.625 mg/d) MPA (2.5 mg/d) 19.4% CEE (0.625 mg/d) MP (200 mg/d; 12 days/mo) 16.4% *Greendale et al. (Ann Int Med 1999; 130:262-269). †CEE = conjugated equine estrogens. ‡MPA = medroxyprogesterone acetate. MP = micronized progesterone.
B123
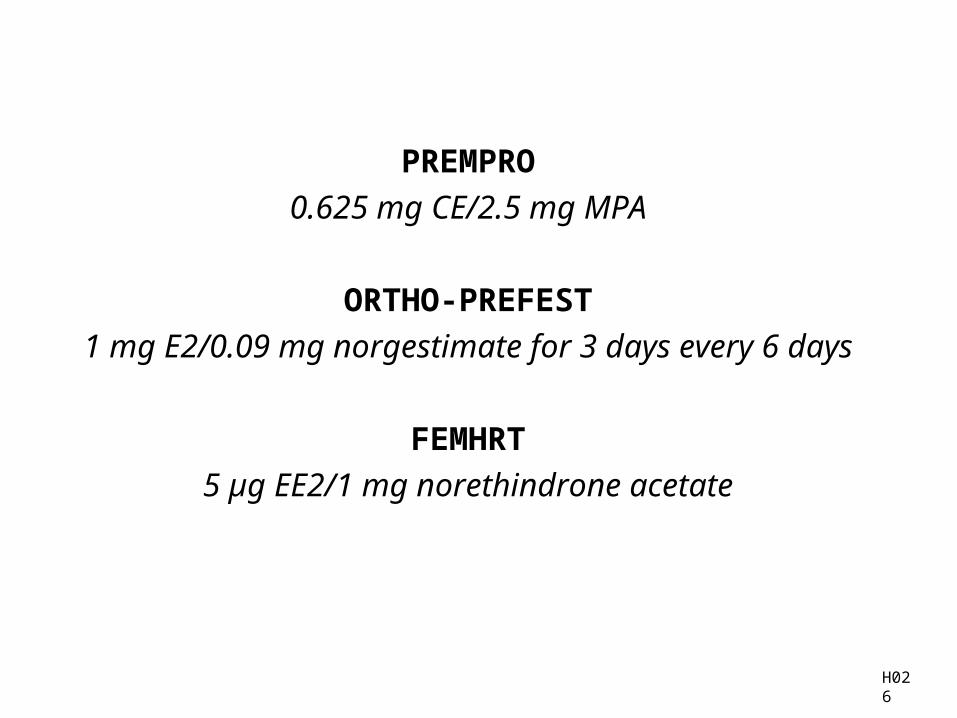
PREMPRO
0.625 mg CE/2.5 mg MPA
ORTHO-PREFEST
1 mg E2/0.09 mg norgestimate for 3 days every 6 days
FEMHRT
5 µg EE2/1 mg norethindrone acetate
H026

Approaches to Reducing Breast Progestin Exposure with HRT
1. Use of progestin for 12-14 days every 3 months.
Ettinger et al. (Obstet Gynecol 1994; 83: 693-700).
Williams et al. (Obstet Gynecol 1994; 84: 787-793).
E060

Approaches to Reducing Breast Progestin Exposure with HRT
2. Use an intra-uterine device - delivers local progestin
with little systemic effect. Shoupe et al.
(N Engl J Med 1991; 325: 1811-1813).
E060
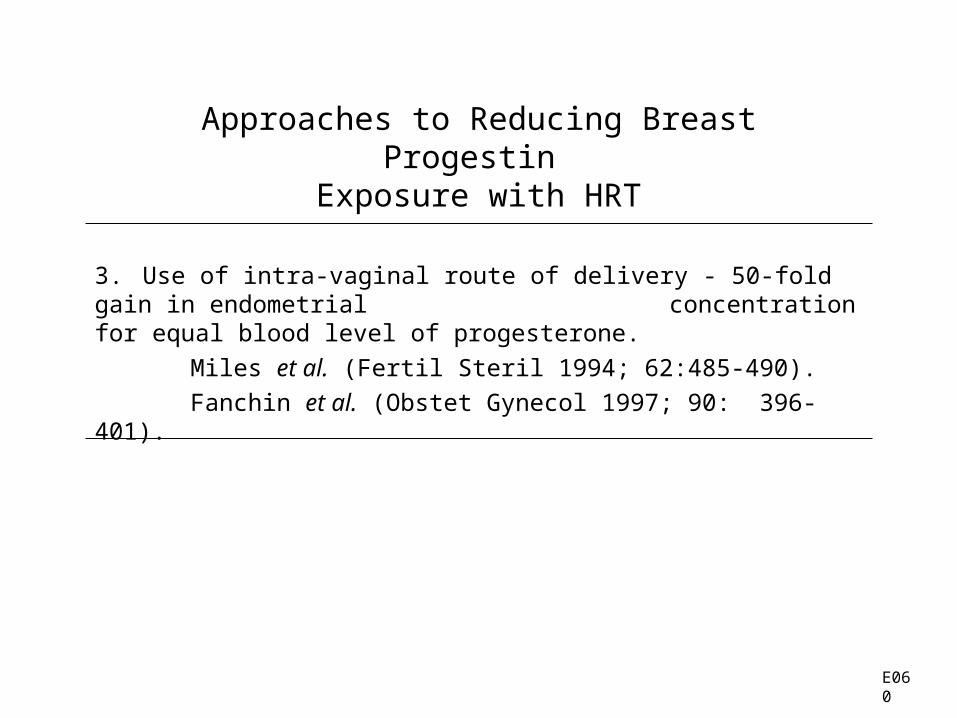
Approaches to Reducing Breast Progestin Exposure with HRT
3. Use of intra-vaginal route of delivery - 50-fold gain in endometrial concentration for equal blood level of progesterone.
Miles et al. (Fertil Steril 1994; 62:485-490).
Fanchin et al. (Obstet Gynecol 1997; 90: 396-401).
E060

Meta-Analysis or Large Trial Problems
•The study does not address the right question.
E.g. the WHI uses EPRT as the HRT arm.

TR034
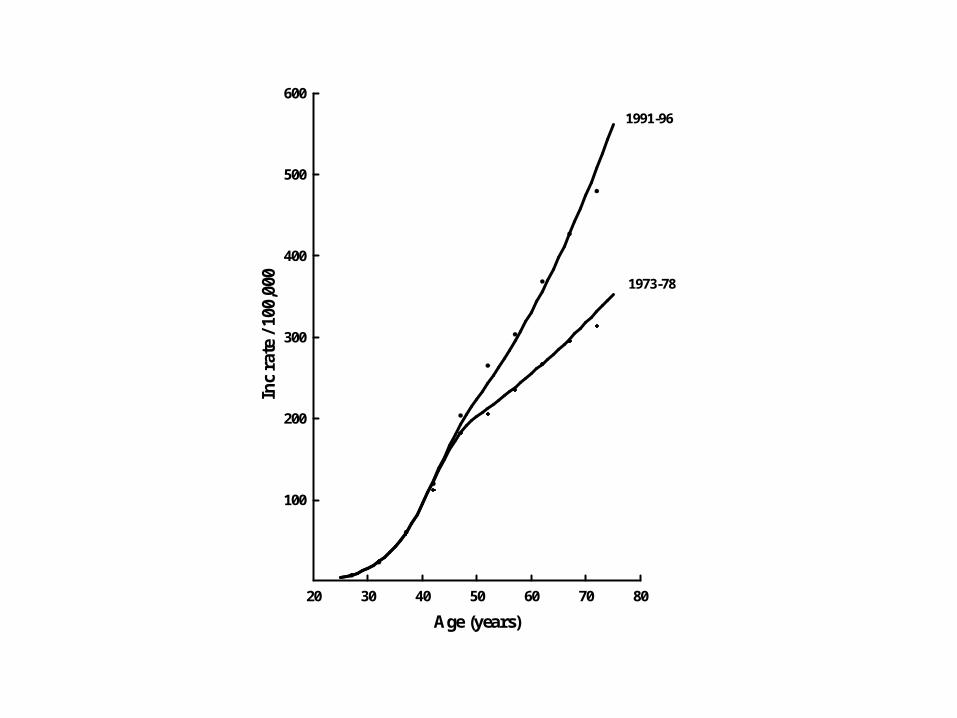
Age (years)
20 30 40 50 60 70 80
Inc
rate
/ 10
0,00
0
100
200
300
400
500
600
1973-78
1991-96


First author % fat calories
(year) Intervention
PremenopausalWoods (1989) 25
Hagerty (1988) 25
Rose (1987) 21
Boyd (1997) 21
Williams (1989) 20
Goldin (1994) 20
Woods (1996) 20
Ingram (1987) 18
Schaefer (1995) 18
Bogga (1995) 12
PostmenopausalCrighton (1992) 24
Prentice (1990) 20
Ingram (1987) 18
Heber (1991) 10
All studies
All above excluding Bagga (1995) and Heber (1991)
0 0.5 1 1.5 2
Estradiol level (relative to baseline) Hor018
Hormonal Breast Cancer Chemoprevention in Premenopausal
Women
How do we prove that breast cancer prevention
will occur?
(a) Randomized trials?
(b) Common sense?
Mammographic changes?
Breast cell proliferation?
(c) Show that the proposed chemopreventive
regimen is an ‘acceptable’
contraceptive? This route means that
the regimen has to be inexpensive.
Hormonal Breast Cancer Chemoprevention in Premenopausal
Women
Can we maintain the protection against ovarian
cancer and endometrial cancer afforded by
the Pill?
Hormonal Breast Cancer Chemoprevention in Premenopausal
Women
Menopausal symptoms
QOL
Bone
CVD
StrokeDVT
Mode of delivery: oral; patch; intra-nasal
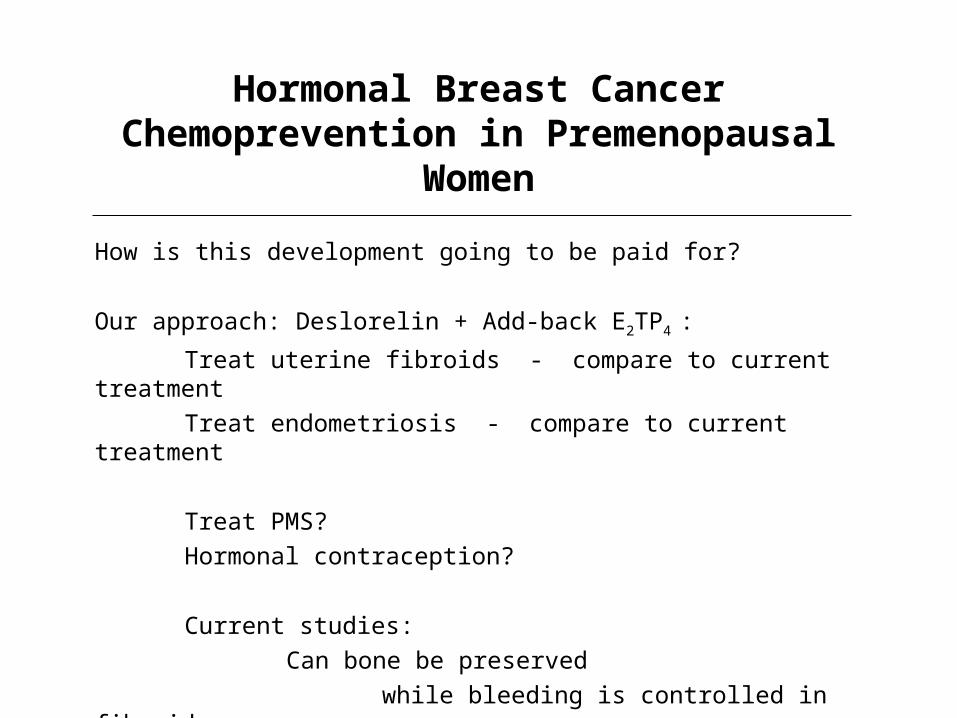
Hormonal Breast Cancer Chemoprevention in Premenopausal Women
How is this development going to be paid for?
Our approach: Deslorelin + Add-back E2TP4 :
Treat uterine fibroids - compare to current treatment
Treat endometriosis - compare to current treatment
Treat PMS?
Hormonal contraception?
Current studies:
Can bone be preserved
while bleeding is controlled in fibroids
while endometriosis is controlled

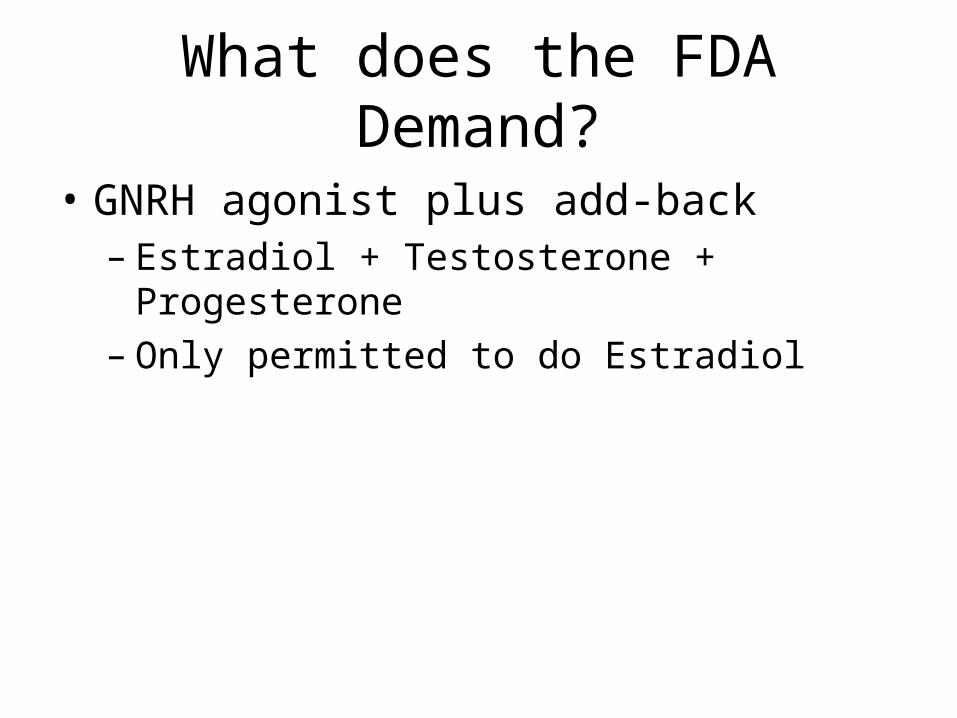
What does the FDA Demand?
• GNRH agonist plus add-back– Estradiol + Testosterone + Progesterone– Only permitted to do Estradiol

Risk of Breast Cancer and Postmenopausal
Serum Estradiol Concentrationa
Serum E2 Concentration (pmol/L)
Odds Ratio (with 95% CI)
<30.7 1.0 30.7-41.0 2.5 (1.0-6.4)
>41.0 5.0 (2.0-12.5)
(p < 0.001)
aThomas et al. (Br J Cancer 1997; 76: 401-405).
O028
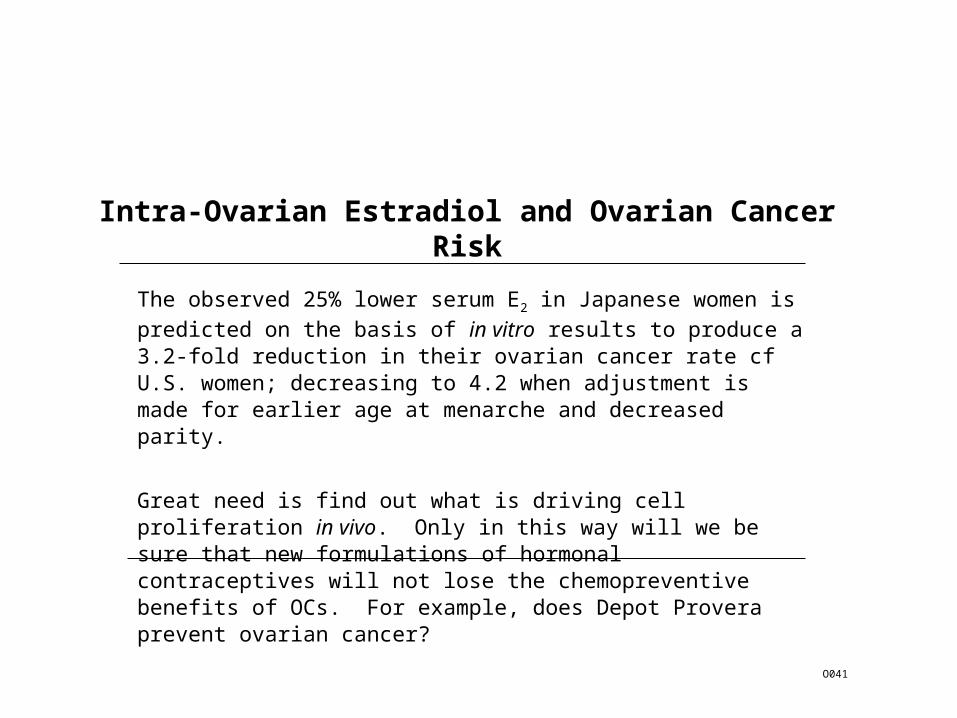
Intra-Ovarian Estradiol and Ovarian Cancer Risk
The observed 25% lower serum E2 in Japanese women is predicted on
the basis of in vitro results to produce a 3.2-fold reduction in their ovarian cancer rate cf U.S. women; decreasing to 4.2 when adjustment is made for earlier age at menarche and decreased parity.
Great need is find out what is driving cell proliferation in vivo. Only in this way will we be sure that new formulations of hormonal contraceptives will not lose the chemopreventive benefits of OCs. For example, does Depot Provera prevent ovarian cancer?
O041
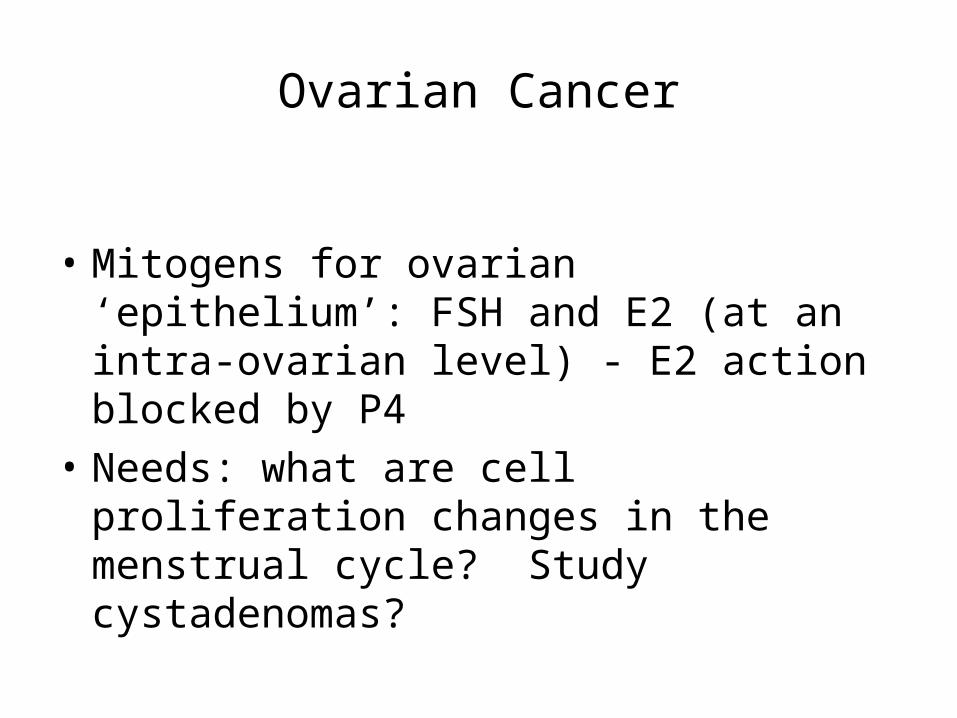
Ovarian Cancer
• Mitogens for ovarian ‘epithelium’: FSH and E2 (at an intra-ovarian level) - E2 action blocked by P4
• Needs: what are cell proliferation changes in the menstrual cycle? Study cystadenomas?

Standard Traditional Meta-Analysis
•Adjusting for prognostic factors

Standard Traditional Meta-Analysis
•Adjusting for prognostic factors
•Cox Proportional hazard approach

Standard Traditional Meta-Analysis
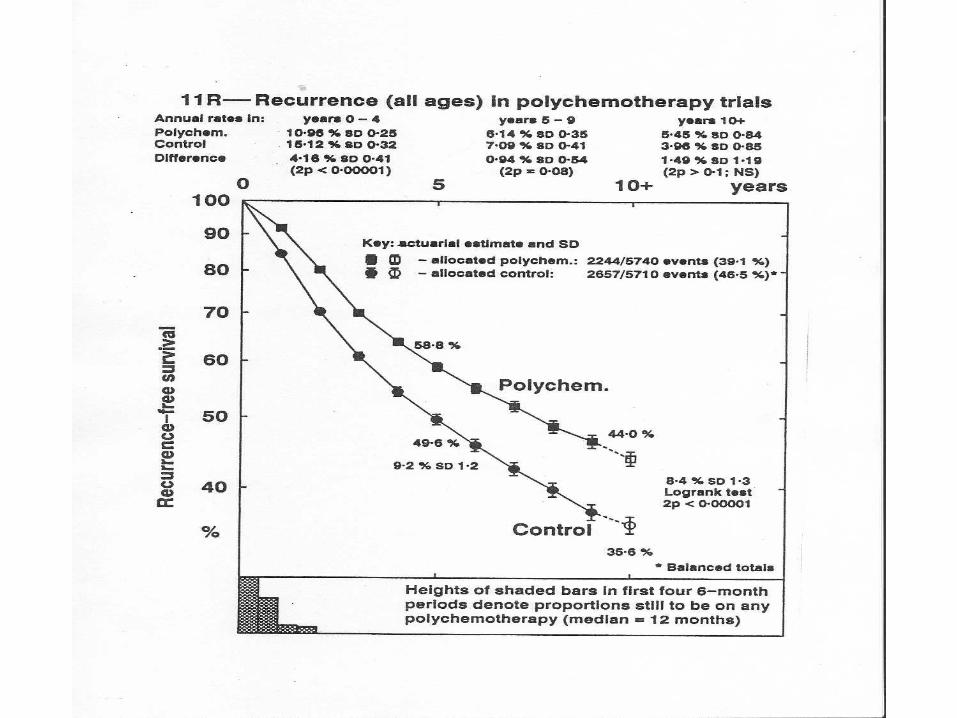
•What is the final survival curve comparison?
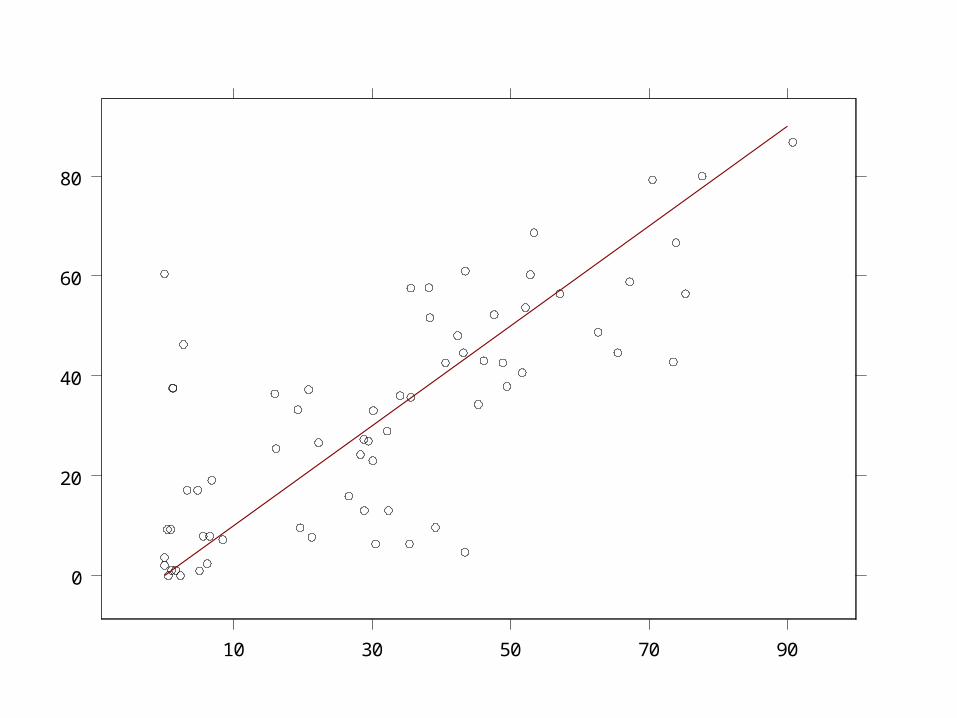
10 30 50 70 90
0
20
40
60
80
GN028