Stakeholder Meeting Terasen Integrated Resource PlanTerasen Integrated ... · Terasen Integrated...
27
Stakeholder Meeting Terasen Integrated Resource Plan Terasen Integrated Resource Plan February 2, 2010
Transcript of Stakeholder Meeting Terasen Integrated Resource PlanTerasen Integrated ... · Terasen Integrated...
Stakeholder MeetingTerasen Integrated Resource PlanTerasen Integrated Resource Plan
February 2, 2010
SummaryAbout the NWGANW Energy FactsNW Energy FactsPolicy OverviewNW Gas Market ForecastObservationsObservations
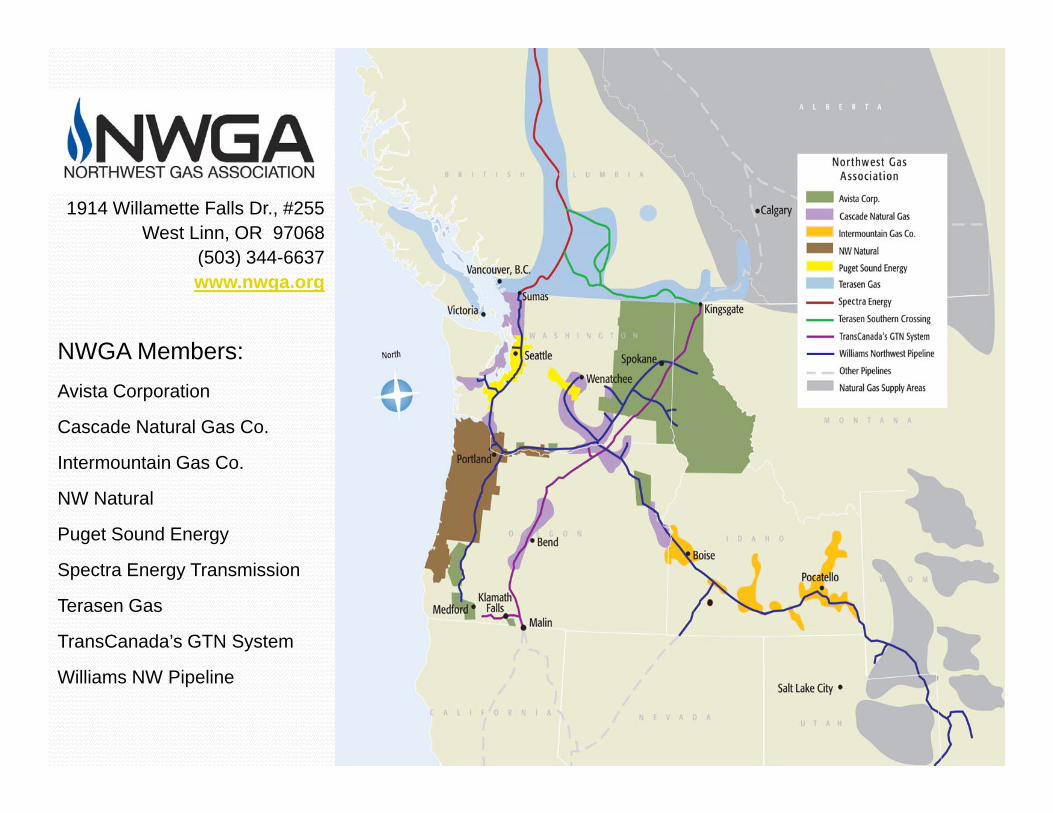
1914 Willamette Falls Dr., #255West Linn, OR 97068
(503) 344 6637(503) 344-6637www.nwga.org
NWGA Members:NWGA Members:Avista Corporation
Cascade Natural Gas Co.
I t t i G CIntermountain Gas Co.
NW Natural
Puget Sound Energy
Spectra Energy Transmission
Terasen Gas
TransCanada’s GTN System
Williams NW Pipeline
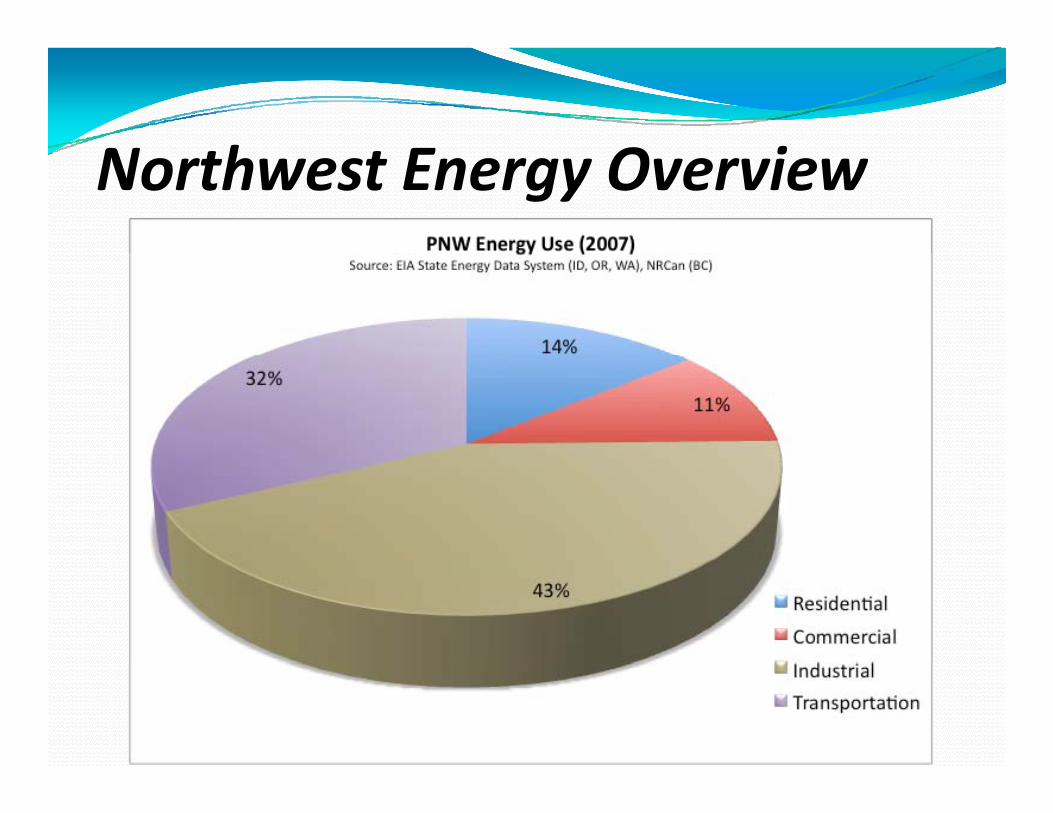
N h E O iNorthwest Energy Overview
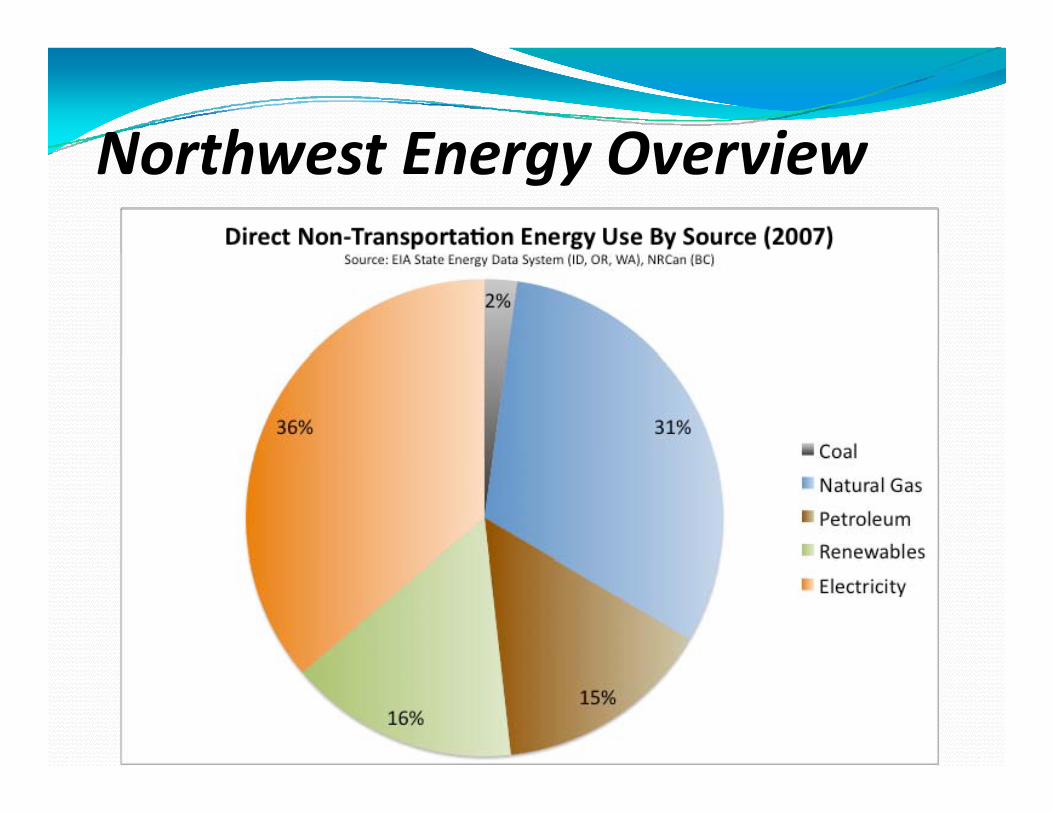
Northwest Energy OverviewNorthwest Energy Overview
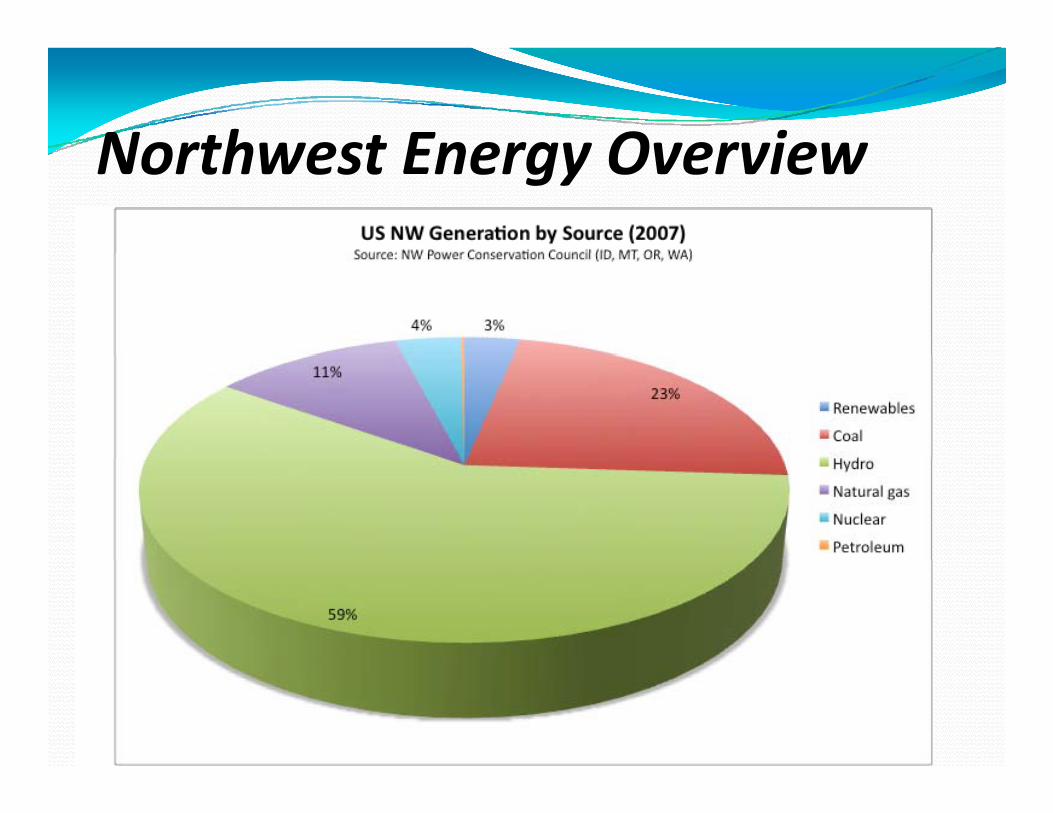
Northwest Energy OverviewNorthwest Energy Overview
Northwest Energy Overview
2,874,335 residential gas customers
300,454 commercial gas customers
6,247 industrial gas customers
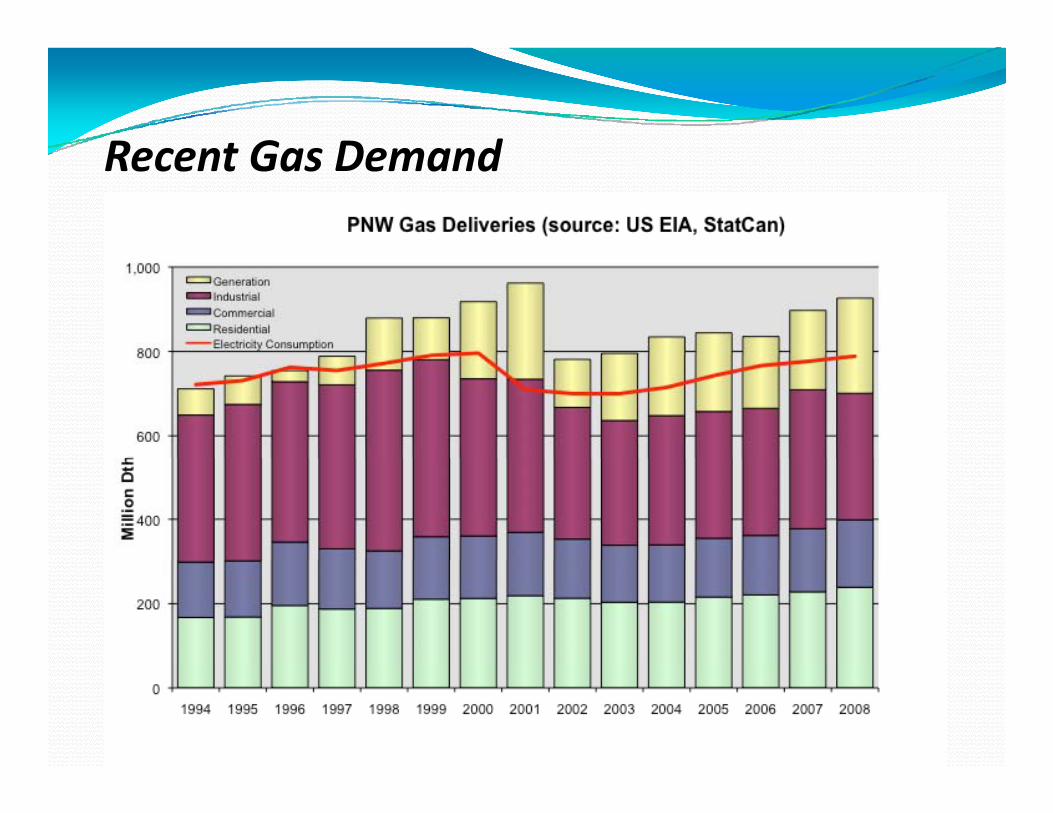
Recent Gas DemandRecent Gas Demand
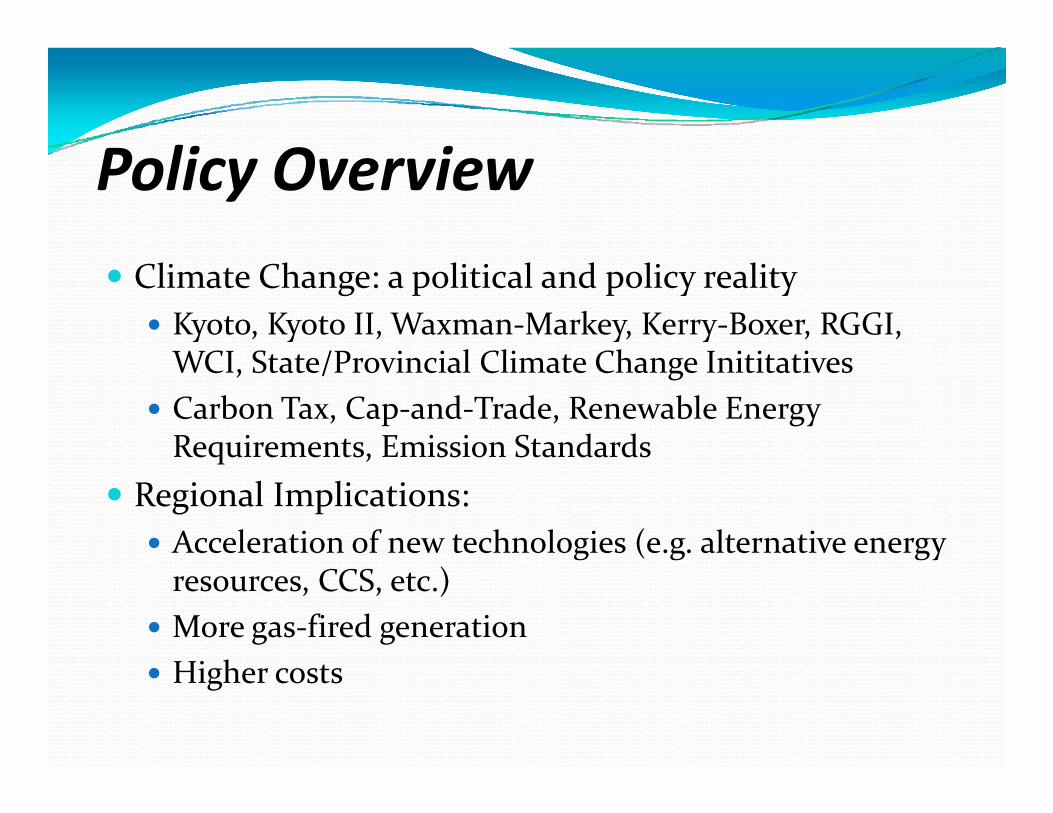
P li O iPolicy Overview
Climate Change: a political and policy reality Kyoto, Kyoto II, Waxman-Markey, Kerry-Boxer, RGGI,
WCI St t /P i i l Cli t Ch I itit tiWCI, State/Provincial Climate Change Inititatives Carbon Tax, Cap-and-Trade, Renewable Energy
Requirements, Emission Standardsq , Regional Implications:
Acceleration of new technologies (e.g. alternative energy resources, CCS, etc.)
More gas-fired generationHi h Higher costs
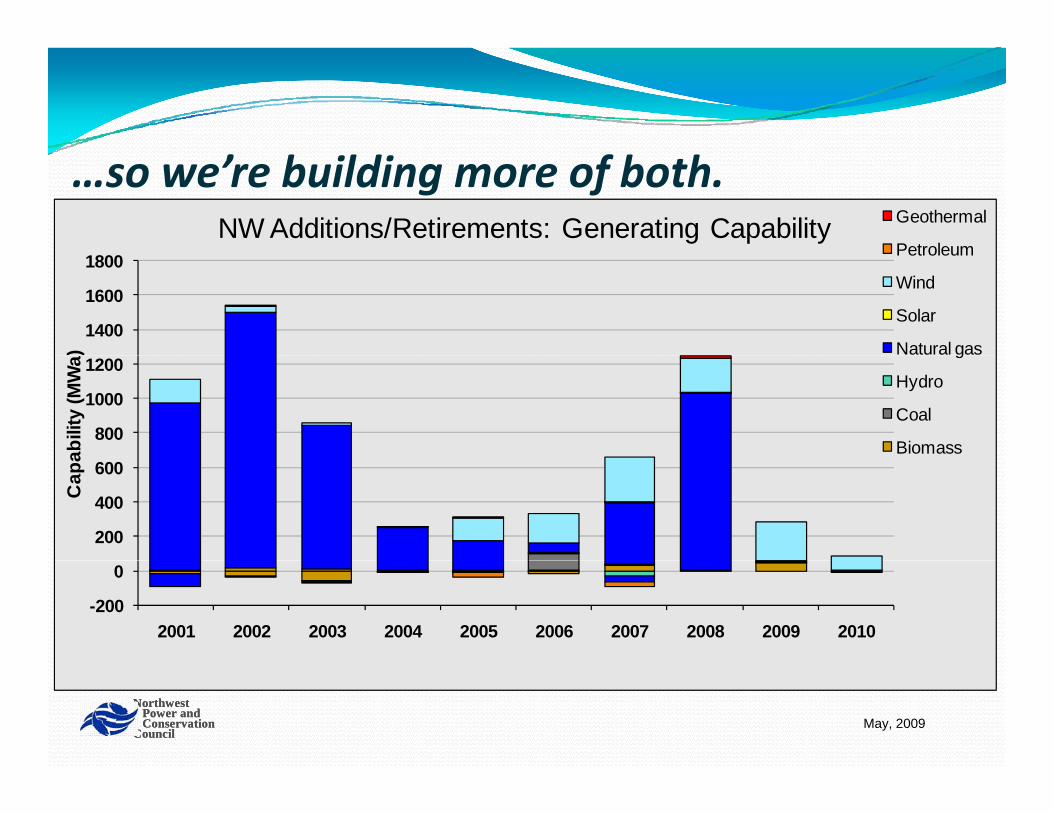
…so we’re building more of both.NW Additions/Retirements: Generating Capability Geothermal
Petroleum
1400
1600
1800
)
Petroleum
Wind
Solar
Natural gas
800
1000
1200
abili
ty (M
Wa g
Hydro
Coal
Biomass
200
400
600
Cap
a
-200
0
2001 2002 2003 2004 2005 2006 2007 2008 2009 2010
NorthwestPower andConservation
Council
NorthwestPower andConservation
CouncilMay, 2009
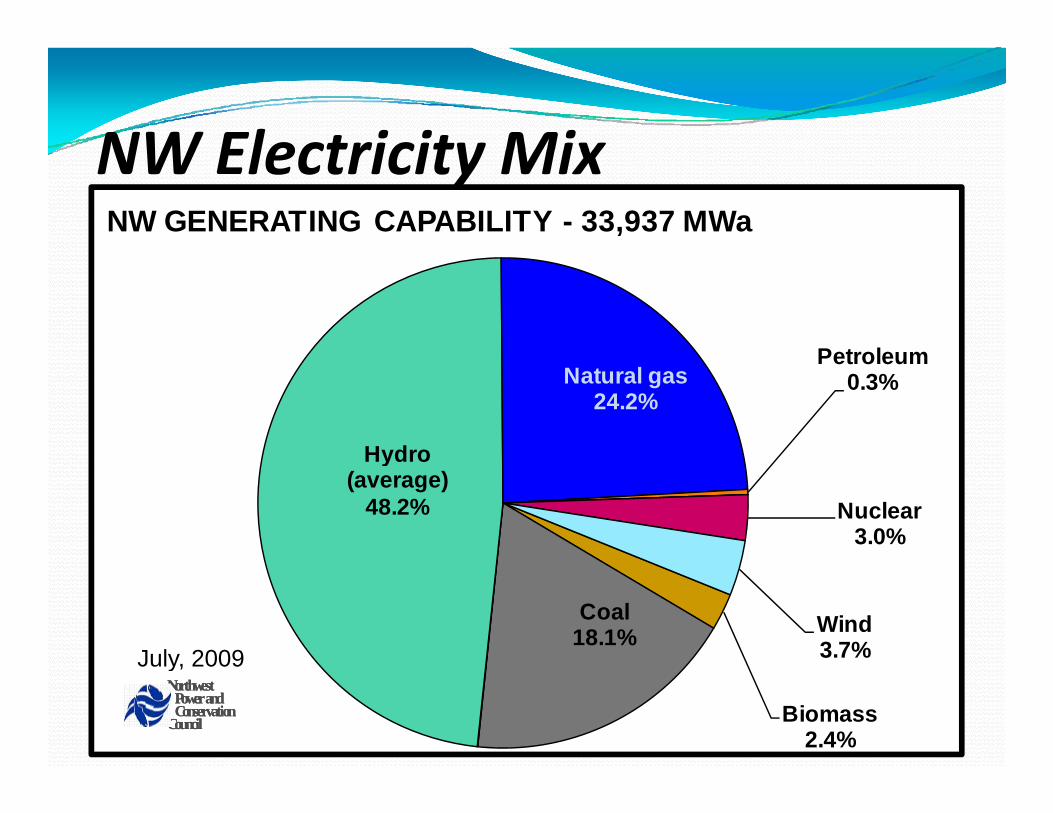
NW Electricity MixNW Electricity MixNW GENERATING CAPABILITY - 33,937 MWa
Petroleum
Hydro
Natural gas24.2%
Petroleum0.3%
Hydro (average)
48.2% Nuclear3.0%
Coal18.1% Wind
3.7%July 2009
Biomass2.4%
NorthwestPower andConservation
Council
NorthwestPower andConservation
Council
July, 2009
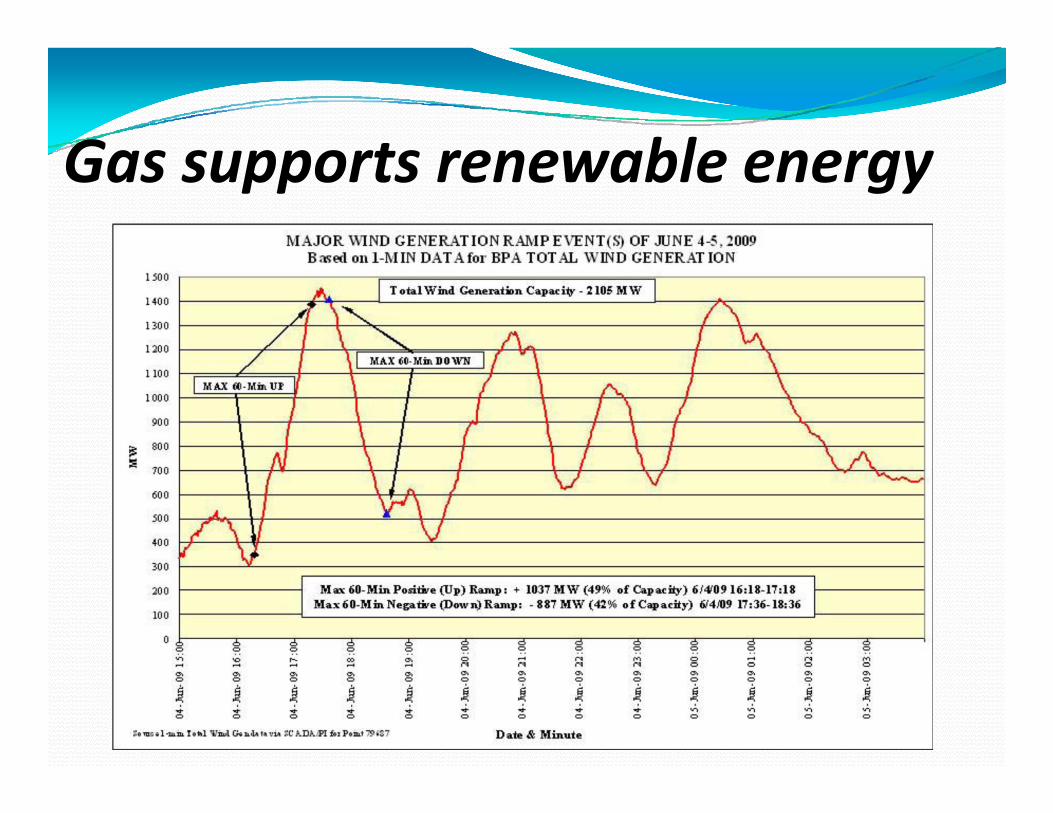
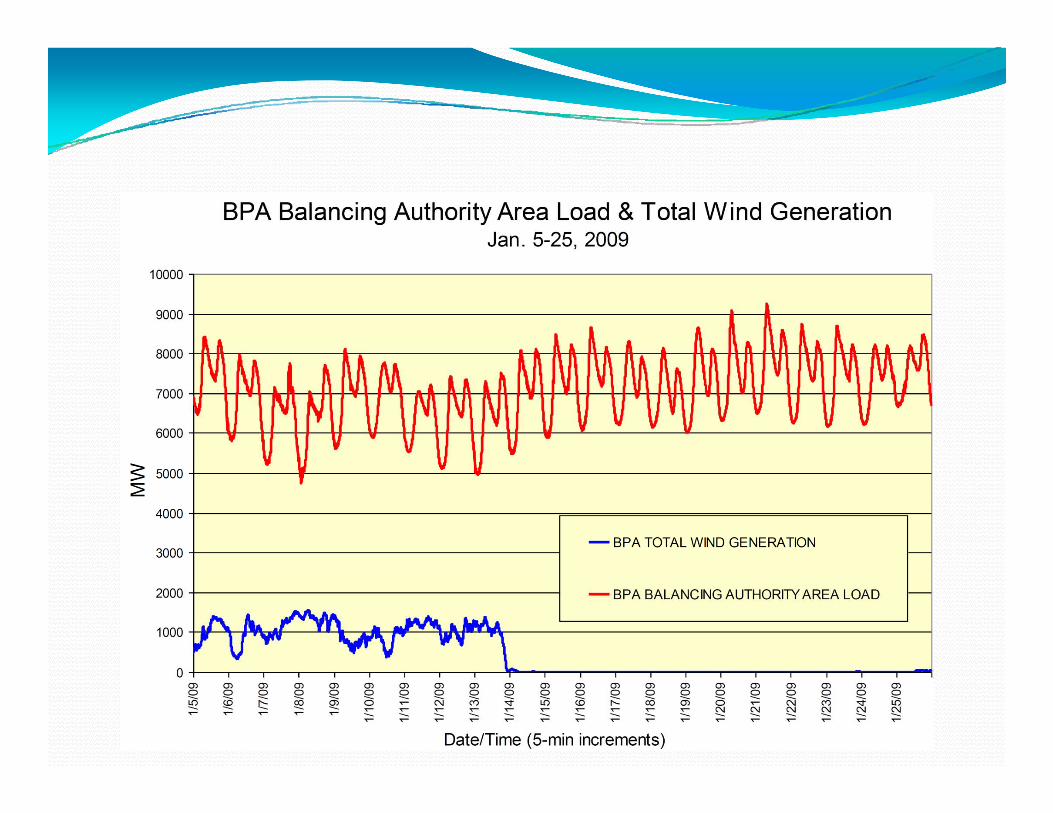
Gas s pports rene able energGas supports renewable energy
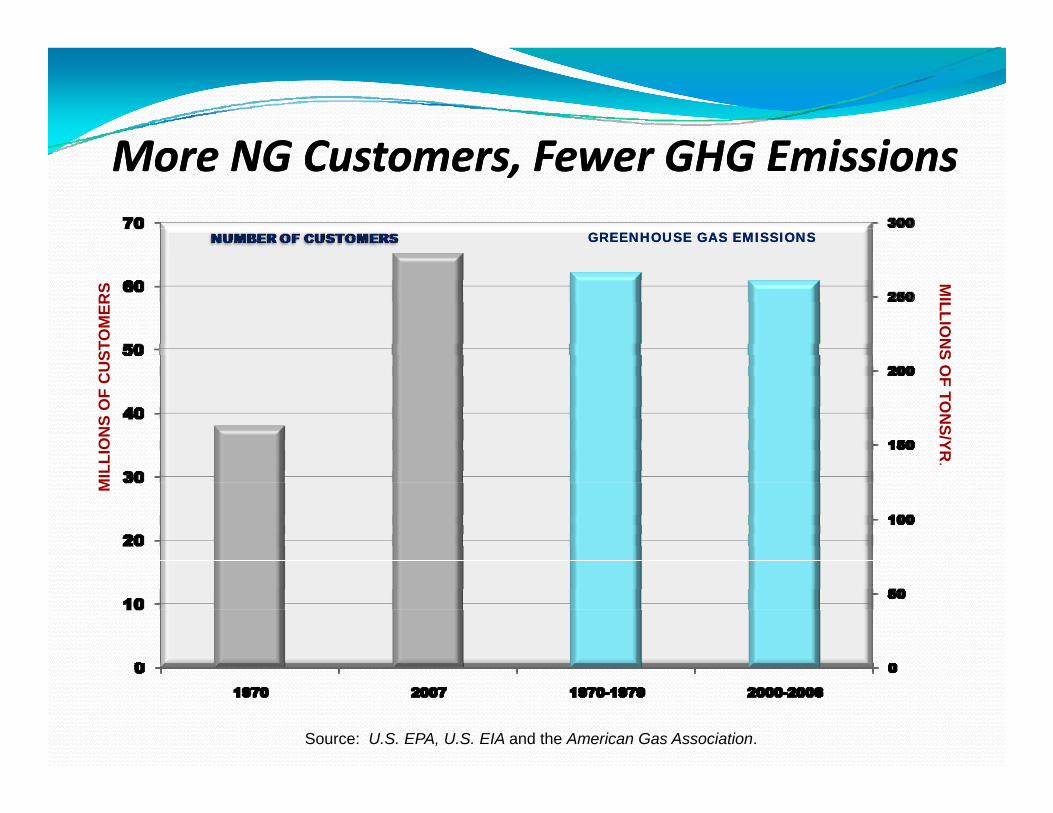
More NG Customers Fewer GHG EmissionsMore NG Customers Fewer GHG Emissions
GREENHOUSE GAS EMISSIONSGREENHOUSE GAS EMISSIONS
More NG Customers, Fewer GHG EmissionsMore NG Customers, Fewer GHG EmissionsM
ILLION
SST
OM
ERS
S OF TO
NS/YR
LIO
NS
OF
CU
SR
.M
ILL
Source: U.S. EPA, U.S. EIA and the American Gas Association.
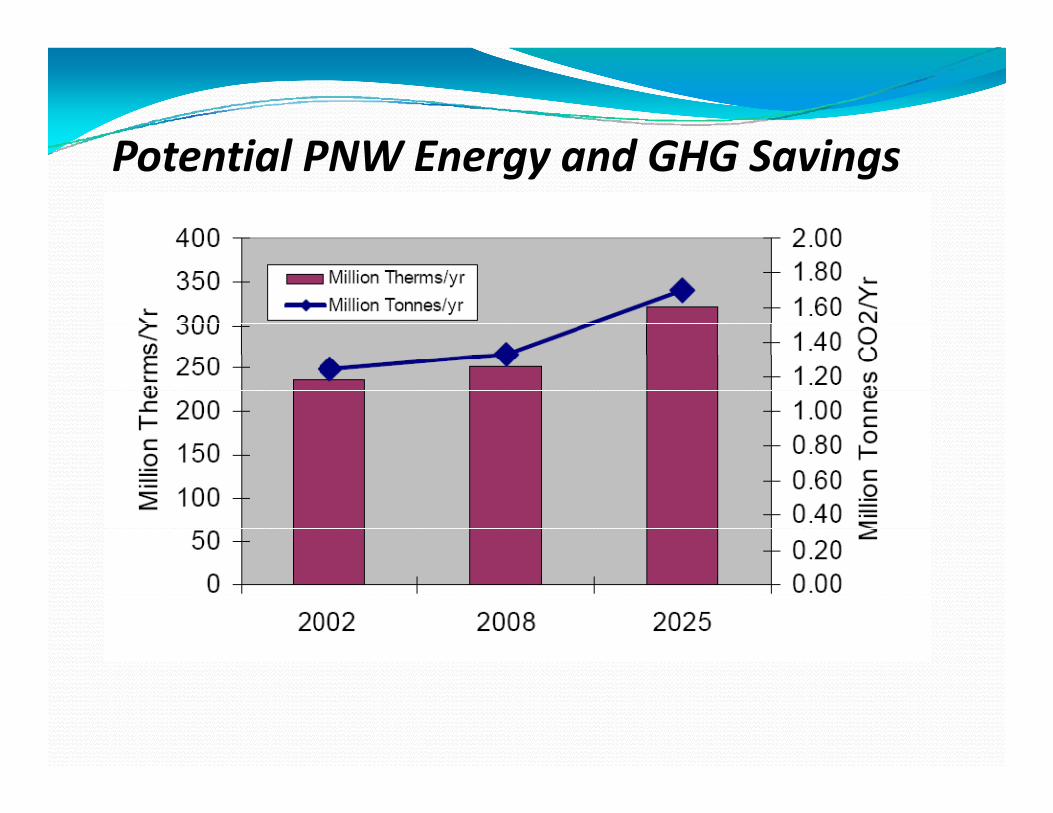
Potential PNW Energy and GHG SavingsPotential PNW Energy and GHG Savings
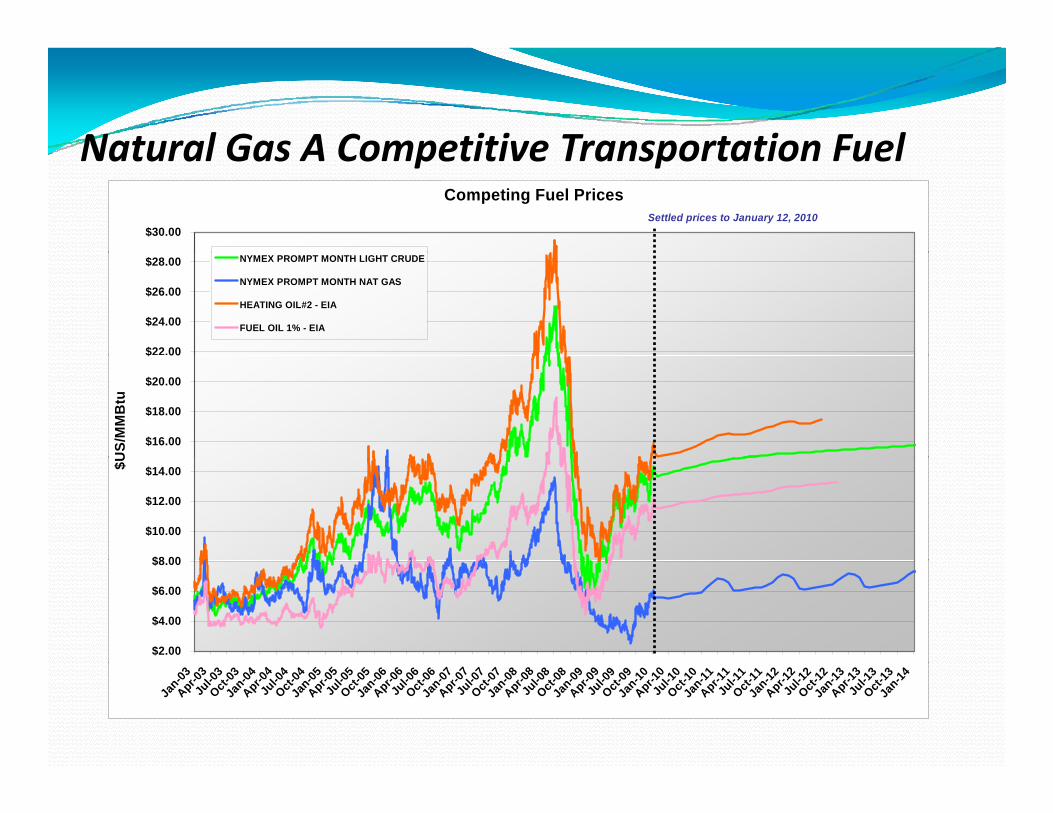
Natural Gas A Competitive Transportation FuelNatural Gas A Competitive Transportation FuelCompeting Fuel Prices
$30.00Settled prices to January 12, 2010
$22.00
$24.00
$26.00
$28.00 NYMEX PROMPT MONTH LIGHT CRUDE
NYMEX PROMPT MONTH NAT GAS
HEATING OIL#2 - EIA
FUEL OIL 1% - EIA
$16.00
$18.00
$20.00
$ 00
US/
MM
Btu
$8 00
$10.00
$12.00
$14.00$U
$2.00
$4.00
$6.00
$8.00
Jan-03
Apr-03
Jul-0
3Oct-
03Ja
n-04Apr-0
4Ju
l-04
Oct-04
Jan-05
Apr-05
Jul-0
5Oct-
05Ja
n-06Apr-0
6Ju
l-06
Oct-06
Jan-07
Apr-07
Jul-0
7Oct-
07Ja
n-08Apr-0
8Ju
l-08
Oct-08
Jan-09
Apr-09
Jul-0
9Oct-
09Ja
n-10Apr-1
0Ju
l-10
Oct-10
Jan-11
Apr-11
Jul-1
1Oct-
11Ja
n-12Apr-1
2Ju
l-12
Oct-12
Jan-13
Apr-13
Jul-1
3Oct-
13Ja
n-14
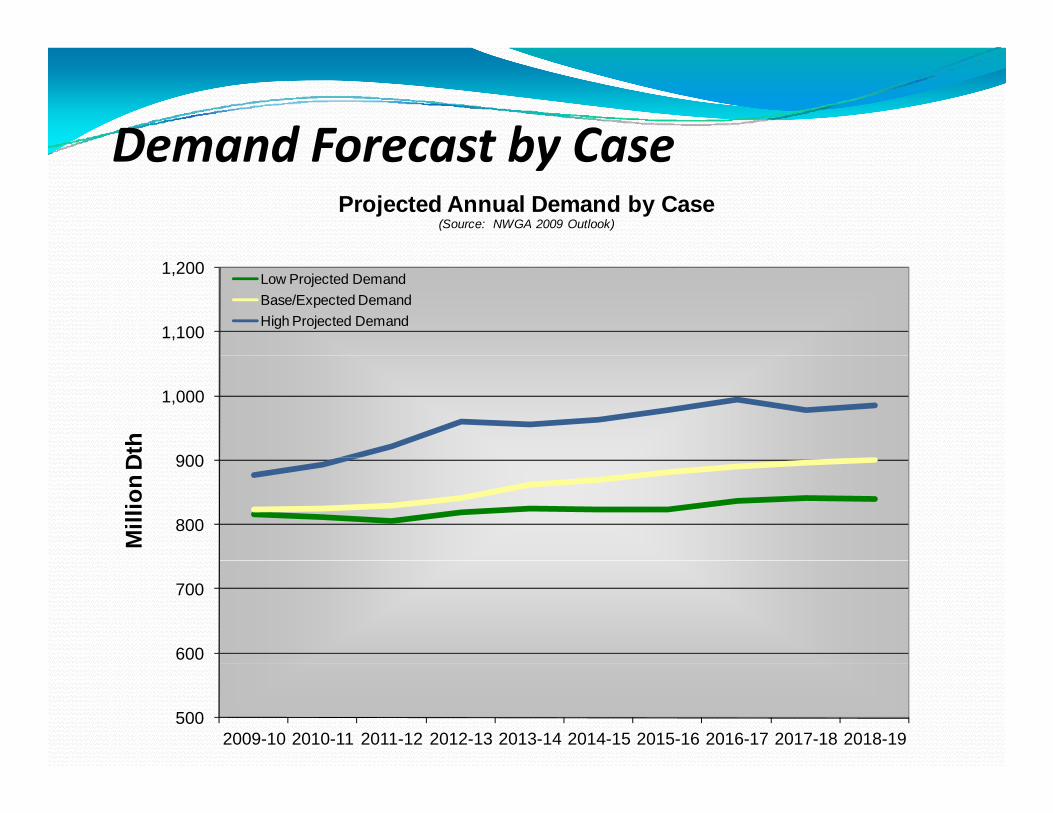
Demand Forecast by CaseDemand Forecast by CaseProjected Annual Demand by Case
(Source: NWGA 2009 Outlook)
1,100
1,200Low Projected DemandBase/Expected DemandHigh Projected Demand
900
1,000
Dth
800
900
Mill
ion
D
600
700
5002009-10 2010-11 2011-12 2012-13 2013-14 2014-15 2015-16 2016-17 2017-18 2018-19
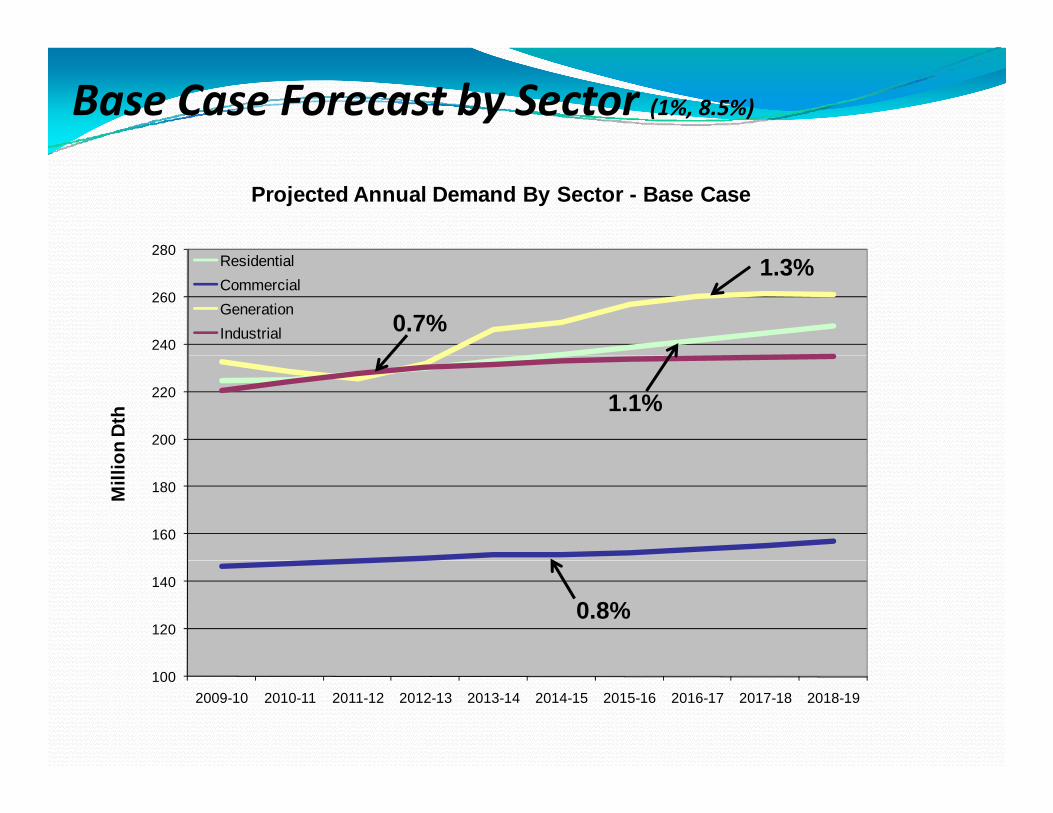
Base Case Forecast by Sector (1%, 8.5%)
280
Projected Annual Demand By Sector - Base Case
240
260
280ResidentialCommercialGenerationIndustrial
1.3%
0.7%
200
220
on D
th 1.1%
160
180Mill
io
120
140
0.8%
1002009-10 2010-11 2011-12 2012-13 2013-14 2014-15 2015-16 2016-17 2017-18 2018-19
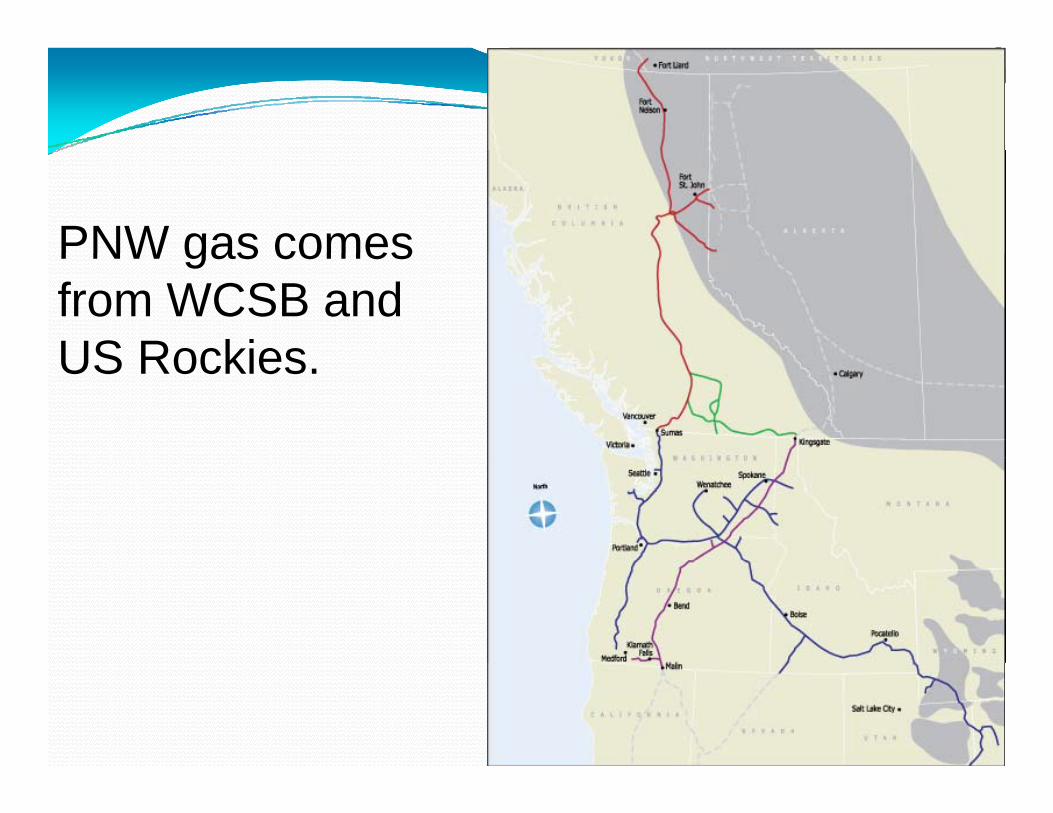
PNW gas comesPNW gas comes from WCSB and US RockiesUS Rockies.
19
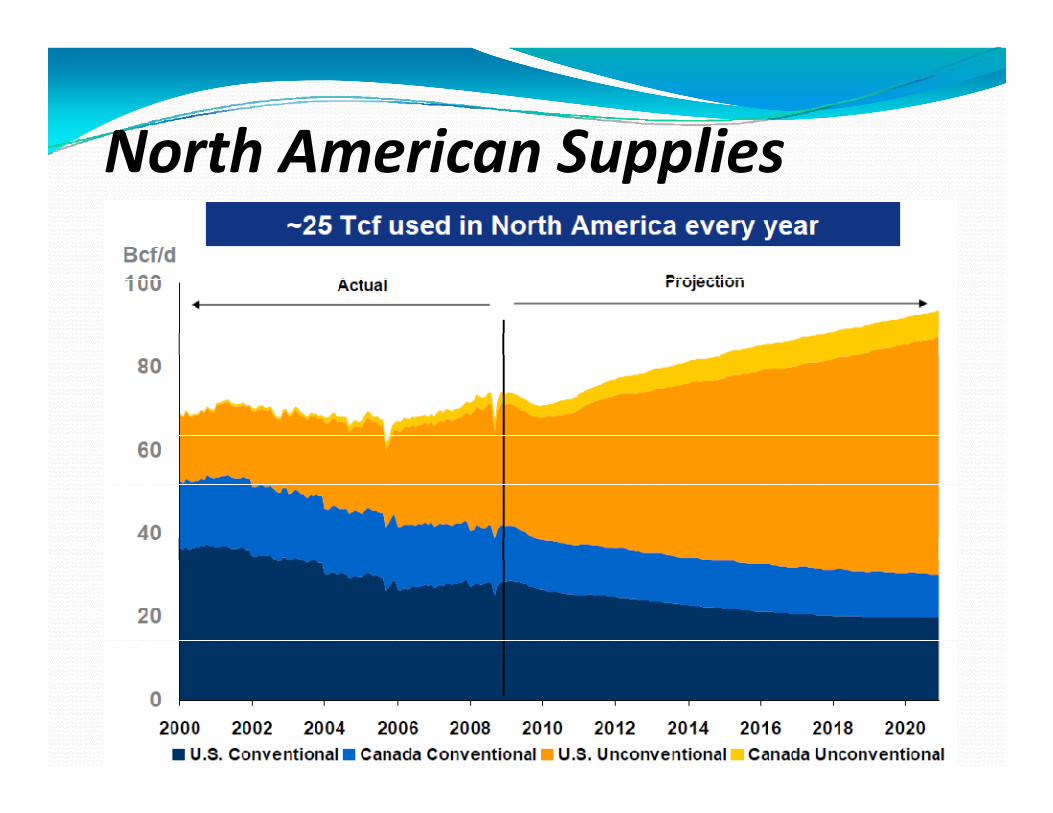
North American SuppliesNorth American Supplies
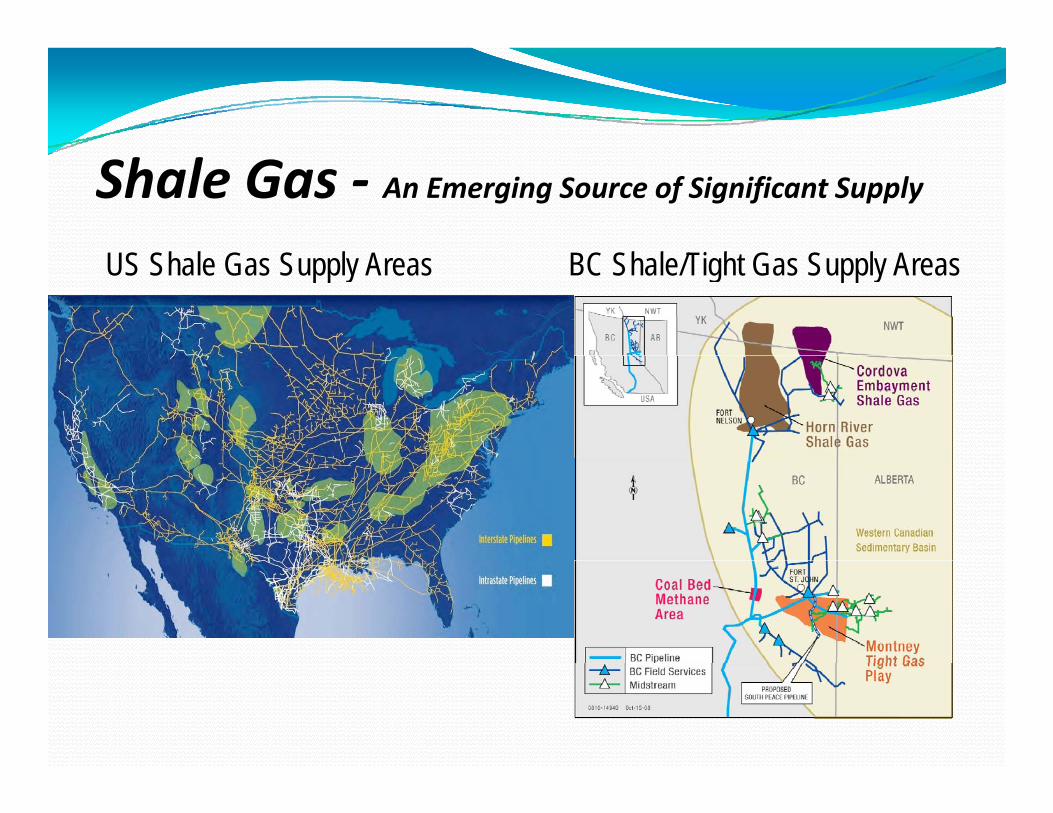
US Sh l G S l A BC Sh l /Ti h G S l A
Shale Gas - An Emerging Source of Significant Supply
US Shale Gas Supply Areas BC Shale/Tight Gas Supply Areas
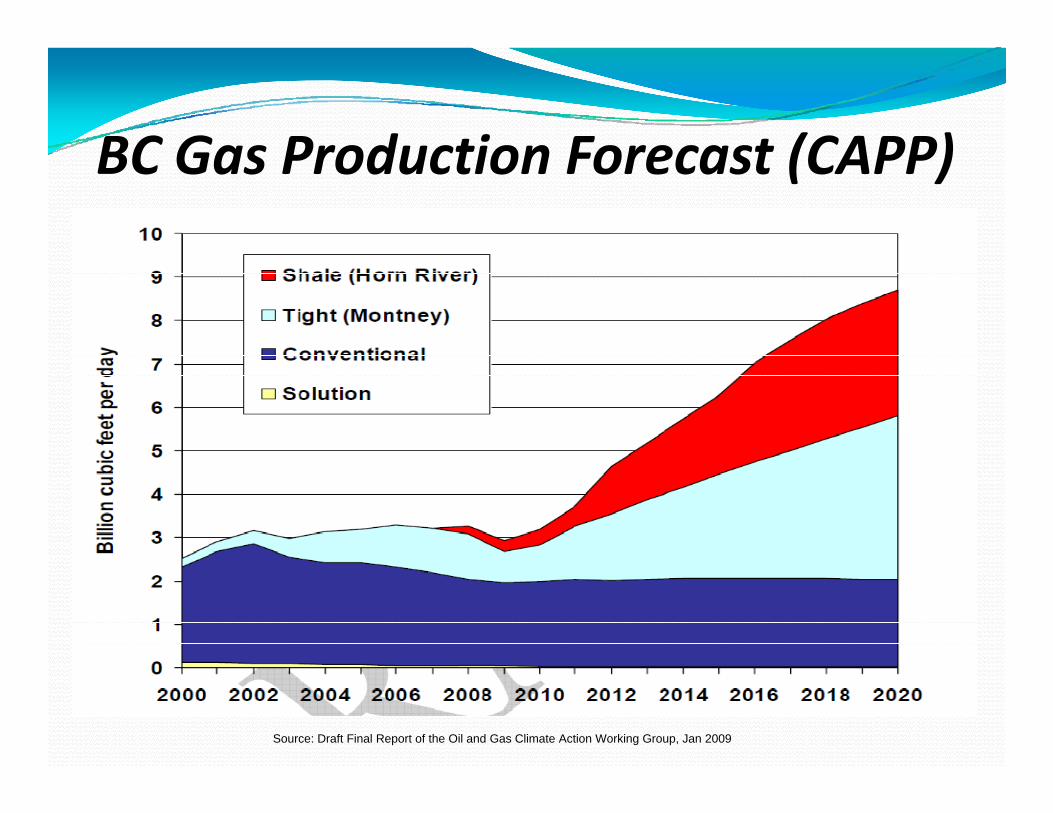
BC Gas Production Forecast (CAPP)BC Gas Production Forecast (CAPP)
Source: Draft Final Report of the Oil and Gas Climate Action Working Group, Jan 2009
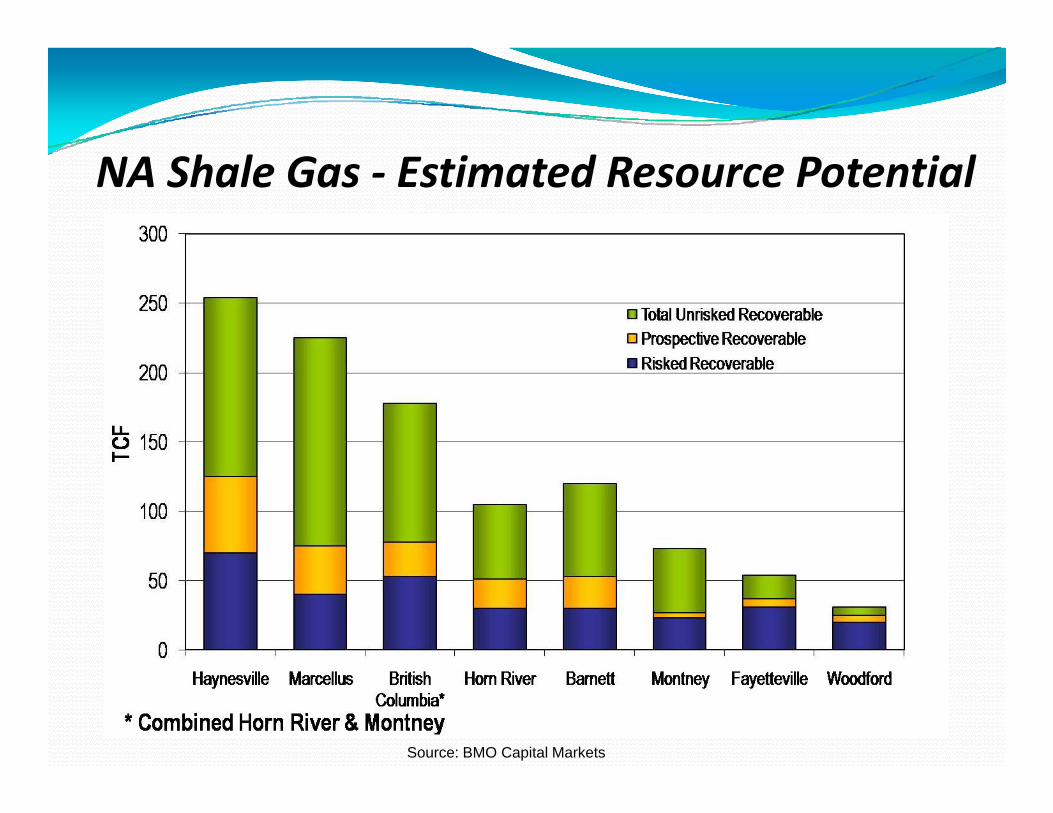
NA Shale Gas - Estimated Resource Potential
Source: BMO Capital Markets
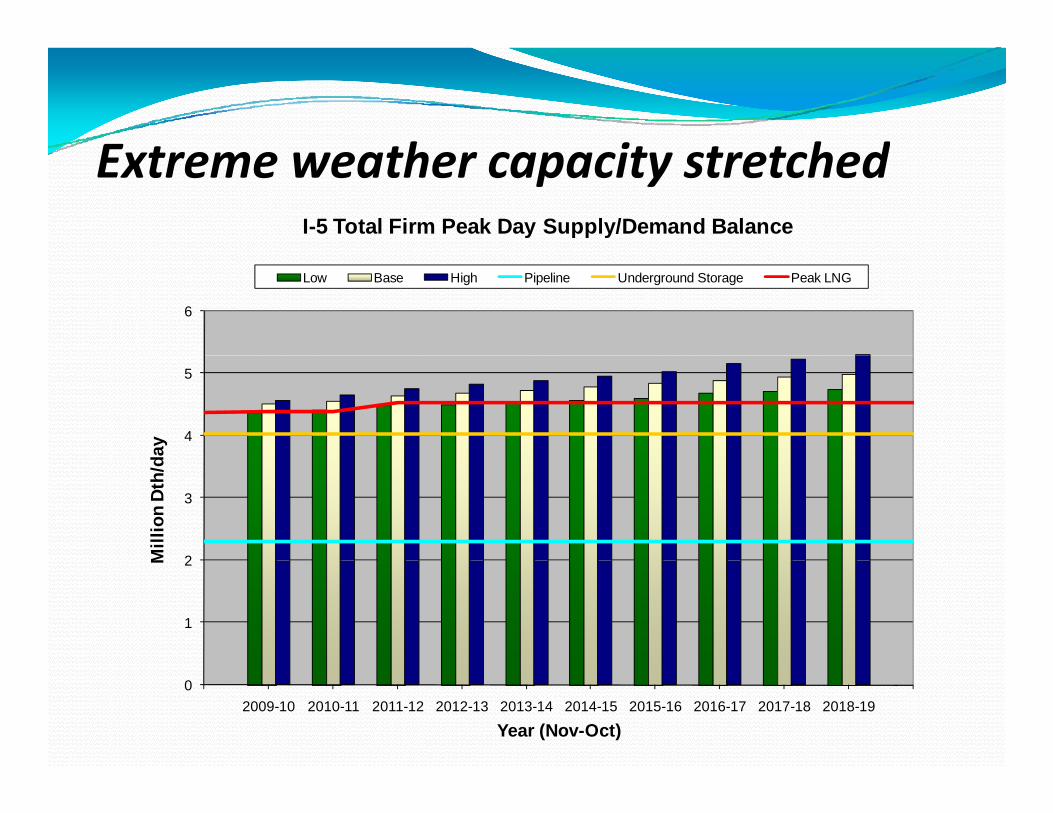
E t th it t t h dExtreme weather capacity stretchedI-5 Total Firm Peak Day Supply/Demand Balance
6
Low Base High Pipeline Underground Storage Peak LNG
4
5
day
2
3
Mill
ion
Dth
/d
1
2M
02009-10 2010-11 2011-12 2012-13 2013-14 2014-15 2015-16 2016-17 2017-18 2018-19
Year (Nov-Oct)
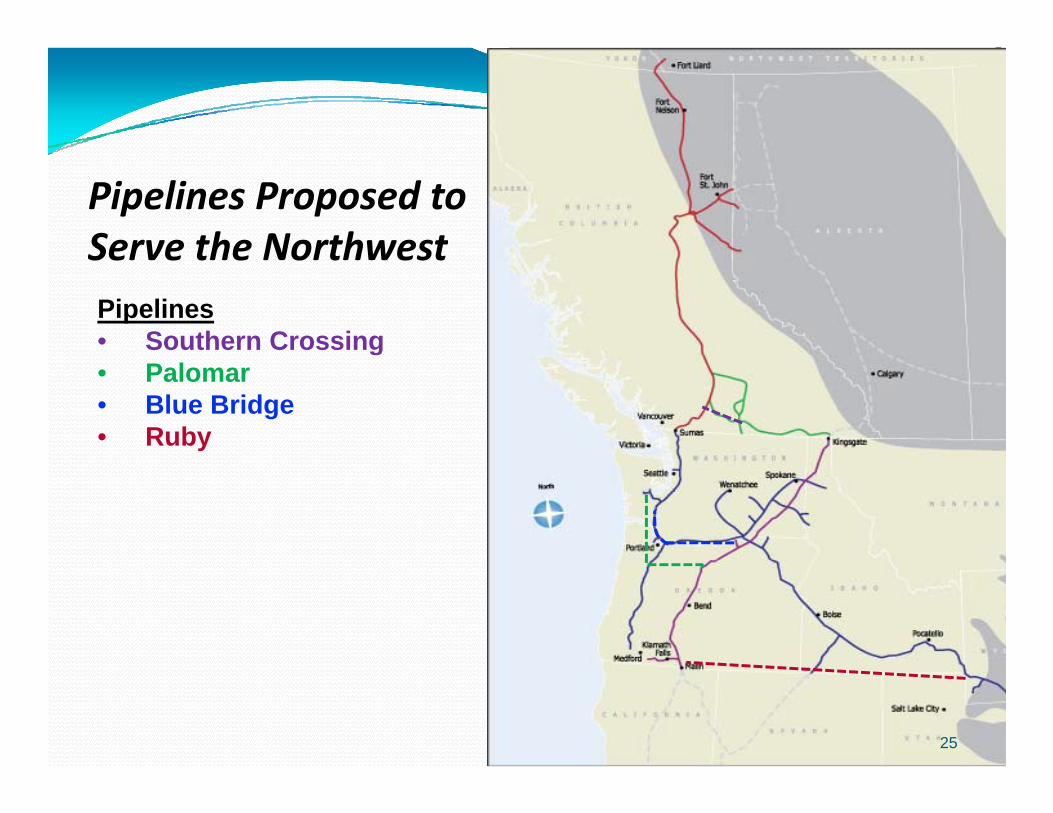
Pipelines Proposed to Serve the NorthwestServe the NorthwestPipelines• Southern Crossing• Palomar• Blue Bridge• Ruby
25
Obser ationsObservations ACES
Demand growing Climate Change: NG will facilitate
generation direct use
Supplies promising improved technologies infrastructure/access required
Challenges Adequate Infrastructureq Uncertain/Conflicting Public Policies
Demand, Supply, Infrastructure Commodity Prices Commodity Prices
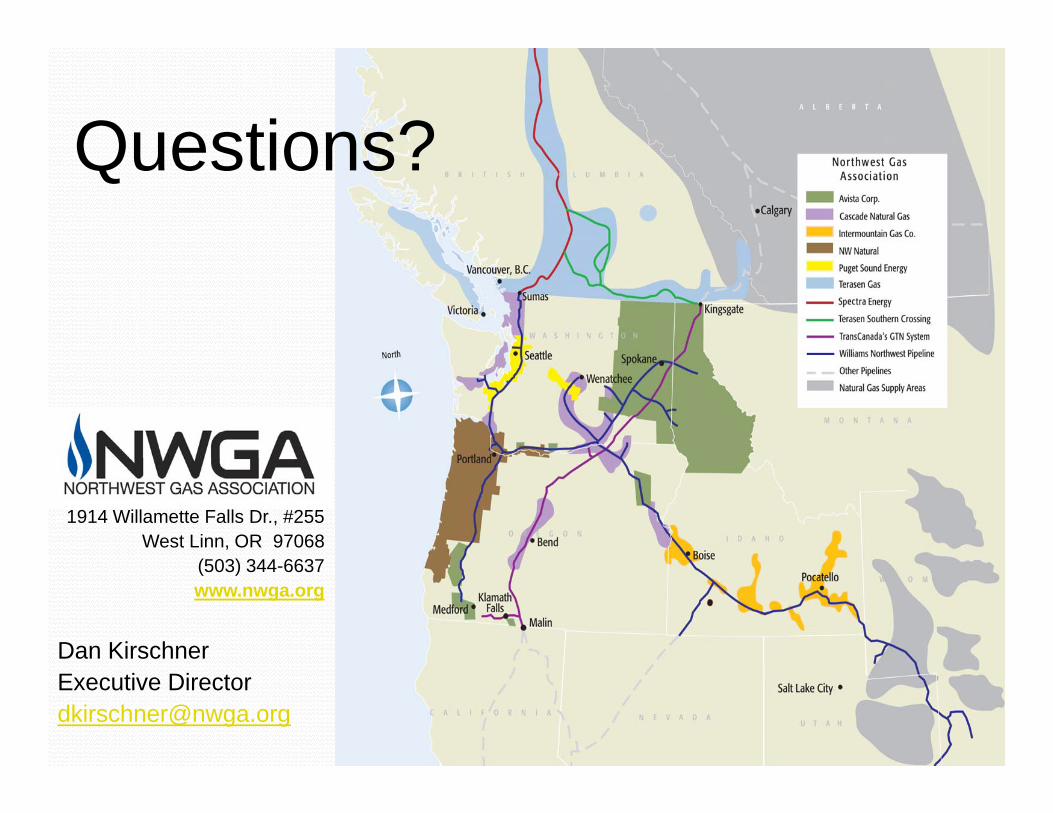
Questions?Questions?
1914 Willamette Falls Dr., #255West Linn, OR 97068
(503) 344 6637(503) 344-6637www.nwga.org
Dan KirschnerExecutive [email protected]