2020 Integrated Resource Plan
116
POWERING A GREEN NOVA SCOTIA, TOGETHER. 2020 Integrated Resource Plan November 27, 2020
Transcript of 2020 Integrated Resource Plan

POWERING A GREEN NOVA SCOTIA, TOGETHER.
2020 Integrated Resource Plan
November 27, 2020

Table of Contents
1 IRP SUMMARY 5
1.1 Introduction 5
1.2 Nova Scotia Power’s System Transformation 5
1.3 Evolving Planning Landscape 8
1.4 Planning Objectives 10
1.5 The IRP Planning Process 10
1.6 Exploring a Diverse Set of Scenarios 12
1.7 Developing Optimal Resource Plans 15
1.8 Overview of Key Findings 17
1.9 Overview of Action Plan and Roadmap 25
2 IRP INTRODUCTION AND PROCESS 30
2.1 Nova Scotia Power’s Mission 30
2.2 Objectives of the IRP 30
2.3 Process for the IRP 32
2.4 Advancements in the IRP Approach 34
2.5 Role of the IRP Working Group 36
2.6 Stakeholder Consultation and Public Process 37
3 MEETING FUTURE OBJECTIVES 38
3.1 Ensuring Reliability 38
3.2 Maintaining Affordability 46
3.3 Supplying Clean Energy 46
4 LOADS AND RESOURCES 54
4.1 Load Forecast 54
4.2 Existing Resources 60
4.3 Future Supply Options 65
4.4 Future Demand Options 72
4.5 Regional Integration 73
4.6 Resource Strategies 77
5 SCENARIOS, METHODOLOGY, AND EVALUATION FRAMEWORK 78
5.1 Key Scenarios 78
5.2 Sensitivity Analysis 79
5.3 Methodology 82
5.4 Evaluation of Resource Portfolios 85
6 MODELING RESULTS 86
6.1 Resource Additions and Retirements 87
6.2 Energy Mix 90
6.3 Greenhouse Gas Emissions 92
6.4 Resource Plan Cost 94
6.5 Relative Rate Impacts 95
6.6 Reliability 97
6.7 Operability 98
6.8 Sensitivity Analysis 99
7 KEY FINDINGS, ACTION PLAN, AND ROADMAP 104
7.1 Key Findings 104
7.2 Action Plan 112
7.3 Roadmap 114

APPENDICES
Appendix A: Energy + Environmental Economics (E3),
Deep Decarbonization in Nova Scotia: Phase 1 Report
Appendix B: IRP Assumptions
Appendix C: IRP Scenarios & Modeling Plan
Appendix D: IRP Relative Rate Effect Model
Appendix E: IRP Modeling Results
Appendix F: Modeling Results Tables
Appendix G: List of Participants
Appendix H: Assumptions and Analysis Plan engagement
Appendix I: Interim Modeling engagement
Appendix J: Modeling Results engagement
Appendix K: Findings, Action Plan and Roadmap engagement
Appendix L: Draft IRP Report engagement
Appendix M: Summary of Stakeholder Comments specific to
Findings Action Plan and Roadmap
Appendix N: IRP Response to Previous Directives

Nova Scotia Power 2020 IRP 5
1.1 Introduction
In the 2020 Integrated Resource Plan (IRP), Nova Scotia Power puts forward a long-term strategy
for delivering safe, reliable, affordable and clean electricity to customers across Nova Scotia. At its
core, the plan illustrates Nova Scotia Power’s commitment to supporting provincial decarbonization
as outlined in the Nova Scotia Sustainable Development Goals Act (SDGA), both by transitioning to
a cleaner electricity grid and by enabling electrification of other sectors, such as transportation
and heating. Given the unprecedented nature of these initiatives, as well as the increasingly
dynamic and complex resource planning environment, Nova Scotia Power incorporated extensive
stakeholder engagement into the process, including input from nine public workshops, six rounds
of formal submissions from stakeholders, independent expert analyses, and ongoing consultation
with participants. This engagement generated critical insights at each stage of the IRP process.
Supported by this collaborative effort, Nova Scotia Power produced a set of resource plans to explore
a broad range of potential futures and provide insights on trade-offs between these approaches.
As detailed in the Action Plan, Nova Scotia Power has identified common themes and no-regrets
actions that can be employed in the near term to benefit customers and the Province. These actions
will rely on the continued support and involvement of the participants in this IRP process as Nova
Scotia Power works together to implement this electricity strategy and transition to a deeply
decarbonized electricity system. The title of the 2020 IRP Report appropriately outlines and captures
this theme – Powering a Green Nova Scotia, Together.
1.2 Nova Scotia Power’s System Transformation
This IRP represents a blueprint for a significant transformation in the way Nova Scotia Power
generates and purchases electricity to serve its customers across the province. The scenarios
considered in this report dramatically accelerate reductions in greenhouse gas emissions to
align with customers’ expectations and with the global scientific consensus that achieving deep
decarbonization economy-wide is critical to mitigating the impacts of climate change.
IRP SUMMARY1
Nova Scotia Power 2020 IRP6
This IRP also reflects Nova Scotia Power’s long history of
embracing technological innovation to meet customer needs
reliably while providing customer rate stability. The Nova
Scotia Power system today includes a diverse set of generation
assets. It reflects the transformation that Nova Scotia Power
has been making, together with customers and the Province, to
respond to the needs of the province, including its economic and environmental goals. Nova Scotia
Power operates hydro facilities, some commissioned almost 100 years ago, which have provided
clean, renewable electricity since that time. The development of these assets culminated in the
commissioning of the Wreck Cove facility in 1978. This facility is the largest hydroelectric resource
in Nova Scotia, providing 200 MW of capacity as well as significant volumes of clean energy and
ancillary grid services. Originally designed as a peaking power plant to serve the morning and
evening peak energy demand periods, this flexible plant is now vital to the integration of variable
renewable generation.
For decades, Nova Scotia Power has relied on coal-fired power plants to provide firm dispatchable
generation that delivered a reliable electricity supply as electrical demand grew. Throughout the
twentieth century, this coal was largely mined within the province, supporting the domestic economy.
The current coal fleet was largely built in the 1970s-1980s. The addition of coal-fired power plants
also helped transition Nova Scotia Power’s generation mix away from imported oil, which by the
1970s had become prohibitively expensive and volatile in pricing. Nova Scotia Power’s dedicated
team of employees has operated and maintained these facilities so that they continue to perform
reliably today, and the utility has added environmental controls to reduce their environmental
impacts, including investments in mercury abatement, low-nitrogen oxide (NOx) control technologies,
and advanced coal blending practices. As one significant example, Point Aconi Generating Station
was constructed with a circulating fluidized bed (CFB) boiler, which significantly reduces sulphur
dioxide emissions and, at the time of the plant’s commissioning, was the largest boiler of this type.
Following the global acknowledgement of the risks of climate change and the need to achieve deep
decarbonization, Nova Scotia Power has re-examined how it provides electricity to customers,
shifting investments toward lower carbon sources of generation and capacity, while ensuring
reliability and rate stability. This is not new thinking for the utility. When natural gas first became
available in Nova Scotia in 1999, Nova Scotia Power converted the three units at the Tufts Cove
This IRP reflects Nova Scotia
Power’s long history of embracing
technological innovation to meet
customer needs reliably while
providing customer rate stability

Nova Scotia Power 2020 IRP 7
Generating Station to utilize this newly available fuel rather than more expensive and carbon-
intensive heavy fuel oil. Nova Scotia Power also constructed an efficient combined-cycle generating
facility at the Tufts Cove site, which reduced emissions relative to coal or oil. As wind generation
technology has developed, Nova Scotia Power has also added this resource to its portfolio.
Nova Scotia Power added its first wind turbine at Wreck Cove in 1981, which was one of the first
commercially operating wind turbines in Canada. Nova Scotia is now a wind energy leader with
approximately 600 MW of wind generation installed across the province, supplying 18 percent
of annual energy demand. These wind resources have contributed to meaningful reductions in
greenhouse gas emissions.
Nova Scotia is directly connected to the rest of the North America electricity system via an
interconnection with New Brunswick through one 345 kV tie and two 138 kV tie lines. In addition,
the recent completion of the Maritime Link, a 500 MW high-voltage direct current subsea cable and
230 kV high-voltage alternating current transmission line between the provinces of Nova Scotia and
Newfoundland and Labrador, now enables access to zero-carbon electricity and dispatchable firm
capacity while supporting longer term rate stability, marking another transformation of the
Nova Scotia system with the first HVDC converter station and interconnection with a second
neighbouring province.
The innovative spirit that is driving Nova Scotia Power’s efforts
to decarbonize its generation mix will also enable the utility to
meet greater heating and transportation energy demand driven
by electrification. The SDGA is designed to attain sustainable
provincial prosperity through decarbonization of at least 53
percent (relative to 2005) by 2030 and attainment of “net-zero”
carbon emissions by 2050. The analysis in this IRP shows that economy-wide deep decarbonization,
in line with the SDGA, can be supported by Nova Scotia Power through investment in a diverse, low-
carbon resource portfolio. This transformation will also require the utility to optimize the utilization
of its existing assets to manage costs and ensure reliability. Nova Scotia Power has shown repeatedly
over time that it is able to harness the energy of the company and the province to transform its
generation mix, and the utility is ready to do it again. The results of this IRP will guide Nova Scotia
Power in completing this important work.
The IRP shows that economy-
wide deep decarbonization, in line
with the SDGA, can be supported
by Nova Scotia Power through
investment in a diverse, low-
carbon resource portfolio

Nova Scotia Power 2020 IRP8
1 Sustainable Development Goals Act, 2019, c. 26 – not proclaimed in force. (The SDGA will be proclaimed in force by order of the Governor in
Council following public consultations and the making of regulations establishing goals to achieve sustainable prosperity consistent with the
principles and focus areas set out in the act. (ss. 14 and 16).
2 Appendix A, Energy + Environmental Economics (E3), Deep Decarbonization in Nova Scotia: Phase 1 Report, February 2020.
1.3 Evolving Planning Landscape
Electric utilities today must navigate a rapidly changing
and uncertain resource planning environment, driven by
decarbonization goals, regulatory and policy developments,
new technologies with uncertain future price trajectories,
and changing customer expectations. Nova Scotia Power has
considered these factors across a wide range of planning
assumptions and scenarios to ensure that this IRP considers the
many ways that the future could unfold.
• Decarbonization: The need for deep greenhouse gas emission reductions is recognized across
the globe. On October 30, 2019 the Lieutenant Governor of the Province of Nova Scotia granted
Royal Assent for the SDGA1, which established provincial greenhouse gas emission reduction
goals of at least 10 percent below 1990 levels by 2020; at least 53 percent below 2005 levels
by 2030; and “net-zero” by 2050 by balancing greenhouse gas emissions with greenhouse gas
removals and other offsetting measures. Similar decarbonization targets are being discussed
at the Federal level. Nova Scotia Power has already reduced its own greenhouse gas emissions
meaningfully below 2005 levels, achieving a 38 percent reduction by 2019. Nova Scotia Power
will continue this trend through its commitments to coal unit retirements and increasingly
stringent decarbonization targets. In this IRP, Nova Scotia
Power has evaluated resource plans that integrate more
renewable energy and achieve deep decarbonization
targets by mid-century, and in some cases much earlier.
The scenario plans under evaluation in this IRP achieve
between 87 and 95 percent reductions in greenhouse gas
emissions from the Nova Scotia Power electricity system
by 2045.
• Electrification: Deep Decarbonization in Nova Scotia:
Phase 1 Report2 (Deep Decarbonization Pathways),
consistent with similar studies across North America,
shows that electrification of vehicles and buildings is
key to achieving economy-wide decarbonization. As
the greenhouse gas content of electricity continues to
decrease, the greenhouse gas savings from electrifying end uses such as transportation and
heating increase. Thus, Nova Scotia Power is proactively planning the system so that it can
accommodate electrified loads as they materialize.
The resource planning environment
is uncertain, driven by
decarbonization goals, regulatory
and policy developments, new
technologies with uncertain future
price trajectories, and changing
customer expectations
The SDGA established provincial
greenhouse gas emission reduction
goals of at least 10 percent below
1990 levels by 2020; at least 53
percent below 2005 levels by
2030; and “net zero” by 2050
Electrification of vehicles and
buildings is key to achieving
economy-wide decarbonization

Nova Scotia Power 2020 IRP 9
3 Firm capacity refers to owned or contracted generation capacity that can turn on and dispatch up to maximum output on command, barring
any forced outages.
• Technology: The cost and characteristics of
generation technologies are changing rapidly. The
array of new and evolving technologies available
to Nova Scotia Power – including wind turbines,
efficient natural gas plants, battery or other energy
storage, solar panels, potential new low emitting fuels
and others – has advanced significantly in the last
decade, and continued cost declines are expected.
Moreover, new transmission projects can provide access
to low- or zero-carbon energy and firm capacity3 from
other regions and help integrate Nova Scotian renewable energy. This changing landscape
makes deep decarbonization more achievable than at any time before. Nova Scotia Power has
evaluated a wide range of technologies that can contribute to Nova Scotia’s needs, and Nova
Scotia Power remains committed to evaluating new resource options as they become available.
While specific resource selection in the IRP is indicative of the preferential resource category,
detailed study will be required to confirm and optimize specific unit retirements and resource
additions. The IRP Action Plan recommends appropriate steps to continue this work.
• Customer Choice: Customers are increasingly investing in onsite energy solutions that
can help manage energy usage, including energy efficiency and distributed generation
technologies. In this IRP, Nova Scotia Power has forecast continued adoption of customer-
sited solutions and has considered a range of resource
strategies that expand energy efficiency and/or
distributed generation. These technologies have the
potential to provide benefits to the electricity system but
can also have impacts that must be carefully understood
and incorporated into system planning to ensure that
value is received by all customers.
Technologies including wind
turbines, efficient natural gas
plants, battery or other energy
storage, solar panels, potential
new low emitting fuels, and others
have advanced significantly in the
last decade, and continued cost
declines are expected
New transmission projects can
provide access to low- or zero-
carbon energy and firm capacity
from other regions and help
integrate Nova Scotian
renewable energy

Nova Scotia Power 2020 IRP10
1.4 Planning Objectives
Through the IRP process, Nova Scotia Power undertakes long-term system planning to understand
how the electricity system will continue to meet the needs of customers and respond to changes
in the electricity planning landscape. This process informs ongoing investment, retirement, and
operating decisions that are in the best interests of customers over a 25-year planning horizon. Nova
Scotia Power plans the system to be safe, reliable, affordable, clean, and robust under many potential
future outcomes. In the near-term, Nova Scotia Power plans to undertake “no-regrets” actions that
further these planning objectives and that are shown to be robust, or common, under many potential
futures. Figure 1 further describes these objectives.
Figure 1. System Planning Objectives
SAFE • Provide safe electric service throughout the province
• Promote an injury-free workplace where everybody goes home safe every day
RELIABLE • Meet reliability requirements for supply adequacy
• Procure essential grid services for system stability and reliability
AFFORDABLE • Minimize the present value of the long term costs of the power system
• Manage the magnitude and timing of electricity rate impacts
CLEAN • Reduce greenhouse gas and other emissions
• Support economy-wide decarbonization through long-term planning
ROBUST • Develop a plan that can withstand realistic potential changes to key assumptions
• Build in flexibility so that future decisions aren’t overly constrained
1.5 The IRP Planning Process
Nova Scotia Power’s 2020 IRP reflects a detailed effort over more than a year to create an electricity
strategy for the future. In consultation with stakeholders, Nova Scotia Power has produced several
interim documents: Pre-IRP Deliverables, IRP Terms of Reference, Assumptions and Analysis Plan,
Scenarios and Modeling Plan, Initial Modeling Results, Final Modeling Results, and the Draft Findings,
Action Plan and Roadmap. Throughout the process, Nova Scotia Power has incorporated input from
a large group of stakeholders to utilize the best available information and include alternate views for

Nova Scotia Power 2020 IRP 11
how the system could evolve. This process ensures the IRP is transparent, inclusive of stakeholder
comments, and effective at meeting Nova Scotia Power’s long-term planning objectives.
To build on the findings of the IRP, Nova Scotia Power has developed an Action Plan and Roadmap
to advance next steps. The Action Plan serves as a near-term guide for changes to the system
and informs the planning initiatives that Nova Scotia Power will undertake. The Roadmap details a
strategy for monitoring signposts that confirm or indicate a need to alter the near-term strategy.
The publication of the IRP report does not mark the end of planning efforts. As highlighted in the
Action Plan, Nova Scotia Power will continue to perform planning analyses on a regular basis to
ensure that it continues to identify resource options and strategies that are beneficial to customers.
As is the case for utilities across North America, the IRP serves as a directional roadmap to guide
future decision making but does not prescriptively predetermine actions over the coming years and
decades. The IRP identifies several resource plans that could meet long-term goals and requirements,
which vary in the type, quantity, and timing of resource changes. As Nova Scotia Power continues
to study resource options and obtain new information, including costs for specific project options, it
will use these resource plans as a guide but will adapt as necessary to best serve customers. The IRP
Findings, Action Plan and Road Map are based on common insights across the scenarios studied, to
ensure a “no-regrets” approach is taken in the follow-up next steps.
Figure 2. shows the key milestones within the pre-IRP study process and the core IRP process that
have been undertaken in consultation with stakeholders to lead up to the delivery of this Final
Report.
Figure 2. Pre-IRP Study Process and the Core IRP Process
√ Completed - Pre-IRP
√ Completed
UARB NSP PRE-IRPDELIVERABLES√
Capacity Study√ Supply Options
Study√Demand Response
Assumptions√Stability Study√
Terms of Reference√Scenario Development√
Modeling Plan√Assumptions√
Modeling√Analysis/Conclusions
Report, Roadmap, Action Plan
CORE IRP PROCESSResulting in Final Report√ NOV
2020
√√

Nova Scotia Power 2020 IRP12
1.6 Exploring a Diverse Set of Scenarios
Nova Scotia Power undertook an initial scenario development
exercise with stakeholders to solicit input on an appropriate
range of scenarios to be considered through the IRP exercise.
From there, using this stakeholder input, Nova Scotia Power
constructed a diverse set of scenarios to explore policy options,
resource strategies, and potential future worlds. By exploring a
range of approaches under different conditions and circumstances, Nova Scotia Power has assessed
the trade-offs in following different pathways to attain its long-term objectives. In addition, with a
scenarios-based approach, Nova Scotia Power has ensured that its planning strategy is robust under
a range of possible future conditions.
Figure 3 depicts Environmental Policy Scenarios (Greenhouse Gas Scenarios and Coal Retirement
Scenarios) that were identified for evaluation through the IRP exercise. The Environmental Policy
Scenarios utilize one of three trajectories for greenhouse gas emissions, which govern the maximum
amount of greenhouse gas emissions from generated or imported energy during a given year.
The trajectories for GHG emissions include one based on the equivalency agreement between the
Province of Nova Scotia and the Government of Canada,4 one that is consistent with a path to
reaching provincial net-zero carbon emissions by 2050, and one that reaches provincial absolute
zero electricity sector carbon emissions by 2050. These last two trajectories broadly align with the
targets set in the SDGA, which does not set an electricity sector-specific target. Scenarios following
the accelerated net-zero by 2045 trajectory retire all coal power plants no later than 2030, while the
other scenarios retire all coal plants by 2040. Coal units can be retired earlier if determined to be
economic by the optimization model.
Figure 3. Greenhouse Gas Emissions Trajectories and Coal Retirements
Mil
lio
n T
on
ne
s
Cap & Trade + Equivalency
GHG Provincial Regulations
Coal Generation Retired by 2040
Accelerated Net Zero 2045 (2050 -> 0 Mt)
Comparator
Net-Zero 2050 (2050 -> 0.5 Mt)
7
6
5
4
3
2
1
0
2050204520402021 2025 2030 2035
Coal Generation Retired by 2030
4 The Province of Nova Scotia has an agreement-in-principle with the Government of Canada to develop a new equivalency agreement providing
Nova Scotia with the ability to continue to achieve meaningful GHG reductions through moving directly from fossil fuel generation to clean
energy sources while enabling Nova Scotia’s coal-fired plants to operate at some capacity from 2030 to 2040.
Scenarios following the accelerated
net-zero by 2045 trajectory retire
all coal power plants no later than
2030, while the other scenarios
retire all coal plants by 2040

Nova Scotia Power 2020 IRP 13
The load trajectories developed for the IRP, shown in Figure 4,
reflect three possible levels of electrification and varying levels
of energy efficiency in the province. Depending on the pace
of adoption for end use electrification, there could be a wide
range of impacts on system load over the coming decades. The
electrification trajectories impact the amount of energy that
must be supplied both throughout the year and during periods
of peak energy demand. The High Electrification level envisions near-complete electrification of
heating demands by 2050 and 100 percent sales of electric vehicles for light duty vehicles by 2040.
The Mid Electrification level envisions half of this deployment level. The Low Electrification Level
envisions continuation of the current pace of growth in building and transportation electrification.
These electrification assumptions are coupled with assumptions regarding energy efficiency
deployment developed by EfficiencyOne (E1) for modeling. These assumptions were informed by
a detailed analysis of deep decarbonization in Nova Scotia (Deep Decarbonization Pathways),
completed as an input to the IRP process and provided as Appendix A.
Figure 4. Firm Peak Load and Annual Energy Forecasts
MW
GW
h
3300
3100
2900
2700
2500
2300
2100
1900
2050204520402021 2025 2030 2035
13500
13000
12500
12000
11500
11000
10500
10000
2050204520402021 2025 2030 2035
Low Elec / Base DSM Mid Elec / Base DSM High Elec / Max DSM
The High-Electrification level
envisions near-complete
electrification of heating demands
by 2050 and 100 percent sales
of electric vehicles for light duty
vehicles by 2040
Nova Scotia Power 2020 IRP14
Nova Scotia Power also tested three alternative resource strategies for the planning of its system:
Current Landscape, Distributed Resources, and Regional Integration. These strategies represent
different approaches to planning the system. The Distributed Resources strategy contemplates a high
uptake of small-scale resources (e.g. rooftop solar), while the Regional Integration strategy allows
for new interconnections to other regions and corresponding access to out-of-province resources
for firm energy and capacity, in addition to in-province resources. The Current Landscape strategy
reflects a smaller deployment of distributed resources and does not allow for new transmission
solutions to access new markets.
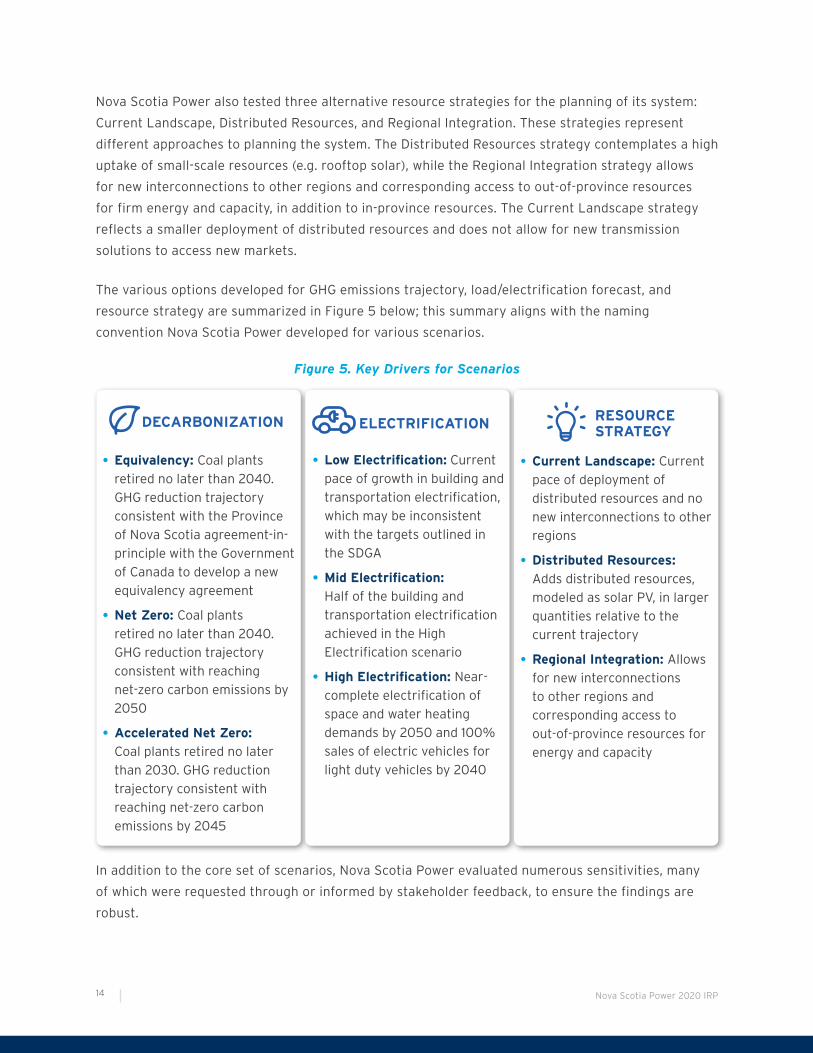
The various options developed for GHG emissions trajectory, load/electrification forecast, and
resource strategy are summarized in Figure 5 below; this summary aligns with the naming
convention Nova Scotia Power developed for various scenarios.
Figure 5. Key Drivers for Scenarios
DECARBONIZATION
• Equivalency: Coal plants
retired no later than 2040.
GHG reduction trajectory
consistent with the Province
of Nova Scotia agreement-in-
principle with the Government
of Canada to develop a new
equivalency agreement
• Net Zero: Coal plants
retired no later than 2040.
GHG reduction trajectory
consistent with reaching
net-zero carbon emissions by
2050
• Accelerated Net Zero:
Coal plants retired no later
than 2030. GHG reduction
trajectory consistent with
reaching net-zero carbon
emissions by 2045
• Low Electrification: Current
pace of growth in building and
transportation electrification,
which may be inconsistent
with the targets outlined in
the SDGA
• Mid Electrification:
Half of the building and
transportation electrification
achieved in the High
Electrification scenario
• High Electrification: Near-
complete electrification of
space and water heating
demands by 2050 and 100%
sales of electric vehicles for
light duty vehicles by 2040
• Current Landscape: Current
pace of deployment of
distributed resources and no
new interconnections to other
regions
• Distributed Resources:
Adds distributed resources,
modeled as solar PV, in larger
quantities relative to the
current trajectory
• Regional Integration: Allows
for new interconnections
to other regions and
corresponding access to
out-of-province resources for
energy and capacity
ELECTRIFICATION RESOURCE STRATEGY
In addition to the core set of scenarios, Nova Scotia Power evaluated numerous sensitivities, many
of which were requested through or informed by stakeholder feedback, to ensure the findings are
robust.

Nova Scotia Power 2020 IRP 15
1.7 Developing Optimal Resource Plans
Nova Scotia Power assessed each scenario by optimizing its resource portfolio and operations
using a suite of analytical planning models. Through consultation with stakeholders, and input from
the Energy and Environmental Economics (E3) Supply Options Study, prepared as part of the Pre-
IRP deliverables and through the Assumptions stage of the IRP, Nova Scotia Power worked with
stakeholders to characterize the capabilities and costs of various technologies that can contribute
to the long-term objectives. Detailed inputs include capital costs, operating costs, operating
characteristics, and contributions to system reliability. These details, along with the characteristics
of Nova Scotia Power’s existing system and the details of a particular scenario, are inputs to the
optimization models. The models then identify the lowest-cost solution – including investment,
retirement, and operating decisions – while maintaining reliability and satisfying the environmental
targets for the scenario.
The optimal resource plan for each scenario includes a different long-term mix of resource
technologies, based on the given system conditions and constraints modeled. The long-term capacity
expansion model used by Nova Scotia Power, PLEXOS LT, is able to choose among available resource
technologies that offer a range of capabilities, as seen in Figure 6. The model allows each resource
technology to be assessed on a level playing field when choosing a solution that meets reliability and
greenhouse gas reductions requirements at the lowest cost. The result is a unique resource portfolio
for each scenario.
Figure 6. Resource Options
Resource Technology Low-Carbon Energy On-Demand Capacity & Grid Services
Wind Turbines
Solar PV Projects
Hydro Plants
Imports (Firm)
Imports (Non-Firm)
Battery Storage
Demand Response
Energy Efficiency
Distributed Generation
Thermal Plants
Provides service(s) Provides service(s) on a limited basis Mostly not applicable

Nova Scotia Power 2020 IRP16
Nova Scotia Power considered a wide range of technologies, including renewable resources,
imports via new transmission lines, battery storage, compressed air energy storage, customer-sited
solutions such as demand response and distributed resources, and natural gas power plants. Nova
Scotia Power is planning its system to increase the share of generation from low- and zero-carbon
resources and decrease the share of generation from greenhouse gas-emitting resources.
Hydroelectric resources in Nova Scotia have the benefit of providing zero-carbon energy, ancillary
grid services,5 and on-demand capacity, helping to reduce greenhouse gas emissions and maintain
reliability. Incremental firm imports are another resource option that can provide zero-carbon energy
and ancillary grid services. Firm imports are considered firm because Nova Scotia Power can rely
on them to be available at any point during the year, barring any forced outages. Incremental firm
imports are available in the “Regional Integration” and “Distributed Resources” scenarios.
Wind and solar PV resources provide zero-carbon energy but provide only limited ancillary grid
services and do not provide on-demand capacity in the same way that hydroelectric resources,
thermal plants, and firm imports do. Nevertheless, these resources do contribute to ensuring
reliability, as demonstrated in the effective load carrying capability (ELCC) in the PRM and Capacity
Value Study completed by E3 as part of the pre-IRP deliverables. However, this same study showed
that the contribution to reliability for these resources – especially solar PV – is relatively low and
declines with increased penetration. Battery storage and demand response can provide on-demand
capacity for limited durations, while “fossil” based generators – generators that produce power by
burning fossil fuels including coal, oil or natural gas – can provide on-demand capacity for unlimited
durations, barring any forced outages.
Nova Scotia Power has significantly reduced its greenhouse gas emissions from fossil power
plants as other energy resources have become available and plans to continue that trend. Fossil
fuel-based power plants will increasingly play a “back-up” role for clean energy resources. Even in
deep decarbonization scenarios, these resources may continue to play a valuable role in providing
ancillary grid services and on-demand capacity, even if they generate very rarely. The resource plan
optimization model considers the cost of low utilization at fossil power plants and compares it to
the cost of other solutions; the model considers all potential resource combinations and ultimately
identifies a lowest-cost resource portfolio that maintains reliability and reduces greenhouse gas
emissions according to the modeled emissions levels.
5 “Ancillary Grid Services” is used in this IRP to encompass a variety of services that are essential for maintaining reliability of the power system,
including provision of operating reserves, inertia, frequency response, reactive power / voltage control, and black start capabilities.
Nova Scotia Power 2020 IRP 17
1.8 Overview of Key Findings
Nova Scotia Power evaluated a broad range of potential future scenarios that reflect key
uncertainties over the coming decades. While each scenario has a unique optimal resource plan,
Nova Scotia Power has identified common themes from across the modeling results and developed
these into the Key Findings presented here. These Key Findings are the basis of the IRP Action Plan
and Roadmap.
1. Steeply reducing carbon emissions in line with Nova Scotia’s Sustainable Development
Goals Act will require significant efforts from each sector of the economy, with the
electricity sector playing a major role. Nova Scotia Power has analyzed provincial economy-
wide decarbonization efforts in line with the targets of the SDGA. The Deep Decarbonization
Pathways report confirmed that electrification of energy end uses in other sectors is an
important tool to achieve deep decarbonization affordably. As more end uses electrify, Nova
Scotia Power will incorporate these new loads into its planning efforts to continue providing
electricity service that remains reliable and affordable. Nova Scotia Power modeled three levels
of electrification as part of this IRP in order to capture these impacts.
Electrifying heating and transportation already reduces greenhouse gas emissions today. For
example, switching to a heat pump today reduces greenhouse gas emissions by 35 percent
when compared to oil heat on today’s system. As Nova Scotia Power decarbonizes its electricity
mix with the addition of the Maritime Link energy blocks and other low- and zero-carbon
energy resources identified in this IRP, incremental greenhouse gas savings will grow. Across
the scenarios, the greenhouse gas reduction achieved by switching to a heat pump increases to
87-95 percent by 2045.
The trend for electric vehicles is similar. Today, switching to an electric vehicle can reduce
greenhouse gas emissions by approximately 60 percent when compared to driving an internal
combustion engine vehicle. Across the scenarios, the greenhouse gas reduction from switching
to an electric vehicle increases to 91-96 percent by 2045. The electric sector will serve as a key
enabler in the pursuit of economy-wide decarbonization.
Nova Scotia Power considered two primary greenhouse gas reduction trajectories.6 Under
both trajectories, Nova Scotia Power significantly reduces greenhouse gas emissions by 2045,
achieving reductions of 87-95 percent relative to 2005 emissions levels. This represents
a significant contribution to achieving the SDGA targets of a net-zero economy by 2050,
province-wide.
6 Nova Scotia Power also evaluated Comparator scenarios that follow the Equivalency trajectory for greenhouse gas reductions. However, these
scenarios are not aligned with the SDGA goals and thus are not considered to be compliant plans.

Nova Scotia Power 2020 IRP18
As part of this IRP, Nova Scotia Power has also considered the relative customer rate impact
of various scenarios over time. The directional level analysis work has shown that increased
electricity sales due to electrification can reduce upward pressure on electricity rates while
facilitating carbon reductions in other sectors; this is a consequential finding which supports
the electricity sector’s role in economic decarbonization of the provincial economy.
2. Decarbonizing Nova Scotia Power’s electricity supply will require investment in a diverse
portfolio of non- and low-emitting resources. Nova Scotia Power will implement two
strategies to transform its generation portfolio over the planning horizon. First, Nova Scotia
Power will eliminate coal generation, which is a significant source of greenhouse gas emissions,
from its generation portfolio. Nova Scotia Power has modeled the retirement of coal generation
by 2030 in some scenarios, and by no later than 2040 in any scenario. Second, Nova Scotia
Power will increase the share of low- and zero-carbon generation by increasing domestic
renewable energy production in Nova Scotia and importing low- and zero-carbon power via new
transmission. Increasing zero-carbon energy from close to 30 percent today to as much as 70
percent by 2045 is a significant undertaking and will enable critical emissions reductions. This
transition must be affordable for customers and will also require that sufficient firm capacity
resources be available to maintain reliability with the system’s transformation and growing
capacity needs. Figure 7 shows the change in greenhouse gas emissions, coal generation, and
low-carbon generation over time across scenarios.
Figure 7. Transformation of Generation Mix Across ScenariosL
ow
-Ca
rbo
n E
ne
rgy
(%
)
204
0
2035
2025
200
5
2010
2015
2020
90
40
50
60
70
80
30
20
10
0
100
2030
204
5
Co
al
Ge
ne
rati
on
(G
Wh
)
204
0
2035
2025
200
5
2010
2015
2020
9K
4K
5K
6K
7K
8K
3K
2K
1K
0
10K
2030
204
5
GH
G E
mii
sio
ns
(MM
TC
O2)
204
0
2035
2025
200
5
2010
2015
2020
2030
204
5
8
10
12
6
4
2
0
87-95% emissions
decline by 2045
All coal retired by 2030 or
2040
70-95% low-carbon energy by
2045
Scenario result Range of scenario results

Nova Scotia Power 2020 IRP 19
The IRP analysis demonstrates that wind is the lowest-cost domestic source of renewable
energy and is selected preferentially over solar in all resource plans. Additional wind capacity
of at least 500 MW by 2045 is selected by the optimization model. The timing of new wind
generation often correlates with the retirement of coal units to provide replacement emissions-
free energy; firm capacity to pair with the wind energy replacing fossil fuel-based generation
is also added. Solar resources are selected in limited quantities late in the planning horizon
(2043+) under scenarios following the Accelerated Net-Zero 2045 trajectory; solar generation
provides an emissions-free energy resource under these very low emission scenarios but is
less well suited than wind to Nova Scotia’s system needs due to lower annual capacity factors
(resulting in a higher energy cost) and a solar generation profile that is highest in the summer
months (while Nova Scotia’s load is winter peaking).
Regional Integration (i.e. investment in stronger interconnections to other jurisdictions) is an
economic component of the lowest-cost plans under each load scenario. Both the Reliability
Tie, which strengthens Nova Scotia’s connection to the North American electrical grid, and a
Regional Interconnection, which enables access to firm capacity and energy imports, are shown
to have value. This finding is robust across a wide range of assumptions and sensitivities.
Replacement of reliable, firm capacity, as can be provided via Regional Integration, is critical to
the next phase of system transformation under evaluation in this IRP.
Other key elements of the plan include Nova Scotia Power’s existing domestic hydro resources;
these are shown to provide economic benefit to customers and are economically sustained
through the planning horizon with appropriate reinvestment requirements. In addition, energy
efficiency and Demand Side Management (DSM) programs and costs in the range of the “Base”
profile, per the EfficiencyOne 2019 DSM Potential Study7 are shown to be most economic
relative to other options evaluated under the primary IRP metric; effects on other metrics are
mixed and these findings will inform future DSM program development. Scenarios analyzed
with high Distributed Resources penetrations are shown to have higher cost NPV values than
Regional Integration scenarios once a low-range estimate of DER cost is incorporated; these
scenarios are also shown to have a significantly higher relative rate impact and as a result are
not selected for incorporation into the IRP Action Plan.
7 https://nsuarb.novascotia.ca/ Matter M08929, Exhibit N-1, EfficiencyOne (E1), 2019 DSM Potential Study Report, August 14, 2019.

Nova Scotia Power 2020 IRP20
Figure 8 shows how the generation mix evolves in two low-cost key scenarios, 2.0C and
2.1C. These scenarios are representative of many of the resource plans considered. In these
scenarios, greenhouse gas emissions are on the Net-Zero 2050 trajectory, electrification is
following the Low (2.0C) or Mid (2.1C) Electrification forecast, and Nova Scotia Power has
the option of accessing firm capacity and energy through transmission expansion to other
jurisdictions. With the delivery of Nova Scotia Power’s contracted hydro blocks and energy
imports via the Maritime Link, clean imports increase and displace coal generation, resulting
in a significant decline in coal generation early in the planning horizon. The decline in coal
generation continues through 2040, by which time all coal-fired power plants are retired. Wind
generation and low carbon imports grow to replace retiring coal, making up a larger share of
the generation mix.
Figure 8. Historical and Future Generation Mix Under Scenarios 2.0C and 2.1C
Ge
ne
rati
on
(G
Wh
)
Ge
ne
rati
on
(G
Wh
)
Historical HistoricalScenario 2.0CLow Electrification, Base DSM, Net Zero 2050 (2040 Coal),
Regional Integration
Scenario 2.1CMid Electrification, Base DSM, Net Zero 2050 (2040 Coal),
Regional Integration
8K
10K
12K
6K
4K
2K
0
14K
204
0
2035
2025
202
1
2030
204
5
2010
2015
2019
8K
10K
12K
6K
4K
2K
0
14K
204
0
2035
2025
202
1
2030
204
5
2010
2015
2019
Firm Imports Non Firm Market Maritime Link Blocks Diesel CTs Solar Wind Biomass Tidal
Domestic Hydro Gas - Conversion Gas - New CTs & Recips Gas - New CCs Gas - Existing Coal

Nova Scotia Power 2020 IRP 21
3. Firm capacity resources will be a key requirement of the developing Nova Scotia Power
system in both the near and long term. Today, Nova Scotia Power’s coal plants provide firm
capacity, energy, and essential grid services to the system, all of which are components of
reliable system operation. The scenarios examined in this IRP have shown that Nova Scotia
Power can retire these units and still operate the system reliably, but new resources are needed
to provide these services. Nova Scotia Power will need additional firm generating capacity to
ensure that the system is reliable with sufficient supply available to meet expected demand,
especially during periods of low renewable generation and peak loads. The need for additional
firm generating capacity may also grow with increasing energy demand. Depending on the pace
of electrification, energy demand will increase over the next few decades as more vehicles
and heating systems plug into the grid. This will further increase the need for additional firm
generating capacity that can ensure reliability.
Figure 9 shows retirement of existing capacity and the change in energy demand for a 2040
coal phase-out schedule and both the Low (2.0C) and Mid (2.1C) Electrification trajectories.
Nova Scotia Power has been managing a small capacity deficit in the near-term, but this
shortfall will grow significantly over the next ten years. Coal plant retirements, as well as
economic retirements of other existing thermal power plants, reduce the amount of available
firm capacity.
Figure 9. Existing Effective Capacity and Capacity Needs
under Scenario 2.0C and Scenario 2.1C
Existing Non-Coal Coal Demand + PRM Target Capacity Shortfall
2000
2500
3000
1500
1000
500
0
2040203520252021 2030 2045
Fir
m C
ap
aci
ty*
(MW
)
* Includes economic retirements
Scenario 2.0CLow Electrification, Base DSM,
Net Zero 2050 (2040 Coal), Regional Integration
2000
2500
3000
1500
1000
500
0
2040203520252021 2030 2045
Fir
m C
ap
aci
ty*
(MW
)
* Includes economic retirements
Scenario 2.1CMid Electrification, Base DSM,
Net Zero 2050 (2040 Coal), Regional Integration

Nova Scotia Power 2020 IRP22
Figure 10 shows the same information, but for a scenario with a 2030 coal phase-out schedule.
Because the coal retirements are accelerated and load growth is the same, a large capacity
shortfall occurs earlier in the planning horizon.
Figure 10. Existing Effective Capacity and Capacity Needs Under Scenario 3.1C
Existing Non-Coal Coal Demand + PRM Target Capacity Shortfall
2000
2500
3000
1500
1000
500
0
2040203520252021 2030 2045
Fir
m C
ap
aci
ty (
MW
)
* Includes economic retirements
Scenario 3.1CMid Electrification, Base DSM,
Accel. Net Zero 2045 (2030 Coal), Regional Integration
There are several resource technologies that can help fill this firm capacity shortfall, and
each has a particular set of capabilities which help to contribute to this reliability need. Nova
Scotia Power has drawn from the set of IRP optimized resource plans from low-cost scenarios
to identify common elements; these common elements are understood to be robust to a wide
range of potential futures and can be incorporated into a no regrets Action Plan and Roadmap.
The IRP analysis has shown that combustion turbines are the lowest-cost domestic source of
new firm capacity; they replace retiring thermal capacity in all resource plans. These units are
also fast-acting, meaning they can quickly respond to changes in wind and non-firm imported
energy. They operate at low capacity factors, meaning that they facilitate integration of non-
emitting resources and do not significantly contribute to GHG emissions. In addition, Nova
Scotia Power’s existing combustion turbine resources provide similar services and economic
benefit to customers and are sustained through the planning horizon with appropriate
reinvestment requirements. Low-cost, low emitting generating capacity may also be provided
economically through redevelopment of existing natural gas-powered steam turbines or coal
unit conversions. Fuel flexibility, including low/zero carbon alternative fuels, may also be an
option for new and redeveloped resources and will be considered in the IRP Action Plan and
Roadmap.
Nova Scotia Power 2020 IRP 23
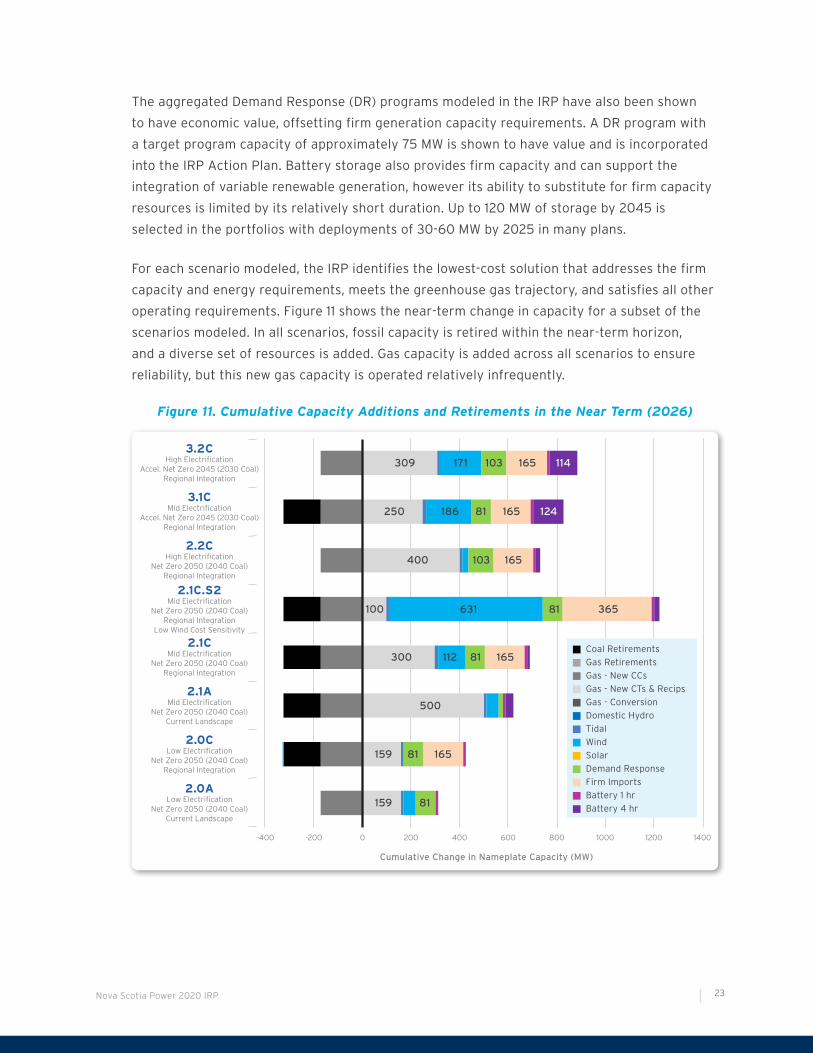
The aggregated Demand Response (DR) programs modeled in the IRP have also been shown
to have economic value, offsetting firm generation capacity requirements. A DR program with
a target program capacity of approximately 75 MW is shown to have value and is incorporated
into the IRP Action Plan. Battery storage also provides firm capacity and can support the
integration of variable renewable generation, however its ability to substitute for firm capacity
resources is limited by its relatively short duration. Up to 120 MW of storage by 2045 is
selected in the portfolios with deployments of 30-60 MW by 2025 in many plans.
For each scenario modeled, the IRP identifies the lowest-cost solution that addresses the firm
capacity and energy requirements, meets the greenhouse gas trajectory, and satisfies all other
operating requirements. Figure 11 shows the near-term change in capacity for a subset of the
scenarios modeled. In all scenarios, fossil capacity is retired within the near-term horizon,
and a diverse set of resources is added. Gas capacity is added across all scenarios to ensure
reliability, but this new gas capacity is operated relatively infrequently.
Figure 11. Cumulative Capacity Additions and Retirements in the Near Term (2026)
Cumulative Change in Nameplate Capacity (MW)
2.0ALow Electrification
Net Zero 2050 (2040 Coal) Current Landscape
2.0CLow Electrification
Net Zero 2050 (2040 Coal)Regional Integration
2.1AMid Electrification
Net Zero 2050 (2040 Coal)Current Landscape
2.1CMid Electrification
Net Zero 2050 (2040 Coal)Regional Integration
2.1C.S2Mid Electrification
Net Zero 2050 (2040 Coal)Regional Integration
Low Wind Cost Sensitivity
2.2CHigh Electrification
Net Zero 2050 (2040 Coal)Regional Integration
3.1CMid Electrification
Accel. Net Zero 2045 (2030 Coal)Regional Integration
3.2CHigh Electrification
Accel. Net Zero 2045 (2030 Coal)Regional Integration
-400 -200 0 200 400 600 800 1000 1200 1400
100
300
159
500
400
250
309
631
112
159
103
186
171
81
103
81
81
81
81
165
365
165
165
165
165
124
114
Coal Retirements
Gas Retirements
Gas - New CCs
Gas - New CTs & Recips
Gas - Conversion
Domestic Hydro
Tidal
Wind
Solar
Demand Response
Firm Imports
Battery 1 hr
Battery 4 hr
Nova Scotia Power 2020 IRP24
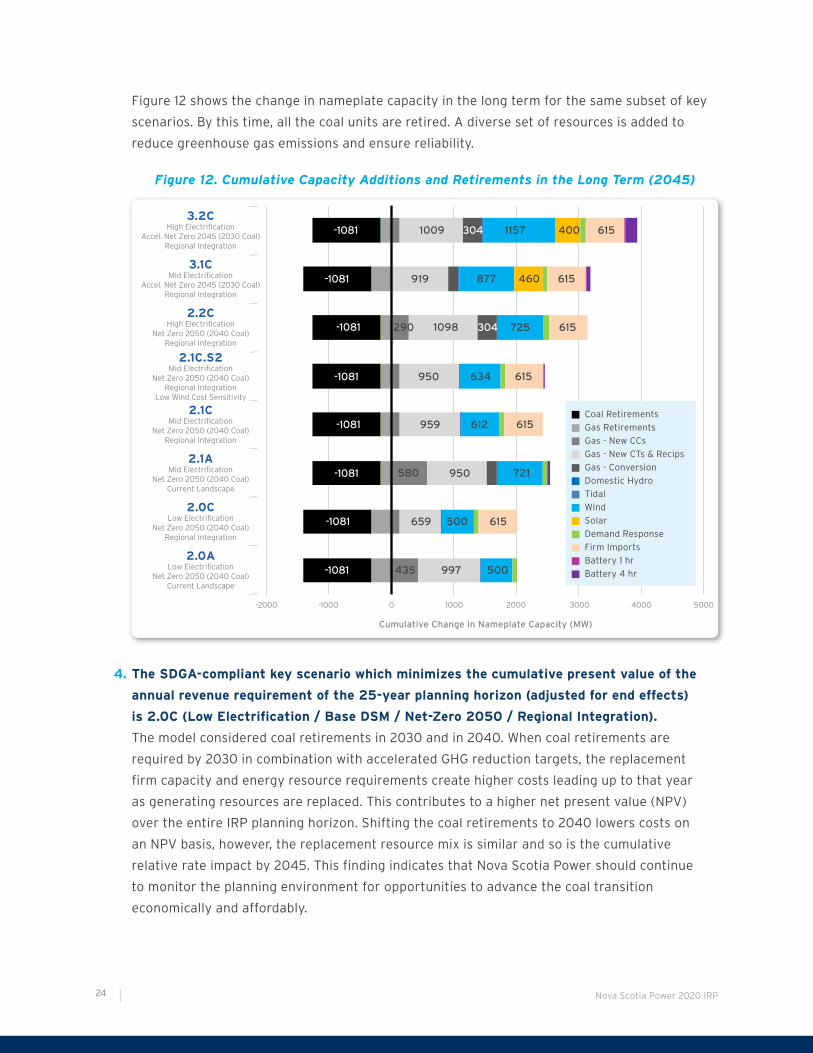
Figure 12 shows the change in nameplate capacity in the long term for the same subset of key
scenarios. By this time, all the coal units are retired. A diverse set of resources is added to
reduce greenhouse gas emissions and ensure reliability.
Figure 12. Cumulative Capacity Additions and Retirements in the Long Term (2045)
Cumulative Change in Nameplate Capacity (MW)
2.0ALow Electrification
Net Zero 2050 (2040 Coal) Current Landscape
2.0CLow Electrification
Net Zero 2050 (2040 Coal)Regional Integration
2.1AMid Electrification
Net Zero 2050 (2040 Coal)Current Landscape
2.1CMid Electrification
Net Zero 2050 (2040 Coal)Regional Integration
2.1C.S2Mid Electrification
Net Zero 2050 (2040 Coal)Regional Integration
Low Wind Cost Sensitivity
2.2CHigh Electrification
Net Zero 2050 (2040 Coal)Regional Integration
3.1CMid Electrification
Accel. Net Zero 2045 (2030 Coal)Regional Integration
3.2CHigh Electrification
Accel. Net Zero 2045 (2030 Coal)Regional Integration
-2000 -1000 0 1000 2000 3000 4000 5000
950
959
659
950
290
919
1009
634
612
435
1098
877
304
460
1157
615
500
997
615
615
615
615
400 615
304 725
580 721
500
Coal Retirements
Gas Retirements
Gas - New CCs
Gas - New CTs & Recips
Gas - Conversion
Domestic Hydro
Tidal
Wind
Solar
Demand Response
Firm Imports
Battery 1 hr
Battery 4 hr
-1081
-1081
-1081
-1081
-1081
-1081
-1081
-1081
4. The SDGA-compliant key scenario which minimizes the cumulative present value of the
annual revenue requirement of the 25-year planning horizon (adjusted for end effects)
is 2.0C (Low Electrification / Base DSM / Net-Zero 2050 / Regional Integration).
The model considered coal retirements in 2030 and in 2040. When coal retirements are
required by 2030 in combination with accelerated GHG reduction targets, the replacement
firm capacity and energy resource requirements create higher costs leading up to that year
as generating resources are replaced. This contributes to a higher net present value (NPV)
over the entire IRP planning horizon. Shifting the coal retirements to 2040 lowers costs on
an NPV basis, however, the replacement resource mix is similar and so is the cumulative
relative rate impact by 2045. This finding indicates that Nova Scotia Power should continue
to monitor the planning environment for opportunities to advance the coal transition
economically and affordably.
Nova Scotia Power 2020 IRP 25
1.9 Overview of Action Plan and Roadmap
The Action Plan is a key output of the 2020 IRP. As described in the 2020 IRP Terms of Reference,
the Action Plan identifies the critical undertakings required over the near term to implement
the long-term electricity strategy. Nova Scotia Power has identified near-term investment and
operational strategies that ensure it will satisfy its planning objectives while not closing off
opportunities that may later prove to be advantageous.
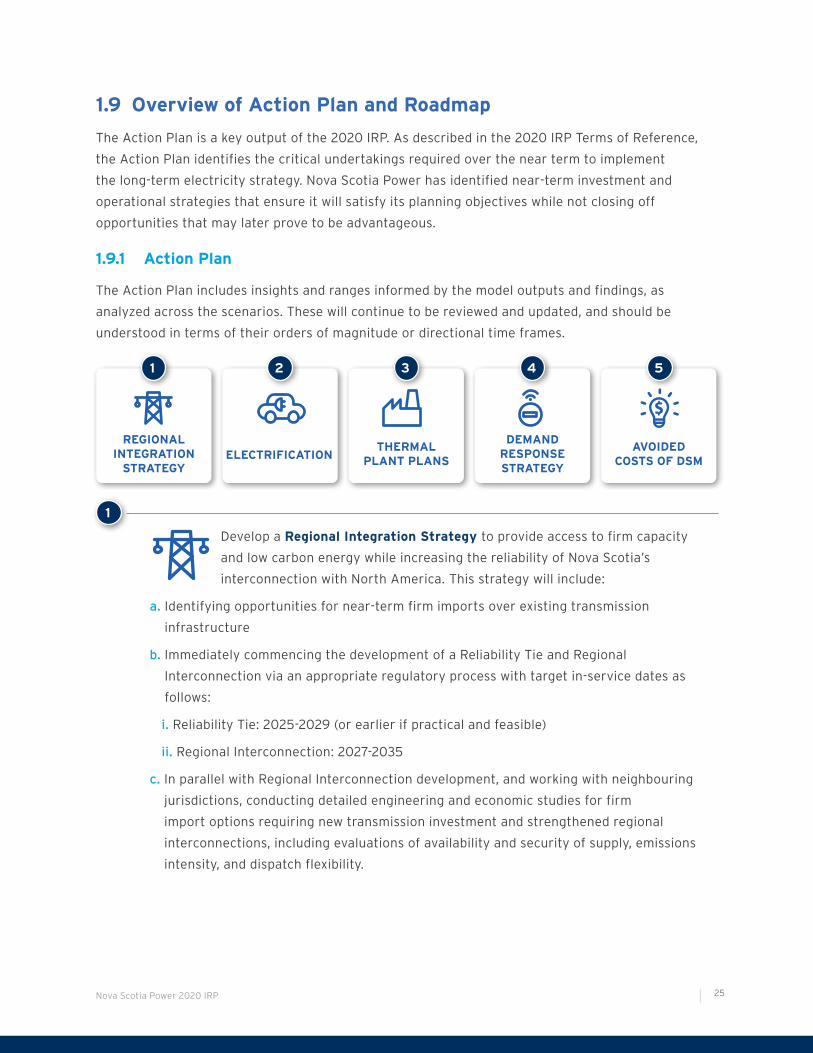
1.9.1 Action Plan
The Action Plan includes insights and ranges informed by the model outputs and findings, as
analyzed across the scenarios. These will continue to be reviewed and updated, and should be
understood in terms of their orders of magnitude or directional time frames.
1 2 3 4 5
REGIONAL INTEGRATION
STRATEGY ELECTRIFICATION THERMAL
PLANT PLANS
DEMAND RESPONSE STRATEGY
AVOIDED COSTS OF DSM
Develop a Regional Integration Strategy to provide access to firm capacity
and low carbon energy while increasing the reliability of Nova Scotia’s
interconnection with North America. This strategy will include:
a. Identifying opportunities for near-term firm imports over existing transmission
infrastructure
b. Immediately commencing the development of a Reliability Tie and Regional
Interconnection via an appropriate regulatory process with target in-service dates as
follows:
i. Reliability Tie: 2025-2029 (or earlier if practical and feasible)
ii. Regional Interconnection: 2027-2035
c. In parallel with Regional Interconnection development, and working with neighbouring
jurisdictions, conducting detailed engineering and economic studies for firm
import options requiring new transmission investment and strengthened regional
interconnections, including evaluations of availability and security of supply, emissions
intensity, and dispatch flexibility.
1

Nova Scotia Power 2020 IRP26
Electrification is a key variable in this IRP and results indicate that under
economic resource plans it can support provincial decarbonization while
reducing upward pressure on electricity rates for customers. Nova Scotia
Power proposes several Action Plan items from this IRP related to electrification:
a. Initiate an Electrification strategy to develop options for encouraging beneficial
electrification with the goals of maintaining rate stability while decarbonizing the
Nova Scotia economy consistent with the Sustainable Development Goals Act. The
Electrification Strategy will:
i. Incorporate industry best practices such as those identified by the Regulatory
Assistance Project8 as well as other relevant work, for example electrification programs
in other jurisdictions and the details already contained in the Deep Decarbonization
Pathways report.
ii. Develop and propose pilots and/or programs that focus initially on the transportation
and building electrification sectors identified in the Deep Decarbonization Pathways
report as key sectors for early electrification adoption. These pilots and programs will
be subject to NSUARB oversight.
b. Initiate a program to collect detailed data, including data on the quantity, flexibility and
hourly load shape of incremental electrification demand, to assist with further system
planning work.
c. Address electrification impacts on the Transmission & Distribution system as additional
experience and data become available. This will include an analysis of available and
projected T&D capacity at varying levels of electrification as well as identification of
potential mitigation options and cost estimates. This analysis will leverage data from the
AMI implementation as it becomes available.
Initiate a Thermal Plant Retirement, Redevelopment, and Replacement Plan,
including:
a. Develop a plan for the retirement and replacement of Trenton 5, targeting 2023,
while identifying required replacement capacity and energy in parallel. Begin
decommissioning studies for Nova Scotia Power’s other coal assets and develop
and execute a coal retirement plan including associated regulatory approval
process; this coal retirement plan will include significant engagement with
affected employees and communities.
3
2
8 Farnsworth, D., Shipley, J., Lazar, J., and Seidman, N. (2018, June). Beneficial electrification: Ensuring electrification in the public interest.
Montpelier, VT: Regulatory Assistance Project. (raponline.org)

Nova Scotia Power 2020 IRP 27
b. Complete a thermal plant Depreciation Study to update depreciation rates and a recovery
strategy to better align depreciation with updated useful lives for generation assets.
Invest sustaining capital into individual thermal units appropriate to their retirement
categorization.
c. Develop a plan for the redevelopment or replacement of existing natural gas-powered
steam turbines to provide low-cost, fast-acting generating capacity to the Nova Scotia
system. Fuel flexibility is a component of this work, including consideration for low/zero
carbon alternative fuels.
d. Initiate a wind procurement strategy, targeting 50-100 MW new installed capacity by 2025
and up to 350 MW by 2030. This strategy will solicit Nova Scotia-based market pricing
information which will inform the selected wind capacity profile and timing, informed by
the IRP wind sensitivities.
In parallel with other elements of the wind procurement strategy, complete system
stability studies to determine whether additional dynamic system inertia constraints,
operating limits, and/or provision of alternate services like Fast Frequency Response
(FFR), are required to enable higher levels of wind integration on the Nova Scotia system,
particularly in advance of the commissioning of integration measures such as the
Reliability Tie.
Create a Demand Response Strategy targeting 75 MW of capacity, for deployment
by 2025. Available resource cost, flexibility, and reliability may inform pursuit of
additional Demand Response capability.
a. The strategy will be closely linked to the Electrification Strategy being developed in
parallel. The strategy will build on learnings from Nova Scotia Power’s Smart Grid Project,
Nova Scotia Power’s Time Varying Pricing application, the DR Joint Working Group
between Nova Scotia Power and Efficiency One, the Extra-Large Industrial Active Demand
Control (ELIADC) tariff, and the Large Industrial Interruptible Rider.
Nova Scotia Power will calculate Avoided Costs of DSM (capacity and energy) for
scenarios 2.0C and 2.1C. 2.0C will be used as the Reference Plan and 2.1C will be
available for additional reference.
5
4

Nova Scotia Power 2020 IRP28
1.9.2 Roadmap
As conditions change – either through changes to policy, technology, or economics – Nova Scotia
Power will adapt its resource plan to best serve customers. The Roadmap sets out a series of
signposts that, if observed, may indicate a need to alter the system planning strategy.
Advance engineering study work on coal to gas conversions at Trenton and Point Tupper
Generating Stations. Monitor cost outputs of this work relative to IRP assumptions and
update the balance of new and converted capacity resources accordingly.
Complete detailed system stability studies under various current and future system
conditions, reflective of both stressed system states and normal operating conditions, while
considering higher quantities of installed wind capacity as seen in the IRP modeling results.
This work will also consider the impacts of grid service provision from inverter-based
generators (such as wind turbines) and how the introduction of new ancillary grid services
like Fast Frequency Response might affect existing services such as Synchronized Inertia.
Monitor results for significant divergence from wind integration assumptions modeled in the
IRP and trigger an update as needed.
Pursue economic reinvestment in existing hydro and combustion turbines with individual
capital applications as applicable; economic justification as part of a capital application will
be required to confirm decision to pursue Mersey hydro redevelopment. Continue sustaining
capital investment in thermal units, aligned with their projected retirement classification.
Monitor required levels of sustaining capital investment for significant changes from IRP
assumptions and, if observed, trigger a unit-specific analysis of alternatives. Monitor unit
reliability for significant changes from IRP assumptions and, if observed, trigger an ELCC
calculation and/or PRM study as required.
Monitor the development of low/zero carbon fuels that could replace natural gas in
powering generating units to provide firm, in-province capacity.
Continue to track the installed costs of wind, solar, and energy storage to look for variations
from the trajectories established in the IRP (in particular, monitoring for divergence from
the “Base” to the “Low” pricing scenarios as defined in the IRP Assumptions). Nova Scotia
Power will solicit Nova Scotia-based market information which will inform this as needed.
Work with E1 to monitor ongoing operational unit costs of DSM in Nova Scotia.
1
2
3
4
5

Nova Scotia Power 2020 IRP 29
Track the ongoing development of the Nova Scotia Cap-and-Trade Program, including
auction results and developing regulations. In particular, monitor GHG market size for
indications that value from incremental allowance sales (beyond the projected economic
emissions reductions shown in the IRP results) can be incorporated into long-term resource
planning decisions with greater certainty. Significant changes in the value of incremental
GHG reductions could influence resource plan components including non-emitting
generation procurement, DSM levels, and coal retirement trajectories.
Monitor electrification growth in Nova Scotia to understand at what point the provincial load
profile starts to move from Low, to Mid, to High levels of electrification as defined in the
IRP Assumptions for firm peak and/or annual energy requirements. An observed transition
will, among other impacts, inform the use of DSM avoided costs in related proceedings and
trigger a PRM study using actual peak, energy, and load shape data.
Continuously refine the Action Plan and Roadmap items via an evergreen IRP process. This
process should facilitate annual updates as conditions change and technology or market
options develop, and as Action Plan items are completed or significantly advanced. Nova
Scotia Power will include a summary of updates as part of IRP Action Plan reporting and will
incorporate the opportunity for stakeholder comment and feedback as part of the update
process.
1.10 Going Forward
Nova Scotia Power’s 2020 IRP reflects global themes of transformation, economy-wide
decarbonization, adoption of green technologies, and collaboration with a broad range of
stakeholders. Interest in these themes has been intensified as a result of the ongoing COVID-19
pandemic, and the associated focus on economic recovery. Nova Scotia Power is pleased to present
this IRP Report as a result of the collective efforts of interested parties to understand and plan for
the potential long-term clean energy future of Nova Scotia and to identify a roadmap for system
planning based on scenarios that will ensure the utility continues to deliver safe and reliable
electricity while accelerating an affordable transition to clean energy in this context.
Nova Scotia Power is appreciative of the input of stakeholders throughout this IRP process, which
is among the most significant stakeholder engagement work Nova Scotia Power has undertaken.
The 2020 IRP expanded the focus of the traditional utility planning exercise to understand the role
of the electric utility within Nova Scotia’s broader transition to a clean energy future. Nova Scotia
Power will continue to update and advance this work as part of an evergreen IRP process going
forward. Building on this foundation of collaboration will be a key element of Nova Scotia reaching its
sustainability goals — Powering a Green Nova Scotia, Together.
6
7
8

Nova Scotia Power 2020 IRP30
2.1 Nova Scotia Power’s Mission
Delivering safe, reliable, affordable, and clean energy is central to Nova Scotia Power’s mission. This
Integrated Resource Plan (IRP) represents Nova Scotia Power’s first long-term plan that commits to
the retirement of all coal units within the IRP planning horizon. This decision reflects the preferences
of customers, the goals of the province, and the scientific consensus that deep decarbonization
is essential to avoid the worst impacts of climate change. The planning process and assumptions
utilized for this study reflect Nova Scotia Power’s mission to ensure a sustainable electricity supply —
environmentally and economically — for customers across Nova Scotia.
2.2 Objectives of the IRP
As a regulated utility with an obligation to serve customers, planning for the future is a responsibility
and requirement for Nova Scotia Power. The IRP is a long-term planning exercise that establishes
the direction for Nova Scotia Power to meet customer demand and energy requirements, as well as
environmental obligations, in a safe, reliable, affordable and clean manner across a reasonable range
of foreseeable futures. The IRP provides a structured way for Nova Scotia Power and stakeholders
to assess the potential impacts of uncertain policy, technological, and market factors that may
have significant implications on the utility and its customers. Nova Scotia Power is required to file
a 10-Year System Outlook annually; IRPs are carried out when material changes in the key external
influences underlying Nova Scotia Power’s long-term planning environment, such as environmental
policy or market landscape, trigger a need to revisit the long-term planning strategy.
At the start of the core IRP process, Nova Scotia Power’s approved 2020 IRP Terms of Reference
laid out three primary objectives for the 2020 IRP, reflected below in Figure 13. The first objective
of the plan was to develop a robust, risk-weighted, lowest-cost long-term electricity strategy that
delivers energy in a safe and reliable manner, continues provincial decarbonization via non-emitting
resources, and maintains affordability for customers across a range of foreseeable future scenarios.
This objective reflects the Company’s commitment to developing a plan that achieves significant
decarbonization while ensuring rate stability to customers over the IRP’s 25-year planning horizon.
2 IRP INTRODUCTION AND PROCESS

Nova Scotia Power 2020 IRP 31
The second objective of Nova Scotia Power’s 2020 IRP was to construct an Action Plan and Roadmap
outlining the key tasks to be undertaken in the next five years to implement the strategy, and
to identify signposts to monitor and decision gates to be addressed in order to enable carefully
considered changes in strategy as the external policy, technology, and market landscape evolves.
This Action Plan and Roadmap are directly informed by the modeling performed by Nova Scotia
Power, which reflected a range of potential external influences, as well as by other known potential
future uncertainties.
The third key objective of the 2020 IRP was to develop a collaborative, transparent, and evergreen
utility resource planning process in Nova Scotia that reflects industry best practices and promotes
understanding and consensus. Toward that aim, this IRP process has involved extensive stakeholder
engagement, including input from nine public workshops, six rounds of formal submissions from
stakeholders, independent expert analyses, and ongoing consultation with participants.
Figure 13. Nova Scotia Power’s Approved Terms of Reference IRP Objectives9
Develop a robust, risk-weighted least-cost long-term electricity
strategy (“the Strategy”) that delivers energy in a safe and reliable
manner, continues provincial decarbonization via non-emitting
resources, where appropriate, and maintains affordability for
customers across a range of foreseeable future scenarios.
Develop an Action Plan and Roadmap describing the key tasks to
be undertaken in the next five years to implement the Strategy and
identify signposts to monitor and decision gates to be addressed
in order to enable the appropriate triggering of changes to the
Strategy, based on future changes in the planning environment.
Develop a collaborative, transparent and evergreen electric utility
resource planning process in Nova Scotia that reflects industry
best practices in the area of resource planning and promotes
understanding and consensus among interested parties.
1
2
3
9 https://nsuarb.novascotia.ca/ Matter M08929, Exhibit N-4, the NSUARB-approved Terms of Reference for the IRP.

Nova Scotia Power 2020 IRP32
10 https://nsuarb.novascotia.ca/ Matter M08059, Generation Utilization and Optimization, Exhibit N-1, May 1, 2018.11 https://nsuarb.novascotia.ca/ Matter M08195, NSPI Fuel Adjustment Mechanism (FAM) Audit conducted by Bates White, Exhibit N-1, July 24, 2018.12 https://nsuarb.novascotia.ca/ Matter M08929, Exhibit N-8, Nova Scotia Power Pre-IRP Report, May 22, 2020, E3 Planning Reserve Margin and Capacity
Study, pages 200-284 of 652.13 https://nsuarb.novascotia.ca/ Matter M08929, Exhibit N-8, Nova Scotia Power Pre-IRP Report, May 22, 2020, E3 Resource Options Study, pages 285-366 of 652.14 https://nsuarb.novascotia.ca/ Matter M08929, Exhibit N-8, Final Pre-IRP Report, October 17, 2019 (updated November 1, 2019), May 22, 2020.
2.3 Process for the IRP
Prior to initiating the core IRP process, Nova Scotia Power undertook a number of pre-IRP studies
per the recommendations of the Generation Utilization and Optimization Report10 (completed by
the Nova Scotia Utility and Review Board’s (NSUARB) consultant Synapse Energy Economics, Inc.)
and Bates White Economic Consulting’s 2016-2017 Fuel Adjustment Mechanism Audit Report11.
These included a Planning Reserve Margin and Capacity Value Study (PRM and Capacity Study),12
a Resource Options Study,13 a Nova Scotia Power Stability Study for Renewable Integration
(Renewables Stability Study), and a Demand Response Options Study. Nova Scotia Power engaged
with interested parties over the summer of 2019 on this work through a series of workshops to
present its draft studies and to solicit and reflect stakeholder feedback. Nova Scotia Power issued its
Final Pre-IRP Report following this process to stakeholders on October 17, 2019 (updated November
1, 201914). Included as Appendix N is a summary providing confirmation of the way in which the pre-
IRP process and IRP process have responded to directives and/or commitments associated with the
prior GUO and FAM Audit proceedings. Following completion of the pre-IRP analysis stakeholder
engagement, Nova Scotia Power commenced engagement with stakeholders on the core IRP process.
The IRP modeling process, as laid out in the Terms of Reference, comprised several modeling stages
as shown in Figure 14, with stakeholder workshops and engagement between stages to facilitate
input from interested parties.
Figure 14. 2020 IRP Modeling Process
MODELING
POST-MODELING
Long-term Strategy
Roadmap
Near-term Action Plan
Extract findings (observations &
conclusions) in order to develop:
Assumptions & Scenarios
Resource Screening
Initial Portfolio
Study Operability Screening
Reliability Screening Final
Portfolio Study
Sensitivity Analysis
Prior to beginning work on the modeling, Nova Scotia Power then engaged in a collaborative Analysis
Plan development process. The Analysis Plan described in detail the modeling and evaluation
process, the portfolio evaluation criteria, scenarios and sensitivity analyses, and descriptions of the
modeling approach and phases.
Nova Scotia Power 2020 IRP 33
15 The Assumptions are provided in Appendix B. Appendix C provides the Scenarios & Modeling Plan.16 Appendix J, Modeling Results, pages 2 to 75.17 Appendix J, Modeling Results Workshop, pages 76 to 104.18 Appendix K, page 108.19 Please refer to Appendix K.
Using the Analysis Plan as a guide, Nova Scotia Power proceeded with establishing a comprehensive
set of analysis assumptions, reflecting publicly available, documented and/or independently vetted
sources where possible. Nova Scotia Power invited stakeholder comment on these sources and
assumptions and used the resulting range of available information and sources to inform the base
case and sensitivity modeling performed. The final set of analysis Assumptions and the Scenarios &
Modeling Plan were published on March 11, 2020.15
As a next step, the Resource Screening phase was undertaken to select a reasonable set of new
candidate resource options and retirement decisions, balancing the desire to test a broad range
of portfolio of expansion options with the need to maintain a manageable set of model options to
reduce computational challenges within PLEXOS. This ensures reasonable model execution time and
focuses computational resources on more critical decisions.
The above steps provided the required inputs for Nova Scotia Power to undertake its Initial Portfolio
Study, with modeling results16 released on June 26, 2020 and presented at a workshop on July 9,
202017. This portfolio analysis relied predominantly on capacity expansion optimization modeling
using PLEXOS LT, with supporting analysis utilizing PLEXOS MT/ST and E3’s RESOLVE model. The key
scenarios defined in the Modeling Plan were modeled to assess the economically optimized capacity
expansion plan (i.e. the portfolio of resource additions and retirements over the 25-year planning
horizon and the associated NPV revenue requirement for each plan). This step then explicitly
compared model results across the range of scenarios and ranked them using established evaluation
criteria.
Given that all IRP scenarios being modeled will result in dramatic changes to the power system, Nova
Scotia Power undertook two additional modeling phases to better understand both the reliability
and operability of each plan. For the reliability assessment, Nova Scotia utilized E3’s loss of load
probability model, RECAP, to perform a robust assessment of the reliability of key scenarios in 2045,
including estimating the achieved loss-of-load over thousands of simulated years of weather and
resource output. Similarly, to better understand the operability of each scenario, Nova Scotia Power
ran key scenarios through PLEXOS MT/ST to evaluate the production costs (e.g., fuel and purchased
power) and dispatch at a more granular level.
Nova Scotia Power used the outputs from the Reliability and Operability Screening phases and
associated stakeholder comments to conduct revised capacity expansion optimization modeling
with PLEXOS LT. For this Final Portfolio Study, released on September 2, 202018, production cost
simulations were completed using PLEXOS MT/ST and the resulting generation and production cost
outputs were incorporated into the IRP analysis to increase the granularity of the final runs. The
final Modeling Results, Draft Findings, Action Plan and Roadmap were circulated to stakeholders for
comment on September 2, 2020.19
Nova Scotia Power 2020 IRP34
2.4 Advancements in the IRP Approach
The evolving planning landscape described above, coupled with advancements in modeling and utility
planning best practices, has allowed Nova Scotia Power to update and improve upon its long-term
resource planning process. The number and range of uncertainties in the electricity industry have
increased considerably in the past decade. These uncertainties and changes have necessitated a
different approach to the IRP than the traditional approach in which the most economically feasible
resource mix was selected as the preferred plan. In addition to the lowest cost resource mix, factors
such as environmental and government policy requirements, reliability and grid stability, and
customer rate impacts also inform the IRP. The following summarizes several of these important
evolutions:
2.4.1 Multiple NPVRR and Rate Metrics
Traditionally, the objective for resource planners has been to model and identify an optimal
portfolio of resources that minimize cost Net Present Value of Revenue Requirement (NPVRR) as
the sole metric. This was done while focusing on a single central scenario for key assumptions
and forecasts (e.g. load, emissions, etc.). This IRP has considered the current dynamic planning
environment by incorporating additional planning objectives which include evaluating resources with
the best combination of costs, risks, and uncertainty with a lens toward customer affordability and
decarbonization. A combination of scenario and sensitivity analyses has enabled evaluation of the
range of uncertainty across scenarios and along different outcome metrics.
2.4.2 Target Planning Reserve Margin
As explained in more detail in Section 5.3, Nova Scotia Power’s PLEXOS LT expansion model
considers the Planning Reserve Margin (PRM) constraint in the optimization. Traditionally,
Nova Scotia Power has used an Installed Capacity (ICAP) method which targets a 20 percent PRM,
as opposed to an Unforced Capacity method (UCAP) (which targets approximately a 9 percent PRM),
with thermal generators contributing at their nameplate capacity. This ICAP methodology is the most
common approach used in the industry and as such, Nova Scotia Power will continue to use the PRM
calculated in the Pre-IRP Planning Reserve Margin and Capacity Value Study (20 percent) for future
reference. Both methods result the in same reliability and the same quantity of effective capacity.
For resources already in the portfolio, it does not matter whether an ICAP or UCAP approach is used.
However, based on stakeholder feedback and working with Nova Scotia Power’s IRP consultant, E3,
the utility agreed to use the UCAP method for its capacity expansion modeling, as the ICAP method
over-counts thermal resources relative to other resources by not considering forced outage rate. The
UCAP method addresses this deficiency by counting thermal generators at their effective capacity,
incorporating forced outages. The UCAP method is also better at considering reliability implications
with resource sizing. In Nova Scotia Power’s relatively small system, lumpy outages associated

Nova Scotia Power 2020 IRP 35
20 https://nsuarb.novascotia.ca/, Matter M08929, NS Power IRP, Exhibit N-8, Appendix A, PDF pages 367-433.
with larger resources can result in differences in effective capacity contribution (e.g. three 50 MW
generators are more reliable than one 150 MW generator because it is very unlikely all three will
experience a forced outage at the same time).
2.4.3 System Strength and Stability
The next 25 years will see a dramatic transformation in the Nova Scotia generation mix as it moves
further towards decarbonization. Theories and physics of power systems were developed around
synchronous machines that were historically the backbone of the power system. This IRP analysis
has modeled the retirement of major large synchronous generators with replacement, in part, by
inverter-based non-synchronous generation or other lower-emitting generators. The retirement
of coal-fired generators will not only impact system adequacy (capacity and energy) but will also
require a major shift in the provision of ancillary grid services which have historically been provided
by large synchronous machines.
Historically, system adequacy constraints have been imposed via the specification of a certain
number of “must-run” units. In Nova Scotia, these units have been the larger thermal units, reflecting
the quantity of ancillary services required. For this IRP, Nova Scotia Power developed assumptions
about cost and operational constraints to address these services in the absence of the thermal/coal
resources. These assumptions, generally focused on aggregating sufficient synchronous inertia to
survive a system contingency, have been developed by Nova Scotia Power and its consultants using
the PSC Stability Study20 from the Pre-IRP work as the basis for assumptions. Further detailed study
to establish firm opportunities and constraints for inverter-based energy sources will continue to be
required as the system changes.
2.4.4 Long-Term Capacity Expansion Modeling Software
In previous IRPs, Nova Scotia Power relied on Strategist, a resource planning tool supported by ABB
Enterprise Software. This tool worked well when the system was predominantly dispatchable, fossil-
based generation. However, as Nova Scotia Power seeks to integrate greater quantities of variable
renewable resources, Strategist’s limitations make it less suitable for modeling the evolving system.
To address these limitations, Nova Scotia Power has instead chosen to rely on the commercially
available PLEXOS LT capacity expansion model, in conjunction with E3’s RESOLVE model to help
screen resources and test a broader range of scenarios. PLEXOS LT is a mixed integer programming
model developed by Energy Exemplar that can be used to perform detailed, robust capacity
expansion modeling that models the chronological behaviour of loads and variable generation.
Generation dispatch, transmission power flow and ancillary services are co-optimized and integrated
with emissions modelling. PLEXOS MT/ST (mid-term/short-term) provides an hourly chronological
production simulation that reflects unit commitment constraints and real-time dispatch to match
supply and demand. Dispatch is co-optimized to meet load and ancillary service requirements at
Nova Scotia Power 2020 IRP36
minimum cost subject to a number of operating constraints. The detailed hourly unit commitment
and economic dispatch module was also used as an operability screening tool to help inform final
modeling updates in the PLEXOS LT runs (see Section 5.3). Nova Scotia Power utilized both models
for all IRP scenarios in the final Portfolio Study. The PLEXOS LT Model was used for capacity
expansion optimization while the PLEXOS MT/ST module was used for production cost modeling (as a
component of NPV) and energy balance reporting for each PLEXOS LT-produced scenario.
While PLEXOS can provide valuable insights on system operations, its complexity prohibits
exhaustive analysis of a large number of scenarios. As such, RESOLVE complemented PLEXOS as a
faster-solving capacity expansion model designed specifically for systems seeking to integrate higher
penetrations of renewable resources. RESOLVE relies on a linear optimization framework that allows
it to minimize computer run time, enabling it to evaluate many scenarios and sensitivities over long
time horizons. At the same time, the model has rigorous modeling of system operations to consider
how resources like wind, solar, and storage will impact hourly operations as part of the investment
decision, utilizing “smart” day sampling to capture a wide variety of days and a more statistically
significant representation of the full spectrum of load and renewable conditions. E3 and Nova Scotia
Power calibrated the RESOLVE and PLEXOS LT inputs to ensure consistent modeling of the Nova
Scotia Power system in both tools. The RESOLVE model then enabled Nova Scotia Power to quickly
“screen” resources up front to reduce the amount of candidate resources within PLEXOS LT, and
also allowed Nova Scotia Power to explore additional scenarios and sensitivities throughout the IRP
process.
2.5 Role of the IRP Working Group
The approved Terms of Reference state that Nova Scotia Power is to complete the IRP process in
collaboration with the Nova Scotia Utility and Review Board’s (NSUARB) staff and its consultants.
Nova Scotia Power and its consultant, E3, have worked throughout the IRP process with NSUARB
staff, and staff’s consultants Synapse Energy Economics, Inc. (Synapse) and Bates White Economic
Consulting (Bates White) (Working Group). The Working Group has met regularly since the
commencement of the core IRP process to discuss and collaborate on the overall approach to
the analysis review and receive feedback on detailed modeling results in live time as Nova Scotia
Power and E3 have completed their work. Nova Scotia Power provided the IRP PLEXOS LT and MT/
ST models to Synapse as part of this process to enable Synapse and Bates White to complete their
reviews. Nova Scotia Power has strived throughout this engagement to develop support from the
members of the Working Group for its approach to the overall analysis and technical validity of its
modeling work, and its responses to their requests and feedback.

Nova Scotia Power 2020 IRP 37
2.6 Stakeholder Consultation and Public Process
Nova Scotia Power’s IRP establishes the strategic direction for the electricity future of Nova Scotia;
stakeholder input is integral to this process. Commencing with the pre-IRP deliverables phase,
and continuing throughout the core IRP process, Nova Scotia Power has been committed to the
promotion of transparency with stakeholders through continued regular engagement sessions, the
distribution of draft materials for stakeholder review and input throughout the IRP phases, and
individual meetings to discuss feedback and address questions.
Nova Scotia Power created a public IRP website (irp.nspower.ca) for publication of all materials
exchanged through the IRP process. In addition to background reference materials, all materials
provided to stakeholders as part of the process were published on the website.
In accordance with the Terms of Reference, Nova Scotia Power hosted stakeholder workshops
at each key milestone stage in the process – Scenario Development, Assumptions and Analysis
Plan, Interim Modeling Results, Modeling Results, Draft Findings, Action Plan and Roadmap. These
workshops have been strongly attended (with several having in excess of 100 individual attendees).
Each of these milestone stages involved circulation of materials to stakeholders and the opportunity
for stakeholders to submit comments on the materials circulated.21 To assist with understanding
stakeholder positions relative specifically to the IRP’s Findings, Action Plan, and Roadmap, Nova
Scotia Power has prepared a summary document synthesizing comments on these components
of the IRP report.22 Nova Scotia Power appreciates the input of stakeholders, which in many cases
resulted in adjustments to the analysis and additional modeling work or analysis being performed,
contributing to the overall robustness of the IRP.
The members of the IRP team also had frequent direct one-on-one meetings with interested parties
and their consultants, where applicable, to discuss areas of interest and questions. These meetings
allowed for the sharing of information, expertise and perspectives and discussion of issues at a
level of detail that could not be accommodated within the broader workshops. The approach to
stakeholder engagement on this project was unprecedented for a Nova Scotia Power IRP process.
The participation and depth of collaboration with interested parties surpasses that experienced in
any other regulatory process. The expertise and input that stakeholders offered throughout the
exercise has substantially contributed to the overall quality of the work and the outcomes reported
upon in this Final Report.
Attached as Appendix G is a list of all parties who registered their interest and/or participated in the
IRP process.
21 The documents covering Interactions with stakeholders and their contributions are provided in Appendices H, I, J, K, and L.22 Appendix M.

Nova Scotia Power 2020 IRP38
Through the IRP process, Nova Scotia Power undertakes long-term system planning to understand
how the electricity system will continue to meet the needs of customers and respond to changes
in the electricity planning landscape. This process informs ongoing investment, retirement, and
operating decisions that comply with legislation and are in the best interest of customers over a 25-
year planning horizon. Nova Scotia Power plans the system to be safe, reliable, affordable, clean, and
robust under a wide range of potential future outcomes.
3.1 Ensuring Reliability
A reliable electric system is essential to Nova Scotians. Nova Scotia Power plans its electricity
system to ensure that loss-of-load events, caused by an electricity supply shortfall, are rare. System
reliability must be taken into consideration when making long-term investment, retirement, and
contracting decisions. The construction time for new resources can range from several months to
several years, depending on the type and quantity of a resource, among other factors. Therefore,
Nova Scotia Power plans years in advance to anticipate any long-term changes in loads or resources
and procures additional capacity as necessary to maintain an adequate supply of resources.
Resource adequacy is the ability of a bulk electric power system to serve load across a broad range
of weather and system operating conditions, subject to a long-run reliability standard. No electricity
system is perfectly reliable; there is always some chance that generator failures and/or extreme
weather conditions impacting supply and demand could compound on one another to result in loss of
load. In practice, Nova Scotia Power maintains a level of resource adequacy to ensure that such loss-
of-load reliability events are rare. The resource adequacy of a system depends on the characteristics
of load (magnitude, seasonal patterns, weather sensitivity, hourly patterns) as well as resources (size,
dispatchability, outage rates) and other limitations on availability, such as the variable production of
intermittent renewable resources. If the availability of resources is adequate to meet load across a
wide range of conditions and limit loss-of-load events to a reasonable level – where “reasonable” is
defined by a reliability target – then a system is considered to have an adequate supply of resources.
Traditionally, the majority of Nova Scotia Power’s supply portfolio has consisted of thermal
resources, which are dispatchable (can be turned on, turned up or turned down on command). As
Nova Scotia Power continues to decarbonize the power supply, it will add increasing amounts of
3 MEETING FUTURE OBJECTIVES

Nova Scotia Power 2020 IRP 39
resources that are variable, intermittent, or limited in how they dispatch. Dispatch-limited resources,
such as wind and solar generation and energy storage, add complexity to reliability planning because
they have constraints that limit them from operating continuously at full capacity to meet demand.
In addition, due to interactive effects among these component factors, the most challenging period
for reliability may not be in the peak hour. This new complexity requires Nova Scotia Power to use
a more comprehensive method for calculating the contribution of these resources toward resource
adequacy.
Planning for a future decarbonized grid with fewer synchronous generators and more variable
and non-synchronous resources also requires a re-evaluation of system operational requirements.
For example, additional regulation reserves might be required due to the increased variability and
uncertainty from wind generation. In addition, with the increased penetration of non-synchronous
generation, it is important to ensure that ancillary grid services, including various types of reserve,
frequency response, and synchronous inertia, can still be provided.
3.1.1 Planning Reserve Margin (PRM)
The first step in planning for a reliable grid is load forecasting. Understanding how customer demand
may change under different future scenarios is crucial to Nova Scotia Power’s planning process. The
load forecast relies on demographic and economic indicators (e.g. population and economic growth),
historical sales data, and weather variables (e.g. cooling degree day and heating degree days). The
load forecasting process used for this IRP is described in more detail in Section 4.1.
The second step in ensuring reliability is to set a reliability criterion and a corresponding planning
reserve margin requirement for the system. In the pre-IRP planning reserve margin study23, Nova
Scotia Power confirmed that its reliability criterion of 1-day-in-10-years Loss-of-Load Expectation
(“LOLE”) was consistent with industry best practices, based on a jurisdictional review. LOLE
represents the expected number of days over a given period that will experience a loss-of-load event.
Under this standard, a system is considered reliable (and to have an adequate supply of resources)
if the expected frequency of loss-of-load events is limited at most to one day every 10 years. This
criterion is equivalent to an LOLE of 0.1 days per year.
After identifying the reliability criterion, Nova Scotia Power translated the 1-day-in-10-years LOLE
criterion to a PRM24 which specifies the need for total capacity as a percentage requirement above
expected peak demand. The PRM is defined as the quantity of capacity needed, divided by the expected
– or 1-in-2-year – peak demand, minus one. Utilities commonly report resource adequacy in terms of PRM
because it provides a more simplified accounting framework for expressing resource adequacy.
23 https://nsuarb.novascotia.ca/, M08929, Exhibit N-8, E3, Planning Reserve Margin and Capacity Value Study, July 2019, pages 198- 282.24 Planning Reserve is the reserve margin calculated to satisfy the Northeast Power Coordinating Council (NPCC) resource adequacy design criterion
stated in NPCC Regional Reliability Reference Directory # 1: Design and Operation of the Bulk Power System. The planning reserve margin
requirement in any year is the amount of supply resources in excess of the annual peak demand needed to meet the NPCC reliability criterion of
an annual loss of load expectation of 0.1 days/year.
Nova Scotia Power 2020 IRP40
There are two alternative PRM accounting methods commonly used in the industry, based on using
a unit’s unforced capacity (UCAP) or installed capacity (ICAP) values. While either method will result
in the same reliability standard and the same total quantity of effective capacity, the methods differ
in how they measure qualifying capacity. ICAP accounting credits traditional dispatchable resources
(e.g., coal, natural gas) at their nameplate capacity, without considering forced outage de-rates, and
credits energy-limited resources, including solar, wind, hydro, and battery storage, at their effective
load carrying capacity (discussed in further detail below). As an alternative, utilities and capacity
markets are beginning to transition to an unforced capacity (UCAP) rather than installed capacity
(ICAP) approach to determine the PRM for purposes specifically associated with capacity expansion
modeling. This UCAP value adjusts the peak contribution of thermal resources to account for their
forced outage or deratings, instead accounting for these resources based on their UCAP or unforced
capacity value. This approach puts existing and candidate thermal and renewable resources on an
“equal footing” by accounting for the resources’ contributions to peak in a consistent way.
For the 2020 IRP, Nova Scotia Power used its existing 20 percent ICAP PRM, which the E3 planning
and reserve margin study verified was within the range of PRMs consistent with the reliability
criterion, and converted this to an equivalent 9 percent UCAP PRM. This UCAP translated value
was adopted for the capacity expansion modeling only, based on feedback and discussion with IRP
participants, to ensure that renewable resources (primarily wind) would face an equivalent crediting
formula to new and existing thermal alternatives. This choice does not change the reliability
criterion or use of ICAP PRM calculations in other reporting and analysis. The PRM target will remain
appropriate for as long as the given load characteristics and reserve requirements remain consistent.
As Nova Scotia Power begins to serve new electrification load, or as significant changes start to
occur to the overall generation mix, the appropriate PRM may require re-evaluation and adjustment.
3.1.2 Effective Load Carrying Capability
When system reliability is maintained through a PRM requirement in the planning process, one of
the most important steps is quantifying the amount of firm capacity provided by each existing and
candidate resource. Electricity resources can be placed into three categories to evaluate the ways
they can contribute to ensuring resource adequacy:
• Firm resources (e.g. coal and diesel), which are generally capable of supplying power to the
electricity system when needed, absent unexpected plant outages
• Dispatch-limited resources (e.g. wind, hydro, energy storage, and solar photovoltaic (PV)),
whose capability varies based on time of day and season based on a variety of factors; and
• Market purchases, which relate to procurement of capacity through various market processes
from other entities to satisfy capacity needs (e.g. Maritime Link firm capacity purchases)

Nova Scotia Power 2020 IRP 41
Firm resources and market purchases with firm contract and transmission rights are usually capable
of providing firm capacities that are close to the rated nameplate capacity. Unlike traditional
firm resources, dispatch-limited resources have constraints that limit them from being operated
continuously at full capacity to meet demand. These constraints may take multiple forms: for
intermittent renewable resources like wind and solar, the availability of generation is a function of
underlying meteorological conditions and will vary by time of day and from season to season; for
energy storage, the resource’s duration – the number of hours of stored energy – limits the amount
of time it can be operated at full capacity.
Due to these various limitations, the contributions of dispatch-limited resources to reliability are
often lower than the resources’ rated maximum or nameplate capacity. Another consequence of
these limitations is that dispatch-limited resources tend to exhibit diminishing returns as installed
capacity on the system increases due to saturation effects. That is, each increment of a specific
dispatch-limited resource will tend to have a lower contribution to resource adequacy than the prior
increment.
Industry practices remain varied, but the effective load carrying capability (“ELCC”) method has
quickly emerged as the industry best practice for estimating the contribution of dispatch-limited
resources toward resource adequacy. Given its advantages, the ELCC method for quantifying the
capacity contribution of dispatch-limited resources has been adopted by several independent system
operators (e.g., CAISO, MISO) and by utilities in recent planning processes (e.g., Georgia Power, NV
Energy, Portland General Electric, Public Service Company of Colorado, Public Service Company of
New Mexico, Sacramento Municipal Utility District, Georgia Power, Public Service Company of New
Mexico).
In this IRP, Nova Scotia Power utilized ELCC values for all resources based on the pre-IRP planning
reserve margin and capacity study, incorporating updated assumptions where required. The ELCC
values are calculated using E3’s loss of load probability model, RECAP, by removing the resources
from the system first then adding the “perfect” dispatchable resource until the system returns to its
original level of reliability. The quantity of perfective dispatchable resources required to return the
system to the original level of reliability is the ELCC of the resources. ELCC curves for new dispatch
limited resources can be found in the IRP Assumptions. Additional details on the ELCC analysis
completed can be found in the pre-IRP Planning Reserve Margin and Capacity Value Study25.
25 https://nsuarb.novascotia.ca/ Matter M08929, Exhibit N-8, Final Pre-IRP Report, updated November 1, 2019, filed May 22, 2020, pages 198-282.
Nova Scotia Power 2020 IRP42
3.1.3 Ancillary Grid Services and Variable Renewable Energy Integration
The Nova Scotia Power system, like all electric power systems, requires various ancillary grid services
including ramping and load-following reserves, reactive power support, voltage control, and inertial
response in order to reliably deliver electricity to customers. In the past, these services were generally
provided inherently by thermal and hydro generators along with firm capacity and energy supply.
Since this IRP models the retirement of many baseload thermal generators in Nova Scotia, including
all coal-fired units, alternate sources of these essential services are now required. This leads to a need
to model some of these requirements more explicitly than has been done in previous IRPs.
Ancillary grid service requirements can limit the ability to integrate high levels of non-synchronous,
or inverter-based, generation on the power system. These are generation sources which connect to
the electrical grid via power electronics rather than the traditional large, synchronous generators
installed in hydro and thermal plants. These non-synchronous generators have not historically
provided significant quantities of ancillary grid services; this is changing as new technology develops
and as non-synchronous generation penetration increases globally. Factors such as power system size
and level of demand as well as presence of interconnections with neighboring systems influence the
requirements for ancillary grid services and ability to integrate inverter-based generation. Limiting
constraints include the ability of a power system to export excess power to neighboring systems
and the ability of the system to maintain stability in an islanded mode in the event of the loss of AC
interconnections at various levels of energy imports.
The ancillary grid services listed below have been identified as those that can be directly addressed
in the IRP model to facilitate modeling additional non-synchronous generation while maintaining
stable and secure operation of the power system. The provision of ancillary grid services (including
operating reserves) is co-optimized with generation dispatch in the capacity expansion and production
cost models to minimize total cost to customers.
1. Regulation reserve and net load-following capabilities
2. Synchronous Inertia
Other ancillary grid services, such as system strength and voltage support, are not as well suited to
modeling directly in a capacity expansion / production cost simulation. These requirements have been
modeled via integration requirements for various penetrations of variable renewable generation; at
lower penetrations, multiple options are available to satisfy these requirements, allowing the model
to optimize resource selection based on cost and performance. The sections that follow describe how
each of these requirements has been modeled in this IRP.

Nova Scotia Power 2020 IRP 43
26 https://nsuarb.novascotia.ca/ Matter M08929, Exhibit N-8, PSC Nova Scotia Power Stability Study for Renewable Integration, July 24, 2019, page
365-434 of 652.
3.1.3.1 Regulation Reserve and Net Load Following Capabilities
Regulation reserve is defined in this IRP as operating reserves which are available to respond
quickly to changes in system net load, including wind ramping. Incremental quantities of reserve
will be required as variable generation increases in order to manage the increased variability and
uncertainty in net load. As part of the Renewables Stability Study, four years of historical wind data
was analyzed to determine variability.26 The 5-minute net load data was compiled, and the 3-sigma
approach was used determine the additional ramping reserve requirements beyond the capabilities
provided by the current generation fleet.
For the purpose of IRP modeling, new inverter-based generation will be linked to a requirement for
sufficient fast-acting generation to satisfy the ramping reserve constraint. In addition, based on
participant feedback through the IRP process, Nova Scotia Power added the ability for new wind
generation to provide ramp down reserve service to the PLEXOS model prior to completion of the
Final Portfolio Study.
3.1.3.2 Synchronous Inertia
Inertial Response is a key property of a power system which helps to ensure reliability. It is the ability
of synchronous generators to release kinetic energy stored in their rotating generators in response
to a drop in grid frequency, triggered by a system contingency such as a generator or line outage.
This kinetic energy slows the rate of change of frequency and allows other response actions, such
as primary frequency response on generator controls, to respond and stabilize the frequency before
under-frequency load shedding schemes are triggered.
Replacing the current fleet of large coal-fired synchronous generators with inverter-based and
smaller gas turbine generators will cause a significant reduction in the available synchronous
inertia of the system, depending on current dispatch. To offset this, the Nova Scotia Power system
must be reliably synchronized with neighboring utilities through AC interties and/or must adopt
local mitigation options to maintain inertia required to resist sharp declining of system frequency
following potential system contingencies.
In previous IRPs and system studies, Nova Scotia Power modeled this requirement as a constraint on
system dispatch, enforcing a minimum number of thermal generating units that must always be online
to maintain system reliability. The pre-IRP Renewables Stability Study emphasized the need for a
more general approach to quantifying synchronized inertia requirements by using the total aggregate
online kinetic energy as a measure instead of minimum unit criteria. In response,

Nova Scotia Power 2020 IRP44
Nova Scotia Power developed new custom constraints within its PLEXOS model to enforce a minimum
inertia requirement, which could be met from a variety of sources including synchronized generators,
synchronous condensers, and transmission interconnections to neighbouring jurisdictions.
The same pre-IRP study established a system inertia constraint via transient stability analysis which
recommended the equivalent of three thermal units as the limit for online inertia of 2766 MW.sec.
Steady-state operation will require an additional machine to provide for the probability that one
machine could trip at any time, leaving a minimum of three units. This was modeled as an additional
500 MW.sec of inertia requirement, resulting in a steady state constraint of a minimum of 3266
MW.sec of synchronous inertia which will be required for steady-state operation.
Some IRP participants felt that this study was more restrictive than necessary, and so Nova Scotia
Power completed several sensitivity cases examining alternate inertia constraints, as well as reduced
inertia provision from the Reliability Tie transmission interconnection. Please see Section 6.8 for
further details on these sensitivity analyses.
Based on feedback from IRP participants, Nova Scotia Power has identified additional services which
could be validated via system stability studies and then added to the PLEXOS models going forward
to further advance wind integration and capacity expansion modeling; these include Fast Frequency
Response and dynamic synchronized inertia constraints. Nova Scotia Power has added studies to
develop these assumptions to the IRP Action Plan and Roadmap.
3.1.3.3 Variable Renewable Integration Requirements
In addition to detailing the specific synchronous inertia and reserve requirements described above,
the Stability Study for Renewable Integration looked at available options to enable wind integration
beyond the current approximately 600 MW nameplate capacity.
First, the study confirmed that the system remains stable without additional mitigation / integration
requirements with an incremental 100 MW of wind. The study then identified two options, both of
which were individually shown to integrate an additional 400 MW of inverter-based generation
(modeled as wind):
• Reliability Tie Option: A second 345 KV AC tie between Onslow NS and Salisbury NB
• Domestic Mitigation Option: A 200 MVA synchronous condenser and 200 MW grid-scale
battery. For IRP modeling purposes, this requirement was linearized so that it could be added in
parallel with smaller wind additions.

Nova Scotia Power 2020 IRP 45
In addition to these key recommendations from the Renewables Stability Study, which were studied at
a Low Electrification level, Nova Scotia Power recognizes that load growth is an effective tool for wind
integration and so developed assumptions that allowed for additional wind integration at the Mid and
High electrification levels.
Throughout the IRP process, participants have shown significant interest in offering more wind
resources to the model than the quantities recommended in the stability report. Nova Scotia Power
has responded to these requests by allowing the Reliability and Domestic Integration options to be
selected in parallel, although this was not tested in the stability study. The incremental wind quantities
offered to the model via different integration options and at different levels of electrification are
compiled in Figure 15.
Figure 15. Integration Options for Incremental Wind
*Local Integration requirements to be determined via specific System Impact Studies
Incremental Wind Available (MW) by
Electrification Level
No Integration Requirements* Reliability Tie
Domestic Integration*
(Batteries + Sync. Condenser)
Total Incremental Wind Available
Low Electrification 100 400 400 900
Mid Electrification 100 500 500 1100
High Electrification 100 600 600 1300
Nova Scotia Power notes that any resource plans which go beyond the findings of the pre-IRP
Renewables Stability Study will require further analysis to confirm they can be operated reliably.
Fortunately, these penetrations generally occur late in the IRP planning horizon, so there is time for
technology to continue to develop and for additional studies to be completed. Nova Scotia Power has
addressed these requirements in its Action Plan and Roadmap.

Nova Scotia Power 2020 IRP46
3.2 Maintaining Affordability
As reflected in the Terms of Reference for this IRP, in addition to the traditional metric of
minimization of cumulative present value of annual long-term revenue requirements over the 25-
year planning horizon, it was agreed that for the 2020 IRP, a number of other metrics were of
increasing importance to evaluate the outcomes of the IRP modeling results, including the magnitude
and timing of electricity rate effects. As discussed further in the section 5.3.4, the magnitude and
timing of electricity rate effects is an important metric for the 2020 IRP analysis because this
IRP is evaluating disparate load levels through the Electrification, DSM and DER scenarios being
considered. As a result, the lowest cumulative present value of annual revenue requirements cannot
be understood to be an absolute measure of lowest cost to customers as higher cost systems are
needed to serve a higher system load, but those costs are recovered via additional sales; similarly,
lower cost systems can be used to serve lower system load (for example, as a result of DER
penetration), but those costs must be recovered over fewer sales. Understanding affordability in this
way assists with understanding the relative costs recovered by customers through rates of higher
and lower load systems.
IRP assumptions are inherently uncertain, and the degree of uncertainty grows as one moves further
out into the planning horizon. As a result, it is important to appreciate the degree to which the net
present value analysis may include biases, associated with higher or lower degrees of value projected
to occur in the outer years of the planning horizon. To assist with understanding these risks, Nova
Scotia Power has provided analysis for all plans to show the relative rate impacts over a 10-year
horizon in addition to those calculated over the 25-year planning horizon (both with and without end
effects).
3.3 Supplying Clean Energy
Nova Scotia Power is working to increase the share of clean and renewable energy on the Nova
Scotia Power system and has incorporated significant emissions reductions targets into this IRP that
demonstrate that commitment. In addition, Nova Scotia Power is required to meet a wide variety
of standards and regulations related to air emissions and renewable energy. Key factors in the IRP
modeling process are discussed in this section, and additional information is available in the IRP Final
Assumptions.27
3.3.1 Air Emission Legislation And Regulation
There are several different sources of air emission regulations which apply to Nova Scotia Power’s
operations. The Nova Scotia Greenhouse Gas Emissions Regulations28 specify GHG emission caps for
2010-2030, as outlined in Figure 16. The net result is a hard cap reduction from 10.0 to 4.5 million tonnes
over that 20-year period, which represents a 55 percent reduction in CO2 release over 20 years.
27 Appendix B.28 Greenhouse Gas Emissions Regulations made under subsection 28(6) and Section 112 of the Environment Act S.N.S. 1994-95, c. 1, O.I.C. 2009-341
(August 14, 2009), N.S. Reg. 260/2009 as amended to O.I.C. 2013-332 (September 10, 2013), N.S. Reg. 305/2013.

Nova Scotia Power 2020 IRP 47
Figure 16. Multi-Year Greenhouse Gas Emission Limits
Period Greenhouse Gas Allowances (Million Tonnes)
2021-2024 27.5 (Total)
2025 6
2026-2029 21.5 (Total)
2030 4.5
The Sustainable Development Goals Act29 sets out Nova Scotia’s goals to achieve province-wide
greenhouse gas emission reductions of at least 10 percent below 1990 levels by 2020, at least 53
percent below 2005 levels by 2030, and “net-zero” by 2050 via balancing greenhouse gas emissions
with greenhouse gas removals and other offsetting measures. The SDGA has received Royal Assent,
but has not yet been proclaimed in force, as this will follow the making of regulations which will further
detail how the SDGA principles will be met. While the specific application of the SDGA to Nova Scotia
Power has yet to be determined, these targets were integrated into the development of emissions
assumptions for IRP modeling purposes. Although 2050 is beyond the end of the IRP planning horizon,
two of the three GHG curves modeled are on a path to achieving net-zero emissions by 2050 (assumed
for modeling purposes as 0.5 MT of emissions or less from electricity generation).
On January 1, 2019 Nova Scotia’s Cap-and-Trade program came into effect. The Cap-and-Trade Program
Regulations28 include the annual free allowances for GHG emissions for Nova Scotia Power. Under the
GHG Cap-and-Trade program, Nova Scotia Power is permitted to purchase a maximum of 5 percent
of the GHG allowances available for sale in any auction. Nova Scotia Power forecasts that the GHG
allowances available for it to purchase will be approximately 0.1 MT annually. Although bilateral GHG
trades among participants are permitted, Nova Scotia Power does not anticipate being able to trade
significant amounts of GHG allowances with other participants. Due to limited GHG allowance purchase
opportunities, GHG credit purchases will not be the primary means of the utility’s GHG compliance
and they are not modeled in the IRP. The primary means of meeting the caps will be a reduction in
generation from the existing coal-fired generating units by replacement with low-emitting sources of
energy.
Similarly, significant uncertainty regarding the depth, liquidity, pricing, and duration of the Cap-and-
Trade market, Nova Scotia Power has not modeled the ability to sell credits into the market as part
of the IRP optimization model so as not to develop resource plans which rely on that revenue for
optimality. Nova Scotia Power’s current assessment is that the revenue stream of this market is not
sufficiently well understood to, in isolation, justify incremental capital spending or programs given
29 Sustainable Development Goals Act, 2019, c. 26 – not proclaimed in force.30 Cap-and-Trade Program Regulations made under Section 112Q of the Environment Act S.N.S. 1994-95, c.1 O.I.C. 2018-294 (effective November 13,
2018), N.S. Reg. 194/2018 amended to O.I.C. 2020-109, N.S. Reg. 48/2020.

Nova Scotia Power 2020 IRP48
the current limited level of market certainty (2022 termination) and practical experience (one auction
conducted to date). Nova Scotia Power believes that participating in the GHG allowance market in the
short term and monitoring developments that could provide long-term certainty sufficient for resource
planning decisions are appropriate next steps as this market continues to develop and evolve.
Although the annual GHG allowances under the GHG Cap-and-Trade program were specified for each
year from 2021 to 2022, as shown in Figure 17, the allowances can be redistributed in a four-year
compliance period between 2019 and 2022 in order to reduce the cost of compliance.
Figure 17. Greenhouse Gas Free Allowances in 2021 and 2022
Year Greenhouse Gas Allowances (Million Tonnes)
2021 5.120
2022 5.087
For thermal facilities that meet the CO2 emissions threshold for Cap-and-Trade (50,000 tonnes
annually), Nova Scotia Power is not required to pay fuel surcharges on fuel consumed for electricity
generation. Fuel consumed for on-site activities via mobile equipment is subject to a fuel surcharge
under the Cap-and-Trade Regulations. As the Port Hawkesbury Biomass facility and the combustion
turbine sites do not meet the emissions threshold, fuel consumed on those sites will be subject to
fuel surcharges under the Cap-and-Trade Regulations.
The Nova Scotia Air Quality Regulations31 specify emission caps for sulphur dioxide (SO2), nitrogen
oxide (NOx), and mercury (Hg) and have been amended to extend from 2020 to 2030. The amended
regulations replace annual limits with multi-year caps for the emissions targets for SO2 and NO
X.
In January 2020 the province introduced amendments to the Air Quality Regulations respecting
the SO2 cap for a three-year period from 2020 to 2022. The regulations also provide local annual
maximums, as well as limits on individual coal units for SO2. The revised emissions requirements are
shown below in Figure 18.
Figure 18. Emission Caps for SO2, NO
x, and Hg
Year SO2
(tonnes)Annual Max SO
2 (tonnes)
NOx (tonnes)
Annual Max NO
x (tonnes)
Hg (kg)
2020 60900 - 14955 - 35
2021-2022 90000 - - 14955 35
2023-2024 68000 - 56000 - 35
2025 28000 - 11500 - 35
2026-2029 104000 28000 44000 11500 35
2030 20000 - 8800 - 30
31 Air Quality Regulations made under Sections 25 and 112 of the Environment Act S.N.S. 1994-95, c. 1 O.I.C. 2005-87 (February 25, 2005, effective
March 1, 2005), N.S. Reg. 28/2005 as amended to O.I.C. 2020-016 (effective January 21, 2020), N.S. Reg. 8/2020.

Nova Scotia Power 2020 IRP 49
32 Effective December 18, 2015, the Electricity Act reduced the maximum nameplate capacity for Net Metering from 1,000 kW to 100 kW. Net
metering applications submitted on or after December 18, 2015 are subject to the new 100 kW limit. The legislation also closed the COMFIT
program to new applications.33 Renewable Electricity Regulations, made under Section 5 of the Electricity Act S.N.S. 2004, c. 25 O.I.C. 2010-381 (effective October 12, 2010), N.S.
Reg. 155/2010 as amended to O.I.C. 2020-147 (effective May 5, 2020), N.S. Reg. 74/2020 s. 5(2A).34 https://www.canada.ca/en/environment-climate-change/news/2017/11/taking_action_tophase-outcoalpower.html35 Vol. 152, No. 7 Canada Gazette Part I Ottawa, Saturday, February 17, 2018.
3.3.2 Renewable Electricity Standards
The Nova Scotia Renewable Electricity Standards (RES) include a renewable energy requirement for
Nova Scotia Power of 25 percent of energy sales starting in 2015, and 40 percent starting in 2020.
In addition to these requirements, Nova Scotia has a Community Feed-in-Tariff (COMFIT) for
community-owned renewable generation projects connected to the distribution system and Net
Metering legislation for individual customer renewable projects.32 The current Net Metering program
was initiated in July 2011, and implementation of the COMFIT program occurred in September 2011.
In 2016, the Province amended the Renewable Electricity Regulations to allow Nova Scotia Power to
include COMFIT projects in its RES compliance planning. It also amended the Regulations to remove
the “must-run” requirement of the Port Hawkesbury biomass generating facility.33
Additional contracted RES-compliant electricity, the Nova Scotia Block, will be delivered via the
Maritime Link. Given the risk of a delay in the delivery of the Nova Scotia Block due to the COVID-19
pandemic and other factors, the Province has permitted Nova Scotia Power to comply with the RES
Regulations through an alternative compliance plan for 2020 through 2022. See Section 3.3.5 for
further information about the Maritime Link.
3.3.3 Coal Phase-Out Regulations
Until the federal coal phase-out policy changes announced in the fall of 2016,34 Nova Scotia
Power’s operation of, and planning for, its coal-fired generation units proceeded consistent with
the provisions of the Agreement on Equivalency of Federal and Nova Scotia Regulations for the
Control of Greenhouse Gas Emissions from Electricity Producers in Nova Scotia (the Equivalency
Agreement). The Equivalency Agreement was finalized in May 2014 and became effective in July
2015, contemporaneous with the effective date for the current federal Reduction of Carbon Dioxide
Emissions from Coal-Fired Generation of Electricity Regulations.
In November 2016, the Province of Nova Scotia announced that an agreement-in-principle had been
reached with the Government of Canada to develop a new equivalency agreement that will enable the
province to move directly from fossil fuels to clean energy sources while allowing Nova Scotia’s coal-
fired plants to operate at some capacity beyond 2030. The need for this new agreement was driven
by amendments proposed by the Federal Government to the Reduction of Carbon Dioxide Emissions
from Coal-fired Generation of Electricity Regulations35. The Equivalency Agreement was renewed by
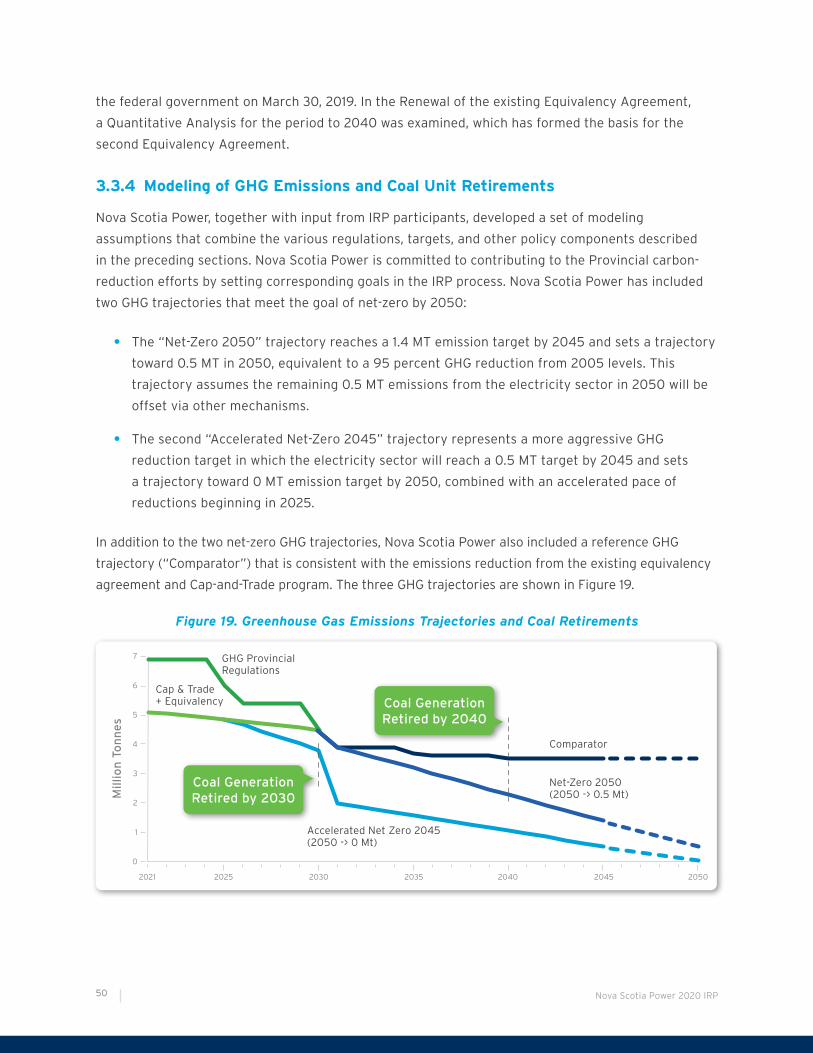
Nova Scotia Power 2020 IRP50
the federal government on March 30, 2019. In the Renewal of the existing Equivalency Agreement,
a Quantitative Analysis for the period to 2040 was examined, which has formed the basis for the
second Equivalency Agreement.
3.3.4 Modeling of GHG Emissions and Coal Unit Retirements
Nova Scotia Power, together with input from IRP participants, developed a set of modeling
assumptions that combine the various regulations, targets, and other policy components described
in the preceding sections. Nova Scotia Power is committed to contributing to the Provincial carbon-
reduction efforts by setting corresponding goals in the IRP process. Nova Scotia Power has included
two GHG trajectories that meet the goal of net-zero by 2050:
• The “Net-Zero 2050” trajectory reaches a 1.4 MT emission target by 2045 and sets a trajectory
toward 0.5 MT in 2050, equivalent to a 95 percent GHG reduction from 2005 levels. This
trajectory assumes the remaining 0.5 MT emissions from the electricity sector in 2050 will be
offset via other mechanisms.
• The second “Accelerated Net-Zero 2045” trajectory represents a more aggressive GHG
reduction target in which the electricity sector will reach a 0.5 MT target by 2045 and sets
a trajectory toward 0 MT emission target by 2050, combined with an accelerated pace of
reductions beginning in 2025.
In addition to the two net-zero GHG trajectories, Nova Scotia Power also included a reference GHG
trajectory (“Comparator”) that is consistent with the emissions reduction from the existing equivalency
agreement and Cap-and-Trade program. The three GHG trajectories are shown in Figure 19.
Figure 19. Greenhouse Gas Emissions Trajectories and Coal Retirements
Mil
lio
n T
on
ne
s
Cap & Trade + Equivalency
GHG Provincial Regulations
Coal Generation Retired by 2040
Accelerated Net Zero 2045 (2050 -> 0 Mt)
Comparator
Net-Zero 2050 (2050 -> 0.5 Mt)
7
6
5
4
3
2
1
0
2050204520402021 2025 2030 2035
Coal Generation Retired by 2030

Nova Scotia Power 2020 IRP 51
In combination with the three GHG trajectories, this IRP models two coal retirement scenarios. The
first scenario requires that all coal units are retired by 2040, which assumes continuation of the
ongoing Equivalency Agreement. The second and more aggressive scenario requires that all coal units
are retired by 2030 which follows the federal government’s Coal-fired Electricity Regulations and
assumes the Equivalency Agreement will not be retained.
The three GHG trajectories are paired with the two coal retirement schedules to produce three levels
for GHG and coal retirement policy; these will be combined with other drivers to produce the IRP
modeling scenarios.
1. Comparator
• Emission trajectory is consistent with the emission reduction from the existing equivalency
agreement and Cap-and-Trade program, reaching 3.5 MT in 2045
• Coal retirement schedule: all coal plants retire by 2040
2. Net-Zero 2050
• Emission trajectory reaches a 1.4 MT GHG emission target in 2045
• Coal retirement schedule: all coal plants retire by 2040
3. Accelerated Net-Zero 2045
• Emission trajectory reaches a 0.5 MT GHG emission target by 2045 with an accelerated pace
of reductions beginning in 2025
• Coal retirement schedule: all coal plants retire by 2030
3.3.5 Maritime Link
Nova Scotia is interconnected with Newfoundland via a 500 MW, +/-200kV DC Maritime Link tie that
was placed into service on January 15, 2018 in preparation for receiving capacity and energy from the
Muskrat Falls Hydro project and the Labrador Island Link DC tie between Labrador and Newfoundland.
The Maritime Link is owned and operated by NSP Maritime Link Inc., a wholly owned subsidiary of
Emera Newfoundland & Labrador.
On March 27, 2020 Nalcor Energy (Nalcor) announced that it temporarily paused construction
activities at the Muskrat Falls project site in response to the COVID-19 pandemic.36 Construction and
commissioning of the Muskrat Falls hydro project resumed on May 30, 2020.
The IRP has assumed full energy and capacity availability from Muskrat Falls starting January 1, 2021.
While the actual in-service date is currently understood to be delayed to later in 2021, this delay is not
material from a long-term resource planning perspective and is not expected to significantly affect
the optimized model results over the IRP planning horizon.
36 https://muskratfalls.nalcorenergy.com/march-27-2020-covid-19-update-from-nalcor-on-the-muskrat-falls-project/

Nova Scotia Power 2020 IRP52
3.3.6 Economy-Wide Decarbonization
As the Province’s primary electricity provider, Nova Scotia Power recognizes that it must play a
critical role in enabling the transition to a low-carbon economy, including decarbonizing its generation
fleet, supporting energy efficiency and conservation, and enabling electrification. To better
understand the scope and scale of emission reduction measures required to meet these climate goals,
Nova Scotia Power commissioned E3 to perform an independent analysis of strategies to achieve
long-term, province-wide GHG reductions, with a focus on electricity, buildings, and transportation
sectors.
E3’s modeling approach for this project relied on its deep decarbonization scenario tool, PATHWAYS.
PATHWAYS is an economic, energy, and GHG emissions accounting tool. E3 developed a PATHWAYS
model customized for Nova Scotia. The Deep Decarbonization Pathways report modeled a reference
(business as usual) scenario along with five other scenarios that assess deep decarbonization via
varying levels of electrification.
Key conclusions from the Deep Decarbonization Pathways report include:
• Synergistic action is needed across all sectors to achieve deep decarbonization
• Reaching 80 percent GHG reductions, let alone net-zero emissions, by 2050 is challenging
and not a given result
• The initial stages of that transformation have begun, but need to be accelerated
• Low-carbon electricity is essential to achieving decarbonization by enabling emissions
reductions in the electricity sector as well as complementary reductions in transportation and
buildings
• The electricity sector has already reduced emissions by more than 30 percent relative to
2005 levels
• Maintaining this momentum requires continuing to integrate low-carbon resources, ensuring
reliability and affordability, and allowing Nova Scotia Power to meet existing load and new
load growth without emitting more carbon
• Low-carbon electricity is not enough to achieve 80 percent economy-wide reductions
• All mitigation scenarios modeled, while leveraging electrification and low-carbon electricity,
require additional measures and actions such as energy efficiency and zero-carbon fuels

Nova Scotia Power 2020 IRP 53
• Long lifetimes require early action
• Meeting 2050 goals may require measures to increase early adoption of electric or low-
emissions infrastructure, such as public charging infrastructure to enable electric vehicle
adoption
• Building electrification is dependent on reducing costs and enhancing incentives, which may be
facilitated by the utility and the province
• Consider rates, incentives, and infrastructure buildout to allow for consumer adoption
• Getting to net-zero will be an even greater challenge, requiring more direct reductions, and/or
carbon removal technologies or carbon offsets
Figure 20 shows the pathway for economy-wide decarbonization in the High Electrification scenarios.
Additional detail on how the information from the Deep Decarbonization Pathways report was
incorporated into the IRP load forecast assumptions is provided in Section 4.1.2.
Figure 20. Milestones for Economy-Wide Decarbonization in High Electrification Scenario
Mil
lio
n T
on
ne
s C
O2e
0
5
10
15
20
25
2050204020302000 2010 2020
Increase sales of efficient appliances, LEDs, heat pump space heaters and water heaters
Begin ramping up sales of electric vehicles (EVs) for light duty vehicles (LDVs)
*Electric sector emissions reductions relative to 2005 (10.7 MMT)
93% sales of heat pumps50% sales of efficient building shells
60% sales of EVs for LDVs150K EVs on the road
40% sales of EVs for MDVs20% sales of EVs for HDVs
~50% emission reduction in electric sector*
100% sales of EVs for LDVs
80% sales of EVs for MDVs60% sales of EVs for HDVs
~100% sales of heat pumps & efficient building shells
590K EVs on the road
~80% emission reduction in electric sector*
Nova Scotia Power 2020 IRP54
4.1 Load Forecast
A key input to Nova Scotia Power’s IRP process is the load forecast. In this IRP, Nova Scotia Power
enhanced the load forecast methodology to incorporate uncertainty from potential increased economy-
wide electrification as well as customer adoption of distributed technologies. The load forecast consists
of the following components:
• Base Load Forecast: the long-term outlook for energy and peak demand builds on the “Base
Load Forecast” from Nova Scotia Power’s annual Load Forecast Report, as filed with the
NSUARB in 2019.37 The Base Load Forecast incorporates a wide range of assumptions, including
the Conference Board of Canada economic growth forecast, seasonal and annual weather
forecasts, and a conservative estimate for electric vehicle (EV) penetration based on Electric
Mobility Canada’s growth model.
• Electrification: the increase in load from building and transportation electrification is included
in the load forecast. Nova Scotia Power developed three electrification scenarios (Low, Mid, and
High) based on the E3 Deep Decarbonization Pathways report. For each scenario, the resulting
electrification load impacts are layered onto the Base Load Forecast.
• Demand Side Management (DSM): energy efficiency-based DSM alters the Base Load
Forecast. E1 produced four DSM scenarios in the pre-IRP DSM Potential Study. The Base,
Low, Mid, and Maximum achievable scenarios represent the various futures in which energy
efficiency measures achieve different potential levels of load reduction.
• Distributed Energy Resources (DER): customer adoption of distributed solar photovoltaic
(PV) systems reduces the overall system load. The Base Load Forecast includes existing
DER and some near-term growth to capture DER currently in contracting and development
stages. Significant additional DER generation is included in several modeling scenarios and
sensitivities.
37 https://nsuarb.novascotia.ca/ Matter M09191, Nova Scotia Power Inc., 2019 Load Forecast Report, April 30, 2019.
4 LOADS AND RESOURCES

Nova Scotia Power 2020 IRP 55
Nova Scotia Power created various combinations of these four elements to create the load forecasts
for the capacity expansion models. In addition, Nova Scotia Power developed a COVID-19 sensitivity to
explore potential impacts from the ongoing COVID-19 pandemic, which is discussed further in section
4.1.5. Figure 21 shows the steps of the load forecasting process.
Figure 21. IRP Load Forecast Development
2019 NSP Filed Load Forecast
(No New DSM)
2020-2022 Contracted
DSM
PATHWAYS Load Drivers
DSM Potential Study
Scenarios
4.1.1 Base Load Forecast
The Base Load Forecast relies on demographic and economic indicators (e.g. population and economic
growth), historical sales data, weather variables (e.g. cooling degree days and heating degree days), and
other factors. Details on the Base Load Forecast are available in Nova Scotia Power’s 2019 Load Forecast
Report.
Nova Scotia Power’s largest customer is Port Hawkesbury Paper LP (PHP), representing approximately
10 percent of Nova Scotia Power’s total annual energy sales. Between 2013 and 2019, PHP received
service under Nova Scotia Power’s Load Retention Tariff. The service term for PHP under the Load
Retention Tariff ended on December 31, 2019. Effective January 1, 2020 PHP takes service under the
Extra Large Industrial Active Demand Control (ELIADC) Tariff. The ELIADC Tariff is a new rate that
adjusts annually and has an initial term of 2020-2023. Active Demand Control (ADC) service is the
defining feature of the new Tariff. Under ADC, Nova Scotia Power can direct PHP to decrease or increase
its load in response to system conditions and costs, to the benefit of the system and therefore all
customers. Savings achieved from ADC are shared through the terms of the Tariff, with 25 percent of
any savings credited to PHP, and the remaining 75 percent of savings credited to Nova Scotia Power
customers. The new Tariff must provide a minimum of $4/MWh toward fixed cost recovery.
The NSUARB found that the primary element of the ELIADC is its functionality as a demand response
rate in that the fundamental behaviour of the Tariff serves to provide Nova Scotia Power with a
significant tool in the management of its entire system load. This is a potentially significant benefit
because the demand flexibility acts like an additional generator in Nova Scotia Power’s generation fleet.
As such, the Nova Scotia Power System Operator can use the ADC component of the Tariff to more
effectively manage Nova Scotia Power’s system load and reduce variable costs for all customers. The
NSUARB found that this benefit is significant in terms of today’s more complex generation mix, including
significant renewable energy on the system.38
38 https://nsuarb.novascotia.ca/ M09420; 2020 NSUARB 44; Application by Nova Scotia Power Incorporated for approval of an Extra Large Industrial
Active Demand Control (ELIADC) Tariff under which Port Hawkesbury Paper LP will take electric service from NS Power: Decision, March 26, 2020,
para 30.

Nova Scotia Power 2020 IRP56
39 Customers that take service under the Shore Power Tariff or the Large Industrial Interruptible Rider.
To reflect the nature of the ADC profile within both the load forecast and the IRP model, Nova Scotia
Power modeled PHP’s load profile separately in the PLEXOS model, using an hourly shape derived
from historical data and matched to the base load shape. This isolates PHP’s load from other load
modifications used in the IRP to capture elements such as electrification level, DSM profile, and
increased penetration of DERs. In addition, Nova Scotia Power shaped PHP’s load, shifting load away
from periods of system peak demand and toward periods of lower demand, on both an hourly and a
seasonal basis, emulating the behaviour anticipated under the ELIADC Tariff.
Under the ELIADC Tariff, in addition to the ADC provisions, PHP maintains its status as a Priority
Interruptible customer, enabling Nova Scotia Power to interrupt PHP on 10 minute’s notice for the
purposes of system security. As such, PHP and Nova Scotia Power’s other interruptible customers39 do
not contribute to Nova Scotia Power’s firm peak load and are not included in the firm peak load demand
forecast in the IRP. As a result, these customers do not impact capacity planning requirements in the
long-term resource plans.
4.1.2 Electrification
The electrification load component is based on the range of electric load trajectories captured in
the Deep Decarbonization Pathways report, which assessed the potential impact of economy-wide
decarbonization on the electricity sector in Nova Scotia. Section 3.3.6 and the Deep Decarbonization
Pathways report contain additional information on the methodology used to project the decarbonization
of the transportation and heating sectors and estimate the load impact of electrification scenarios in
particular.
Nova Scotia Power developed three electrification levels for use in the IRP scenarios:
• Low Electrification represents the 2019 Load Forecast as filed with the NSUARB in April 2019
with no further modification.
• Mid Electrification represents the 2019 Load Forecast, adjusted to reflect the incremental
load anticipated due to partial electrification of buildings and vehicles as indicated in E3’s
“Moderate Electrification” Deep Decarbonization Pathways scenario.
• High Electrification represents the 2019 Load Forecast, adjusted to reflect the incremental load
anticipated due to broad electrification of buildings and transportation as indicated in E3’s
“High Electrification” Deep Decarbonization Pathways scenario.
The economy-wide assumptions underlying each electrification scenario are summarized in Figure 22.
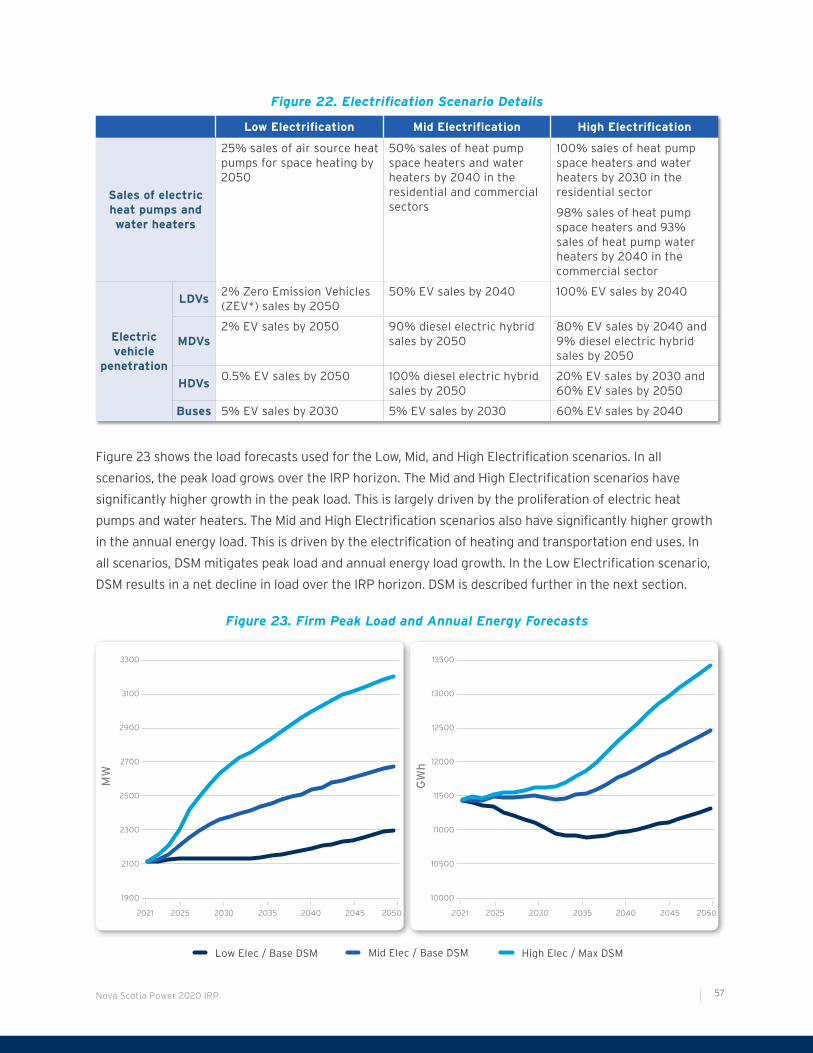
Nova Scotia Power 2020 IRP 57
Figure 22. Electrification Scenario Details
Low Electrification Mid Electrification High Electrification
Sales of electric heat pumps and water heaters
25% sales of air source heat pumps for space heating by 2050
50% sales of heat pump space heaters and water heaters by 2040 in the residential and commercial sectors
100% sales of heat pump space heaters and water heaters by 2030 in the residential sector
98% sales of heat pump space heaters and 93% sales of heat pump water heaters by 2040 in the commercial sector
Electric vehicle
penetration
LDVs2% Zero Emission Vehicles (ZEV*) sales by 2050
50% EV sales by 2040 100% EV sales by 2040
MDVs2% EV sales by 2050 90% diesel electric hybrid
sales by 205080% EV sales by 2040 and 9% diesel electric hybrid sales by 2050
HDVs0.5% EV sales by 2050 100% diesel electric hybrid
sales by 205020% EV sales by 2030 and 60% EV sales by 2050
Buses 5% EV sales by 2030 5% EV sales by 2030 60% EV sales by 2040
Figure 23 shows the load forecasts used for the Low, Mid, and High Electrification scenarios. In all
scenarios, the peak load grows over the IRP horizon. The Mid and High Electrification scenarios have
significantly higher growth in the peak load. This is largely driven by the proliferation of electric heat
pumps and water heaters. The Mid and High Electrification scenarios also have significantly higher growth
in the annual energy load. This is driven by the electrification of heating and transportation end uses. In
all scenarios, DSM mitigates peak load and annual energy load growth. In the Low Electrification scenario,
DSM results in a net decline in load over the IRP horizon. DSM is described further in the next section.
Figure 23. Firm Peak Load and Annual Energy Forecasts
MW
GW
h
3300
3100
2900
2700
2500
2300
2100
1900
2050204520402021 2025 2030 2035
13500
13000
12500
12000
11500
11000
10500
10000
2050204520402021 2025 2030 2035
Low Elec / Base DSM Mid Elec / Base DSM High Elec / Max DSM

Nova Scotia Power 2020 IRP58
4.1.3 Demand Side Management
Demand Side Management (DSM) is an important component of the IRP modeling process, as the
decision to pursue various potential levels of DSM has a significant impact on the future load required
to be served by supply-side resources, and on future DSM-related costs to be borne by electricity
customers. DSM reduces both energy and peak demand requirements on the electricity system; it
can benefit customers through bill savings and benefit the electricity system by reducing the need to
add new resources to meet both energy and peak demand needs. One of the outcomes of the IRP is
to determine the most economic range of DSM programs to be pursued in future DSM procurement
processes.
Nova Scotia Power has incorporated the impact of these considerations in its IRP load development
approach. EfficiencyOne (E1) developed four potential DSM scenarios in its 2019 DSM Potential Study.
The Low, Base, Mid, and Maximum Achievable DSM profiles represent the various programs in which
the energy efficiency measures reach different potential levels and have different associated program
administrator costs. All four of these profiles were developed by Nova Scotia Power into modeling
assumptions that can be combined with other policy drivers to create modeling scenarios.
Nova Scotia Power engaged directly with E1 and its consultants on a number of occasions throughout
the IRP process to review the modeling approach for DSM and to confirm appropriate treatment
of the Potential Study inputs. Nova Scotia Power and E1 also collaborated to establish the list of
DSM sensitivities to analyze. The DSM programs developed in the Potential Study did not explicitly
contemplate the Mid and High electrification levels being modeled in this IRP; as a result, it is possible
that incremental levels of DSM may be achievable under those load scenarios. This potential may be
tempered by the assumption that new technology installed as part of economy-wide decarbonization
and electrification programs is energy efficient in nature (e.g. cold climate heat pumps).
An output of the IRP will be avoided costs of capacity and energy that can be used to evaluate future
DSM programs and individual DSM measures. These will be calculated against the resource plan
designated as the Reference Plan, as defined in the IRP Terms of Reference. This calculation will be
completed after the conclusion of the IRP Process.
In addition to the avoided costs for capacity and energy, DSM can also lead to cost savings on the
Transmission & Distribution system. These costs are not easily captured in a production cost simulation
and so are not calculated directly from the IRP model. Avoided T&D cost calculation methodologies are
being updated separately in consultation with stakeholders via the DSM Advisory Group.

Nova Scotia Power 2020 IRP 59
40 https://nsuarb.novascotia.ca/ M09191, Nova Scotia Power Inc., 2019 Load Forecast Report (April 30, 2019). Page 31 cites the Nova Scotia
Residential Solar Market Outlook and Labour Force Study Final Report - April 2019 prepared by Dunsky Energy Consulting. https://www.cansia.ca/
uploads/7/2/5/1/72513707/cansia_nova_scotia_residential_solar_market_outlook_and_labor_force_study_-_final_report__2019-04-09_.pdf
4.1.4 Distributed Energy Resources
The potential for customer adoption of Distributed Energy Resources (DER), such as rooftop solar PV, is
taken into consideration in the IRP modeling. Distributed Energy Resources are not offered to the model
as a supply-side option but are examined via load modification scenarios.
Nova Scotia Power’s base load forecast includes a forecast for ongoing, moderate adoption of
DER, consistent with current market activity as modeled in the supporting study by Dunsky Energy
Consulting.40 Nova Scotia Power also examines a “Distributed Resources” resource strategy which
assumes a high uptake of DER. In this scenario, customer solar PV adoption reaches approximately 820
MW by 2030 and approximately 1300 MW of installed capacity by 2045.
The costs of DER are not included in the IRP NPV and relative rate impact metrics as they are not
assumed to be utility costs. However, Nova Scotia Power has estimated a range of costs for these
resources, based on the costs developed for the IRP Assumptions, and believes that it is important to
consider these customer costs when evaluating the results of the Distributed Resources scenarios.
4.1.5 COVID-19 Impacts
The COVID-19 pandemic began affecting Nova Scotia in March 2020 during the Resource Screening
and Initial Portfolio Study phases of the IRP process. Based on the anticipated potential impacts of
the pandemic, and on input from several IRP participants, Nova Scotia Power developed a COVID-19
load sensitivity to test the potential effects of the pandemic on the optimized resource plans. This
sensitivity assumes a 1 percent reduction in peak demand and a 5 percent reduction in energy in
2021, with both values returning to the original forecast levels by 2026. This sensitivity is only
performed for the Low Electrification load level.
In the months since that assumption was developed, COVID-19 measures have resulted in many
business and institutions temporarily closing or significantly scaling back operations, resulting in
decreased load in the commercial and industrial sectors. This has been partially offset by increased
sales in the residential sector with many people working from home. To date, the impact was greatest
in April and May of 2020 with total electricity sales declining by over 5 percent from forecast, and
this impact has gradually diminished since that time. There are likely to be similar ongoing effects in
the months ahead, but a material long-term impact on electricity sales is not expected.

Nova Scotia Power 2020 IRP60
4.2 Existing Resources
4.2.1 Overview
Nova Scotia Power’s generation portfolio is composed of a mix of fuel and technology types that include
coal, petroleum coke, light and heavy oil, natural gas, biomass, wind, tidal, and hydro. In addition, Nova
Scotia Power purchases energy from independent power producers (IPPs) in the province and imports
power across the Nova Scotia-New Brunswick intertie and the Maritime Link. Figure 24 shows the
installed capacity by generation type, as of 2020.
Figure 24. Installed Capacity by Generation Type
Generation Type Installed Capacity (MW)
Coal/Petcoke 1234
Natural Gas/Heavy Fuel Oil 318
Natural Gas Combined Cycle 144
Diesel Combustion Turbine 231
Hydro 374
Wind 595
Tidal 19
Biomass 43
Other IPP 34
Total 2992
Over the past 10 years, Nova Scotia Power has reduced coal generation and produced more electricity
from renewable resources such as wind and biomass. In 2019, Nova Scotia supplied approximately 18
percent of annual energy demand with wind energy. Starting in 2021, the Maritime Link will provide
153 MW of firm capacity and associated zero-carbon hydro generation from Muskrat Falls, with access
to additional volumes of non-firm market imports. Following the commencement of delivery of the
Maritime Link energy and capacity blocks, Nova Scotia Power will retire one coal unit (Lingan Unit 2, 153
MW). Figure 25 shows Nova Scotia Power’s historical generation for the period 2010-2019, highlighting a
decline in coal generation and increase in renewable sources like wind and biomass.

Nova Scotia Power 2020 IRP 61
41 Appendix J, pages 12-29.42 Appendix J, pages 76-104.
Figure 25. Nova Scotia Power Historical Generation
Non Firm Market Diesel CTs Wind
Biomass Domestic Hydro Gas Coal
Ge
ne
rati
on
(G
Wh
)
8000
10000
12000
6000
4000
2000
0
14000
2010 2012 2014 2016 20182011 2013 2015 2017 2019
4.2.2 Resource Screening
Nova Scotia Power engaged E3 to perform a Resource Screening analysis for existing diesel combustion
turbines and domestic hydro facilities. The goal was to determine whether it would be more economic
to retire or sustain these facilities, based on assumptions consistent with the IRP. Resources that were
determined to be economic were then kept online in all IRP scenarios. This allowed Nova Scotia Power
to significantly reduce model complexity and computation time by narrowing the range of retirement
decisions considered.
E3 utilized its proprietary RESOLVE capacity expansion model to estimate the value of the diesel and
hydro facilities on Nova Scotia Power’s system. RESOLVE adds new resources, retires existing resources,
and dispatches the system to minimize the NPV of revenue requirements while satisfying reliability
targets, decarbonization targets, and other criteria over the planning horizon. The Screening Analysis
methodology utilizes RESOLVE to assess the relative economics of sustaining existing units or retiring
them.
Results of the Screening Analysis are summarized below. Detailed results are available in the Initial
Modeling Results;41 they were also discussed at the July Stakeholder Workshop.42
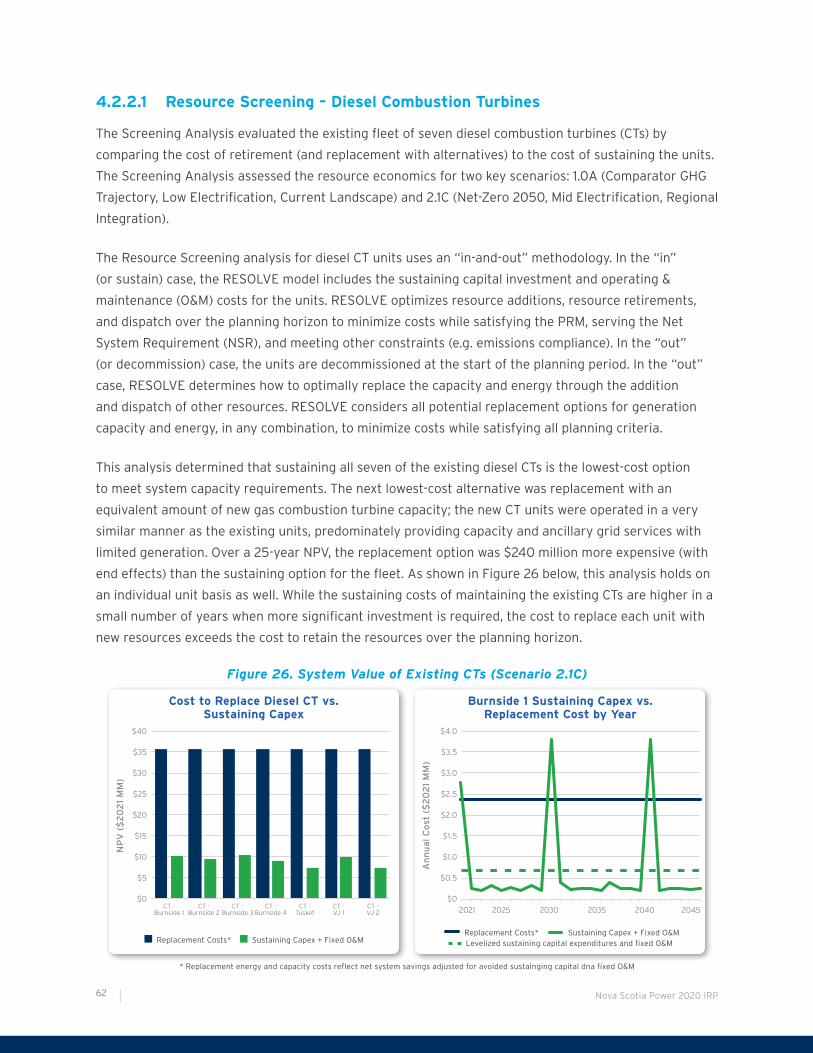
Nova Scotia Power 2020 IRP62
4.2.2.1 Resource Screening – Diesel Combustion Turbines
The Screening Analysis evaluated the existing fleet of seven diesel combustion turbines (CTs) by
comparing the cost of retirement (and replacement with alternatives) to the cost of sustaining the units.
The Screening Analysis assessed the resource economics for two key scenarios: 1.0A (Comparator GHG
Trajectory, Low Electrification, Current Landscape) and 2.1C (Net-Zero 2050, Mid Electrification, Regional
Integration).
The Resource Screening analysis for diesel CT units uses an “in-and-out” methodology. In the “in”
(or sustain) case, the RESOLVE model includes the sustaining capital investment and operating &
maintenance (O&M) costs for the units. RESOLVE optimizes resource additions, resource retirements,
and dispatch over the planning horizon to minimize costs while satisfying the PRM, serving the Net
System Requirement (NSR), and meeting other constraints (e.g. emissions compliance). In the “out”
(or decommission) case, the units are decommissioned at the start of the planning period. In the “out”
case, RESOLVE determines how to optimally replace the capacity and energy through the addition
and dispatch of other resources. RESOLVE considers all potential replacement options for generation
capacity and energy, in any combination, to minimize costs while satisfying all planning criteria.
This analysis determined that sustaining all seven of the existing diesel CTs is the lowest-cost option
to meet system capacity requirements. The next lowest-cost alternative was replacement with an
equivalent amount of new gas combustion turbine capacity; the new CT units were operated in a very
similar manner as the existing units, predominately providing capacity and ancillary grid services with
limited generation. Over a 25-year NPV, the replacement option was $240 million more expensive (with
end effects) than the sustaining option for the fleet. As shown in Figure 26 below, this analysis holds on
an individual unit basis as well. While the sustaining costs of maintaining the existing CTs are higher in a
small number of years when more significant investment is required, the cost to replace each unit with
new resources exceeds the cost to retain the resources over the planning horizon.
Figure 26. System Value of Existing CTs (Scenario 2.1C)
NP
V (
$2
02
1 M
M)
$20
$25
$30
$15
$10
$5
$0
$40
$35
CT - Burnside 2
CT - Burnside 3
CT - Burnside 4
CT - Tusket
CT - VJ 1
CT - VJ 2
CT - Burnside 1
Replacement Costs* Sustaining Capex + Fixed O&M
Cost to Replace Diesel CT vs. Sustaining Capex
An
nu
al
Co
st (
$2
02
1 M
M)
$2.0
$2.5
$3.0
$1.5
$1.0
$0.5
$0
$4.0
$3.5
2040203520252021 2030 2045
Replacement Costs* Sustaining Capex + Fixed O&M Levelized sustaining capital expenditures and fixed O&M
Burnside 1 Sustaining Capex vs. Replacement Cost by Year
* Replacement energy and capacity costs reflect net system savings adjusted for avoided sustainging capital dna fixed O&M

Nova Scotia Power 2020 IRP 63
43 https://nsuarb.novascotia.ca/ M08929, Exhibit N-2, Nova Scotia Power Hydro Asset Study, December 21, 2018.
The Screening Analysis also included an additional set of sensitivities for the Victoria Junction site,
which has two 33 MW diesel CT units. These sensitivities tested a lower PRM, as well as the option to
replace the Victoria Junction units with generation located in the provincial load centre in Halifax. In all
cases, sustaining the existing units was more economic by a significant margin.
The Screening Analysis finds that investment in the continued operation of the diesel CT fleet is the
lowest cost option for customers; these units are sustained and not eligible to retire in the IRP Portfolio
Study phases of the IRP analysis.
4.2.2.2 Resource Screening – Domestic Hydro
The Resource Screening analysis also evaluated the existing fleet of domestic hydro resources. The
methodology followed was generally similar to the Diesel CT screening described in the previous
section. The key modeling inputs for the hydro screening analysis included sustaining capital, O&M, and
decommissioning costs; these inputs came from Nova Scotia Power’s Hydro Asset Study (HAS)43 and
the IRP Final Assumptions. This analysis examined a 40-year horizon, to match the input data from
the HAS and account for the long-lived nature of hydro assets. The Mersey and Wreck Cove systems
were evaluated individually, while Nova Scotia Power’s remaining hydro resources were modeled in two
groups with similar operating characteristics, as shown in Figure 27. The analysis was performed for the
same two key scenarios: 1.0A (Comparator GHG Trajectory, Low Electrification, Current Landscape) and
2.1C (Net-Zero 2050, Mid Electrification, Regional Integration).
Figure 27. Grouping of Hydro Resources for Screening Analysis
RESOLVE Model Group Installed Capacity (MW)
Total Nameplate Capacity (MW)
Hydro Group 1Avon, Nictaux, Paradise, Tusket,
Dickie Brook, Fall River26.5
Hydro Group 2Black River, Lequille, Sissiboo, Bear River,
St Margaret’s, Sheet Harbour92.7
Wreck Cove Wreck Cove 212.0
Mersey Mersey 45.8

Nova Scotia Power 2020 IRP64
As shown in Figure 28, this analysis confirmed that, on an NPV basis, the costs to replace hydro systems
with alternative resources (and decommission the existing hydro assets) exceed the costs to retain the
resources over a 40-year horizon in all cases. This finding holds true under both scenarios considered.
The hydro systems are slightly more valuable under the 2.1C scenario because this scenario follows the
Net-Zero 2050 GHG trajectory, which has more stringent emissions limits; this result highlights the value
of zero-carbon hydro generation under declining emissions caps.
Figure 28. Total Decommissioning Costs of Hydro Assets
Relative to Sustaining Operations (Scenario 2.1C)
Replacement Fixed System Cost Replacement Variable System Cost Decommissioning Costs Sustaining CapEx Fixed O&M
NP
V (
$2
02
1 M
M)
$200
$250
$300
$150
$100
$50
$0
$350
Avon Bear River
Black River
Dickie Brook
Fall River Lequille Nictaux Paradise Sheet
Harbour Sissiboo St. Margaret’s Tusket
$94
$60$72
$84$99
$118$100
$132
$10
$206
$330$344
$21$7 $10 $14 $10
$40 $35$29
$5$13
$48$22
Wreck Cove
NP
V (
$2
02
1 M
M)
$800
$1000
$1200
$600
$400
$200
$0
$1400
Decommissioning Operating
$1185
$189
Mersey
$400
$500
$600
$300
$200
$100
$0
NP
V (
$2
02
1 M
M)
Decommissioning Operating
$529
$398
Of note, the Mersey system will require redevelopment in the near future to ensure it can continue to
operate safely and reliably. The specifics of the redevelopment plan and the business case supporting
this investment will be outlined in a future capital work order and regulatory filing. Given the results of
the Screening Analysis, all key scenarios in the PLEXOS Portfolio Studies assume continued operation of
the Mersey system and account for all associated costs throughout the IRP horizon. Based on
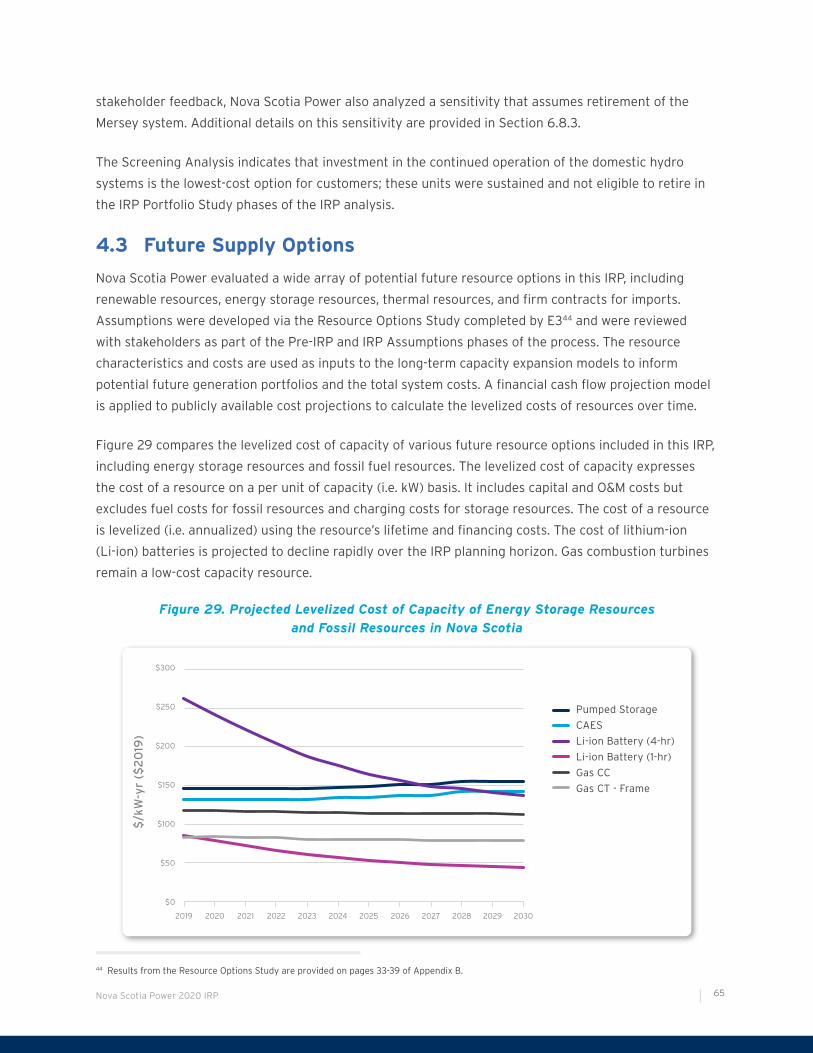
Nova Scotia Power 2020 IRP 65
44 Results from the Resource Options Study are provided on pages 33-39 of Appendix B.
stakeholder feedback, Nova Scotia Power also analyzed a sensitivity that assumes retirement of the
Mersey system. Additional details on this sensitivity are provided in Section 6.8.3.
The Screening Analysis indicates that investment in the continued operation of the domestic hydro
systems is the lowest-cost option for customers; these units were sustained and not eligible to retire in
the IRP Portfolio Study phases of the IRP analysis.
4.3 Future Supply Options
Nova Scotia Power evaluated a wide array of potential future resource options in this IRP, including
renewable resources, energy storage resources, thermal resources, and firm contracts for imports.
Assumptions were developed via the Resource Options Study completed by E344 and were reviewed
with stakeholders as part of the Pre-IRP and IRP Assumptions phases of the process. The resource
characteristics and costs are used as inputs to the long-term capacity expansion models to inform
potential future generation portfolios and the total system costs. A financial cash flow projection model
is applied to publicly available cost projections to calculate the levelized costs of resources over time.
Figure 29 compares the levelized cost of capacity of various future resource options included in this IRP,
including energy storage resources and fossil fuel resources. The levelized cost of capacity expresses
the cost of a resource on a per unit of capacity (i.e. kW) basis. It includes capital and O&M costs but
excludes fuel costs for fossil resources and charging costs for storage resources. The cost of a resource
is levelized (i.e. annualized) using the resource’s lifetime and financing costs. The cost of lithium-ion
(Li-ion) batteries is projected to decline rapidly over the IRP planning horizon. Gas combustion turbines
remain a low-cost capacity resource.
Figure 29. Projected Levelized Cost of Capacity of Energy Storage Resources
and Fossil Resources in Nova Scotia
$/k
W-y
r ($
20
19)
$300
$250
$200
$150
$100
$50
$0
202520242023 20302019 20262020 20272021 20282022 2029
Pumped Storage
CAES
Li-ion Battery (4-hr)
Li-ion Battery (1-hr)
Gas CC
Gas CT - Frame
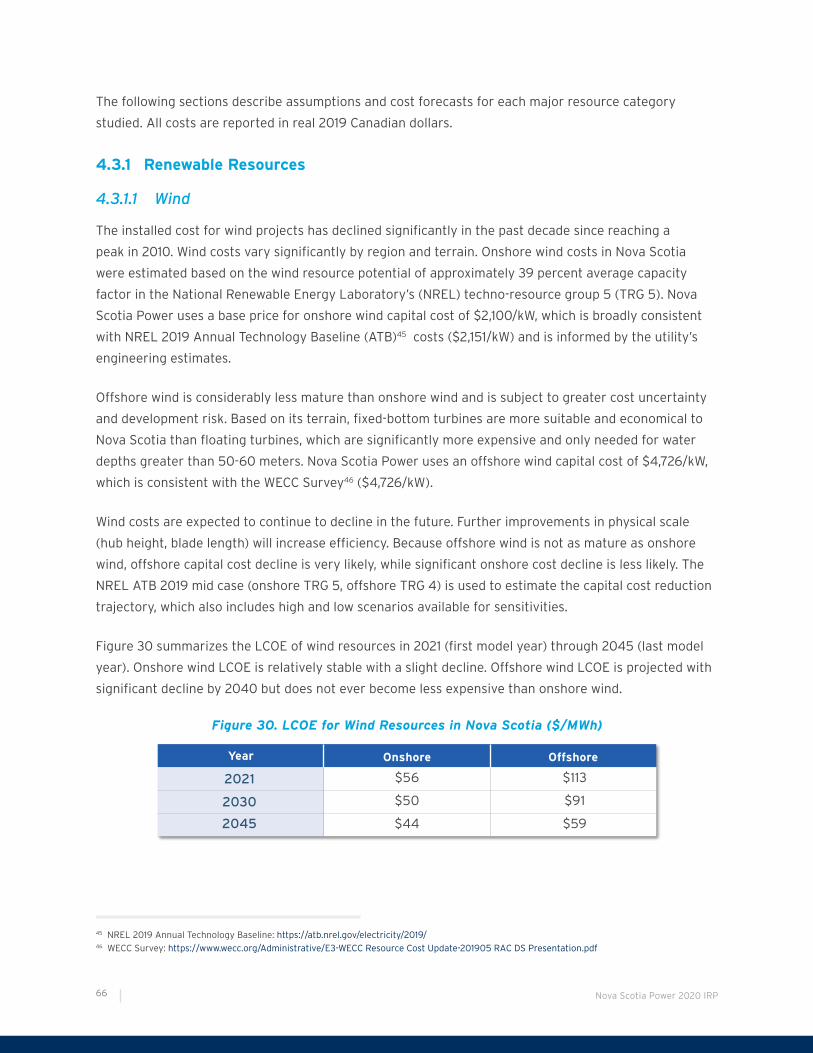
Nova Scotia Power 2020 IRP66
45 NREL 2019 Annual Technology Baseline: https://atb.nrel.gov/electricity/2019/46 WECC Survey: https://www.wecc.org/Administrative/E3-WECC Resource Cost Update-201905 RAC DS Presentation.pdf
The following sections describe assumptions and cost forecasts for each major resource category
studied. All costs are reported in real 2019 Canadian dollars.
4.3.1 Renewable Resources
4.3.1.1 Wind
The installed cost for wind projects has declined significantly in the past decade since reaching a
peak in 2010. Wind costs vary significantly by region and terrain. Onshore wind costs in Nova Scotia
were estimated based on the wind resource potential of approximately 39 percent average capacity
factor in the National Renewable Energy Laboratory’s (NREL) techno-resource group 5 (TRG 5). Nova
Scotia Power uses a base price for onshore wind capital cost of $2,100/kW, which is broadly consistent
with NREL 2019 Annual Technology Baseline (ATB)45 costs ($2,151/kW) and is informed by the utility’s
engineering estimates.
Offshore wind is considerably less mature than onshore wind and is subject to greater cost uncertainty
and development risk. Based on its terrain, fixed-bottom turbines are more suitable and economical to
Nova Scotia than floating turbines, which are significantly more expensive and only needed for water
depths greater than 50-60 meters. Nova Scotia Power uses an offshore wind capital cost of $4,726/kW,
which is consistent with the WECC Survey46 ($4,726/kW).
Wind costs are expected to continue to decline in the future. Further improvements in physical scale
(hub height, blade length) will increase efficiency. Because offshore wind is not as mature as onshore
wind, offshore capital cost decline is very likely, while significant onshore cost decline is less likely. The
NREL ATB 2019 mid case (onshore TRG 5, offshore TRG 4) is used to estimate the capital cost reduction
trajectory, which also includes high and low scenarios available for sensitivities.
Figure 30 summarizes the LCOE of wind resources in 2021 (first model year) through 2045 (last model
year). Onshore wind LCOE is relatively stable with a slight decline. Offshore wind LCOE is projected with
significant decline by 2040 but does not ever become less expensive than onshore wind.
Figure 30. LCOE for Wind Resources in Nova Scotia ($/MWh)
Year Onshore Offshore
2021 $56 $113
2030 $50 $91
2045 $44 $59

Nova Scotia Power 2020 IRP 67
4.3.1.2 Utility-Scale Solar PV
Nova Scotia Power uses utility-scale PV capital costs of $1,800/kW AC, which is broadly consistent with
the WECC Survey ($1,958/kW AC) but adjusted lower per Nova Scotia labor costs, terrain, and other
factors. The PV cost estimate only considers single-axis tracking systems because solar tracking systems
provide increased capacity factor for little to no premium in capital costs.
Future PV capital cost is assumed to continue the current decreasing trend and is estimated to decline
by 20 percent by 2030 and 33 percent by 2045. This cost trend is consistent with the NREL 2019 ATB
(mid case), based on continued declines in module pricing and balance of system costs from the previous
decade. Figure 31 summarizes the LCOE of solar PV through 2045. Solar is relatively expensive in Nova
Scotia given its lower estimated potential capacity factors, especially when compared to wind.
Figure 31. LCOE of Solar PV in Nova Scotia ($/MWh)
Year $/MWh
2021 $89
2030 $77
2045 $65
4.3.1.3 Biomass
Nova Scotia Power estimates that a biomass project will require upfront capital investment costs of
$5,300/kW, based on NREL 2019 ATB ($5,446/kW) but adjusted lower as informed by local engineering
estimates. Figure 32 below summarizes key assumptions for new Biomass generation used in the IRP.
Biomass regulations in Nova Scotia limit the available amount of forecast biomass to 350,000 dry
tonnes per year to contribute to the Renewable Electricity Standard.
Figure 32. Biomass Characteristics
Year 2021 2030 2045
Levelized Capital Cost ($/kW-yr) $434 $438* $421
Heat Rate 13500 Btu/kWh
Variable O&M $7/MWh
* The slight capital cost increase from 2021 to 2030 is due to change in capital cost allowance depreciation schedules according to federal tax law. Upfront costs of biomass projects are assumed to decline slightly (by 9 percent) by 2045.

Nova Scotia Power 2020 IRP68
4.3.1.4 Municipal Solid Waste
Municipal solid waste capital costs are typically location specific. Nova Scotia Power estimates upfront
capital costs of $8,470/kW. Figure 33 below summarizes key assumptions for municipal solid waste
generation used in the IRP.
Figure 33. Municipal Solid Waste Characteristics
Year 2021 2030 2045
Levelized Capital Cost ($/kW-yr) $597 $628* $628
Heat Rate 18000 Btu/kWh
* Slight capital cost increase from 2021 to 2030 is due to change in capital cost allowance depreciation schedules according to federal tax law. Upfront costs of municipal solid waste projects are assumed constant through 2045.
4.3.1.5 Tidal
Nova Scotia Power estimates that a new tidal project will have a capital cost of $10,000/kW. Nova Scotia
has been a global leader in developing tidal power; however, tidal power is still an expensive technology
with limited commercial deployment. Figure 34 below shows the key assumptions for tidal power used in
the IRP.
Figure 34. Tidal Characteristics
Year 2021 2030 2045
Levelized Cost of Energy ($/MWh) $851 $888* $888
Annual Capacity Factor 26%
* Slight capital cost increase from 2021 to 2030 is due to change in capital cost allowance depreciation schedules according to federal tax law. Upfront cost of tidal project is assumed constant through 2045.
4.3.2 Energy Storage Resources
4.3.2.1 Battery Storage
Battery costs vary significantly by system specifications. For modeling purposes, costs are commonly
broken into two categories:
• Costs that scale with power (“capacity”), quoted in $/kW
• Costs that scale with energy (“duration”), quoted in $/kWh
Fixed “capacity” costs – including inverter and interconnection – vary significantly by project. Battery
modules are the largest and best understood component of system costs that scale most linearly
with duration. Longer duration batteries are lower cost per MWh of storage due to spreading of fixed
costs. Cost estimates vary widely due to the early stage of technology and differences in scale and
arrangement. Nova Scotia Power uses the following cost assumption for Li-ion batteries:

Nova Scotia Power 2020 IRP 69
• Costs that scale with power (“capacity”): $310 per kW
• Costs that scale with energy (“duration”): $454 per kWh
The cost estimate for 4-hour storage is at $2,125/kW, which is close to the high end of the Lazard 5.047
range ($1,189 - $2,481 per kW) utilized per local labor costs and other factors.
Figure 35 shows the levelized capacity cost of 1-hour and 4-hour batteries. Short-duration battery
storage is competitive with natural gas plants on an installed capacity basis. A larger decrease in battery
costs is projected by 2030 as the technology matures.
Figure 35. Li-ion Battery Characteristics
Year 2021 2030 2045
1-hr Battery, Levelized Capacity Cost ($/kW-yr)
$72 $45 $38
4-hr Battery, Levelized Capacity Cost ($/kW-yr) $223 $138 $118
Round Trip Efficiency 87%
Extended Warranty 1.5% of total capital cost, annually starting in Year 3
Augmentation Charge 2.7% of “duration” (kWh) cost component, annually
4.3.2.2 Compressed Air Energy Storage
Compressed air energy storage (CAES) costs are highly site-specific and can vary considerably based
on the characteristics of the site (geology, etc.). The lack of recent commercial projects adds to cost
uncertainty. Nova Scotia Power estimates upfront capital project costs of $2,200/kW, which reflects
regional estimates compared to the WECC survey ($2,836/kW).
Fuel cost of natural gas is an additional cost for CAES, and CAES is more competitive for longer duration
storage. CAES is a synchronous generation source and can contribute to system inertia requirements.
Figure 36 below summarizes the assumptions developed for CAES in the IRP.
Figure 36. Compressed Air Energy Storage Characteristics
Year 2021 2030 2045
Levelized Capital Cost ($/kW-yr) $133 $141* $141
Round Trip Efficiency 80%
Hear Rate for Output 4000 Btu/kWh
* Slight capital cost increase from 2021 to 2030 is due to change in capital cost allowance depreciation schedules according to federal tax law. Upfront cost of CAES is assumed constant through 2045.
47 Lazard’s levelized cost of storage analysis – version 5.0: https://www.lazard.com/media/451087/lazards-levelized-cost-of-storage-version-50-vf.pdf

Nova Scotia Power 2020 IRP70
Nova Scotia Power’s IRP assumptions consider four different natural gas technologies for power
generation. The upfront capital cost estimates are consistent with the WECC survey and NREL ATB 2019.
• Combined Cycle: $1,688/kW
• Combustion Turbine – Frame: $1,080/kW
• Combustion Turbine – Aero: $1,755/kW
• Reciprocating Engine: $1,823/kW
Capital costs for new natural gas plants include the several cost components: overnight capital cost,
construction financing and nominal interconnection costs (i.e. a short gen-tie line). O&M costs include:
(1) insurance, taxes, land lease payments, and other fixed costs; (2) annualized large component
replacement costs over the technical life; and (3) scheduled and unscheduled maintenance.
As shown in Figure 37, Combustion Turbines are the lowest-cost source of capacity in each year of the
projection.
Figure 37. New Natural Gas Plant Characteristics
Year Combined CycleCombustion
Turbine –FrameCombustion
Turbine –AeroReciprocating
Engine
Levelized Capital Cost ($/kW-yr)
2021 $116 $83 $123 $138
2030 $112 $79 $118 $140
2045 $108 $77 $113 $140
Variable O&M ($/MWh) $3 $7 $7 $9
Heat Rate (kBtu/kWh) 7200 10160 9830 8520
4.3.3.2 Coal-to-Gas Conversion
Nova Scotia Power has considered three coal units with nearby natural gas supply for coal-to-gas
conversion. Figure 38 shows the capital cost for each of these coal units and Figure 39 shows the coal-
to-gas conversion characteristics. Federal regulations limiting CO2 emissions from natural gas-fired
generation of electricity specify performance standards, which limit the allowable operating life of any
repowered coal unit.
Figure 38. Coal-to-Gas Conversion Capital Cost Assumptions
Coal Unit Capital Cost
Point Tupper Unit 2 $237/kW
Trenton Unit 5 $157/kW
Trenton Unit 6 $148/kW
Trenton Units 5+6 $127/kW

Nova Scotia Power 2020 IRP 71
Figure 39. Coal-to-Gas Conversion Characteristics
Year Point Tupper Unit 2
Trenton Unit 5 Trenton Unit 6Trenton Units
5+6
Levelized Capital Cost ($/kW-yr)
2021 $86 $64 $63 $59
2030 $87 $65 $63 $59
2045 $87 $65 $63 $59
Variable O&M ($/MWh) All Years $1 $2 $2 $2
Heat Rate (Btu/kWh) All Years 11,250 Btu/kWh
4.3.3.3 New Gas Generation with CCS
New combined-cycle natural gas plants with Carbon Capture and Storage (CCS) are also considered in
the IRP. CCS capital costs include the cost of capturing and compressing the CO2, but not delivery and
storage to a storage reservoir or industrial site for use. To account for the latter two cost components,
Nova Scotia Power adds $4.76/MWh48 to variable O&M costs to account for transport and storage costs.
Figure 40 below shows the assumptions used to model NGCC with CCS in the IRP.
Figure 40. Characteristics of New Combined Cycle Natural Gas Plants
with Carbon Capture and Storage
Year 2021 2030 2045
Levelized Capital Cost ($/kW-yr) $249 $232 $214
Variable O&M ($/MWh) $10/MWh
Hear rate for output 7530 Btu/kWh
48 This cost adder assumes $13/ton CO2 transported (Rubin et al, 2015) and 0.36 tons/MWh captured (90 percent capture rate).

Nova Scotia Power 2020 IRP72
4.4 Future Demand Options
New technologies are emerging that allow greater load control and customer response. These demand
response (DR) technologies can affect system operations primarily by changing the timing of electricity
consumption. Rising penetrations of intermittent wind and solar generation have generated renewed
discussion about the functions and value provided by DR technologies. Options considered include
Direct Load Control, curtailment, batteries and EV charging, Critical Peak Pricing, and behavioural
demand response, as illustrated in Figure ES-2 of the DSM Potential Study.49
Three DR profiles were provided to Nova Scotia Power by E1: Low, Base, and High. The DR profiles were
paired with corresponding DSM levels (e.g. the Base DR resource option was paired with the Base DSM
assumption). This pairing of DSM and DR reflects the interactive effects of DSM and DR and was based
on guidance from E1. These DR profiles provide a stream of annual costs and associated MW of available
load reduction over the period 2021-2045, as shown in Figure 41. These profiles represent aggregated
DR programs and include only those programs that passed E1’s cost effectiveness testing.
Figure 41. Demand Response Achievable Potential
MW
Lo
ad
Re
du
ctio
n
120
100
80
60
40
20
0
204520402021 2025 2030 2035
Low Base High
As the programs making up the DR profiles shift load, provide firm capacity, and have operational
constraints (e.g. number of calls per annum, duration of DR event, and energy shifting impacts) DR can
be modeled in the IRP optimization model in the same way as supply-side resources. For each model run,
the applicable DR profile was offered to the model as a resource option, which the model could select if
economic.
Nova Scotia Power offered the DR resource to the model in three models: 2021, 2025 and 2030. For
model years after 2021, the MW capacity and cost profiles were shifted, with the cost profiles being
escalated at the rate of inflation.
49 https://nsuarb.novascotia.ca/ Matter M08929, Exhibit N-1, EfficiencyOne (E1), 2019 DSM Potential Study Report, August 14, 2019, page 3.

Nova Scotia Power 2020 IRP 73
4.5 Regional Integration
Nova Scotia Power has achieved meaningful greenhouse gas emissions reductions in recent years via
domestic infrastructure investments. As the transition to a low-carbon power system continues through
the IRP planning horizon, it may become economic to look to external sources of dispatchable, low-
carbon energy and firm capacity to help meet the requirements of the Nova Scotia system. For this
reason, this IRP explores regional integration options that seek to identify the benefits to Nova Scotia
Power from improved interconnection with neighboring systems.
4.5.1 Existing Transmission Interconnections
Nova Scotia Power has two existing interconnections to neighboring regions: the Maritime Link
connecting Nova Scotia to Newfoundland, and an existing AC interface connecting Nova Scotia to New
Brunswick. Both interconnections are incorporated into the IRP model and scenarios. See Figure 42 for a
map of Nova Scotia Power’s transmission system and major facilities.
The Maritime Link is a 500 MW, +/-200kV HVDC interconnection which was placed in service in January
2018. This interconnection provides access to the committed Maritime Link Base and Supplemental
blocks of energy and capacity, as well as access to additional non-firm market energy. Access to these
capacity and energy resources is modeled in the IRP beginning on January 1, 2021. Lingan Unit 2 is
assumed to be retired on the same date, as its capacity is replaced by the Maritime Link Base Block, and
as a result that unit does not appear in the IRP modeling results.
The AC interface with New Brunswick comprises of one 345 kV line and two 138 kV lines; this interface
has been utilized for many years for a variety of services including economic energy import and
export, balancing services, and reserve sharing. However, due to capacity constraints on this interface,
the ability to import firm energy and capacity from the broader North American grid is currently
very limited. Because the underlying 138 kV interconnection cannot carry the full capacity of the
345 kV line, there are also reliability limits in place when transacting for energy on this interface. In
addition, although not directly captured in the IRP model, there are significant transmission planning
considerations for this single contingency which affect many elements of the Nova Scotia system.
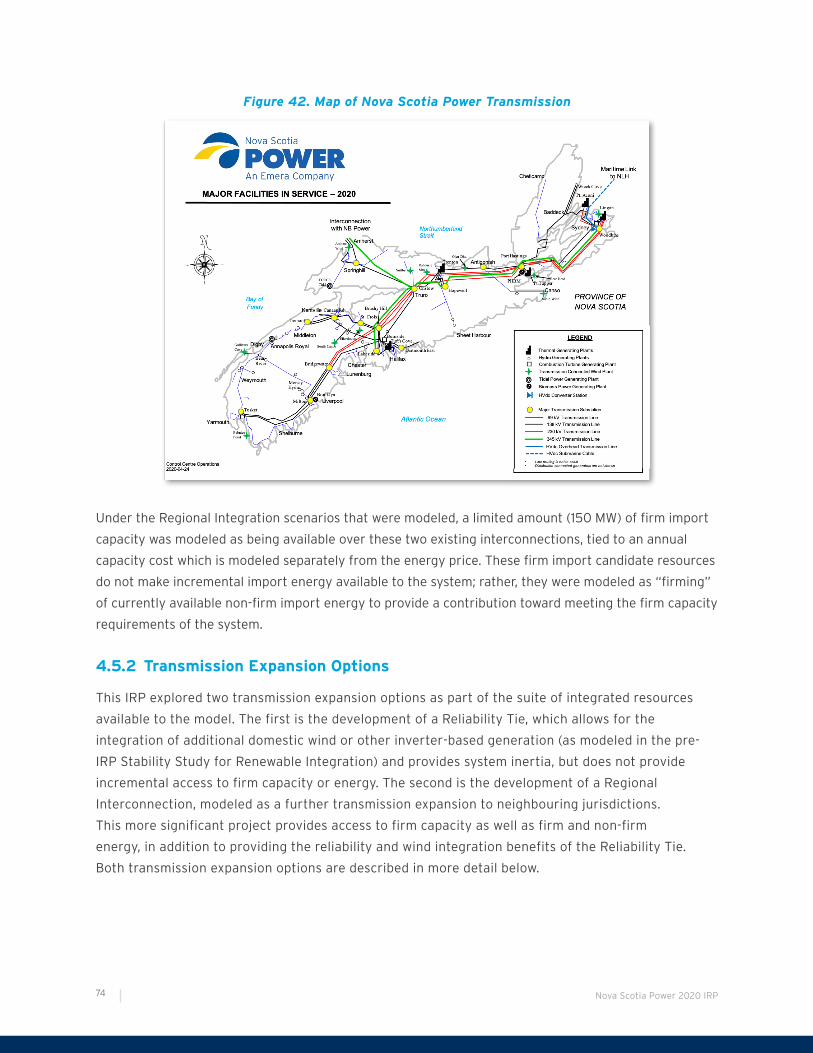
Nova Scotia Power 2020 IRP74
Figure 42. Map of Nova Scotia Power Transmission
Under the Regional Integration scenarios that were modeled, a limited amount (150 MW) of firm import
capacity was modeled as being available over these two existing interconnections, tied to an annual
capacity cost which is modeled separately from the energy price. These firm import candidate resources
do not make incremental import energy available to the system; rather, they were modeled as “firming”
of currently available non-firm import energy to provide a contribution toward meeting the firm capacity
requirements of the system.
4.5.2 Transmission Expansion Options
This IRP explored two transmission expansion options as part of the suite of integrated resources
available to the model. The first is the development of a Reliability Tie, which allows for the
integration of additional domestic wind or other inverter-based generation (as modeled in the pre-
IRP Stability Study for Renewable Integration) and provides system inertia, but does not provide
incremental access to firm capacity or energy. The second is the development of a Regional
Interconnection, modeled as a further transmission expansion to neighbouring jurisdictions.
This more significant project provides access to firm capacity as well as firm and non-firm
energy, in addition to providing the reliability and wind integration benefits of the Reliability Tie.
Both transmission expansion options are described in more detail below.

Nova Scotia Power 2020 IRP 75
4.5.2.1 Reliability Tie
The Reliability Tie comprises development of a new 345 kV AC line between Onslow, Nova Scotia and
Salisbury, New Brunswick. This transmission option was an available resource in all the key scenarios.
During the Pre-IRP phase, Nova Scotia Power engaged Power System Consultants (PSC) to conduct a
System Stability Study50 to assess the ability to integrate additional inverter-based generation on the
Nova Scotia System, particularly expanded wind capacity. This study identified the loss of the existing
single 345 kV line to New Brunswick as a significant contingency for Nova Scotia Power, and determined
that the addition of a second 345 kV line would bring security and operating flexibility to the system and
could enable the integration of an additional 400 MW of variable inverter-based generation. Additional
potential system benefits of the Reliability Tie beyond renewable integration and system inertia are not
analyzed in the IRP model.
This study also found that comparable amounts of wind capacity could be integrated by building both
synchronous condensers and battery storage. These were also provided to the model as candidate
resources, representing an alternate method for new wind development and integration. Modeling
details and key assumptions for these resources are discussed in greater detail in Section 3.1.3.
4.5.2.2 Regional Integration
In addition to the available Reliability Tie, the Regional Integration scenarios add two additional
candidate transmission expansion options: 1) an HVDC line connecting Salisbury, New Brunswick to
Quebec, and 2) a 345 kV AC line from Salisbury, New Brunswick to Coleson Cove, New Brunswick, which
would provide access to the ISO New England power markets. Both are modeled as candidate resources
available starting in 2026,51 and both make available firm capacity as well as additional firm and non-
firm imported energy.
The Regional Interconnection transmission expansion options are modeled to be flexible in terms of
how they can be added to the system. They can be constructed to enter service in the same year as the
Reliability Tie or can be staged from an already constructed Reliability Tie in a future year. In addition,
once the model builds a Regional Interconnection transmission option, the amount of firm capacity
purchased over that interface can vary in 50 MW blocks. This capacity is tied to an annual capacity
charge. In addition, energy can be purchased as required over the new interconnection in hourly blocks.
With this flexibility, the model can optimize the contributions of the transmission interconnection to
both Planning Reserve Margin and to energy supply in each year of the planning horizon.
50 https://nsuarb.novascotia.ca/ M08929, Exhibit N-8, PSC, Nova Scotia Power Stability Study for Renewable Integration Report, pages 365-434.51 These resources are not made available sooner to account for the time it would take to contract, design, and build these new transmission
resources.

Nova Scotia Power 2020 IRP76
4.5.3 Characteristics of Imported Energy and Capacity
As discussed in the previous sections, both existing and candidate transmission options can provide
energy, and in some cases firm capacity.52 Depending on the import source and availability assumptions
for the different transmission corridors, each import resource has specific on and off-peak provision
limits, ramping limits, and daily, seasonal, or annual dispatch limits. Due to local system constraints there
are also seasonal limits on simultaneous imports over the existing New Brunswick tie and the Maritime
Link. These limits are individually set for each resource in the model, to govern operational availability
and reliability contributions for capacity expansion.
Imports to Nova Scotia from other Canadian provinces are modeled as emissions-free, as those
emissions are accounted for in the province in which the generation occurred under appropriate federal
and/or provincial requirements. For the Regional Interconnection options, the energy available via
the HVDC line to Quebec is modeled as emissions-free, while imports sourced via the Coleson Cove
interconnection incorporate an emissions factor; as a result, energy imports from that source contribute
to the modeled system emissions limits.
Firm import options have been modeled as sources of firm capacity for resource expansion, while non-
firm imports are available exclusively for energy provision. In aggregate, modeled firm and non-firm
import resources are shown below:
Firm Import Options:
• Access to firm capacity via existing transmission up to ~150 MW firm; and/or,
• Access to firm capacity via new transmission build up to ~450 MW firm
Non-Firm Import Options:
• Import energy via existing transmission (Maritime Link and New Brunswick tie-line); and/or,
• Import energy via new transmission (either HVDC to HQ, or AC to link to Coleson Cove/ISO-NE).
52 Firm transmission capacity is the amount of electricity that can be delivered in a reliable manner after consideration of surrounding
system loads, voltages, and stability conditions. Non-firm transmission is the capacity that can be used for energy delivery but is subject to
curtailment under different system conditions; as a result, additional in-province reserve requirements are modeled for non-firm energy.
Nova Scotia Power 2020 IRP 77
4.6 Resource Strategies
Nova Scotia Power developed three Resource Strategies for use in this IRP. These strategies are
intended to capture different subsets of supply and demand-side resources, to allow for a comparison
of strategic alternatives that otherwise might not fall out of the optimization results. This approach was
used to ensure that the IRP analysis covered key areas of importance and interest to Nova Scotia Power
and IRP participants. Each Resource Strategy is assigned a letter designation (A, B, C as detailed below)
in order to allow for easy linking to the names of each key scenario and sensitivity modeled.
The first Resource Strategy is Current Landscape (A). This strategy models the availability of new
in-province supply and demand-side resources but does not allow for new interconnections to other
regions. The full suite of supply and demand-side resources described in Sections 4.3 and 4.4 is
available under this strategy.
The second strategy, Distributed Resources (B), is designed to model a future in which customers adopt
significant amounts of Distributed Energy Resources (DERs) such as rooftop solar and consequently
reduce their energy requirements from the grid. The adoption of behind-the-meter and distributed
resources has increased significantly in recent years due to environmental objectives and technology
price declines. Nova Scotia Power believes it is important to understand the potential impact of a
significant increase in DER penetration on the bulk system, including the impact on rates, system
operation, and on meeting the long-term GHG reduction goals. Under this Resource Strategy, all the
same resources are available as in the Regional Integration (C) scenarios and the load forecast is
modified to reflect the impact of significant DER penetration. The capacity modeled is quite significant,
representing approximately 1,300 MW of rooftop solar online in Nova Scotia by 2045; approximately
820 MW is online by 2030. This capacity is directionally similar to what has been envisioned by others
in their environmental planning considerations, such as the HalifACT plan undertaken by the Halifax
municipality.
The third and final strategy modeled is Regional Integration (C). Building new interconnections to
access out-of-province resources could be an important element in meeting Nova Scotia Power’s GHG
reduction and reliability goals while maintaining affordability. Nova Scotia neighbours provinces with
abundant hydro resources as well as large, interconnected power systems with significant capacity and
energy resources. These resources located outside of Nova Scotia can provide low-emitting energy along
with firm and dispatchable capacity, both of which are valuable in a decarbonized grid. As described
in Section 4.5, resource options for firm capacity imports on both existing and new transmission
infrastructure are made available under this Resource Strategy.
These three Resource Strategies are combined with other levels of the main policy drivers to produce
the key scenarios for modeling, as described in the next section.

Nova Scotia Power 2020 IRP78
5.1 Key Scenarios
Nova Scotia Power’s objective in this IRP is to model a wide range of potential future scenarios and use
this range of results to identify near-term options that are common among many resource plans. In this
way, a no-regrets Action Plan and Roadmap can be developed. Through the development of the pre-IRP
work, the IRP Assumptions, and consultation with IRP participants, Nova Scotia Power identified three
key policy drivers to form the basis of the IRP key scenarios:
1. Decarbonization - GHG Scenario and Coal Retirement Date (described in Section 3.3.4)
2. Load - Electrification Level (described in Section 4.1.2)
3. Resource Strategy (described in Section 4.6)
Among the policy drivers, the decarbonization and electrification drivers represent the impact of
various policies on electricity sector, including the SDGA and Federal coal closure policies. The Resource
Strategy driver explores the key areas of importance and interest identified by Nova Scotia Power and
IRP participants, such as the role of new interconnections and distributed resources in meeting future
requirements.
Nova Scotia Power’s next step was to combine these policy drivers to create key scenarios to be
modeled. An initial DSM profile was also assigned to each key scenario, based on that scenario’s
properties. Additional discussion on this scenario development can be found in the Scenarios and
Modeling Plan (Appendix C).
In order to consistently identify and differentiate scenarios throughout the IRP process, scenarios are
identified according to the following naming convention based on the component policy drivers:
• Scenario ID = [Decarbonization driver ID].[Electrification driver ID][Resource Strategy driver ID]
For example, scenario “2.1C” represents a future in which coal plants are schedule to retire no later than
2040 and the electricity sector meets the Net-Zero 2050 GHG curve, which reaches a target of 1.4 MT
in 2045. In this future, the electrification level is specified as the Mid electrification scenario based on
the pre-IRP Deep Decarbonization Pathways report, and the Regional Integration resource strategy is
SCENARIOS, METHODOLOGY, AND EVALUATION FRAMEWORK5

Nova Scotia Power 2020 IRP 79
enabled, meaning new transmission lines can be built to access additional imports. This scenario was
paired with the Base DSM profile.
Nova Scotia Power’s goal was to create and analyze a broad range of key scenarios to enable robust
analysis of the IRP solution space. The key scenarios matrix shown in Figure 43 details how the three
drivers discussed in the previous section were combined to create 13 key scenarios to be modeled in the
Initial Portfolio Study phase.
Figure 43. Key Modeling Scenarios
Scenario Decarbonization Driver Load Driver Resource Strategy
1.0 ComparatorComparator GHG TrajectoryCoal retires by 2040
Low Elec.Base DSM
A. Current LandscapeC. Regional Integration
2.0 Net-Zero 2050Low Electrification
Net-Zero 2050 TrajectoryCoal retires by 2040
Low Elec.Base DSM
A. Current LandscapeC. Regional Integration
2.1 Net-Zero 2050Mid Electrification
Net-Zero 2050 Trajectory Coal retires by 2040
Mid Elec.Base DSM
A. Current LandscapeB. Distributed ResourcesC. Regional Integration
2.2 Net-Zero 2050High Electrification
Net-Zero 2050 TrajectoryCoal retires by 2040
High Elec.Max DSM
A. Current LandscapeC. Regional Integration
3.1 Accel. Net-Zero 2045Mid Electrification
Accelerated Net-Zero 2045 TrajectoryCoal retires by 2030
Mid Elec.Base DSM
B. Distributed ResourcesC. Regional Integration
3.2 Accel. Net-Zero 2045High Electrification
Accelerated Net-Zero 2045 TrajectoryCoal retires by 2030
High Elec.Max DSM
B. Distributed ResourcesC. Regional Integration
5.2 Sensitivity Analysis
In addition to modeling the key scenarios, Nova Scotia Power also conducted a series of sensitivities to
understand how the optimal portfolio for a certain key scenario will vary given different assumptions
for certain input parameters. DSM levels are varied to test the impact of various levels of DSM on both
resource requirements and scenario costs. Technology cost sensitivities are conducted to investigate the
impact of lower technology costs on the coal retirement schedule and the ultimate resource portfolio
in 2045. Sustaining capital sensitivities were run to understand how these assumptions might impact
retention of thermal generating units, and Mersey Hydro retirement was modeled as its own sensitivity.
Finally, various operating sensitivities including inertia constraints, Reliability Tie parameters, and
import availability are also conducted to understand the sensitivity of the model to these parameters.
Figure 44 summarizes the sensitivity cases conducted.
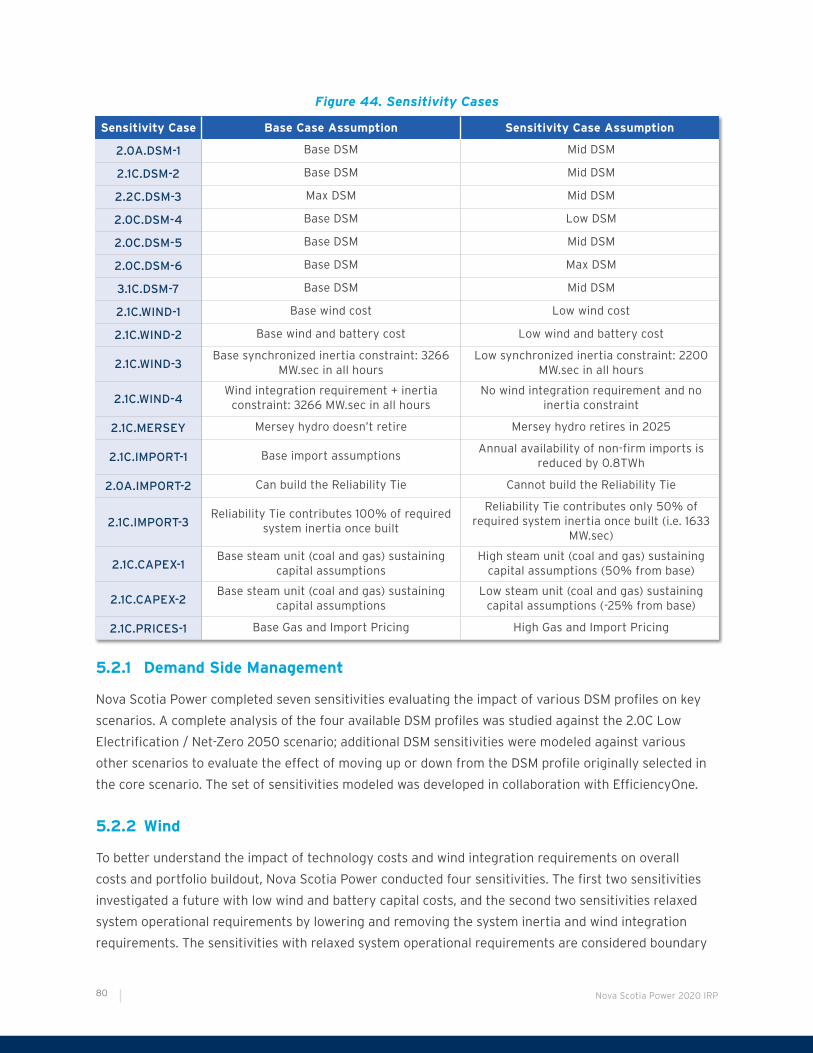
Nova Scotia Power 2020 IRP80
Figure 44. Sensitivity Cases
Sensitivity Case Base Case Assumption Sensitivity Case Assumption
2.0A.DSM-1 Base DSM Mid DSM
2.1C.DSM-2 Base DSM Mid DSM
2.2C.DSM-3 Max DSM Mid DSM
2.0C.DSM-4 Base DSM Low DSM
2.0C.DSM-5 Base DSM Mid DSM
2.0C.DSM-6 Base DSM Max DSM
3.1C.DSM-7 Base DSM Mid DSM
2.1C.WIND-1 Base wind cost Low wind cost
2.1C.WIND-2 Base wind and battery cost Low wind and battery cost
2.1C.WIND-3Base synchronized inertia constraint: 3266
MW.sec in all hoursLow synchronized inertia constraint: 2200
MW.sec in all hours
2.1C.WIND-4Wind integration requirement + inertia
constraint: 3266 MW.sec in all hoursNo wind integration requirement and no
inertia constraint
2.1C.MERSEY Mersey hydro doesn’t retire Mersey hydro retires in 2025
2.1C.IMPORT-1 Base import assumptionsAnnual availability of non-firm imports is
reduced by 0.8TWh
2.0A.IMPORT-2 Can build the Reliability Tie Cannot build the Reliability Tie
2.1C.IMPORT-3Reliability Tie contributes 100% of required
system inertia once built
Reliability Tie contributes only 50% of required system inertia once built (i.e. 1633
MW.sec)
2.1C.CAPEX-1Base steam unit (coal and gas) sustaining
capital assumptionsHigh steam unit (coal and gas) sustaining
capital assumptions (50% from base)
2.1C.CAPEX-2Base steam unit (coal and gas) sustaining
capital assumptionsLow steam unit (coal and gas) sustaining
capital assumptions (-25% from base)
2.1C.PRICES-1 Base Gas and Import Pricing High Gas and Import Pricing
5.2.1 Demand Side Management
Nova Scotia Power completed seven sensitivities evaluating the impact of various DSM profiles on key
scenarios. A complete analysis of the four available DSM profiles was studied against the 2.0C Low
Electrification / Net-Zero 2050 scenario; additional DSM sensitivities were modeled against various
other scenarios to evaluate the effect of moving up or down from the DSM profile originally selected in
the core scenario. The set of sensitivities modeled was developed in collaboration with EfficiencyOne.
5.2.2 Wind
To better understand the impact of technology costs and wind integration requirements on overall
costs and portfolio buildout, Nova Scotia Power conducted four sensitivities. The first two sensitivities
investigated a future with low wind and battery capital costs, and the second two sensitivities relaxed
system operational requirements by lowering and removing the system inertia and wind integration
requirements. The sensitivities with relaxed system operational requirements are considered boundary

Nova Scotia Power 2020 IRP 81
cases rather than true sensitivities, because without sufficient system inertia and wind integration
solutions, Nova Scotia Power may not be able to operate the system reliably. However, these two
scenarios are helpful to understand how the model will perform under these boundary conditions.
5.2.3 Mersey Hydro
While the Mersey system was economically retained in the resource screening phase of the IRP, this
sensitivity was completed to understand how capacity and energy would be replaced in the IRP PLEXOS
model if the Mersey system is assumed to retire in 2025.
5.2.4 Imports
Imported energy from outside Nova Scotia and the Reliability Tie are components that are seen in
all key scenario resource plans; they help Nova Scotia Power both meet future demand and integrate
renewable resources. Nova Scotia Power conducted three sensitivities to understand the impact of
changes to these resources. The first sensitivity limits the maximum quantity of annual non-firm imports
to understand how that energy would be replaced. The other two sensitivities model a future in which
the Reliability Tie either cannot be built, or where the Reliability Tie, once built, can only contribute to
50 percent of the required system inertia (down from 100 percent in the base case).
5.2.5 Sustaining Capital
To understand the robustness of retaining the existing thermal steam fleet (both coal fired and gas/HFO
fired), Nova Scotia Power executed two sensitivities on sustaining capital. These help to interpret the
economic levels of sustaining capital spend under which these resources continue to be included in the
optimal resource plan. Alternatively, they may identify how sensitive projected retirement dates are to
sustaining capital assumptions.
5.2.6 Gas and Import Prices
Because new natural gas and import resources are both important new resource options to replace
retiring coal capacity, Nova Scotia Power tested a high price sensitivity to determine the robustness of
those resources to higher prices. Gas and power prices both tie to similar market fundamentals in the
Maritimes region and so are modeled as moving from Base to High together.

Nova Scotia Power 2020 IRP82
5.3 Methodology
5.3.1 Developing Resource Portfolios
Nova Scotia Power utilized the PLEXOS capacity expansion and production simulation modeling
software in developing the optimal resource portfolios during the Portfolio Study phase of the IRP.
PLEXOS is a leading capacity expansion and production cost model software package that uses
mathematical optimization to provide simulation capabilities for the electric power system. Nova Scotia
Power used the Long-Term (LT) Plan module in PLEXOS to develop lowest-cost expansion plans. PLEXOS
was used to develop the resource portfolio from 2021 to 2045 that minimizes the NPV of the investment
and operation costs, including end effects estimates, while meeting system GHG reductions target and
reliability constraints.
The PLEXOS Medium-Term Plan and Short-Term Plan (MT/ST) modules were used to model system
operation and dispatch at an hourly level and to check the operability of scenarios after the resource
portfolios are identified. Production costs and generation outputs for all runs in the Final Portfolio Study
were completed using the PLEXOS MT/ST modules. PLEXOS was used to develop the resource portfolio
from 2021 to 2045 that minimizes the NPV of the investment and operation costs while meeting system
GHG reductions target and reliability constraints.
Investment and operation costs include fuel costs, import contract costs, sustaining capital costs,
other variable and fixed costs, and the costs of building new generation resources and transmission
lines. System constraints include the planning reserve margin constraint for reliability, the annual GHG
emission targets, system reserve constraints, inertia constraints, renewable integration requirements,
transmission limits, and the operational constraints for each generating resource.
5.3.2 Assessing Reliability
One of the objectives of the IRP Portfolio Analysis is to ensure that the modeled resource plans meet
the established reliability criterion (see Section 3.1 for details on the selection of a reliability criterion).
It is important to emphasize the complexity of the reliability assessment process. This assessment
incorporates both the Planning Reserve Margin, which is a reflection of the system as a whole, as well as
each resource’s capacity value which is a function of its interactions with other resources and must be
considered in relation to the full portfolio and load patterns. The marginal capacity value of renewable
resources tends to decline with saturation and the capacity value of traditional firm resources is affected
by unit size, maintenance duration, outage rates and severity, which all impact outage patterns.
E3’s RECAP model was used to support capacity expansion modeling in two stages. First, RECAP was
used to confirm the required PRM of the existing system and capacity value for new and existing
resources, as described in Section 3.1. Second, RECAP was used after the completion of the Initial
Portfolio Study to ensure that resulting optimal resource plans will meet Nova Scotia Power’s selected
reliability criterion of 1-day-in-10-years LOLE. Key scenarios that most closely inform the Action Plan

Nova Scotia Power 2020 IRP 83
and Roadmap, as well as scenarios with more aggressive renewable and storage buildouts, representing
bookend cases, were selected for this screening step. Results of this assessment are discussed in
Section 6.6.
5.3.3 Assessing Operability
To access the operational behaviour of the future resource portfolio, Nova Scotia Power conducted and
reviewed hourly unit commitment simulations in PLEXOS MT/ST for several key scenarios, including
scenarios that inform the Action Plan and Roadmap as well as scenarios that represent significant
penetrations of variable generation and thermal unit retirements.
The chronological hourly simulation is intended to validate the operability of the proposed resource
plan with all key constraints considered, including system operability constraints such as system inertia,
import limits, and emission limits; unit operability constraints such as minimum thermal unit up/down
time and ramp rates; and system reserve requirements such as spinning, ramping, and non-spinning
reserves.
Results from the operability screening, such as the number of operating hours and number of unit
starts per year, are also used to refine the sustaining capital assumptions prior to the Final Portfolio
Study. Other refinements identified in the operability screening process were incorporated into the Final
Portfolio Study to ensure all constraints were accurately represented while enabling the model to find
feasible solutions.
5.3.4 Assessing Relative Rate Impacts
As discussed in Section 3.2, Nova Scotia Power believes it is important to analyze and consider financial
metrics in addition to Net Present Value of Revenue Requirement when assessing IRP modeling results.
IRP participants also indicated during the IRP Process that a relative rate metric would be helpful in
comparing scenarios with disparate load impacts, particularly since the effects of electrification are
a key component of this IRP. This is also of assistance when considering demand-side programs that
impact both costs and revenues. To support this analysis, Nova Scotia Power created a relative rate
impact model to illustrate the net effect on Nova Scotia Power customer rates of the change in cost
and load associated with varying levels of electrification, DSM, and DER deployment under different
resource plans.
Demand-side measures such as electrification, DERs, and DSM will affect rates in two ways. First,
changes in retail sales will result in changes in utility revenues, affecting the utility’s recovery of fixed
costs. All else being equal, measures that reduce retail sales will tend to increase retail rates because
of reduced contribution to the system’s fixed costs, and vice-versa. At the same time, changes in load
will also affect utility costs, particularly if they occur during peak demand periods that drive the need
for investment. The net impact of any one measure on the utility’s rates is a function of each of these
factors and cannot be ascertained without careful analysis.

Nova Scotia Power 2020 IRP84
In order to estimate the rate impacts of the various demand-side measures on utility rates for each of the scenarios
considered here, Nova Scotia Power evaluated changes in costs and revenues due to load changes associated with
electrification, distributed resource assumptions, and energy efficiency measures. Nova Scotia Power took the
following approach:
Nova Scotia Power took following approach:
1. Begin with the forward looking supply-side and demand-side annual revenue requirements developed in the IRP.
2. To this, add the fixed cost amounts currently embedded in customer rates from the most recent General Rate
Application Test Year (2014).
3. The total of the IRP revenue requirement and 2014 foundation produces an estimate of total annual utility
revenue requirement for the analysis period.
4. A system rate is developed by dividing the total annual revenue requirement by total sales (i.e. net system
requirement less losses).
5. Annual rate changes are calculated as the change in the rate year over year. A simple (i.e. non-cumulative)
average rate change is created by averaging rate changes over the analysis period.
The analysis employs a number of simplifying assumptions including:
• Electrification and the associated fixed cost recovery (FCR) are assumed to occur uniformly across
customer classes. To the extent that electrification occurs to a greater degree in classes with higher fixed
cost recovery (e.g. the residential class), the FCR can be expected to be greater, which could offset other
rate pressure. Conversely, if this electrification load growth occurs within classes with lower fixed cost
recovery, then the cost pressure could be higher.
• Changes in load from electrification are assumed to affect revenue proportionately (i.e. demand and energy
billings increase at the same level).
• The initial fixed cost recovery is held constant over the analysis period. Effectively this assumes that the
decline in existing rate base due to depreciation is offset by ongoing additions to T&D, General Property and
other utility costs not captured in the IRP. Non-fuel costs are subject to a variety of factors (e.g., inflation,
cost of financing, change in amortization/depreciation levels), so forecasting upward or downward movement
is highly uncertain. For this reason, the utility held the figure static. An element which is a primary focus
of this IRP, advanced retirement of Nova Scotia Power’s fossil fuel fleet, has the potential to change this
situation in an upward direction. As plant net book values are recovered over a shorter period, this will place
upward pressure on utility fixed costs and rates that could significantly exceed any general cost movement in
this group.
It supports why the opportunity presented by beneficial electrification at this time is so timely for Nova
Scotia Power’s customers and the Province.
2020 costs are not modeled in the IRP but used as a reference year to calculate the first year’s rate change. Nova
Scotia Power assumed a 1 percent decline from 2021 modeled costs under the Low Electrification Scenario to produce
the 2020 cost used for all scenarios.
Finally, in response to stakeholder feedback, Nova Scotia Power has used its relative rate impact model to identify
an order of magnitude level of costs that may be acceptable for utility customers to bear in order to promote
electrification to the benefit of customers. This question cannot be resolved through the IRP process with precision;
however, using the rate model, Nova Scotia Power is able to provide an order of magnitude estimate of annual
investment before upward pressure on rates is evident. This was accomplished in the relative rate impact model by
solving for the potential program spend in 2021, escalated annually with inflation, that would result in an equivalent
25-year average rate change to the Low electrification case as modeled. This is directionally helpful in informing an
Electrification Strategy as further described in Section 7.

Nova Scotia Power 2020 IRP 85
5.4 Evaluation of Resource Portfolios
One of the main objectives of the IRP is to develop a robust, risk-weighted lowest-cost long-term
electricity strategy that delivers energy in a safe and reliable manner. In addition, Nova Scotia Power is
committed to continue provincial decarbonization through addition of low- and non-emitting resources,
where appropriate, and maintaining affordability for customers across a range of foreseeable future
scenarios. During the IRP process, Nova Scotia Power developed, with input from IRP participants,
the following series of metrics to evaluate resource portfolio performance against these targets. The
primary metric for evaluating future resource portfolios is the 25-year NPVRR, incorporating end
effects. Additional metrics are also calculated and compared to capture relative effects on electricity
rates, system flexibility, reliability, and robustness.
• Resource Plan Cost: Minimizing customer costs is one of Nova Scotia Power’s central objectives.
When evaluating the portfolios, scenarios are compared based on their 25-year NPVRR over the
planning horizon (with and without end-effects adjustment). 10-year NPVRRs are also calculated
to help understand how near-term costs vary between scenarios. The NPV values presented
incorporate an estimate of the avoided T&D cost associated with various levels of DSM.
• Rates (Magnitude and timing of electricity rate effects): In addition to minimization of NPVRR,
understanding variations in the magnitude and timing of electricity rate effects is an important
metric in this IRP. The significance of this metric is more important than in previous studies since
this IRP is comparing scenarios with different load levels due to assumptions about Electrification,
DSM, and DER penetration. The relative rate values presented incorporate an estimate of the
avoided T&D cost associated with varying levels of DSM.
• Resource Adequacy (Reliability requirements for supply adequacy): Ensuring a reliable
electricity supply for customers is a priority for Nova Scotia Power. As described in Section
3.1, minimum reliability requirements were established for the IRP model, including the PRM
requirement and other operating requirements and constraints. Feasible resource plans are
required to meet these minimum constraints, and any notable risks specific to a particular key
scenario or sensitivity are noted qualitatively in the Modeling Results.
• Stability and Reliability (Provision of ancillary grid services): To ensure the stability and
reliability of the grid, quantitative and qualitative assessments of the status of thermal unit
operations and the status of ancillary grid services provision were conducted for each candidate
portfolio, including system inertia and reserves. Feasible resource plans are required to meet these
minimum constraints, and any notable risks specific to a particular key scenario or sensitivity are
noted qualitatively in the Modeling Results.
• GHG Emissions (Reduction of greenhouse gas and/or other emissions): The IRP examines annual
GHG emissions and other source emissions from both Nova Scotia Power resources and imported
energy (when applicable), to ensure emissions remain below the GHG limits set within each scenario.
Nova Scotia Power also quantified the cumulative GHG emissions to meet load between 2021 and 2045.
• Robustness and Flexibility: Qualitative assessments were conducted of the magnitude of the
plan’s exposure to changes in key assumptions, resiliency to risks, and flexibility relative to the
timing of major investments.
Nova Scotia Power 2020 IRP86
The assumptions, constraints, and scenarios developed through the initial stages of the IRP Process
provide the inputs necessary to execute the Initial Portfolio Study, Reliability and Operability Analysis,
and Final Portfolio Study. An overview of the modeling results from the Final Portfolio Study is
presented in this section, with a particular focus on resource plan elements that are common to the
range of low-cost plans. The complete series of IRP modeling results, including graphical and tabular
model outputs for each scenario and sensitivity, are provided.
Nova Scotia Power’s 2020 IRP confronts a high degree of uncertainty in the electricity planning
environment. Ongoing changes in technology cost and availability, electricity demand and economy-wide
electrification, GHG emissions regulations, and many other factors widen the range of potential futures
that Nova Scotia Power’s resource planning must be robust to. Fortunately, even when examining
this wide range of scenarios, the modeling work has shown that low-cost resource plans share many
common elements in terms of both resource selection and timing.
Of the key scenarios modeled in the Final Portfolio Study, Scenario 2.0C (Low Electrification / Base DSM
/ Net-Zero 2050 / Regional Integration) has the lowest 25-year NPVRR, incorporating end effects and
accounting for DER costs (see Section 6.4 for details). Consequently, the resource plan optimized under
this scenario has been designated the Reference Plan per the IRP Terms of Reference. It is important
to note that this scenario is representative of many of the other low-cost resource plans modeled,
particularly in the first ten years of the plan, and as a result it is this commonality that will inform Nova
Scotia Power’s “no regrets” IRP Action Plan and Roadmap.
Other low-cost scenarios which vary on a single policy driver or input assumption include 2.1C (Mid
Electrification load), 3.1C (Accelerated Net-Zero 2045 emissions), and 2.1C.WIND-1 (low wind cost) among
others; the optimal resource plans developed under these scenarios are also discussed in this section to
highlight commonalities. In addition, notes are provided to support the interpretation of the full set of
IRP modeling results.
MODELING RESULTS6
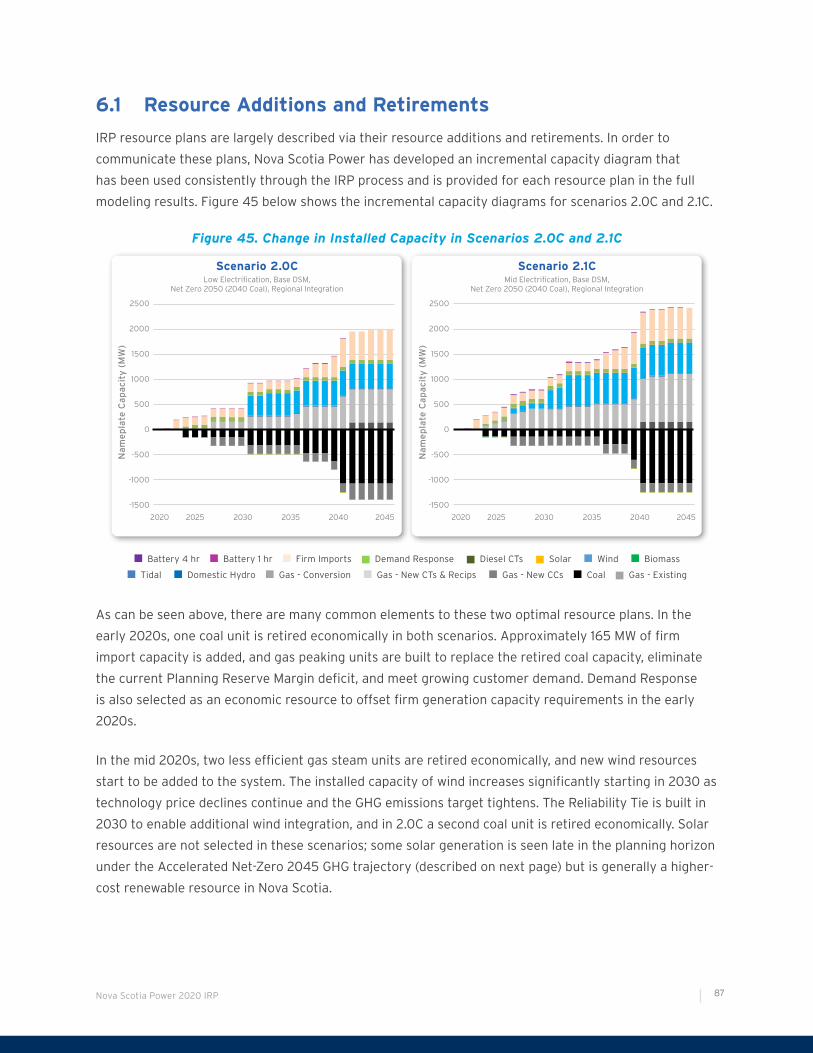
Nova Scotia Power 2020 IRP 87
6.1 Resource Additions and Retirements
IRP resource plans are largely described via their resource additions and retirements. In order to
communicate these plans, Nova Scotia Power has developed an incremental capacity diagram that
has been used consistently through the IRP process and is provided for each resource plan in the full
modeling results. Figure 45 below shows the incremental capacity diagrams for scenarios 2.0C and 2.1C.
Figure 45. Change in Installed Capacity in Scenarios 2.0C and 2.1C
Scenario 2.0CLow Electrification, Base DSM,
Net Zero 2050 (2040 Coal), Regional Integration
Scenario 2.1CMid Electrification, Base DSM,
Net Zero 2050 (2040 Coal), Regional Integration
Battery 4 hr Battery 1 hr Firm Imports Demand Response Diesel CTs Solar Wind Biomass
Tidal Domestic Hydro Gas - Conversion Gas - New CTs & Recips Gas - New CCs Coal Gas - Existing
Na
me
pla
te C
ap
aci
ty (
MW
)
Na
me
pla
te C
ap
aci
ty (
MW
)
1500
2000
2500
1000
500
0
-500
-1000
-1500
1500
2000
2500
1000
500
0
-500
-1000
-1500
2040203520252020 2030 2045 2040203520252020 2030 2045
As can be seen above, there are many common elements to these two optimal resource plans. In the
early 2020s, one coal unit is retired economically in both scenarios. Approximately 165 MW of firm
import capacity is added, and gas peaking units are built to replace the retired coal capacity, eliminate
the current Planning Reserve Margin deficit, and meet growing customer demand. Demand Response
is also selected as an economic resource to offset firm generation capacity requirements in the early
2020s.
In the mid 2020s, two less efficient gas steam units are retired economically, and new wind resources
start to be added to the system. The installed capacity of wind increases significantly starting in 2030 as
technology price declines continue and the GHG emissions target tightens. The Reliability Tie is built in
2030 to enable additional wind integration, and in 2.0C a second coal unit is retired economically. Solar
resources are not selected in these scenarios; some solar generation is seen late in the planning horizon
under the Accelerated Net-Zero 2045 GHG trajectory (described on next page) but is generally a higher-
cost renewable resource in Nova Scotia.
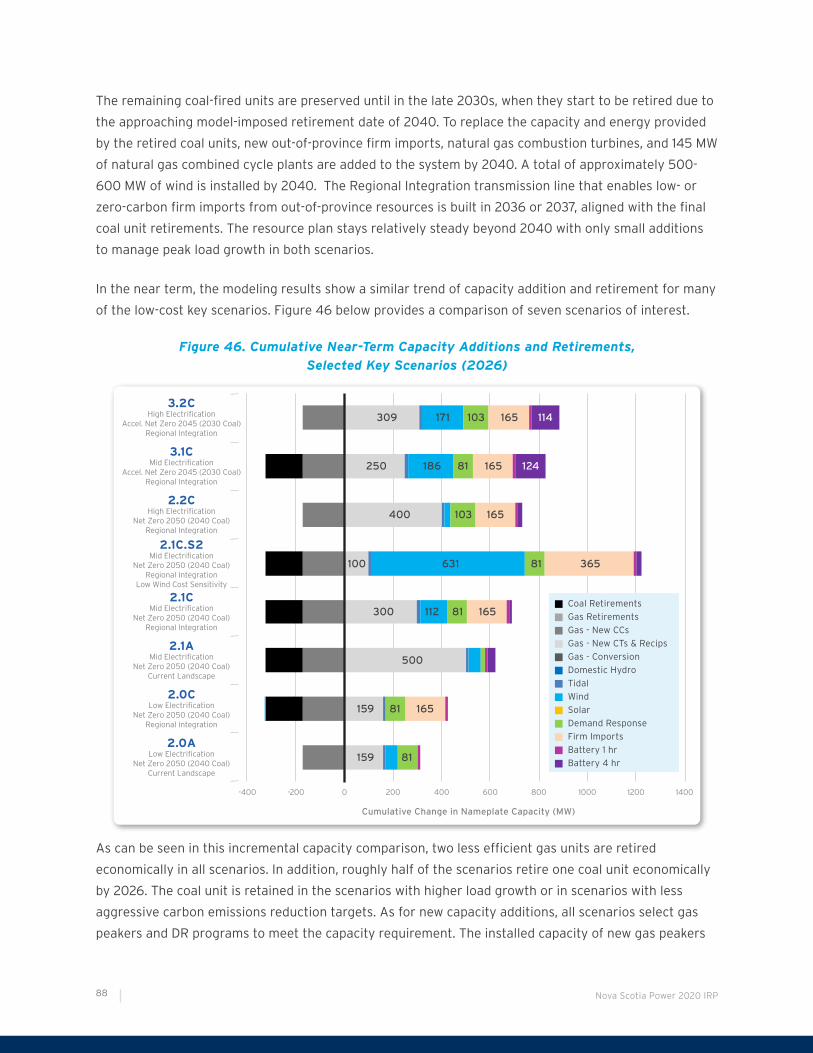
Nova Scotia Power 2020 IRP88
The remaining coal-fired units are preserved until in the late 2030s, when they start to be retired due to
the approaching model-imposed retirement date of 2040. To replace the capacity and energy provided
by the retired coal units, new out-of-province firm imports, natural gas combustion turbines, and 145 MW
of natural gas combined cycle plants are added to the system by 2040. A total of approximately 500-
600 MW of wind is installed by 2040. The Regional Integration transmission line that enables low- or
zero-carbon firm imports from out-of-province resources is built in 2036 or 2037, aligned with the final
coal unit retirements. The resource plan stays relatively steady beyond 2040 with only small additions
to manage peak load growth in both scenarios.
In the near term, the modeling results show a similar trend of capacity addition and retirement for many
of the low-cost key scenarios. Figure 46 below provides a comparison of seven scenarios of interest.
Figure 46. Cumulative Near-Term Capacity Additions and Retirements,
Selected Key Scenarios (2026)
Cumulative Change in Nameplate Capacity (MW)
2.0ALow Electrification
Net Zero 2050 (2040 Coal) Current Landscape
2.0CLow Electrification
Net Zero 2050 (2040 Coal)Regional Integration
2.1AMid Electrification
Net Zero 2050 (2040 Coal)Current Landscape
2.1CMid Electrification
Net Zero 2050 (2040 Coal)Regional Integration
2.1C.S2Mid Electrification
Net Zero 2050 (2040 Coal)Regional Integration
Low Wind Cost Sensitivity
2.2CHigh Electrification
Net Zero 2050 (2040 Coal)Regional Integration
3.1CMid Electrification
Accel. Net Zero 2045 (2030 Coal)Regional Integration
3.2CHigh Electrification
Accel. Net Zero 2045 (2030 Coal)Regional Integration
-400 -200 0 200 400 600 800 1000 1200 1400
100
300
159
500
400
250
309
631
112
159
103
186
171
81
103
81
81
81
81
165
365
165
165
165
165
124
114
Coal Retirements
Gas Retirements
Gas - New CCs
Gas - New CTs & Recips
Gas - Conversion
Domestic Hydro
Tidal
Wind
Solar
Demand Response
Firm Imports
Battery 1 hr
Battery 4 hr
As can be seen in this incremental capacity comparison, two less efficient gas units are retired
economically in all scenarios. In addition, roughly half of the scenarios retire one coal unit economically
by 2026. The coal unit is retained in the scenarios with higher load growth or in scenarios with less
aggressive carbon emissions reduction targets. As for new capacity additions, all scenarios select gas
peakers and DR programs to meet the capacity requirement. The installed capacity of new gas peakers
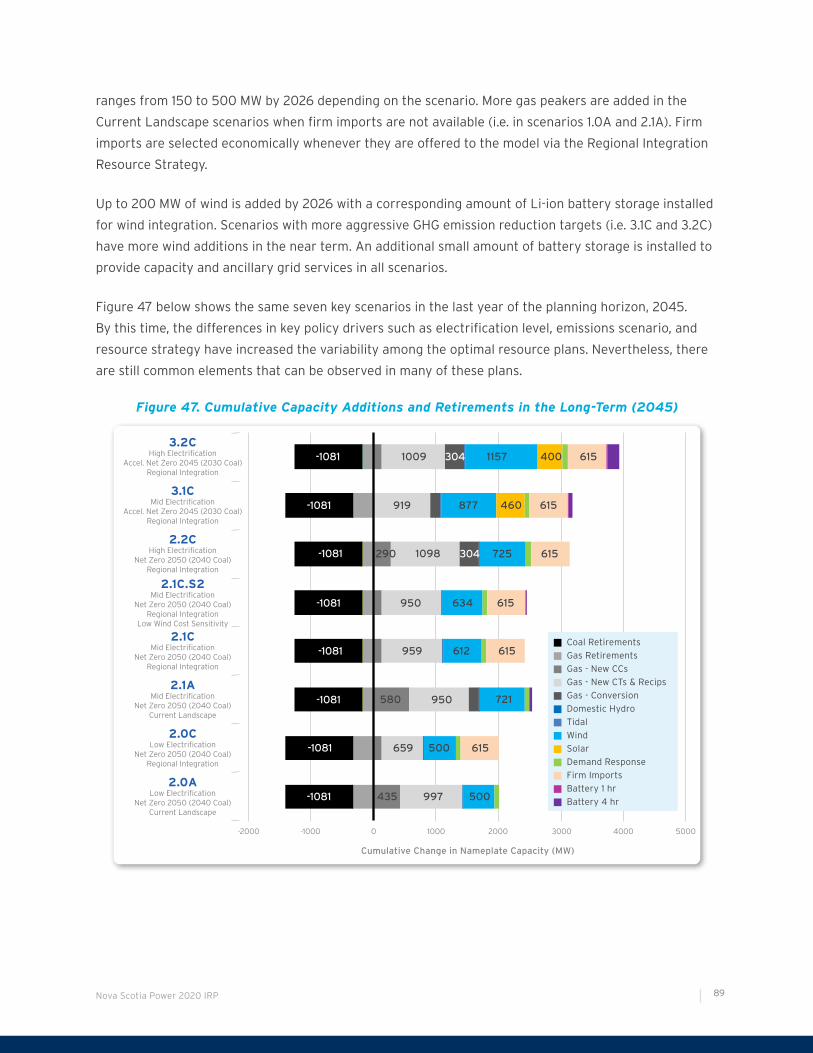
Nova Scotia Power 2020 IRP 89
ranges from 150 to 500 MW by 2026 depending on the scenario. More gas peakers are added in the
Current Landscape scenarios when firm imports are not available (i.e. in scenarios 1.0A and 2.1A). Firm
imports are selected economically whenever they are offered to the model via the Regional Integration
Resource Strategy.
Up to 200 MW of wind is added by 2026 with a corresponding amount of Li-ion battery storage installed
for wind integration. Scenarios with more aggressive GHG emission reduction targets (i.e. 3.1C and 3.2C)
have more wind additions in the near term. An additional small amount of battery storage is installed to
provide capacity and ancillary grid services in all scenarios.
Figure 47 below shows the same seven key scenarios in the last year of the planning horizon, 2045.
By this time, the differences in key policy drivers such as electrification level, emissions scenario, and
resource strategy have increased the variability among the optimal resource plans. Nevertheless, there
are still common elements that can be observed in many of these plans.
Figure 47. Cumulative Capacity Additions and Retirements in the Long-Term (2045)
Cumulative Change in Nameplate Capacity (MW)
2.0ALow Electrification
Net Zero 2050 (2040 Coal) Current Landscape
2.0CLow Electrification
Net Zero 2050 (2040 Coal)Regional Integration
2.1AMid Electrification
Net Zero 2050 (2040 Coal)Current Landscape
2.1CMid Electrification
Net Zero 2050 (2040 Coal)Regional Integration
2.1C.S2Mid Electrification
Net Zero 2050 (2040 Coal)Regional Integration
Low Wind Cost Sensitivity
2.2CHigh Electrification
Net Zero 2050 (2040 Coal)Regional Integration
3.1CMid Electrification
Accel. Net Zero 2045 (2030 Coal)Regional Integration
3.2CHigh Electrification
Accel. Net Zero 2045 (2030 Coal)Regional Integration
-2000 -1000 0 1000 2000 3000 4000 5000
950
959
659
950
290
919
1009
634
612
435
1098
877
304
460
1157
615
500
997
615
615
615
615
400 615
304 725
580 721
500
Coal Retirements
Gas Retirements
Gas - New CCs
Gas - New CTs & Recips
Gas - Conversion
Domestic Hydro
Tidal
Wind
Solar
Demand Response
Firm Imports
Battery 1 hr
Battery 4 hr
-1081
-1081
-1081
-1081
-1081
-1081
-1081
-1081

Nova Scotia Power 2020 IRP90
In the long run, all coal units are retired by 2030 or by 2040 depending on the scenario; in addition, by
2045, two to three existing gas-fired steam units are retired economically in all cases. To replace this
retiring capacity and energy, new gas plants are built with the total new installed capacity ranges from
800–1700 MW depending on the scenario. In most scenarios, the majority of new gas capacity comes
from fast-acting combustion turbines operating with low capacity factors. Coal-to-gas conversions are
also built as capacity resources in about half of the scenarios. A smaller amount of new combined-cycle
gas generation is selected in six of the scenarios, with more combined-cycle capacity required in the
scenarios that did not have access to firm imported energy via Regional Integration.
The construction of a new Regional Interconnection is selected in all scenarios when it is available. The
scenarios with more aggressive GHG emission reduction targets choose to build the interconnection as
early as 2029 while other scenarios see it built in the late 2030s. Wind is built in all scenarios and the
cumulative new installed capacity ranges from 500 MW to 800 MW in most cases, and up to 1150 MW in
the most aggressive high-electrification and accelerated net-zero scenario (3.2C). The Reliability Tie is
built in the early 2030s in most scenarios to integrate the additional wind. 60-400 MW of solar is added
in 2044 in scenarios that follow the more aggressive accelerated net-zero GHG emission trajectory to
help meet the GHG goals in 2045. Solar generation provides an emissions-free energy resource under
these very low emission scenarios but is less well suited than wind to Nova Scotia’s system needs due
to lower annual capacity factors (resulting in a higher energy cost) and a solar generation profile that is
highest in the summer months (versus Nova Scotia’s load being winter peaking).
6.2 Energy Mix
Similar to the capacity addition and retirement chart, Nova Scotia Power has been using a consistent
format to share annual energy mix results throughout this IRP process. Figure 48 below shows how the
annual generation mix is modeled to evolve over the planning horizon under four scenarios of interest.
As with all results in the Final Portfolio Study, these results are the output of hourly production cost
simulations completed with PLEXOS MT/ST.
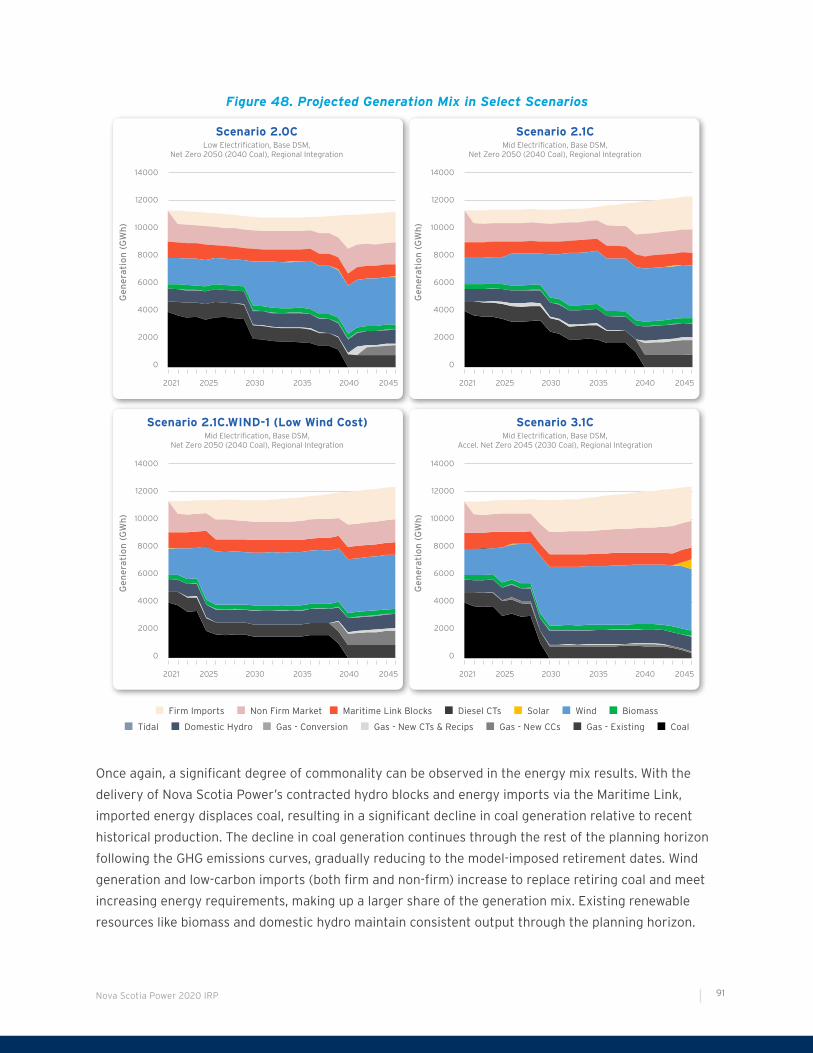
Nova Scotia Power 2020 IRP 91
Figure 48. Projected Generation Mix in Select Scenarios
Ge
ne
rati
on
(G
Wh
)
Scenario 2.1CMid Electrification, Base DSM,
Net Zero 2050 (2040 Coal), Regional Integration
8000
10000
12000
6000
4000
2000
0
14000
2040203520252021 2030 2045
Ge
ne
rati
on
(G
Wh
)Scenario 2.0C
Low Electrification, Base DSM, Net Zero 2050 (2040 Coal), Regional Integration
8000
10000
12000
6000
4000
2000
0
14000
2040203520252021 2030 2045
Firm Imports Non Firm Market Maritime Link Blocks Diesel CTs Solar Wind Biomass
Tidal Domestic Hydro Gas - Conversion Gas - New CTs & Recips Gas - New CCs Gas - Existing Coal
Scenario 2.1C.WIND-1 (Low Wind Cost) Mid Electrification, Base DSM,
Net Zero 2050 (2040 Coal), Regional Integration
Ge
ne
rati
on
(G
Wh
)
8000
10000
12000
6000
4000
2000
0
14000
2040203520252021 2030 2045
Scenario 3.1CMid Electrification, Base DSM,
Accel. Net Zero 2045 (2030 Coal), Regional Integration
Ge
ne
rati
on
(G
Wh
)
8000
10000
12000
6000
4000
2000
0
14000
2040203520252021 2030 2045
Once again, a significant degree of commonality can be observed in the energy mix results. With the
delivery of Nova Scotia Power’s contracted hydro blocks and energy imports via the Maritime Link,
imported energy displaces coal, resulting in a significant decline in coal generation relative to recent
historical production. The decline in coal generation continues through the rest of the planning horizon
following the GHG emissions curves, gradually reducing to the model-imposed retirement dates. Wind
generation and low-carbon imports (both firm and non-firm) increase to replace retiring coal and meet
increasing energy requirements, making up a larger share of the generation mix. Existing renewable
resources like biomass and domestic hydro maintain consistent output through the planning horizon.

Nova Scotia Power 2020 IRP92
An important observation when comparing these charts to the capacity results presented previously
is the continued separation of sources of energy and sources of firm capacity. For example, wind
generation and non-firm imports provide a significant portion of the energy but relatively little firm
capacity. Conversely, new gas combustion turbines provide a significant share of the firm capacity that
enables coal unit retirement but operate at very low capacity factors (less than 10 percent in most
cases). This changing system dynamic is an important consideration when evaluating the operability of
these future resource plans.
6.3 Greenhouse Gas Emissions
Figure 49 shows the GHG emissions over the planning horizon for the scenarios 2.0C and 2.1C. In both
scenarios, Nova Scotia Power is able to meet the GHG emission requirement and lower overall GHG
emissions from the electricity sector to 1.4 MT per year by 2045. Because of access to economic wind
energy and low- and zero-carbon imports, and because of the influence of other emissions limits with
declining hard caps through the period (Hg, SO2, and NOx), Nova Scotia Power is able to over-comply
with the modeled GHG emissions hard caps in most years. The fact that capacity is being added and
retired in blocks is also responsible for the shape of these curves as they optimize toward the end point
in 2045.
Figure 49. GHG Emissions in Scenarios 2.0C and 2.1C
Mil
lio
n T
on
ne
s
Mil
lio
n T
on
ne
s
Scenario 2.0CLow Electrification, Base DSM,
Net Zero 2050 (2040 Coal), Regional Integration
Scenario 2.1CMid Electrification, Base DSM,
Net Zero 2050 (2040 Coal), Regional Integration
2040203520252021 2030 2045
4
5
3
2
1
0
6
2040203520252021 2030 2045
4
5
3
2
1
0
6
GHG Modeled CapGHG Modeled Emissions
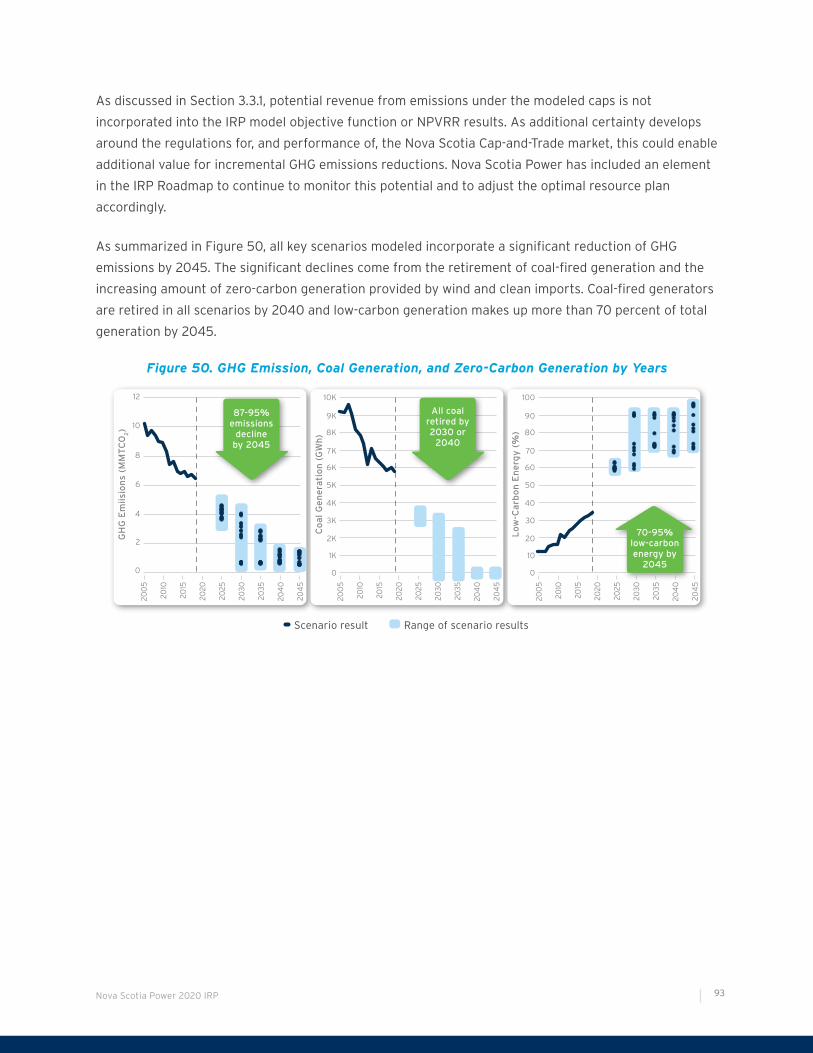
Nova Scotia Power 2020 IRP 93
As discussed in Section 3.3.1, potential revenue from emissions under the modeled caps is not
incorporated into the IRP model objective function or NPVRR results. As additional certainty develops
around the regulations for, and performance of, the Nova Scotia Cap-and-Trade market, this could enable
additional value for incremental GHG emissions reductions. Nova Scotia Power has included an element
in the IRP Roadmap to continue to monitor this potential and to adjust the optimal resource plan
accordingly.
As summarized in Figure 50, all key scenarios modeled incorporate a significant reduction of GHG
emissions by 2045. The significant declines come from the retirement of coal-fired generation and the
increasing amount of zero-carbon generation provided by wind and clean imports. Coal-fired generators
are retired in all scenarios by 2040 and low-carbon generation makes up more than 70 percent of total
generation by 2045.
Figure 50. GHG Emission, Coal Generation, and Zero-Carbon Generation by Years
Lo
w-C
arb
on
En
erg
y (
%)
204
0
2035
2025
200
5
2010
2015
2020
90
40
50
60
70
80
30
20
10
0
100
2030
204
5
Co
al
Ge
ne
rati
on
(G
Wh
)
204
0
2035
2025
200
5
2010
2015
2020
9K
4K
5K
6K
7K
8K
3K
2K
1K
0
10K
2030
204
5
GH
G E
mii
sio
ns
(MM
TC
O2)
204
0
2035
2025
200
5
2010
2015
2020
2030
204
5
8
10
12
6
4
2
0
87-95% emissions
decline by 2045
All coal retired by 2030 or
2040
70-95% low-carbon energy by
2045
Scenario result Range of scenario results

Nova Scotia Power 2020 IRP94
6.4 Resource Plan Cost
The NPV of partial revenue requirement for the IRP key scenarios is summarized in Figure 51 below.
Results for scenarios are grouped based on their load level; the revenue requirements should only be
compared across the scenarios with the same electrification and load levels, as serving more electricity
will naturally lead to a higher revenue requirement. Similarly, Resource Strategy B (Distributed
Resources) cannot be directly compared with the equivalent A (Current Landscape) and C (Regional
Integration) Resource Strategies because Resource Strategy B assumes aggressive DER adoption,
the costs of which are not included in the NPVRR as they are not assumed to be utility costs for IRP
modeling purposes. An estimated range of the cost of these DER resources is $1.6 billion to $2.5 billion
on an NPV basis.
When looking across the range of outputs, the C (Regional Integration) scenarios are lower cost than the
equivalent A (Current Landscape) scenarios in all cases, both with and without end effects. Further, the
Regional Integration scenarios are also lower cost than the Distributed Resources scenarios in all cases
once the low end of the DER cost estimate range is added to the modeled NPVRR.
Figure 51. NPV of Revenue Requirement Across Scenarios
Modeled Costs Extrinsic Costs
* Due to differences in forecast system load affecting production costs, resource plan partial revenue requirement results should not be compared across electrification scenarios
** Cost of DER resources not included in NPV calculations for “B” Scenarios ($1.6B - $2.5B)
Partial Revenue Requirement* 25 Year NPV
NP
V (
$M
M)
16K
18K
20K
14K
12K
10K
8K
22K
Low Elec. Mid Elec. High Elec.1.0C 2.0C 2.1A 2.1C 3.1C 2.2A 2.2C 3.2C1.0A 2.0A 2.1B 3.1B 3.2B 2.1A1.0C 2.0C 2.1C 3.1C 2.2A 2.2C 3.2C1.0A 2.0A 2.1B 3.1B 3.2B
Partial Revenue Requirement* 25 Year NPV with End Effects
NP
V (
$M
M)
16K
18K
20K
14K
12K
10K
8K
22K
Low Elec. High Elec.Mid Elec.
The comparison in this figure also shows that meeting a 2030 coal retirement date is more expensive,
on an NPV basis, than a comparable scenario with a 2040 coal retirement date.

Nova Scotia Power 2020 IRP 95
6.5 Relative Rate Impacts
In addition to comparing the NPVRR metrics, Nova Scotia Power also developed a simplified rate impact
model to compare the relative rate impacts of each scenario. This analysis approximates the resource
plan impact to customer rates over time, incorporating the effects of load changes due to Electrification,
DSM level, and Resource Strategy. The details of this rate effect model are available in Section 5.3.4.
Figure 52 below shows the relative rates for select scenarios over the planning horizon. In addition to
this visual comparison, the average annual relative rate impact is provided for each key scenario and
sensitivity as part of the full set of IRP modeling results.
Figure 52. Relative Rate Impact Comparison – Selected Scenarios
3.1C - Mid Elec / Base DSM 2030 Coal2.2C - High Elec / Max DSM 2040 Coal 2.2C.S1 - High Elec / Mid DSM 2040 Coal
2.0C - Low Elec / Base DSM 2040 Coal 2.1C - Mid Elec / Base DSM 2040 Coal2.1B - Mid Elec / Base DSM w/ DER 2040 Coal
Ra
te (
cen
ts/k
Wh
)
21
20
19
18
17
16
15
2020 2025 2030 2035 2040 2045
These results indicate that the higher fixed system costs associated with increased levels of electrification are
being distributed over a larger number of sales units, reducing the average unit costs. Another way of thinking
about this is that as additional units are sold at the same price, the utility’s new load is funding a portion of
the utility’s fixed costs which would otherwise be borne by the original smaller pre-electrification sales base.
The significance of this perspective is that depending on the fixed cost embedded in the electrification load,
whether it is greater or less than the system average, will increase or decrease the rate of rate increase. In the
case of electrification load, it is understood this will be primarily driven by the Residential sector which currently
has the energy price with the greatest amount of embedded fixed cost. This is particularly important in the
context of this IRP because the IRP is presenting a view with advanced thermal plant retirement. This means it
is possible that Nova Scotia Power will face increased depreciation expense in the near term. If electrification is
able to deliver significantly increased fixed cost revenue to fund these increases, the potential negative effect of
early plant retirement on customer rates could be mitigated.
This reduced rate pressure is in addition to savings from which customers may benefit by reducing other
components of their energy bills (e.g. heating oil, gasoline); this model also does not capture the economy-wide
emissions reduction benefits that would accompany increased levels of electrification.
Nova Scotia Power 2020 IRP96
While the cost and rate results presented in this IRP incorporate the impacts of avoided T&D costs
associated with DSM, T&D impacts due to electrification are not included in the IRP results. This
potentially more significant, long-term impact of electrification may not be well represented by
avoided costs intended to capture the impact of incremental adjustments in peak load on the T&D
systems. Accordingly, the IRP Action Plan includes elements to address T&D impacts of electrification
going forward (see item 2c). As a test case to understand potential scope and significance,
Nova Scotia Power analyzed the relative rate impact of moving from Low to Mid Electrification,
incorporating the full avoided T&D cost impact of the firm peak load increase. Even under this
conservative test case, with full T&D cost impacts included and no incremental fixed cost recovery
from electrification load, the relative rate model results showed that average relative rate impacts of
the modified Mid Electrification case remain equal to those modeled under Low Electrification.
Conversely, the scenario modeled with the Distributed Resources strategy (2.1B) is shown to have
a significantly higher relative rate impact over the planning horizon. This effect is a result of lower
annual energy sales in the DER case, but with a similar optimal resource plan as the peak demand
requirement is not affected by the presence of DER resources (which have no firm capacity value).
Finally, the cost of the DER resources themselves is not included in these rate impact calculations
but could be expected to add additional rate pressure if modeled.
The slight rate increases in 2030 for scenario 3.1C and in 2040 for the rest of the scenarios show that
coal retirement puts upward pressure on rates. Retiring the existing coal-fired plants requires Nova
Scotia Power to procure new capacity and energy from other resources. Closing coal-fired plants by
2030 and by 2040 has similar cumulative rate impacts by 2045, as shown by comparing rates between
scenario 3.1C and scenario 2.1C, but a 2030 coal closure date can be expected to add rate pressure
during the 2030s without other mitigation. As noted above, to the extent that electrification is able
to deliver significantly increased fixed cost revenue to fund these increases, to the extent that the
incremental load increases are driven by rate classes which contribute higher fixed cost recovery than
the system average, the negative effect of early plant retirement on customer rates could be mitigated
Finally, as noted in section 5.3.4, in response to stakeholder feedback, Nova Scotia Power has used
its relative rate impact model to seek to identify an order of magnitude level of costs that may be
acceptable for utility customers to bear in order to promote electrification to the benefit of customers.
This question cannot be resolved through the IRP process with precision; however, using the rate
model, Nova Scotia Power is able to provide an order of magnitude estimate of annual investment
before upward pressure on rates is evident. This information is directionally helpful in informing an
Electrification Strategy as further described in Section 7. Using the rate model to solve for a level
of electrification investment/incentivization, approximately $10.8 million annually could be spent
economically in pursuit of electrification, escalated at 2 percent, when comparing scenarios 2.0C (Low
Electrification / Base DSM) and 2.1C (Mid Electrification / Base DSM).

Nova Scotia Power 2020 IRP 97
6.6 Reliability
As described in Section 5.3.2, Nova Scotia Power included a Reliability Assessment phase in the IRP
process due to the significant changes in generating capacity anticipated by the end of the planning
horizon. Scenarios 2.0C, 2.1C, and 3.2C were selected for assessment as they are representative of the
range of options studied in the IRP, including Mid and High Electrification cases and all with significant
renewable energy penetrations by 2045.
For each case, the 2045 optimized resource portfolio and projected load were analyzed in E3’s loss of
load probability model, RECAP. This model completes a robust analysis against the established reliability
criterion of 0.1 days/year (see Section 3.1.1 for details). Systems which achieve an LOLE at or below this
limit are considered sufficiently reliable.
All three cases analyzed during the Reliability Assessment were found to meet the target reliability
criterion and LOLE metric, as shown below in Figure 53. Further, the installed firm capacity above the
minimum requirement for LOLE compliance is noted to be quite low in all three cases, and generally
close to or smaller than the capacity of the lowest cost firm capacity unit offered to the model (a new
frame combustion turbine).
Figure 53. Key Reliability Statistics – Reliability Screening of 2045 Resource Portfolios
2.0.C 2.1.C 3.2.C
LOLE Target (days/yr) 0.10 0.10 0.10
Achieved LOLE (days/yr) 0.06 0.02 0.06
Achieved LOLh (hrs/yr) 0.18 0.08 0.21
PRM Target (UCAP)* 8% 8% 9%
Achieved PRM (UCAP) 9% 11% 10%
Excess Capacity (MW) 32 77 40
*RECAP estimates a PRM target endogenously given the system load characteristics and reserves in 2045, therefore it may differ slightly from the PRM target estimated for the 2020 system.
While these results provide confidence that these systems are sufficiently reliable, detailed modeling of
electrification impacts on reliability is recommended as additional electrification shape data becomes
available. More detailed modeling of the electrification load shapes has been added to the IRP Action
Plan to develop a robust assessment of how electrification impacts might affect the PRM target in the
long-term. This work is likely to include more detailed modeling of the peak impacts of electrification
loads (particularly in buildings) as a function of expected extreme weather events or the extent to
which vehicle charging load would coincide with peak events and the potential means to ensure flexible
charging to avoid such coincidence.
Finally, while the excess capacity identified by this analysis is relatively small as a percentage of total
peak, and excess capacity above the target PRM can be attributable to economic optimization or the

Nova Scotia Power 2020 IRP98
lumpiness of resource additions, Nova Scotia Power will continue to assess the appropriateness of
the current PRM and its component parts, including the ELCC of batteries, wind and DR, as the power
system matures in its transformation. Triggers have been added to the IRP Roadmap to indicate when an
updated PRM analysis may be necessary.
In addition, at the conclusion of the IRP modeling process Nova Scotia Power and E3 updated the
PRM analysis completed as part of the pre-IRP Capacity Study to confirm that the 9 percent UCAP
PRM continues to be appropriate for near-term capacity planning. The base case model from the pre-
IRP study was updated with the assumptions that had been revised during the IRP process including
updated DAFOR rates (and the resulting updated ELCC contributions) for existing units, updated unit
availability assumptions, and the IRP load forecast for 2021 taken from scenario 2.0C. The results of this
updated analysis are shown below in Figure 54, compared with the results from the pre-IRP study.
Figure 54. Key Reliability Statistics of Near-Term Resource Portfolios
IRP Scenario 2.0C (2021) Pre-IRP Study (2020)
LOLE Target (days/yr) 0.10 0.10
Achieved LOLE (days/yr) 0.25 0.19
Achieved LOLh (hrs/yr) 1.99 1.29
PRM Target (UCAP) / (ICAP) 9% / 21% 9% / 21%
Achieved PRM (UCAP) / (ICAP) 6% / 18% 7 / 19%
The results above are consistent with Nova Scotia Power’s 2020 10-Year System Outlook Report. This
updated modeling indicates that a UCAP PRM of 9 percent continues to be appropriate for capacity
expansion planning in the near and long terms. Nova Scotia Power will continue to use the comparable
20 percent ICAP PRM Target, consistent with existing guidelines, for its near-term capacity reporting
requirements.
6.7 Operability
For select scenarios, Nova Scotia Power used the PLEXOS MT/ST module between the Initial and Final
Portfolio Studies in order to produce hourly production cost model outputs. These more granular
simulations were reviewed to ensure that dispatch and reserve requirements, thermal unit operating
parameters, and other model constraints were being correctly captured in IRP model.
This Operability Assessment phase was intended to identify any changes required before undertaking
the Final Portfolio Study. Nova Scotia Power conducted and reviewed hourly unit commitment
simulations in PLEXOS MT/ST for the following four scenarios:
• 2.0C – Low Electrification / Base DSM / Net-Zero 2050 / Regional Integration
• 2.1C – Mid Electrification / Base DSM / Net-Zero 2050 / Regional Integration
• 3.1C – Mid Electrification / Base DSM / Accelerated Net-Zero 2045 / Regional Integration
• 3.2C – High Electrification / Base DSM / Accelerated Net-Zero 2045 / Regional Integration

Nova Scotia Power 2020 IRP 99
The PLEXOS MT/ST simulations show that the key model constraints were able to be met in all hours for all years
modeled and the thermal unit operating constraints have been respected under the new resource plans, even
under high renewable penetrations observed in the 3.2C resource plan. Minor refinements to import constraints
were made so they would operate correctly in all hours for the Final Portfolio Study. The unit generation outputs of
the PLEXOS MT/ST simulations were generally consistent with the PLEXOS LT results, indicating that the selected
modeling parameters for PLEXOS LT were granular enough to be a sufficiently accurate representation of the
system.
6.7.1 Operating Reserve Provision
An item of interest in this IRP is an analysis of Operating Reserve provision, to understand whether any changes
to current operating practice are indicated by the IRP modeling results. The IRP model incorporates minimum
reserve requirements as defined by the Nova Scotia Power System Operator. Additional reserve requirements were
introduced in the IRP for incremental wind generation beyond the current 600 MW, as described in the IRP Final
Assumptions.
The IRP optimization model co-optimizes generation and reserve provision by integrating ancillary services and
reserve constraints into the mathematical framework, both during capacity expansion modeling (PLEXOS LT) and
production cost modeling (PLEXOS MT/ST). As a result, any reserve surplus beyond the minimum requirements
specified is part of the lowest-cost solution that also meets all modeled constraints.
A review of Operating Reserve in the IRP hourly Production Cost model output for Scenario 2.0C, covering years
2021 and 2022, indicates an average of 471 MW was carried by the model; this is similar to the average of 423
MW observed in the most recent two-year FAM audit period. Levels of operating reserve above the minimum
requirement come about as secondary outcomes of other economic dispatch optimizations and/or operational
factors.
6.8 Sensitivity Analysis In addition to the Final Portfolio Study, various model sensitivities were studied to understand how model outputs
will vary with adjustments to key input parameters of interest. For each of the 18 sensitivities, a new capacity
optimization run was completed, resulting in a new optimal resource plan. The change to the optimal portfolio
(including resource technology and timing) and cost impact provides important information on the criticality of
the sensitivity assessed. Many of these sensitivities were tested against key scenario 2.1C; this was selected as it
is a central scenario for many of the input parameters and is the low-cost plan at the Mid electrification level. The
detailed model outputs and additional results interpretation for these sensitivities are presented in the updated IRP
Modeling Results of October 30, 202053. The sensitivity results are summarized in the following categories: DSM
Levels, Wind, Mersey System, Imports, Sustaining Capital, and Fuel Prices.
6.8.1 DSM Levels
Nova Scotia Power recognizes that DSM is an important component of the overall resource plan development
and, accordingly, completed a robust analysis of the four DSM levels developed by EfficiencyOne (Low, Base, Mid,
and Max). This analysis included developing an initial DSM profile pairing for each of the 13 key scenarios, and
then creating a set of sensitivity runs that model alternate DSM levels against different assumptions for Resource
Strategy, GHG Trajectory and Coal Retirement Date, and Electrification Level. The list of seven DSM sensitivities
executed was developed in collaboration with EfficiencyOne.
Complete details on each of the DSM sensitivities is available in the modeling results file. In general, DSM programs
higher than the Base level resulted in increased costs to customers, on both an NPV basis and a relative rate basis.
Higher DSM programs also generally resulted in earlier coal retirement, less new-built gas capacity by 2045, and
lower CO2 emissions over time because the overall load level is lower.
53 Appendices E and F.

Nova Scotia Power 2020 IRP100
When comparing the significant number of DSM sensitivities studied, as shown in Figure 55, the Base
DSM profile is shown to be more economic across financial metrics (NPV and relative rate impact)
when compared to the Mid or Max DSM profiles at the Low and Mid levels of electrification, and when
considering both 2030 and 2040 coal retirement dates. When comparing the Low and Base DSM profiles
under Low electrification, the Base DSM profile is economic when compared using the primary metric
of 25-year NPVRR with end effects metrics while the Low DSM profile results in a lower relative rate
impact, particularly over the first 10 years of the planning horizon.
Figure 55. NPV Revenue Requirement and Relative Rate Impact
Comparison for DSM Sensitivities
25
-Ye
ar
NP
V R
eve
nu
e R
eq
uir
em
en
t ($
MM
)
Ave
rag
e A
nn
ua
l R
ela
tive
Ra
te E
ffe
ct
$14
$15
$16
$13
$12
$11
$10
3.0%
4.0%
6.0%
5.0%
2.0%
1.0%
0.0%Mid DSM Max DSM Mid DSM Max DSM Base DSM Mid DSMBase DSM Mid DSM Base DSM Mid DSM Low DSM Base DSM
Scenario 3.1CMid Electrification
Acc. Net Zero 2045 Regional Integration
Scenario 2.2CHigh Electrification
Net Zero 2050 Regional Integration
Scenario 2.1CMid Electrification
Net Zero 2050 Regional Integration
Scenario 2.0CLow Electrification
Net Zero 2050 Regional Integration
Scenario 2.0ALow Electrification
Net Zero 2050 Current Landscape
1.90%
1.50%
1.20% 1.30%1.40%
0.80%
1.50%
1.10%
0.80% 0.80%
1.20%
0.40%
25yr NPVRR 2021-2030 Avg. Relative Rate Effect
6.8.2 Wind
Nova Scotia Power tested a series of sensitivities to investigate the potential impact of technology cost
and integration requirements on both the level and timing of wind capacity builds. The results of the first
two scenarios, 2.1C.WIND-1 (Low Wind) and 2.1C.WIND-2 (Low Wind + Low Battery), both indicate earlier
installation of significant levels of wind. These builds are advanced from 2030 to the mid 2020s, while
the overall resource portfolio in 2045 remains very similar to the base case. The Reliability Tie is also
advanced to enable wind integration. The earlier wind energy seen in these scenarios also enables an
additional early coal unit retirement relative to the base case. Earlier builds of wind generation enable
a drop in CO2 emissions between 2025 and 2030; emissions in 2031-2045 are largely unchanged. These
sensitivity results indicate that the timing of wind development is sensitive to the cost of the new wind
resources available.

Nova Scotia Power 2020 IRP 101
A lower synchronized inertia requirement of 2200 MW.sec (3266 MW.sec in the base case) was modeled
in scenario 2.1C.WIND-3 and is shown to have a limited impact on overall resource plans. There are slight
changes in the timing of building new wind, thermal units, and transmission lines, but the impact on
resource plans and NPVRR is minimal. This is interpreted as indicating that determining the exact level
of synchronized inertia required for stability and reliability on the Nova Scotia system, within the range
of 2200 – 3266 MW.sec, is not critical for capacity expansion planning purposes.
A final run was conducted as a boundary case test of wind integration assumptions, 2.1C.WIND-4. In this
scenario, the synchronized inertia constraint and the wind integration requirements (via the Reliability
Tie and/or batteries and synchronous condensers) are both removed completely. The installed wind
capacity under this scenario follows a generally similar trajectory to the other wind sensitivities (the
timing of capacity additions is roughly between the base case and low price sensitivity) until the mid
2030s, at which point the model continues to add significant capacity due to the removal of wind
integration requirements. This late wind additions incur significant curtailment (jumping from 5.2
percent in the base case to 13.4 percent in 2045), resulting in an NPV that is lower than, but relatively
close to, the base case and suggesting that further analysis is required for incremental wind additions
beyond those identified in the base scenarios and low price sensitivities. This run is intended as a test
case to understand how the model performs with no synchronized inertia constraint and no integration
requirements for wind; it is not considered to be an operable resource plan based on these assumptions.
6.8.3 Mersey System
The Mersey Hydro system was analyzed during the Resource Screening phase of the IRP (described
in Section 4.2.2) and economically retained, based on the assumptions developed from Nova Scotia
Power’s Hydro Asset Study (HAS). This resulted in the Mersey system being modeled as retained in all
IRP key scenarios and sensitivities. However, due to the significant costs associated with redeveloping
the Mersey system (as described in the HAS), IRP participants expressed a desire to examine the Mersey
system specifically via a PLEXOS sensitivity. Sensitivity 2.1C.MERSEY models how capacity and energy
would optimally be replaced if the Mersey system is assumed to retire in 2025 rather than proceed with
redevelopment. In order to properly compare the financial metrics of this sensitivity, the cost of the
Mersey system decommissioning is added to the sensitivity outside of the model as an extrinsic cost.
The optimized resource portfolio of the sensitivity run indicates that Regional Integration is advanced
by six years relative to the base case, and significant wind build occurs in 2030 rather than 2032. By
the end of the planning horizon, the resource portfolio is very similar to the base case but with 40 MW
of incremental CT capacity accounting for the retirement of the Mersey system. Replacement energy is
sourced from a combination of gas and imports.
The results of this sensitivity indicate that redevelopment of the Mersey system is economic relative
to decommissioning when comparing the 25-year NPVRR with end effects. The sensitivity is shown to
be equivalent to the base case in terms of relative rate impact, while the decommissioning sensitivity
was indicated a lower cost under the shorter NPVRR metrics (25-year without end effects and 10-year

Nova Scotia Power 2020 IRP102
NPVRR). Nova Scotia Power notes that these are very close results in all cases, particularly for a long-
lived hydro asset like the Mersey system; accordingly, additional economic analysis will be provided in
any capital applications for Mersey system refurbishment.
6.8.4 Imports
Because Regional Integration and the Reliability Tie play a key role in many of the optimal resource
plans developed for the key scenarios, three import sensitivities were modeled in order to evaluate
the robustness of this finding. All three show a relatively limited impact on the overall model results.
The first, 2.1C.IMPORT-1, reduced the annual volume of non-firm imports available to the model.
Under this scenario, the model builds wind earlier and adds an additional natural gas combined-cycle
unit as an energy source, indicating this is the next best alternative to imported energy that fits within
the modeled emissions constraints. The cost of this sensitivity increases significantly relative to the
base case.
In the key scenarios modeled under the Current Landscape resource strategy, the Reliability Tie is still
eligible to be built and was selected economically in all cases as a method of enabling wind integration
and satisfying synchronized inertia constraints. Sensitivity 2.0A.IMPORT-2 models a Current Landscape
case without the ability to build the Reliability Tie. In this case, wind is built via the local integration
option (batteries + synchronous condensers), which also contribute to system inertia requirements.
The total quantity of wind built is less and batteries are added for wind integration. The remainder of
the resource plans are similar and the financial metrics, including NPVRR and relative rate impact, are
higher compared to the base case. This result provides additional information on some of the value of
the Reliability Tie, when isolated from its contribution to a larger Regional Integration build.
Nova Scotia Power also modeled a sensitivity (2.1C.IMPORT-3) to test the criticality of the assumption
that the Reliability Tie can supply all the power system’s synchronized inertia requirements. In this
scenario, the Reliability Tie contributes only 50 percent of required system inertia once built (i.e.
1633 MW.sec). Results show that the Reliability Tie and Regional Integration are built slightly earlier
in this scenario, with some accompanying earlier retirements as well. These resource mix changes
are interpreted as reactions to the model finding more economic ways (other than large steam units
with long minimum up and down times) to satisfy the remaining 1633 MW.sec of synchronized inertia
requirement. The generation mix is generally unchanged from the base case on an annual basis and
the resulting costs are somewhat higher on all NPV metrics. The results of this scenario indicate that
the IRP assumption that the Reliability Tie provides all the Nova Scotia System’s synchronized inertia
requirement is not critical to the value of that asset.
6.8.5 Sustaining Capital
Evaluating ongoing sustaining capital investments for existing generating units is an important part of
the IRP process. In particular, during this period of significant system transformation, the sustaining
capital investments in units which will be retiring during the planning horizon are evaluated to confirm
at what levels they continue to be economically sustained, or to understand where retirement decisions
Nova Scotia Power 2020 IRP 103
might change. Replacement energy and capacity alternatives are considered in the IRP process, and are
compared to future capital investment requirements to maintain safe and reliable operation of existing
units to match with each unit’s expected operating profile.
In addition to the base sustaining capital forecast that was included in the IRP key scenarios, Nova
Scotia Power developed and evaluated two alternate sustaining forecasts. The High sustaining capital
forecast assumes a 50 percent increase from the base forecast, while the Low sustaining capital
forecast assumes a 25 percent decrease from the base forecast. In the sensitivities described here,
these adjustments were applied to all thermal steam units (all coal units, and Tufts Cove units 1-3).
Under sensitivity 2.1C.CAPEX-1 (High Sustaining Capital), there are a small number of changes in the
resource plan. One coal unit retirement is advanced from 2040 to 2030, and one additional gas steam
unit is retired in 2026. The remaining thermal units are sustained economically until their model-
imposed retirement date. The earlier capacity retirements are replaced by advancing builds of the
Reliability Tie / Regional Interconnection, and new combustion turbine builds.
Under sensitivity 2.1C.CAPEX-2 (Low Sustaining Capital), there is no change to the gas steam unit
retirements from the base case. The early coal unit retirement previously seen in 2023 is deferred until
2038, while the Reliability Tie and Regional Interconnection are built one to two years later than in the
base case. New combustion turbine and wind builds are delayed to match coal unit retirements, but the
final resource plan in 2045 is essentially unchanged from the base case.
These sensitivities demonstrate that the resource plan developed in the base case is generally robust
to a wide range of sustaining capital profile adjustments; timing of retirements and additions may be
adjusted but the components of the final resource plan are consistent. These results also demonstrate
that maintaining the existing coal fleet to the model-imposed retirement date is the most economic
option for Nova Scotia Power customers within the range of sustaining capital cost evaluated.
6.8.6 Gas and Import Prices
The optimal resource plans developed for the key scenario runs show that both new gas generation and
new firm imports are selected as common resources across scenarios as part of the overall strategy
to replace retiring coal capacity. In order to test the robustness of this result, Nova Scotia Power
determined it would be important to test a high-sensitivity case for both natural gas and import power
prices. The results of this analysis are provided in sensitivity 2.1C.PRICES-1.
The results show only minor adjustments to the resource plan in the face of higher prices. There is
an additional gas steam unit retirement and a one-year delay in the construction of the Regional
Interconnection, both reflecting the price change. There are also small increments to solar and battery
capacity late in the planning horizon relative to the base case. The overall resource plan cost and
relative rate impact metrics are higher than the base case, as would be expected due to the increased
commodity prices. This consistency in the resource plan indicates that the Regional Integration strategy
and the common plan elements seen across IRP key scenario results are robust to a high commodity
price environment.

Nova Scotia Power 2020 IRP104
7.1 Key Findings
The Key Findings are compiled from the modeling results and other observations developed throughout
the IRP Process, including the outputs of the Pre-IRP Deliverables. They are intended to capture the
major outputs of the work as well as feedback from IRP participants where applicable. The Key Findings
inform the IRP Action Plan and Roadmap that follow.
Steeply reducing carbon emissions in line with Nova Scotia’s Sustainable Development Goals
Act will require significant efforts from each sector of the economy, with the electricity
sector playing a major role.
1a Key pillars of economy-wide decarbonization include greater reliance on non-emitting
electricity supplies, focused demand side management, and electrification of end uses
currently reliant on fossil fuels. This result is informed by the Deep Decarbonization
Pathways report, which was completed during the pre-IRP phase. This study evaluated feasible
pathways for economy-wide decarbonization of at least 80 percent by 2050, a prerequisite
on the path to the net-zero target set by the SDGA. In particular, this work showed that low-
carbon electricity is essential to achieving economy-wide decarbonization, enabling emissions
reductions in the electricity sector as well as complementary reductions in buildings and
transportation. The analysis also demonstrated that building and transportation sectors –
which make up over 40 percent of Nova Scotia’s emissions today – can dramatically reduce
emissions through adoption of heat pumps and electric vehicles. These new sources of load will
require the utility to engage in proactively managing potential associated peak impacts. For
additional detail on this work, please see the report.54
1b Increased electricity sales due to electrification can help to reduce upward pressure
on electricity rates while facilitating carbon reductions in other sectors. The IRP rate
analysis demonstrates the importance of managing the relative growth of peak and
energy requirements, highlighting the need to pursue beneficial electrification.
54 Appendix A, Energy + Environmental Economics (E3), Deep Decarbonization in Nova Scotia: Phase 1 Report, February 2020.
KEY FINDINGS, ACTION PLAN, AND ROADMAP7
1

Nova Scotia Power 2020 IRP 105
This finding is based on the results of the relative rate impact analysis which was conducted
using the Final Portfolio Study results. This analysis showed that higher fixed system costs
associated with increased levels of electrification are being distributed over a larger number
of sales units, reducing the average unit cost. See section 6.5 for additional detail on the
relative rate impact model created for this IRP. The impact of the relative growth of peak and
energy requirements is most clearly observed when evaluating the Distributed Resources
(B) scenarios, where energy requirements are reduced significantly while peak requirements
are unchanged; this extreme case is shown to have a higher relative rate impact than other
scenarios.
1c Nova Scotia Power’s direct carbon emissions are reduced to between 0.5 MT and 1.4 MT
per year by 2045 in all resource plans, representing an 87-95 percent reduction from
2005 levels. Earlier emissions reductions are possible at incremental cost relative to
the lowest cost plans. Nova Scotia Power’s direct carbon emissions in 2005 measured 10.6
MT. Significant emissions reductions have already occurred since that time, with Nova Scotia
Power’s 2019 emissions measuring 6.6 MT. Both SDGA-compliant emissions curves modeled
in the IRP require further emissions reductions, down to levels of 1.4 MT (Net-Zero 2050) and
0.5 MT (Accelerated Net-Zero 2045), representing reductions of 87 percent and 95 percent
respectively. Many of the modeled resource plans achieve emissions reductions below these
caps, particularly in the intermediate years of the planning horizon, as the generation mix
transitions away from carbon-intensive sources and coal units retire.
Decarbonizing Nova Scotia Power’s electricity supply will require investment in a diverse
portfolio of non- and low-emitting resources.
2a Regional Integration (i.e. investment in stronger interconnections to other jurisdictions)
is an economic component of the lowest-cost plans under each load scenario. Both
the Reliability Tie, which strengthens the connection to the North American electrical
grid, and a Regional Interconnection, which enables access to firm capacity and energy
imports, are shown to have value. This finding draws on the breadth of the IRP analysis
plan and modeling results. When compared on a level basis (holding load, DSM, and emissions
constraints constant and including the low cost estimate of the DER resources, when
present), the Regional Integration (C) scenarios are demonstrated to have a lower NPVRR
than equivalent Current Landscape (A) or Distributed Resources (B) scenarios for all seven
comparisons modeled.
The Reliability Tie is used in the IRP model to enable wind integration per the pre-IRP
Renewable Stability Study and to reduce system synchronized inertia requirements. Additional
2

Nova Scotia Power 2020 IRP106
reliability benefits of this investment and potential effects on contingencies were not modeled
in the IRP. The Reliability Tie was enabled in Current Landscape (A) cases as a wind integration
tool, and in addition for the Distributed Resources (B) and Regional Integration (C) cases the
Reliability Tie could be constructed as the first phase of a larger Regional Interconnection
transmission investment. In all cases, including sensitivities that reduced the modeled inertia
benefit, the Reliability Tie is selected and in sensitivity 2.0A.IMPORT-2 where it was not allowed
to be built, the resulting resource plan was $356 million more expensive.
Regional Integration was modeled as availability of both firm capacity and energy from
jurisdictions external to Nova Scotia. The model was able to procure each resource (capacity
and energy) to the level required once it had made the capital investment in required
transmission infrastructure. Nova Scotia Power observes the model utilizing this flexibility in
the results, as firm capacity purchases are generally added gradually as coal units are retired.
Firm capacity could be purchased in 50 MW blocks up to a total of 450 MW while energy
could be scheduled hourly in the model, with no minimum or maximum monthly or annual
limits beyond the capacity of the tie itself. Like the Reliability Tie, Regional Integration was
selected economically in every resource plan where it was offered to the model; timing of the
investment generally varied with timing of coal unit retirements.
Distributed Resources (B) scenarios are shown to have higher cost NPV values than Regional
Integration (C) scenarios once a low-range estimate of DER cost is incorporated into the
results; these scenarios are also shown to have a significantly higher relative rate impact and
as a result are not selected for incorporation into the IRP Action Plan.
2b Wind is the lowest cost domestic source of renewable energy and is selected
preferentially over solar in all resource plans. Incremental wind capacity in the range of
500 - 800 MW is selected by the model by 2045, with major installations paired with
coal retirement dates to provide replacement emissions-free energy. The availability of
lower priced wind is shown to accelerate the wind buildout in the mid-2020s, with up to
600 MW selected under the modeled low wind price, mid-electrification sensitivity.
To enable wind additions beyond what was studied in the pre-IRP analysis (more than
100 MW incremental with the current system, or more than 400 MW incremental
with identified wind integration investments), additional system stability studies are
required. Wind resources are a significant addition in all resource plans modeled during this
IRP. Onshore wind is the lowest-cost renewable energy resource based on the base LCOE
assumptions developed at the start of the IRP. The incremental capacity of 500-800 MW

Nova Scotia Power 2020 IRP 107
identified above is drawn from the range of Low and Mid electrification modeling results;
under High electrification scenarios, this number can range higher as increased load enables
additional wind integration on the system.
Due to the significance of wind to the resource plans, numerous sensitivities were developed
and modeled to explore the behaviour of the system. These included both sensitivities on
price (2.1C.WIND-1 Low Wind Cost, 2.1C.WIND-2 Low Wind + Low Battery Cost) and boundary
cases on integration requirements (2.1C.WIND-3 Low Inertia, 2.1C.WIND-4 No Inertia / No
Integration Requirements). These results indicated that the model is sensitive to resource cost
when determining the timing of wind additions, but that the final quantity selected was similar.
Results also indicate that lowering the inertia constraint from 3266 MW.sec to 2200 MW.sec
(2.1C.WIND-3) did not have a significant change in terms of wind capacity or timing, indicating
that this is not a critical assumption for wind modeling. The boundary case of no synchronized
inertia constraint + no wind integration requirements (2.1C.WIND-4) indicates that the removal
of these constraints does not enable a wind buildout beyond the range identified between
the base and low price sensitivities until the mid-2030s; as discussed in Section 6.8.2, results
beyond that point suggest that further analysis is required for significant wind additions
beyond those modeled in the base cases.
Solar resources are selected in limited quantities late in the planning horizon (2043+) under
scenarios following the Accelerated Net-Zero 2045 trajectory; solar generation provides an
emissions-free energy resource under these very low emission scenarios but is less well suited
than wind to Nova Scotia’s system needs due to lower annual capacity factors (resulting in
a higher energy cost) and a solar generation profile that is highest in the summer months
(while Nova Scotia’s load is winter-peaking load).
2c Coal units are generally sustained economically until their model-imposed retirement
date, with capacity factors falling in line with declining emissions caps. Many resource
plans incorporate economic retirement of one coal unit in the near term, as early as
2023, and some plans see economic retirement of a second coal-fired unit in 2030. New
firm capacity is required to offset retiring coal units, to lower carbon emission intensity,
and to meet growing electricity demand in all scenarios. It is shown that across the 13
key scenarios modeled, six incorporate a coal unit retirement in 2023. These retirements are
tied to replacement capacity availability, generally via Regional Integration but occasionally
enabled by new combustion turbine capacity (e.g. 2.1A). Of the nine key scenarios where coal
units must retire by 2040, three retire a second coal unit in 2030 (and a fourth scenario
retires two units by 2031).

Nova Scotia Power 2020 IRP108
In all scenarios, the majority of coal units are sustained economically until the final years
before their model-imposed retirement dates (2030 or 2040), in alignment with the constraint
limiting thermal unit retirements to a maximum of three per year. The lack of current capacity
surplus, and flat or growing firm peak requirements in all scenarios, demonstrates that new
sources of capacity are required in all cases to enable coal unit retirements.
2d Nova Scotia Power’s existing domestic Hydro resources provide economic benefit
to customers and are economically sustained through the planning horizon with the
modeled level of sustaining capital investment. Economic justification as part of a capital
application will be required to confirm decision to pursue Mersey hydro redevelopment,
following the completion of the IRP. Nova Scotia Power’s existing hydro systems were
analyzed during the Resource Screening phase of the IRP. This analysis showed that all
hydro systems were sustained economically while incorporating the sustaining capital and
decommissioning costs produced by Nova Scotia Power’s Hydro Asset Study, which was
reviewed with IRP participants during the assumptions development phase of the IRP. This
analysis led to all existing hydro systems being modeled as sustained in the PLEXOS IRP
scenarios.
The Mersey hydro system was additionally evaluated via a specific sensitivity (2.1C.MERSEY),
as described in Section 6.8.3. The results of this sensitivity indicate that redevelopment of
that hydro system is economic relative to decommissioning when comparing the 25-year
NPVRR with end effects. The two scenarios were shown to be equivalent in terms of relative
rate impact, while the decommissioning case was lower cost when examining the shorter
NPVRR metrics (25-year without end effects and 10-year NPVRR). Nova Scotia Power notes
that these are very close results in all cases, particularly for a long-lived hydro asset like
the Mersey system; accordingly, additional economic analysis will be provided in any capital
applications for Mersey system refurbishment.
2e DSM energy efficiency programs and costs in the range of the “Base” profile, per the
EfficiencyOne 2019 Potential Study, are shown to be most economic relative to other
options evaluated under the primary IRP metric of 25-year NPV of Revenue Requirement
(with end effects). A focus on peak demand mitigation is indicated and could be optimized
into future DSM planning. Other levels of DSM in resource plan sensitivities show higher
NPVRR with end effects, as well as mixed effects on other metrics, when compared to
Base DSM; Low DSM levels are shown to reduce relative rate impact, while Mid DSM
levels are shown to reduce new capacity requirements and GHG emissions, both at
a higher NPVRR. Due to the discrete nature of the DSM profiles modeled in the IRP,
53 Appendix A, Energy + Environmental Economics (E3), Deep Decarbonization in Nova Scotia: Phase 1 Report, February 2020.

Nova Scotia Power 2020 IRP 109
future DSM program development should incorporate the learnings obtained from the
full range of sensitivities and metrics considered in the IRP. DSM has been an important
variable in this IRP, and Nova Scotia Power has modeled numerous DSM scenarios in both the
key scenarios and sensitivities, incorporating significant engagement with EfficiencyOne as
discussed in section 6.8.1.
Firm capacity resources will be a key requirement of the developing Nova Scotia Power
system in both the near and long term.
3a New combustion turbines, operating at low capacity factors, are currently the lowest-
cost domestic source of firm capacity and replace retiring thermal capacity in all
resource plans. These units are also fast-acting, meaning they can quickly respond
to changes in wind and non-firm imported energy. 50-150 MW is required by 2025,
while 600-1000 MW of new capacity is required by 2045 to support retirement of
steam units. New combustion turbines are added economically in all resource plans over
the planning horizon. The capacity ranges identified in this finding cover the range of Low
and Mid electrification key scenarios, with High electrification scenarios showing increased
capacity by 2045 in some cases. It is noted that in the Current Landscape (A) scenarios,
combustion turbine capacities are higher due to the lack of firm capacity available from the
Regional Interconnection. Significant resource additions are generally paired with steam unit
retirements. Average annual capacity factors for the new combustion turbine units are less
than 10 percent in most years when examining PLEXOS MT/ST results.
3b Nova Scotia Power’s existing combustion turbine resources provide economic benefit
to customers and are economically sustained through the planning horizon with the
modeled levels of sustaining capital investment. Nova Scotia Power’s existing combustion
turbines were analyzed during the Resource Screening phase of the IRP. This analysis showed
that the retention of all seven existing diesel units was economic by a significant margin under
a range of scenarios and sensitivities, indicating that these units continue to be a valuable
source of both firm capacity and ancillary grid services.
3c Low-cost, low emitting generating capacity may be provided economically from coal-
to-gas unit conversions, which are selected economically in many resource plans.
Coal-to-Gas Conversions were selected economically in eight of 13 key scenarios as part
of meeting capacity requirements. These resources are dispatched as firm capacity resources
enabling coal capacity retirements. Average annual capacity factors for the new combustion
turbine units are less than 5 percent in all years when examining PLEXOS MT/ST modeling
results.
3

Nova Scotia Power 2020 IRP110
3d Battery storage can enable wind integration while providing firm capacity and energy
storage; however, its ability to substitute for firm capacity resources is limited by its
relatively short duration. Up to 120 MW of storage by 2045 is selected in the portfolios
with deployments of 30-60 MW by 2025 in many plans. Battery storage was an integration
method for wind capacity beyond 100 MW incremental which was identified during the pre-IRP
PSC study and modeled paired with high-inertia synchronous condensers. The ELCC of battery
storage was modeled specifically on the Nova Scotia system for several storage durations as
part of the E3 Capacity Study, also completed during the pre-IRP phase. In the IRP modeling
results, there is a moderate amount of battery storage added across the key scenarios with
the ranges above being representative of all scenarios modeled.
3e The aggregated Demand Response programs modeled in the IRP have economic value to
the Nova Scotia system, offsetting firm generation capacity requirements. A DR program
with a target final nameplate capacity of approximately 75 MW is shown to have value
across all resource plans under IRP cost assumptions, while higher DR capacity is shown
to be economic under high electrification scenarios. The DR programs modeled in the IRP
were taken from EfficiencyOne’s Potential Study, completed during the pre-IRP phase. That
study produced three DR programs, which are paired with one of the four DSM profiles for
modeling in the IRP. The DR programs are modeled using a fixed capacity and cost profile, with
three potential entry points (2021, 2025, and 2030). The IRP modeling results show that DR
programs are selected in all resource plans in either 2021 or 2025. The target capacity of 75
MW is based on the size of the program paired with the Base DSM profile, however it is noted
that in High electrification scenarios paired with the Max DSM profile, an approximately 100
MW DR program is available and selected economically.
3f A Planning Reserve Margin of 9 percent (on a UCAP basis, consistent with 20 percent
on an ICAP basis for the current resource mix) is found to maintain supply reliability
across the studied range of resource plans and electrification scenarios. The E3 Capacity
Study, completed during the pre-IRP phase, confirmed that an ICAP PRM of 20 percent with
Nova Scotia Power’s current generation resources was within the range of PRM targets (17.8-
21 percent) required to achieve the 1-day-in-10-years loss of load criteria that Nova Scotia
Power is required to meet. This target is equivalent to a 9 percent PRM on a UCAP basis (for
additional detail on ICAP and UCAP methodologies please see Section 3.1.1). As recommended
by IRP participants, Nova Scotia Power used the effective capacity values and UCAP PRM
requirements to constrain the capacity expansion models. After the initial portfolio study
phase was completed, Nova Scotia Power engaged E3 to complete a Reliability Screening
study of three initial resource plans (one at each level of electrification). This study confirmed

Nova Scotia Power 2020 IRP 111
that the three resource plans met the 1-day-in-10-years reliability criteria through the end of
the planning horizon (2045), and further that the indicated capacity surplus was relatively
small in each case, indicating that the 9 percent UCAP criteria continues to be appropriate
for planning purposes throughout the planning horizon and that the resource plans
developed during the IRP are reliable. An update of the pre-IRP capacity study to account
for assumptions that were revised during the IRP also validated the 9% UCAP PRM Target as
being appropriate.
The SDGA-compliant key scenario which minimizes the cumulative present value of the
annual revenue requirement of the 25-year planning horizon (adjusted for end effects) is
2.0C (Low Electrification / Base DSM / Net-Zero 2050 / Regional Integration).
4a During the Action Plan 5-year horizon, resource plans 2.0C and 2.1C (among others)
include many common resource investments and retirement trajectories. This
commonality informs Nova Scotia Power’s IRP Action Plan and ensures the resulting
long-term electricity strategy is robust to a broad range of potential futures. One of the
objectives of Nova Scotia Power’s IRP is to produce a robust long-term electricity strategy that
can withstand realistic potential changes to key assumptions. By developing an Action Plan
and Roadmap which are informed by a range of key scenarios, Nova Scotia Power is in part
assuring that multiple potential futures are considered during the Action Plan horizon and that
no-regrets options are prioritized.
4b Similar resource plans are selected when considering both 2030 and 2040 coal unit
retirement dates. The earlier retirement scenarios are less economic on an NPV basis but
have similar cumulative rate implications by 2045. Nova Scotia Power has modeled both
2040 mandatory coal retirements and 2030 mandatory coal retirements. The IRP modeling
results indicate that the 2030 scenarios are higher cost on an NPV basis and on a relative
rate comparison basis than the 2040 scenarios, but that they have lower GHG emissions over
the planning horizon due to the earlier coal retirements. The lowest cost resource strategy
by 2045 is robust to either retirement date, indicating that Regional Integration strategy
is preferred and a no-regrets option. This observation indicates that Nova Scotia Power
should continue to monitor for external factors that could influence coal retirement dates or
provide opportunities to reduce the cost and relative rate gap between 2040 and 2030 coal
retirement scenarios.
4

Nova Scotia Power 2020 IRP112
7.2 Action Plan
As set out in the IRP Terms of Reference, The IRP Action Plan describes the key tasks to be undertaken
in the next five years to implement the long-term electricity strategy. These Action Plan items are built
on the items identified as Key Findings, and further informed by the modeling results and observations.
Develop a Regional Integration Strategy to provide access to firm capacity and low-carbon
energy while increasing the reliability of Nova Scotia’s interconnection with North America.
This Strategy will include:
1a Identifying opportunities for near-term firm imports over existing transmission infrastructure
1b Immediately commencing the development of a Reliability Tie and Regional Interconnection via
an appropriate regulatory process with target in-service dates as follows:
• Reliability Tie: 2025-2029 (or earlier if practical and feasible)
• Regional Interconnection: 2027-2035
1c In parallel with Regional Interconnection development, and working with neighbouring
jurisdictions, conducting detailed engineering and economic studies for firm import options
requiring new transmission investment and strengthened regional interconnections, including
evaluations of availability and security of supply, emissions intensity, and dispatch flexibility.
This work will proceed in parallel with the wind procurement strategy (Action Item 3d, below)
and will include supporting transmission planning studies.
Electrification is a key variable in this IRP and results indicate that under economic resource
plans it can support provincial decarbonization while reducing upward pressure on electricity
rates for customers. NS Power proposes several Action Plan items from this IRP related to
electrification:
2a Initiate an Electrification Strategy to develop options for encouraging beneficial electrification
with the goals of maintaining rate stability while decarbonizing the Nova Scotia economy
consistent with the Sustainable Development Goals Act. The Electrification Strategy will:
• Incorporate industry best practices such as those identified by the Regulatory Assistance
Project55 as well as other relevant work, for example, electrification programs in other
jurisdictions and the details already contained in the Deep Decarbonization Pathways
report.
55 Farnsworth, D., Shipley, J., Lazar, J., and Seidman, N. (2018, June). Beneficial electrification: Ensuring electrification in the public interest.
Montpelier, VT: Regulatory Assistance Project. (raponline.org)
1
2
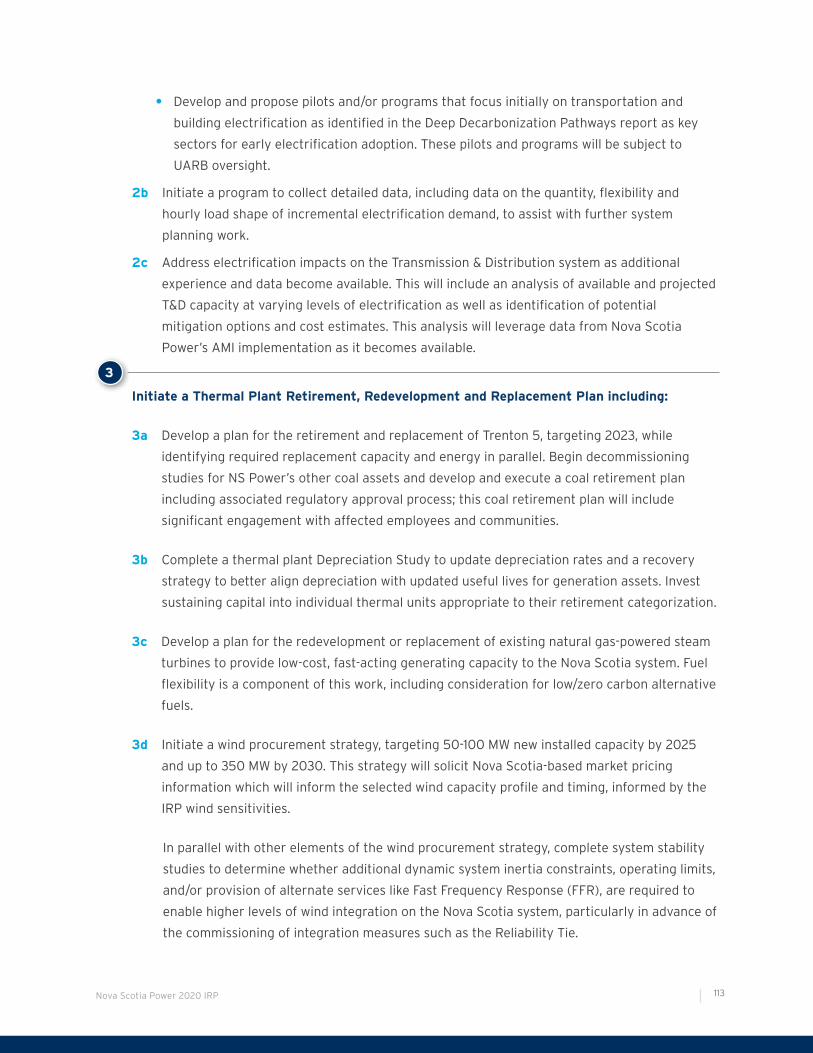
Nova Scotia Power 2020 IRP 113
• Develop and propose pilots and/or programs that focus initially on transportation and
building electrification as identified in the Deep Decarbonization Pathways report as key
sectors for early electrification adoption. These pilots and programs will be subject to
UARB oversight.
2b Initiate a program to collect detailed data, including data on the quantity, flexibility and
hourly load shape of incremental electrification demand, to assist with further system
planning work.
2c Address electrification impacts on the Transmission & Distribution system as additional
experience and data become available. This will include an analysis of available and projected
T&D capacity at varying levels of electrification as well as identification of potential
mitigation options and cost estimates. This analysis will leverage data from Nova Scotia
Power’s AMI implementation as it becomes available.
Initiate a Thermal Plant Retirement, Redevelopment and Replacement Plan including:
3a Develop a plan for the retirement and replacement of Trenton 5, targeting 2023, while
identifying required replacement capacity and energy in parallel. Begin decommissioning
studies for NS Power’s other coal assets and develop and execute a coal retirement plan
including associated regulatory approval process; this coal retirement plan will include
significant engagement with affected employees and communities.
3b Complete a thermal plant Depreciation Study to update depreciation rates and a recovery
strategy to better align depreciation with updated useful lives for generation assets. Invest
sustaining capital into individual thermal units appropriate to their retirement categorization.
3c Develop a plan for the redevelopment or replacement of existing natural gas-powered steam
turbines to provide low-cost, fast-acting generating capacity to the Nova Scotia system. Fuel
flexibility is a component of this work, including consideration for low/zero carbon alternative
fuels.
3d Initiate a wind procurement strategy, targeting 50-100 MW new installed capacity by 2025
and up to 350 MW by 2030. This strategy will solicit Nova Scotia-based market pricing
information which will inform the selected wind capacity profile and timing, informed by the
IRP wind sensitivities.
In parallel with other elements of the wind procurement strategy, complete system stability
studies to determine whether additional dynamic system inertia constraints, operating limits,
and/or provision of alternate services like Fast Frequency Response (FFR), are required to
enable higher levels of wind integration on the Nova Scotia system, particularly in advance of
the commissioning of integration measures such as the Reliability Tie.
3
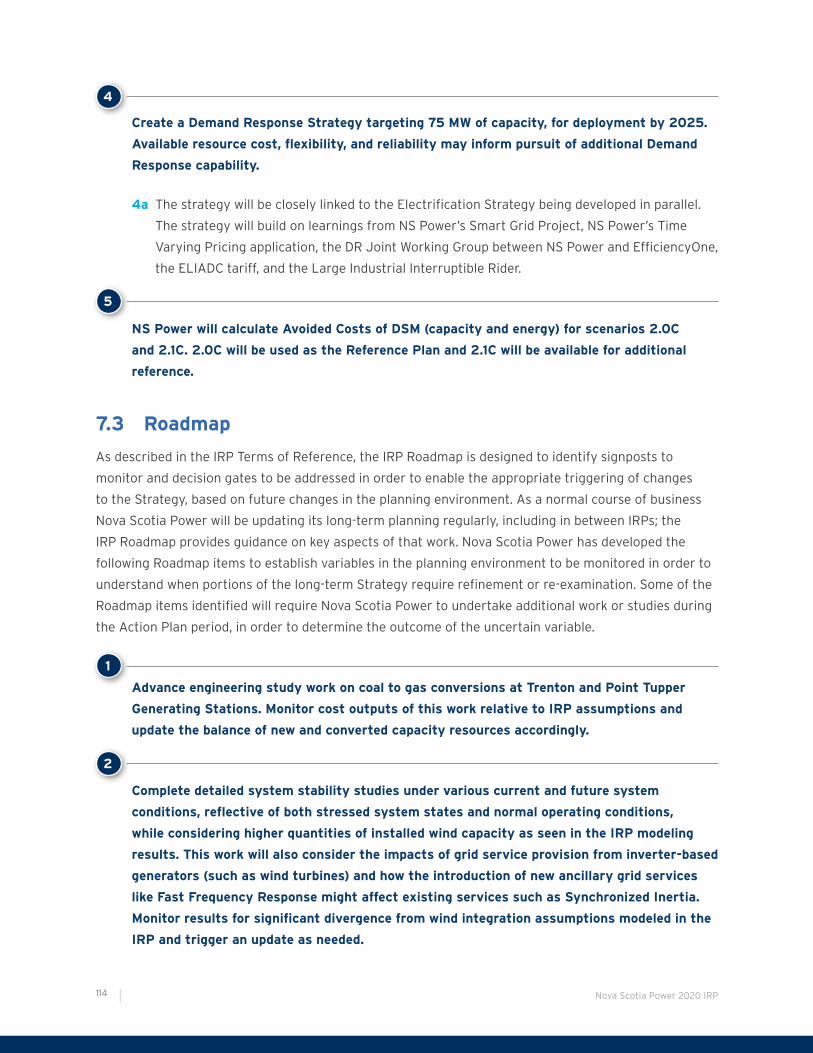
Nova Scotia Power 2020 IRP114
Create a Demand Response Strategy targeting 75 MW of capacity, for deployment by 2025.
Available resource cost, flexibility, and reliability may inform pursuit of additional Demand
Response capability.
4a The strategy will be closely linked to the Electrification Strategy being developed in parallel.
The strategy will build on learnings from NS Power’s Smart Grid Project, NS Power’s Time
Varying Pricing application, the DR Joint Working Group between NS Power and EfficiencyOne,
the ELIADC tariff, and the Large Industrial Interruptible Rider.
NS Power will calculate Avoided Costs of DSM (capacity and energy) for scenarios 2.0C
and 2.1C. 2.0C will be used as the Reference Plan and 2.1C will be available for additional
reference.
7.3 Roadmap
As described in the IRP Terms of Reference, the IRP Roadmap is designed to identify signposts to
monitor and decision gates to be addressed in order to enable the appropriate triggering of changes
to the Strategy, based on future changes in the planning environment. As a normal course of business
Nova Scotia Power will be updating its long-term planning regularly, including in between IRPs; the
IRP Roadmap provides guidance on key aspects of that work. Nova Scotia Power has developed the
following Roadmap items to establish variables in the planning environment to be monitored in order to
understand when portions of the long-term Strategy require refinement or re-examination. Some of the
Roadmap items identified will require Nova Scotia Power to undertake additional work or studies during
the Action Plan period, in order to determine the outcome of the uncertain variable.
Advance engineering study work on coal to gas conversions at Trenton and Point Tupper
Generating Stations. Monitor cost outputs of this work relative to IRP assumptions and
update the balance of new and converted capacity resources accordingly.
Complete detailed system stability studies under various current and future system
conditions, reflective of both stressed system states and normal operating conditions,
while considering higher quantities of installed wind capacity as seen in the IRP modeling
results. This work will also consider the impacts of grid service provision from inverter-based
generators (such as wind turbines) and how the introduction of new ancillary grid services
like Fast Frequency Response might affect existing services such as Synchronized Inertia.
Monitor results for significant divergence from wind integration assumptions modeled in the
IRP and trigger an update as needed.
4
5
1
2

Nova Scotia Power 2020 IRP 115
Pursue economic reinvestment in existing hydro and combustion turbines with individual
capital applications as applicable; economic justification as part of a capital application will
be required to confirm decision to pursue Mersey hydro redevelopment. Continue sustaining
capital investment in thermal units, aligned with their projected retirement classification.
Monitor required levels of sustaining capital investment for significant changes from IRP
assumptions and, if observed, trigger a unit-specific analysis of alternatives. Monitor unit
reliability for significant changes from IRP assumptions and, if observed, trigger an ELCC
calculation and/or PRM study as required.
Monitor the development of low/zero carbon fuels that could replace natural gas in powering
generating units to provide firm, in-province capacity.
Continue to track the installed costs of wind, solar, and energy storage to look for variations
from the trajectories established in the IRP (in particular, monitoring for divergence from
the “Base” to the “Low” pricing scenarios as defined in the IRP Assumptions). Nova Scotia
Power will solicit Nova Scotia-based market information which will inform this as needed.
Work with E1 to monitor ongoing operational unit costs of DSM in Nova Scotia.
Track the ongoing development of the Nova Scotia Cap-and-Trade Program, including auction
results and developing regulations. In particular, monitor GHG market size for indications
that value from incremental allowance sales (beyond the projected economic emissions
reductions shown in the IRP results) can be incorporated into long-term resource planning
decisions with greater certainty. Significant changes in the value of incremental GHG
reductions could influence resource plan components including non-emitting generation
procurement, DSM levels, and coal retirement trajectories.
Monitor electrification growth in Nova Scotia to understand at what point the provincial load
profile starts to move from Low, to Mid, to High levels of electrification as defined in the IRP
Assumptions for firm peak and/or annual energy requirements. An observed transition will,
among other impacts, inform the use of DSM avoided costs in related proceedings and trigger
a PRM study using actual peak, energy, and load shape data.
Continuously refine the Action Plan and Roadmap items via an evergreen IRP process. This
process should facilitate annual updates as conditions change and technology or market
options develop, and as Action Plan items are completed or significantly advanced. NS Power
will include a summary of updates as part of IRP Action Plan reporting and will incorporate
the opportunity for stakeholder comment and feedback as part of the update process.
3
4
5
6
7
8