SRS RGA LabVIEW Development Kit · 2018-05-18 · RGA Application Note SRS Residual Gas Analyzer...
27
RGA Application Note SRS Residual Gas Analyzer SRS RGA LabVIEW Development Kit Important! • The drivers in the development kit are provided free of charge and AS IS. Support of any modification is solely the responsibility of the end user. • This kit was developed and tested under LabVIEW version 5.1. It was also tested for compatibility with LabVIEW version 6.0 (also known as LabVIEW 6i). At the time of writing, LabVIEW 6i is not fully backward compatible with LabVIEW 5.1, and two versions of the development kit are available. See the SRS website (http://www.thinksrs.com) and below for more details. • While the drivers were thoroughly tested, SRS makes no warranty (express or implied) on this software and assumes no responsibility for damage caused through using it. • SRS does not provide training in the use of LabVIEW, nor does SRS provide support for LabVIEW. Contact National Instruments, Incorporated (telephone 1-800-433-3488 or on the internet at http://www.ni.com) for training and support of LabVIEW. • This appendix assumes familiarity with the LabVIEW programming environment. It also assumes familiarity with the implementation of Virtual Instrument Software Architecture (VISA) used by National Instruments. There are numerous resources on LabVIEW; two are listed here : National Instruments, Incorporated on the web at : http://www.ni.com or via telephone at 1-800-433-3488 “LabVIEW Graphical Programming: Practical Applications in Instrumentation and Control”, 2 nd Edition, 1997, Gary W. Johnson Introduction What is the SRS RGA LabVIEW Development Kit? The SRS RGA LabVIEW Development Kit is a set of LabVIEW drivers that were designed for and tested with an SRS RGA. The virtual instruments (VIs) included in the kit encapsulate all the low- level commands and data manipulation required to work with the SRS RGA. These VIs let you get up and running with an SRS RGA in the LabVIEW environment very quickly. The kit is completely free and is available for download at the SRS web site : www.thinksrs.com. Note that using the kit effectively requires knowledge of LabVIEW; some resources on this subject are listed above. What does the kit include? The VIs in the kit are divided into three layers. The lowest layer, termed a “communications layer”, simply encapsulates the RS232 interface commands. The next layer, an “operations layer” draws
Transcript of SRS RGA LabVIEW Development Kit · 2018-05-18 · RGA Application Note SRS Residual Gas Analyzer...

RGA Application Note
SRS Residual Gas Analyzer
SRS RGA LabVIEW Development Kit
Important!
• The drivers in the development kit are provided free of charge and AS IS. Support ofany modification is solely the responsibility of the end user.
• This kit was developed and tested under LabVIEW version 5.1. It was also tested forcompatibility with LabVIEW version 6.0 (also known as LabVIEW 6i). At the time ofwriting, LabVIEW 6i is not fully backward compatible with LabVIEW 5.1, and twoversions of the development kit are available. See the SRS website(http://www.thinksrs.com) and below for more details.
• While the drivers were thoroughly tested, SRS makes no warranty (express or implied)on this software and assumes no responsibility for damage caused through using it.
• SRS does not provide training in the use of LabVIEW, nor does SRS provide supportfor LabVIEW. Contact National Instruments, Incorporated (telephone 1-800-433-3488or on the internet at http://www.ni.com) for training and support of LabVIEW.
• This appendix assumes familiarity with the LabVIEW programming environment. Italso assumes familiarity with the implementation of Virtual Instrument SoftwareArchitecture (VISA) used by National Instruments. There are numerous resources onLabVIEW; two are listed here :
National Instruments, Incorporated on the web at : http://www.ni.com or viatelephone at 1-800-433-3488
“LabVIEW Graphical Programming: Practical Applications inInstrumentation and Control”, 2nd Edition, 1997, Gary W. Johnson
IntroductionWhat is the SRS RGA LabVIEW Development Kit?
The SRS RGA LabVIEW Development Kit is a set of LabVIEW drivers that were designed forand tested with an SRS RGA. The virtual instruments (VIs) included in the kit encapsulate all the low-level commands and data manipulation required to work with the SRS RGA. These VIs let you get upand running with an SRS RGA in the LabVIEW environment very quickly. The kit is completely freeand is available for download at the SRS web site : www.thinksrs.com. Note that using the kiteffectively requires knowledge of LabVIEW; some resources on this subject are listed above.
What does the kit include?The VIs in the kit are divided into three layers. The lowest layer, termed a “communications
layer”, simply encapsulates the RS232 interface commands. The next layer, an “operations layer” draws
2 RGA Application Note
SRS Residual Gas Analyzer
on several of the communications layer VIs and adds some data manipulation to allow rapid developmentof custom LabVIEW experiments that incorporate the SRS RGA. The last layer, an “applications layer”,is provided as an example of what can be created using the operations layer. A stand-alone application isincluded in this layer which allows analog, histogram and table scans. The source code for thisapplication, as well as simplified examples of each of the scan types is included.
What goals can the kit help me accomplish?The kit was designed to let you quickly :
♦ Develop new custom applications using the SRS RGA
♦ Incorporate the SRS RGA into your existing LabVIEW applications
♦ Integrate data from other sources (temperature, flow rate, etc.) with RGA data
♦ Publish your RGA data on the world wide web (using LabVIEW 6i)
The kit was developed in part to accommodate users who asked for more features in our RGAWindows software. While many users asked for similar features, each had their own specialrequirements beyond those common features. The development kit allows users to customize thesoftware to fit their own individual needs. Groups that had input into this kit (and who should benefitfrom it) include :
Analytical Chemists
Industrial Refrigerant Engineers
Scientists performing “hyphenated measurements” (e.g. Temperature Programmed Desorption)
Surface Scientists
Scientists performing ion counting measurements
What is required to use the kit?In order to develop custom applications, you will need to have LabVIEW version 5.1 or 6i. The
software is available from National Instruments Corporation; see their web site at www.ni.com. The kitwas developed under LabVIEW 5.1. In LabVIEW 6i, National Instruments dropped the use of data rangecoercion, which causes warnings when you load the VIs in 6i. If you are using 6i, disregard anywarnings about data range coercion; the VIs should function normally.
The requirements for running LabVIEW are :
Windows 9x,ME, NT or 2000 (for Windows NT, Service Pack 3 or later)
32 MB RAM minimum, 64 MB recommended
170 MB disk space for full LabVIEW installation
(Contact National Instruments for the most up-to-date information regarding the requirements forrunning their LabVIEW software)

RGA Application Note
SRS Residual Gas Analyzer
3
If you wish to use the kit in order to easily put your data on the web, LabVIEW version 6iincludes a built-in web-publishing tool. The kit was tested with this web-publishing tool, and thisdocument discusses how to use it.
Note that if you would like to try out the SRS RGA stand-alone application, it is available fromthe SRS web site (www.thinksrs.com) as a stand-alone executable file. LabVIEW is not required to runthe application. A run-time engine and VISA drivers must be installed to use the application on a systemwithout LabVIEW. These software components are included in the download, and will automatically beinstalled with the SRS RGA LabVIEW application.
Browsing the kitAfter you download the free kit, you can install it under any directory you choose. However, it
may make things easier to install the kit under the LabVIEW instrument drivers directory, (for example,C:\Program Files\National Instruments\LabVIEW 6\instr.lib) so it can quickly be accessed from withinLabVIEW. The easiest way to get a feel for what is in the kit is to browse the VI named “VI Tree” (seefigure below). VI Tree is a documentation VI. It only shows each VI used in the three hierarchical levelsof the kit, and performs no other function. Attempting to run this VI will result in an error since it ismerely a collection of unconnected VIs.

4 RGA Application Note
SRS Residual Gas Analyzer
A good way to get familiar with what each of the sub-VIs of a given VI do is to invokeLabVIEW’s help feature (press Control-H) and simply move your mouse over each of the VIs. The helpwill list the input and outputs of each VI as well as any general remarks about the VI. The built-indocumentation features of LabVIEW will allow you to quickly print out detailed information about everyVI used in the kit, including inputs and outputs for each VI. To print documentation under LabVIEW5.1, go to File | Print Documentation. Under LabVIEW 6i, go to Print. In both cases, follow the promptsto print the level of detail in the documentation that you desire.
Another instructive way to learn how the VIs work is to view their execution while the programis running. LabVIEW allows you to do this by simply clicking on the “highlight execution” speed buttonfrom within the view of the block diagram. After clicking this button, LabVIEW will show you the dataand the pathways used in handling that data from within individual VIs. This can help you understand

RGA Application Note
SRS Residual Gas Analyzer
5
the program flow much more quickly than by simply looking at the code. Bear in mind that performanceof the program slows drastically as it creates this “movie” of what goes on during execution.
Layers in the SRS RGA Development Kit
Communications Layer VIsWhat are the communications layer VIs?
The VIs in the communications layer encapsulate the low-level serial communication commandsas well as doing some communications housekeeping. They allow the maximum in flexibility whencreating custom LabVIEW programs.
When should I use this layer?The communications layer is only required when your application requires something not
addressed by the operations layer. These VIs are what many people get when they download “LabVIEWdrivers” from an instrument manufacturer’s web site. The SRS RGA LabVIEW Development Kit goesfar beyond this primitive layer. Most users should work at the operations layer first, only using thecommunications layer when strictly necessary.
An oversimplified exampleCommExamplec.vi will run a single scan over a user-specified mass range. Note that a
waveform chart is used, and the abscissa units are not mass but rather simply the number of data points.Furthermore, the ordinate is not in units of pressure, but is in the raw ampere reading returned from theRGA. This example is simply meant to introduce you to some concepts used in the operations layer andto verify the communications are functioning correctly under the LabVIEW environment. It is not meantas an example to emulate or as a starting point for development.
Try the example:Open LabVIEW
Select the RGA LabVIEW Library
Open the Communications example, CommExampleC
From the front panel, set the mass range for the scan
Make sure the virtual LED labeled “Scan Enabled” is lit
Set the COM port to be the same as the COM port the RGA is using
Run the VI

6 RGA Application Note
SRS Residual Gas Analyzer
The VI takes a few moments before the scan begins in order to perform some initialization tasks on theRGA. After this time, you should see a trace corresponding to the ion currents detected by the RGA asits mass filter is swept. If the trace doesn’t appear after thirty seconds or you get an error, use the RGACOM program supplied with your RGA to verify communications are set up correctly. Make sure thepower to the RGA is on (check the power LED), verify the COM port setting is correct, and test thecabling.
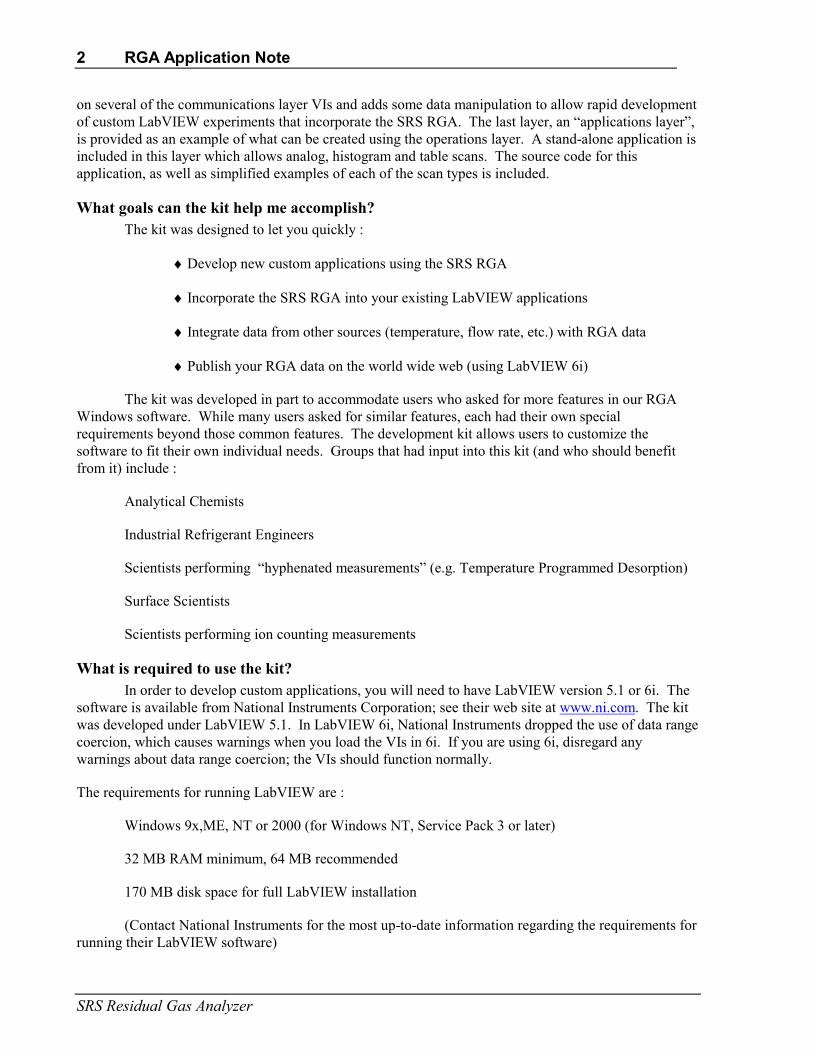
Concepts from the example:Within LabVIEW, view the block diagram of CommExampleC (press Control-E if you are alreadylooking at the front panel of the VI). The figure below shows this block diagram. Please note that thisexample is not meant to be a “starting point” to develop your own programs. Rather it simplydemonstrates some concepts used in the development kit.
RGA Application Note
SRS Residual Gas Analyzer
7
Note that at the far left side of the block diagram, a COM port is specified and an SRS RGA“session” is established. The user specifies the COM port in use from the front panel of the VI. A sub-VI, SRSRGAC Connect, handles setting the baud rate, parity and other serial line parameters appropriatefor the RGA. It uses National Instrument’s implementation of the Virtual Instrument SoftwareArchitecture (VISA) standard for communications. This VISA session is propagated to each of thecommunications VIs in turn, along with the error status.
If you are familiar with the SRS RGA command set (for example, see page 6-17 of this manual)you will recognize the two-letter designations on the VIs that set the initial mass (MI), final mass (MF),noise floor (NF), filament current (FL), and so forth. Within the while loop, two VIs handle the RGAoutput and format it as an array of data values. These VIs take care of reading the 4 byte binary string,changing the byte order, and converting the ASCII bytes into floating point numbers. Unless there is anerror or the user changes the status of the scan enable button on the front panel, these commands repeatin the while loop until an entire scan is generated. After a scan is acquired, the RGA is set to stopscanning, its filament is turned off, the VISA session is closed and any errors are reported.
Operations Layer VIsWhat are the operations layer VIs?
The operations layer encapsulates many of the communications layer functions. This layer isoriented towards common tasks the RGA will need to perform in any application. Rather than explicitlyaddressing the individual serial commands that are required to perform these tasks, these commands areused implicitly by the operations layer. In order to illustrate the use of the operations layer VIs, wecreated three separate applications (Simple Analog, Simple Table, and Simple Histogram) from theseVIs. These examples are excellent starting points for your own custom applications.
When should I use this layer?The operations layer is the right starting point for most LabVIEW programmers. It is task (rather
than command) oriented, and yet is still on a low enough level to provide a great deal of flexibility in thedevelopment of custom applications.
8 RGA Application Note
SRS Residual Gas Analyzer
ExamplesThe development kit provides three examples of how to use the operations layer. Each example
is an application that performs a common RGA scanning mode (table, analog, and histogram). It is likelythat your custom application can be created simply modifying one of these examples.
Simple Table
Try the example:Open LabVIEW
Select the RGA LabVIEW Library
Open the Simple Table example, SRSRGAa Simple Table
From the front panel of the VI, set the COM port that the RGA is using
For each channel, set the noise floor , mass, and electron multiplier state
Run the VI

RGA Application Note
SRS Residual Gas Analyzer
9
The VI takes a few moments before the scan begins in order to perform some initialization tasks on theRGA. After this time, you should see traces corresponding to the partial pressures detected by the RGAas its mass filter is swept. If the traces do not appear after thirty seconds or you get an error, use theRGA COM program supplied with your RGA to verify communications are set up correctly. Make surethe power to the RGA is on (check the power LED), verify the COM port setting is correct, and test thecabling.
Concepts from the example:Within LabVIEW, view the block diagram of SRSRGAa Simple Table (press Control-E if you arealready looking at the front panel of the VI). The figure below shows this block diagram.

10 RGA Application Note
SRS Residual Gas Analyzer
As shown in the figure, the Simple Table example uses just six VIs. All the VIs in gray are takenfrom the operations layer, while the only one that is not is the general SRSRGA Error handler VI. Just asin the communications layer example, you can see that an error cluster is propagated through the six VIs.However, rather than propagating the SRSRGA VISA session explicitly, the session is propagated byreferring to its reference number (or refnum). By double-clicking on the sub-VIs that appear to the rightof the Open VI, you will see that each VI takes the refnum as input, then passes it to SRSRGAo GetSession. This VI accesses the serial communications session referred to by the SRSRGA refnum, andsends commands or receives data from that session. By using the operations level, you don’t have toworry about dealing with the VISA session directly; the VIs in this layer will handle that for you.
After taking your input from the specifications cluster and opening an SRS RGA session, theStart Table VI sets the electron emission and calibrates any noise floor / electron multiplier parameters ifnecessary. Within the while loop, the Measure Table VI sends repeated MR queries to the RGA, andformats the binary data into an array of pressure readings. This array is plotted in the P vs. t graph that isvisible on the front panel. The rate at which the data appears is governed by the multiple milliseconddelay in the while loop. The user sets the delay from the front panel. The condition for the while loop issimply that the user has not stopped the scan and that no errors are present. If the while loop ends, themass filtering is turned off, as is the electron multiplier and the filament. Any errors are reported at thistime.
Simple Analog
Try the example:Open LabVIEW
Select the RGA LabVIEW Library
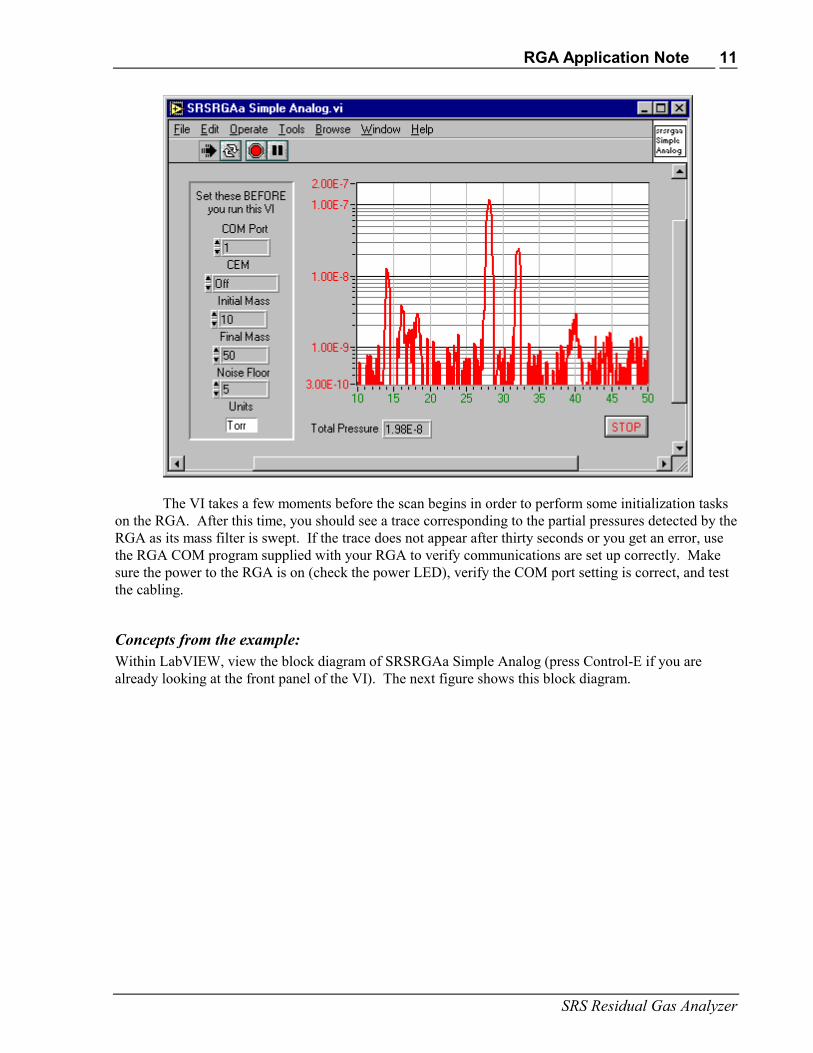
Open the Simple Analog example, SRSRGAa Simple Analog
From the front panel of the VI, set the COM port that the RGA is using
Set the noise floor, mass, and electron multiplier state
Run the VI
RGA Application Note
SRS Residual Gas Analyzer
11
The VI takes a few moments before the scan begins in order to perform some initialization taskson the RGA. After this time, you should see a trace corresponding to the partial pressures detected by theRGA as its mass filter is swept. If the trace does not appear after thirty seconds or you get an error, usethe RGA COM program supplied with your RGA to verify communications are set up correctly. Makesure the power to the RGA is on (check the power LED), verify the COM port setting is correct, and testthe cabling.
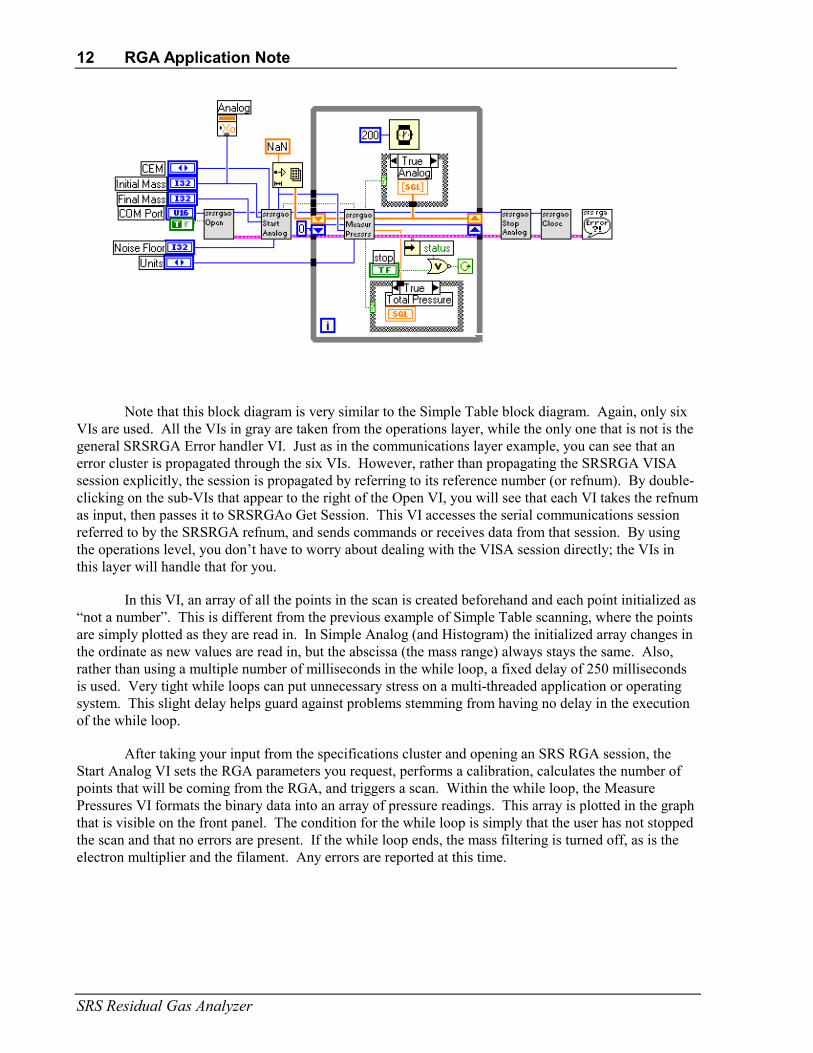
Concepts from the example:Within LabVIEW, view the block diagram of SRSRGAa Simple Analog (press Control-E if you arealready looking at the front panel of the VI). The next figure shows this block diagram.
12 RGA Application Note
SRS Residual Gas Analyzer
Note that this block diagram is very similar to the Simple Table block diagram. Again, only sixVIs are used. All the VIs in gray are taken from the operations layer, while the only one that is not is thegeneral SRSRGA Error handler VI. Just as in the communications layer example, you can see that anerror cluster is propagated through the six VIs. However, rather than propagating the SRSRGA VISAsession explicitly, the session is propagated by referring to its reference number (or refnum). By double-clicking on the sub-VIs that appear to the right of the Open VI, you will see that each VI takes the refnumas input, then passes it to SRSRGAo Get Session. This VI accesses the serial communications sessionreferred to by the SRSRGA refnum, and sends commands or receives data from that session. By usingthe operations level, you don’t have to worry about dealing with the VISA session directly; the VIs inthis layer will handle that for you.
In this VI, an array of all the points in the scan is created beforehand and each point initialized as“not a number”. This is different from the previous example of Simple Table scanning, where the pointsare simply plotted as they are read in. In Simple Analog (and Histogram) the initialized array changes inthe ordinate as new values are read in, but the abscissa (the mass range) always stays the same. Also,rather than using a multiple number of milliseconds in the while loop, a fixed delay of 250 millisecondsis used. Very tight while loops can put unnecessary stress on a multi-threaded application or operatingsystem. This slight delay helps guard against problems stemming from having no delay in the executionof the while loop.
After taking your input from the specifications cluster and opening an SRS RGA session, theStart Analog VI sets the RGA parameters you request, performs a calibration, calculates the number ofpoints that will be coming from the RGA, and triggers a scan. Within the while loop, the MeasurePressures VI formats the binary data into an array of pressure readings. This array is plotted in the graphthat is visible on the front panel. The condition for the while loop is simply that the user has not stoppedthe scan and that no errors are present. If the while loop ends, the mass filtering is turned off, as is theelectron multiplier and the filament. Any errors are reported at this time.

RGA Application Note
SRS Residual Gas Analyzer
13
Simple Histogram
Try the example:Open LabVIEW
Select the RGA LabVIEW Library
Open the Simple Histogram example, SRSRGAa Simple Histogram
From the front panel of the VI, set the COM port that the RGA is using
Set the noise floor, mass, and electron multiplier state
Run the VI
The VI takes a few moments before the scan begins in order to perform someinitialization tasks on the RGA. After this time, you should see histogram bars corresponding tothe partial pressures detected by the RGA as its mass filter is swept. If the trace does not appearafter thirty seconds or you get an error, use the RGA COM program supplied with your RGA toverify communications are set up correctly. Make sure the power to the RGA is on (check thepower LED), verify the COM port setting is correct, and test the cabling.

14 RGA Application Note
SRS Residual Gas Analyzer
Concepts from the example:Within LabVIEW, view the block diagram of SRSRGAa Simple Analog (press Control-E if you arealready looking at the front panel of the VI). The next figure shows this block diagram.
Note that this block diagram is very similar to the Simple Table block diagram. Again, only sixVIs are used. All the VIs in gray are taken from the operations layer, while the only one that is not is thegeneral SRSRGA Error handler VI. Just as in the communications layer example, you can see that anerror cluster is propagated through the six VIs. However, rather than propagating the SRSRGA VISAsession explicitly, the session is propagated by referring to its reference number (or refnum). By double-clicking on the sub-VIs that appear to the right of the Open VI, you will see that each VI takes the refnumas input, then passes it to SRSRGAo Get Session. This VI accesses the serial communications sessionreferred to by the SRSRGA refnum, and sends commands or receives data from that session. By usingthe operations level, you don’t have to worry about dealing with the VISA session directly; the VIs inthis layer will handle that for you.
In this VI, an array of all the points in the scan is created beforehand and each point initialized as“not a number”. This is different from the previous example of Simple Table scanning, where the pointsare simply plotted as they are read in. In Simple Histogram (and Analog) the initialized array changes inthe ordinate (pressure) as new values are read in, but the abscissa (the mass range) always stays the same.Also, rather than using a multiple number of milliseconds in the while loop, a fixed delay of 250milliseconds is used. Very tight while loops often put stress on a multi-threaded application or operatingsystem. This slight delay helps guard against problems stemming from having no delay in the executionof the while loop.
Applications Layer VIsWhat are the applications layer VIs?
The applications layer is built upon the VIs in the operations layer. In the previous section, wediscussed the use of several operations layer VIs in three application examples (simple analog, histogram,and table). In this section, we discuss using a fully developed application that encompasses setups for theRGA hardware, scanning parameters, and datalogging.
RGA Application Note
SRS Residual Gas Analyzer
15
When should I use this layer?While the simple applications built from the operations layer make great starting points,
the fully developed application (SRS RGA LabVIEW) is really for expert LabVIEWprogrammers. The code is complex, and sparsely documented. It is easy to get stuck with anapplication that will no longer function correctly. If you feel very confident of your LabVIEWabilities, then modifying SRS RGA LabVIEW might be a good place to start, especially if youneed only a small modification. Bear in mind that SRS does not support the development of newapplications with the kit. SRS RGA LabVIEW is provided primarily as an example todemonstrate the possibilities of using LabVIEW for custom applications.
You may find that SRS RGA LabVIEW lets you do everything you did in RGAWindows. There are also improvements in compatibility in SRS RGA LabVIEW over RGAWindows, because of the inherent compatibility of LabVIEW. SRS RGA LabVIEW also allowsdatalogging with 100 ms time resolution, an order of magnitude improvement from RGAWindows. The main drawback to SRS RGA LabVIEW as compared with RGA Windows is thatthere is no detector calibration utility. However, if you are like most users, calibration of thedetector is only rarely required, and you can always go back to RGA Windows to perform acalibration. For these reasons, some users may consider using SRS RGA LabVIEW as analternative to RGA Windows.
Using SRS RGA LabVIEWConnectingOpen LabVIEW
Select the RGA LabVIEW Library
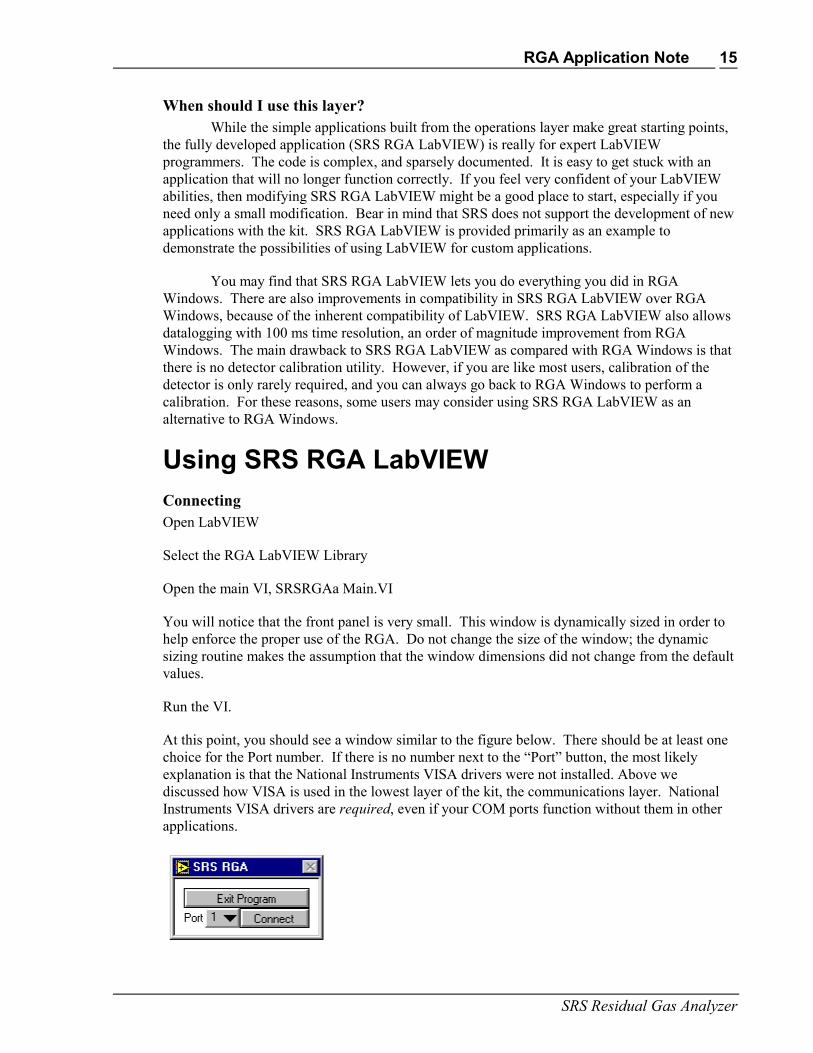
Open the main VI, SRSRGAa Main.VI
You will notice that the front panel is very small. This window is dynamically sized in order tohelp enforce the proper use of the RGA. Do not change the size of the window; the dynamicsizing routine makes the assumption that the window dimensions did not change from the defaultvalues.
Run the VI.
At this point, you should see a window similar to the figure below. There should be at least onechoice for the Port number. If there is no number next to the “Port” button, the most likelyexplanation is that the National Instruments VISA drivers were not installed. Above wediscussed how VISA is used in the lowest layer of the kit, the communications layer. NationalInstruments VISA drivers are required, even if your COM ports function without them in otherapplications.

16 RGA Application Note
SRS Residual Gas Analyzer
Select the COM port that is connected to the RGA by clicking on the pull-down menu next to the “Port”label.
Press the “Connect” button. At this point, the application sends some queries to determine hardwareparameters and to perform initialization tasks. After a few moments, you should see a menu similar tothe next figure:
Notice that the window has re-sized to show new menu choices once RGA communication is established.Also, you cannot exit the program without first disconnecting from the RGA.
Ionizer Setup DialogClick the button labeled “Ionizer Setup…”
This dialog allows you to change parameters relating to the ionizer hardware. Your parameter valuesmay differ from the figure; the dialog simply displays the last values used. If you should accidentallychange something and you wish to return all values to what the were when you opened the dialog, clickthe “Revert” button. If you wish to restore the factory defaults for the ionizer parameters, click the“Factory” button.
Exit the ionizer setup dialog by clicking the “Cancel” button.
RGA Application Note
SRS Residual Gas Analyzer
17
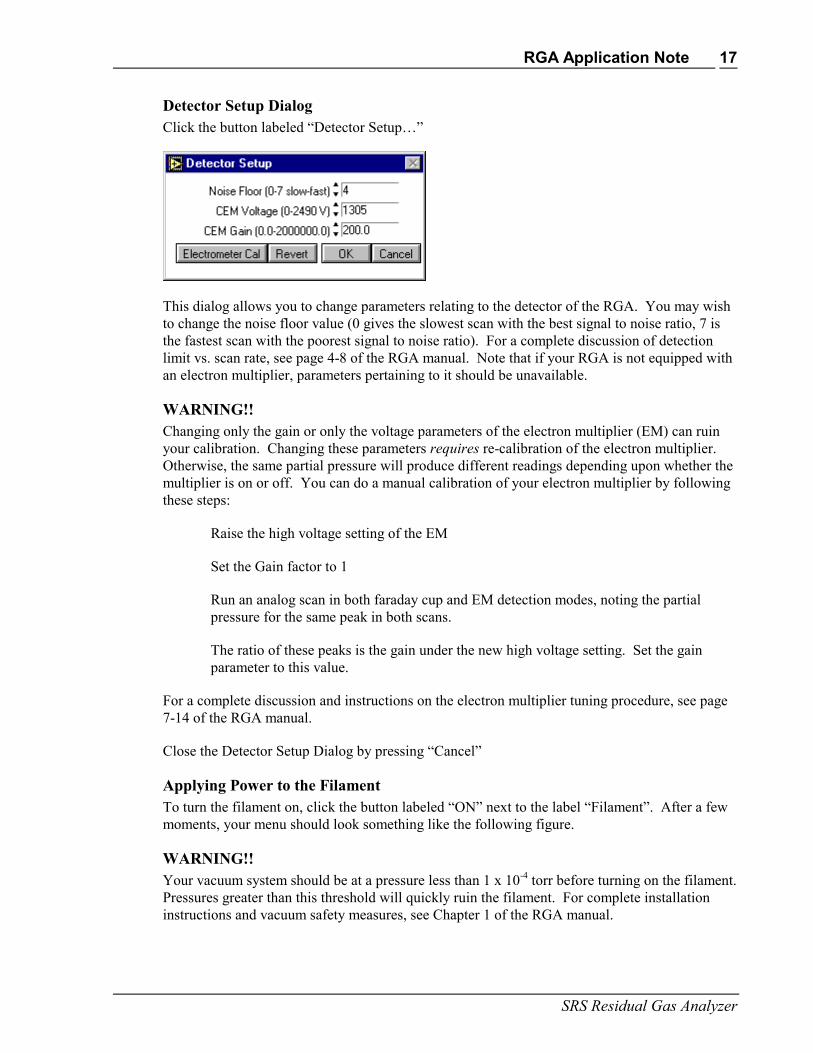
Detector Setup DialogClick the button labeled “Detector Setup…”
This dialog allows you to change parameters relating to the detector of the RGA. You may wishto change the noise floor value (0 gives the slowest scan with the best signal to noise ratio, 7 isthe fastest scan with the poorest signal to noise ratio). For a complete discussion of detectionlimit vs. scan rate, see page 4-8 of the RGA manual. Note that if your RGA is not equipped withan electron multiplier, parameters pertaining to it should be unavailable.
WARNING!!Changing only the gain or only the voltage parameters of the electron multiplier (EM) can ruinyour calibration. Changing these parameters requires re-calibration of the electron multiplier.Otherwise, the same partial pressure will produce different readings depending upon whether themultiplier is on or off. You can do a manual calibration of your electron multiplier by followingthese steps:
Raise the high voltage setting of the EM
Set the Gain factor to 1
Run an analog scan in both faraday cup and EM detection modes, noting the partialpressure for the same peak in both scans.
The ratio of these peaks is the gain under the new high voltage setting. Set the gainparameter to this value.
For a complete discussion and instructions on the electron multiplier tuning procedure, see page7-14 of the RGA manual.
Close the Detector Setup Dialog by pressing “Cancel”
Applying Power to the FilamentTo turn the filament on, click the button labeled “ON” next to the label “Filament”. After a fewmoments, your menu should look something like the following figure.
WARNING!!Your vacuum system should be at a pressure less than 1 x 10⁻⁴ torr before turning on the filament.Pressures greater than this threshold will quickly ruin the filament. For complete installationinstructions and vacuum safety measures, see Chapter 1 of the RGA manual.

18 RGA Application Note
SRS Residual Gas Analyzer
The “virtual led” next to the Filament label should be lit before performing a scan. (Note: If yourvacuum chamber is equipped with an external ionization source SRS RGA LabVIEW will let you scanwith the filament off.)
Scanning & Logging Setup DialogClick the button labeled “Scan/Log Setup…”
The Scanning & Logging dialog allows you to set up a scan for any of the three scanning modes (analog,table, histogram) from within a single screen. If you were setting up an analog scan, you would onlyneed to specify the initial and final mass of the scan range. The default range is 100 AMU. For

RGA Application Note
SRS Residual Gas Analyzer
19
demonstration, we will run a table scan of four different masses with a 10 to 50 AMU scan range and wewill log all the data the RGA produces. Change your dialog to look like the following figure:
To change the mass range you can either click and drag the graphical bar labeled Mass Range, orenter the initial and final masses directly in the spaces provided. To add masses for a table scan,type the mass in the box labeled “AMU” and the noise floor value you wish to use for that massin the box labeled “NF”. If you have an electron multiplier, you also have the option of turning iton or off by clicking in the box labeled “CEM”.
To set the log filename, simply click on “Select log file” and follow the prompts to select thedirectory and filename you wish to use. Click on the toggle button next to the label “In TableMode,” so that “record all backlog data” is selected.
If you wish to perform leak testing, you must use table mode. Select a particular mass for leaktesting by highlighting that mass in the gray background table. In the example above, mass 44 ishighlighted. After you click on “Use for leak detect” a black diamond will appear to the left ofthe mass used for leak detection.
Exit the Scanning & Logging dialog by pressing “OK”.
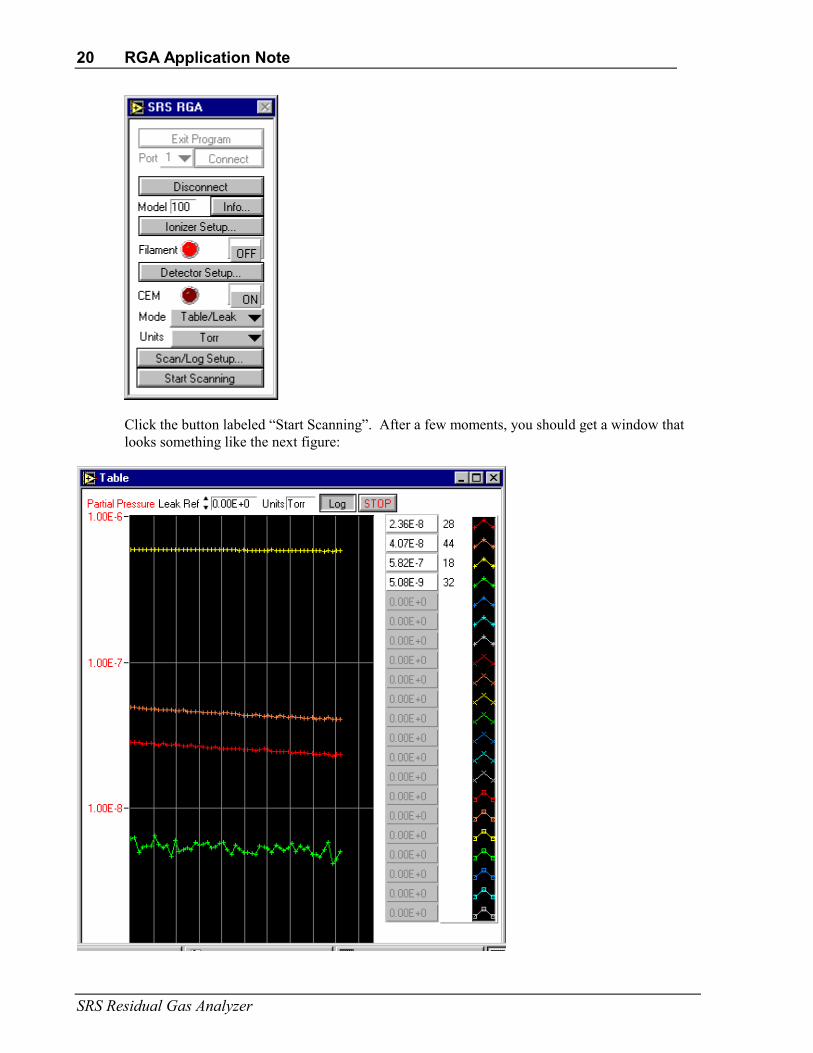
Running a ScanSelect Table Mode from the main menu using the pull down menu next to the label “Mode”. Themain menu should look like the next figure before you are ready to run the scan.
20 RGA Application Note
SRS Residual Gas Analyzer
Click the button labeled “Start Scanning”. After a few moments, you should get a window thatlooks something like the next figure:
RGA Application Note
SRS Residual Gas Analyzer
21
If you were doing a leak test, you would change the value in the box labeled “Leak Ref” to a referencevalue. This is the value you wish to classify as a leak. If the partial pressure of the mass selected for leaktesting approaches this value, a tone is generated. The tone goes up in pitch the closer the partialpressure is to the reference value.
If you wish to change to a linear scale, click the button labeled “Log”. This toggle switch goes back andforth between logarithmic and linear representations of the ordinate scale.
When you are finished with the demo, stop the scan by pressing the button labeled “STOP”
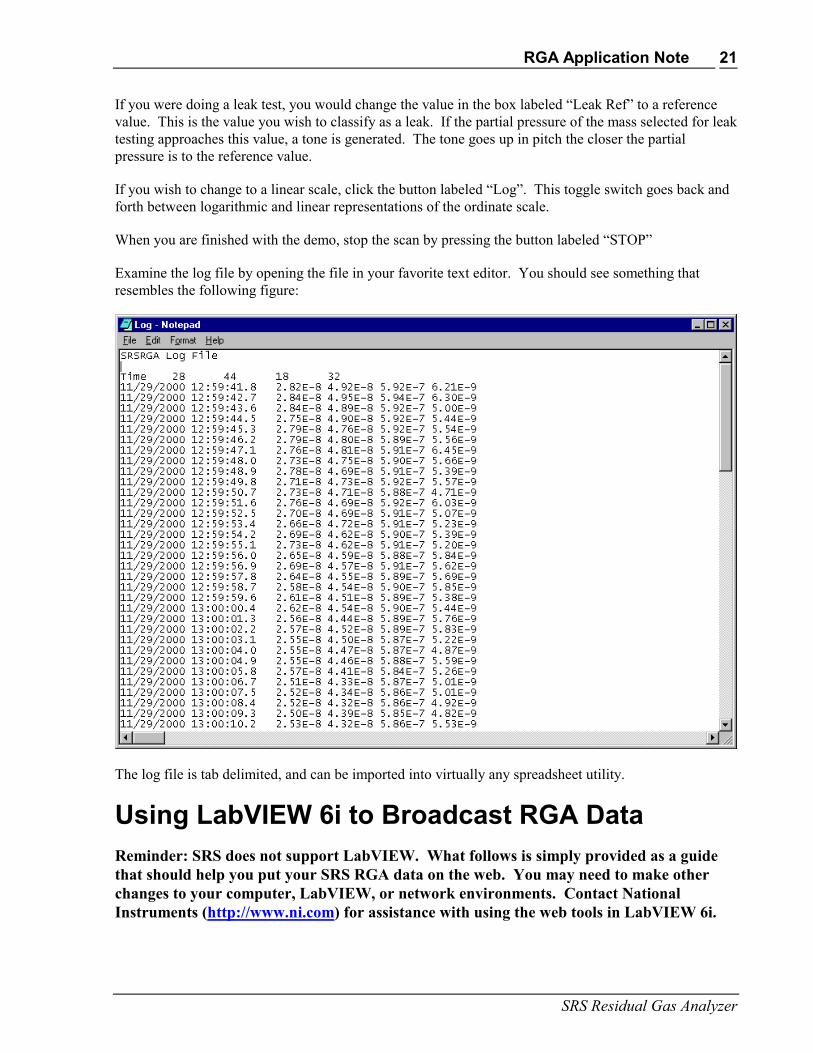
Examine the log file by opening the file in your favorite text editor. You should see something thatresembles the following figure:
The log file is tab delimited, and can be imported into virtually any spreadsheet utility.
Using LabVIEW 6i to Broadcast RGA DataReminder: SRS does not support LabVIEW. What follows is simply provided as a guidethat should help you put your SRS RGA data on the web. You may need to make otherchanges to your computer, LabVIEW, or network environments. Contact NationalInstruments (http://www.ni.com) for assistance with using the web tools in LabVIEW 6i.

22 RGA Application Note
SRS Residual Gas Analyzer
Configure the Web ServerOpen LabVIEW 6i
Start a new VI
Under the Tools menu, select Options
From the pull-down menu (whose default tab is “Paths”, select Web Server: Configuration
Click the checkboxes for “Enable Web Server” and Log File
Unless you have reason to use other values, simply use the default values for the root directory and thelog filename. Error information will be stored in the web server’s log file and this may be important fortroubleshooting with National Instruments technical support. Make sure the log file check box is enabledand that you note the location of the log file for later access.

RGA Application Note
SRS Residual Gas Analyzer
23
Open and run SRS RGA LabVIEW by selecting the main VI from the library.
Perform the scan you wish to publish on the web, then stop the scan and exit the main program.
The front panel for both the main VI and the scanning VI remain open. In this example, we will use ananalog scan, and SRSRGAa Analog.VI
From the front panel toolbar of SRSRGAa Analog.vi, select Tools, then Web Publishing Tool.
The web publishing tool creates a hypertext markup language (HTML) file that will reside on thecomputer on which the VI is run. The web server within LabVIEW 6i will serve this page and embed aJoint Picture Experts Group (JPEG) format picture of the running VI in this file. If you select an“animated” VI, the server will update this picture repeatedly to give the appearance of a “movie” of yourrunning VI. At the time of writing only Netscape browsers support this kind of automatic updating. Bearin mind that if you only want a snapshot of how your vacuum system is doing, an animated web page isnot required, and any web browser supports this kind of static web page.
Notice that the button “Start Web Server” is grayed out. This is what you should see if you have beensuccessful in enabling LabVIEW 6i’s web server. (Once enabled, the web server does not need to bestarted, and that is why the button is grayed out.)
Change the Document Title, Text 1, and Text 2 to any label you wish. (If you want to further embellishyour web page, you can always edit the file using your favorite web publishing tool once you select“Save to Disk”.)
Click the “Save to Disk” button, and select where you wish to save the HTML file. Use the defaultdirectory location if possible.

24 RGA Application Note
SRS Residual Gas Analyzer
Once the HTML file is saved, you can preview it in your browser, by clicking the “Preview in Browser”button.
Once you are satisfied with the HTML file, click “Start Web Server” and then click “Done”. You willget a pop-up notice box that looks something like this:
Note that this Universal Resource Locator (URL) address will not work on computers other than the onerunning the VI. Clicking “Connect” will bring up the above URL within a browser on the computerrunning the VI, but not other computers. Note the filename you used. In this case it is “analog.htm”.
In order to access the HTML page with the embedded picture of your running VI, you must include theInternet Protocol (IP) address of the machine that is running the LabVIEW 6i web server. To find the IPaddress of a computer under Windows 98, click on the Start menu, then select the “Run…” option. Typein “winipcfg” at the run prompt and you should get a window like this:
Under Windows 95, Click “Start”, then “Control Panel”, then double-click “Network” to get somethinglike the following figure:

RGA Application Note
SRS Residual Gas Analyzer
25
Select TCP/IP and click the Properties button to find the IP address:

26 RGA Application Note
SRS Residual Gas Analyzer
WARNING!!DO NOT CHANGE any network settings! Making changes will cause problems with your network. Usethis dialog box simply to get the IP address of the computer running the VI you wish to put on the web.
If you are unable to find the IP address of the computer that will run your VI and serve the web page,contact your network administrator.
Now you are ready to run your VI and try out the web publishing feature of LabVIEW 6i. RunSRSRGAa Main.vi and run the analog scan (or whichever scan mode you used the web publishing toolwith). Go to another computer on your network and type the IP address of the computer running the VIfollowed by a forward slash and the name of the HTML file. For example, if the computer running theVI has an IP address of 123.123.123.123, and you saved the HTML file under analog.htm, the URLwould be http://123.123.123.123/analog.htm. In the example below we used 209.239.167.155 and thefilename analog.htm.
If everything is set up correctly, you should see your VI running in a browser window as in the figurebelow.

RGA Application Note
SRS Residual Gas Analyzer
27