Spring 2014 Math 263 Deb Hughes Hallettmath.arizona.edu/~dhh/Class25_MultiRegression_Sols.pdf ·...
6
Spring 2014 Math 263 Deb Hughes Hallett 1 Class 25: Multivariable Regression (Text: Sections 11.1) To predict lung cancer deaths, we can use one explanatory variable—the number of cigarettes smoked per capita—and obtain = 0.23 + 65.7. What if we thought that more than one variable affected , as is usually the case? Then instead of using = ! + ! , we could use a model with two explanatory variables, = ! + ! ! + ! ! + , or with three or more variables: !"#$%&#" !"#$"%&’ = ! + ! ! + ! ! + ! ! + ⋯ + ! ! + !"#$%&%’()* !"#$"%&’( The population parameters for this model are ! , ! , ! …. etc. and . Then values of the are used to predict the values of . The notation for the sample regression line is = ! + ! ! + ! ! + ⋯ + ! ! The “hat” on the means it was estimated from the data. The coefficients in the sample regression equation are estimated from the data using Excel • ! is the value of when all the explanatory variables are zero. • ! , ! , ! ,…. are the slopes, or rates of change, of the response variable when each explanatory variable changes with the other variables held constant. • ! tell us how close the data is to a line and how reliable the predictions are (As before, Greek letters are population parameters; ordinary letters are the sample statistics.) Example: Women’s Heptathlon The women's heptathlon consists of seven track and field events, the 200-m and 800-m runs, 100-m high hurdles, shot put, javelin, high jump, and long jump. In the 2004 Olympics, Carolina Klüft of Sweden won the high jump and the long jump; Austra Skujyté of Lithuania won the shot put and the 800-meter race. Which of these contributes to who wins? We will compare the contributions of the high jump, the long jump, and the 800-meter run. The dependent variable is the Total number of Heptathlon points. The winning score was 6952.
Transcript of Spring 2014 Math 263 Deb Hughes Hallettmath.arizona.edu/~dhh/Class25_MultiRegression_Sols.pdf ·...

Spring 2014 Math 263 Deb Hughes Hallett
1
Class 25: Multivariable Regression (Text: Sections 11.1)
To predict lung cancer deaths, we can use one explanatory variable—the number of cigarettes smoked per capita—and obtain 𝑦 = 0.23𝑥 + 65.7.
What if we thought that more than one variable affected 𝑦, as is usually the case? Then instead of using 𝑦 = 𝛽! + 𝛽!𝑥,
we could use a model with two explanatory variables, 𝑦 = 𝛽! + 𝛽!𝑥! + 𝛽!𝑥! + 𝜀,
or with three or more variables:
𝑦!"#$%&#" !"#$"%&'
= 𝛽! + 𝛽!𝑥! + 𝛽!𝑥! + 𝛽!𝑥! +⋯+ 𝛽!𝑥! + 𝜀!"#$%&%'()* !"#$"%&'(
The population parameters for this model are 𝛽!,𝛽!,𝛽!…. etc. and 𝜎.
Then values of the 𝑥𝑠 are used to predict the values of 𝑦. The notation for the sample regression line is 𝑦 = 𝑏! + 𝑏!𝑥! + 𝑏!𝑥! +⋯+ 𝑏!𝑥!
The “hat” on the 𝑦 means it was estimated from the data. The coefficients in the sample regression equation are estimated from the data using Excel
• 𝑏! is the value of 𝑦 when all the explanatory variables are zero. • 𝑏!, 𝑏!, 𝑏!,…. are the slopes, or rates of change, of the response variable when each explanatory
variable changes with the other variables held constant. • 𝑅! tell us how close the data is to a line and how reliable the predictions are (As before, Greek letters are population parameters; ordinary letters are the sample statistics.) Example: Women’s Heptathlon The women's heptathlon consists of seven track and field events, the 200-m and 800-m runs, 100-m high hurdles, shot put, javelin, high jump, and long jump. In the 2004 Olympics, Carolina Klüft of Sweden won the high jump and the long jump; Austra Skujyté of Lithuania won the shot put and the 800-meter race. Which of these contributes to who wins? We will compare the contributions of the high jump, the long jump, and the 800-meter run. The dependent variable is the Total number of Heptathlon points. The winning score was 6952.

Spring 2014 Math 263 Deb Hughes Hallett
2
Women’s Heptathlon: First we look at the High Jump alone. (a) Use the table below to write the regression equation.
Total points Coefficients Standard Error 95% lower 95% upper t Stat p-‐level Intercept 2,767.6 992.1 720.0 4,815.3 2.8 0.010
High Jump (m) 1,929.5 561.9 769.9 3,089.1 3.4 0.002 Equation is 𝑃𝑜𝑖𝑛𝑡𝑠 = 2767.6 + 1929.5 ∗ 𝐻𝑖𝑔ℎ 𝐽𝑢𝑚𝑝 (𝑚) (b) Interpret the coefficient of High Jump. For each additional meter jumped, a contestant could expect approximately 1929.5 additional points. (Of course, jumping an additional meter is a lot!) (c) Does the High Jump make a significant contribution to the scores? Give three reasons. Yes: The p-value is small. The t-statistic is over 2. Both ends of the confidence interval are positive, so the true slope is expected to be positive.
(d) What happens if the scores on different events are correlated? (As is probably the case.) Notice that what we’d like to know—the impact of a change in points when only the high jump score changes—-is not what is shown in this table. We are looking at a change in points from high jump, when other scores may be changing along with the high jump score. Now we look at the Long Jump alone. (a) Use the table below to write the regression equation.
Total points Coefficients Standard Error 95% lower 95% upper t Stat p-‐level
Intercept 1,788.9 1,021.6 -‐319.5 3,897.4 1.8 0.0927 Long Jump (m) 712.6 166.0 370.0 1,055.2 4.3 0.0003
Equation is 𝑃𝑜𝑖𝑛𝑡𝑠 = 1788.95 + 712.63 ∗ 𝐿𝑜𝑛𝑔 𝐽𝑢𝑚𝑝 (𝑚) (b) Interpret the coefficient of Long Jump. For each additional meter jumped, a contestant could expect approximately 712.6 additional points. (Of course, jumping an additional meter is a lot!) (c) Does the Long Jump make a significant contribution to the scores? Give three reasons. Yes: The p-value is small. The t-statistic is over 2. Both ends of the confidence interval are positive, so the true slope is expected to be positive. (d) For a fixed variable, do larger or smaller coefficients represent a larger impact?
Larger coefficient means larger impact. (e) Do smaller coefficients necessarily have smaller 𝑝-values? No: The coefficient of Long Jump, 712.6, is smaller than the coefficient of High Jump, 1929.5, but the p-vale of Log Jump 0.0003

Spring 2014 Math 263 Deb Hughes Hallett
3
Now we look at the 800-meter alone. (a) Use the table below to write the regression equation.
Total points Coefficients Standard Error 95% lower 95% upper t Stat p-‐level Intercept 9,557.0 1,390.9 6,686.4 12,427.6 6.9 0.000
800-‐m (sec) −24.8 10.2 −45.8 −3.8 −2.4 0.023 Equation is Points = 9557.03 - 24.80 * 800-m (sec) (b) Interpret the coefficient 800-meters. For each additional second of time, a contestant could expect to loose approximately 24.8 points. The coefficient is negative because longer times mean worse performance. (c) Does the 800-meter run make a significant contribution to the scores? Give three reasons. Yes: The p-value is small. The t-statistic is over 2. Both ends of the confidence interval are negative, so the true slope is expected to be negative.
So the three variables each make a significant contribution to the score. • What does it tell us that the coefficient of High Jump is greater than the coefficient of the other two? • What happens if all three variables are used together? • Must they be significant? Must each one make a significant contribution?
Size of Coefficients: What affects them? The size of the coefficient can be changed by changing the units of measurement, so is not relevant. For example, measuring the high jump in centimeters instead of meters would make the coefficient a hundred times smaller, 19.295. Does changing units affect the p-value? Why? No, because the 𝑡-score is a ratio without units. Does the size of a coefficient affect whether or not it is significant? No.

Spring 2014 Math 263 Deb Hughes Hallett
4
Women’s Heptathlon: Three variables together: We could show the regression with pairs of variables, but will jump to three variables right away:
Total points Coefficients Standard Error 95% lower 95% upper t Stat p-‐level
Intercept 2,244.3 1,932.2 −1,762.8 6,251.5 1.2 0.258 High Jump (m) 1,106.3 521.7 24.4 2,188.1 2.1 0.045
800-‐m (sec) −9.6 8.4 −27.0 7.9 −1.1 0.269 Long Jump (m) 533.4 160.0 201.6 865.2 3.3 0.003 (a) Use the table above to write the regression equation. Points = 2244.3 + 1106.3 ∗ High Jump (m) − 9.6 ∗ 800 −m (sec) + 533.4 ∗ Long Jump (m)
(b) Does each variable make a significant contribution to the scores? Give three reasons. No: High Jump and Long Jump: Yes. 800-meters: No. 𝑝-value for High Jump and Long Jump are less than 0.05; 𝑝-value for 800-meters is more than 0.05. (c) Does the largest coefficient in the three separate regressions correspond to the smallest p-value when
the regression is done with all three together? No, the smallest 𝑝-value corresponds to Long Jump, which had the middle coefficient. (d) Interpret the coefficient High Jump. If long jump and 800-m scores are held constant, for each additional meter jumped, a contestant could expect approximately an additional 1106.3 points. This is lower than before because some of the changes in scores are now attributed to other variables. (e) Interpret the coefficient Long Jump. If high jump and 800-m scores are held constant, for each additional meter jumped, a contestant could expect approximately an additional 533.4 points. This is lower than before because some of the changes in scores are now attributed to other variables. (f) Interpret the coefficient 800-meters. If high jump and long jump scores are held constant, for each additional second of time, a contestant could expect approximately 9.6 fewer points. This is smaller in magnitude than before because some of the changes in scores are now attributed to other variables. (g) What might you worry about in the interpretation of the coefficient of 800-meters? Since the confidence interval for the slope is between −27.0 and 7.9, the estimates of the change to the number of points could be positive and could be negative. Not a very helpful prediction! This is a consequence of the p-value being above 5% which means that confidence interval contain 0 and has one end positive and one end negative.
Spring 2014 Math 263 Deb Hughes Hallett
5
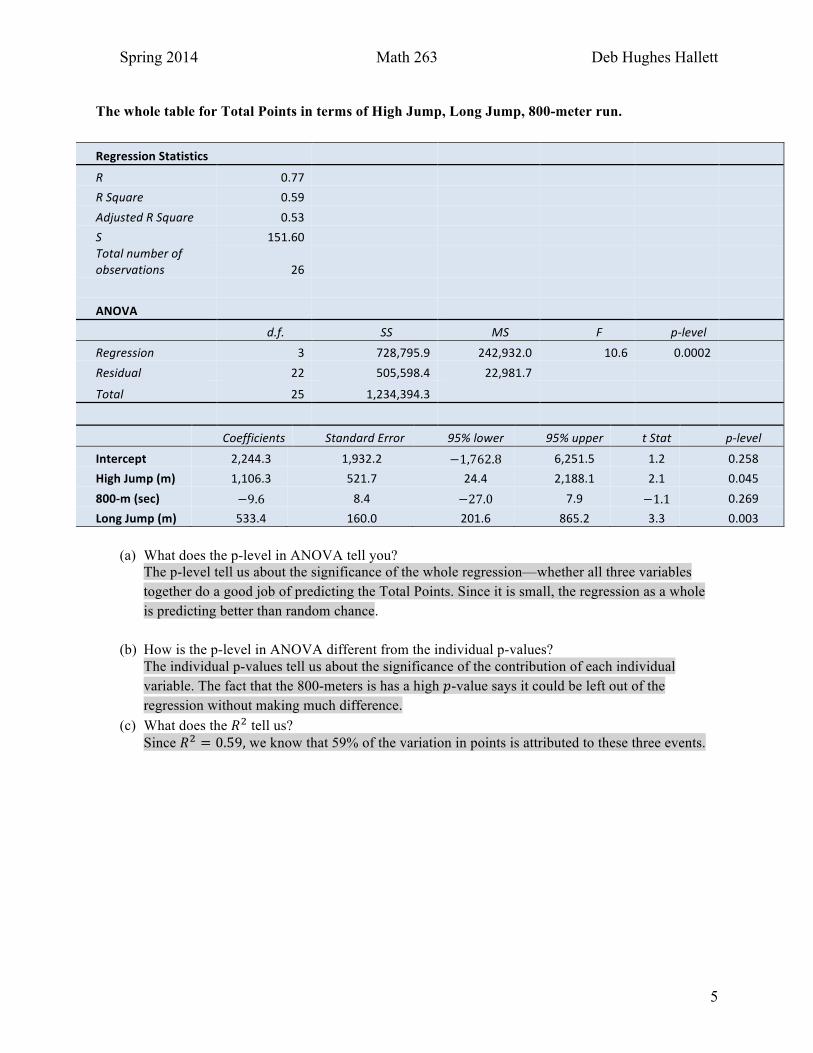
The whole table for Total Points in terms of High Jump, Long Jump, 800-meter run.
(a) What does the p-level in ANOVA tell you?
The p-level tell us about the significance of the whole regression—whether all three variables together do a good job of predicting the Total Points. Since it is small, the regression as a whole is predicting better than random chance.
(b) How is the p-level in ANOVA different from the individual p-values? The individual p-values tell us about the significance of the contribution of each individual variable. The fact that the 800-meters is has a high 𝑝-value says it could be left out of the regression without making much difference.
(c) What does the 𝑅! tell us? Since 𝑅! = 0.59, we know that 59% of the variation in points is attributed to these three events.
Regression Statistics
R 0.77 R Square 0.59 Adjusted R Square 0.53 S 151.60 Total number of
observations 26
ANOVA
d.f. SS MS F p-‐level Regression 3 728,795.9 242,932.0 10.6 0.0002
Residual 22 505,598.4 22,981.7 Total 25 1,234,394.3
Coefficients Standard Error 95% lower 95% upper t Stat p-‐level
Intercept 2,244.3 1,932.2 −1,762.8 6,251.5 1.2 0.258 High Jump (m) 1,106.3 521.7 24.4 2,188.1 2.1 0.045 800-‐m (sec) −9.6 8.4 −27.0 7.9 −1.1 0.269 Long Jump (m) 533.4 160.0 201.6 865.2 3.3 0.003
Spring 2014 Math 263 Deb Hughes Hallett
6
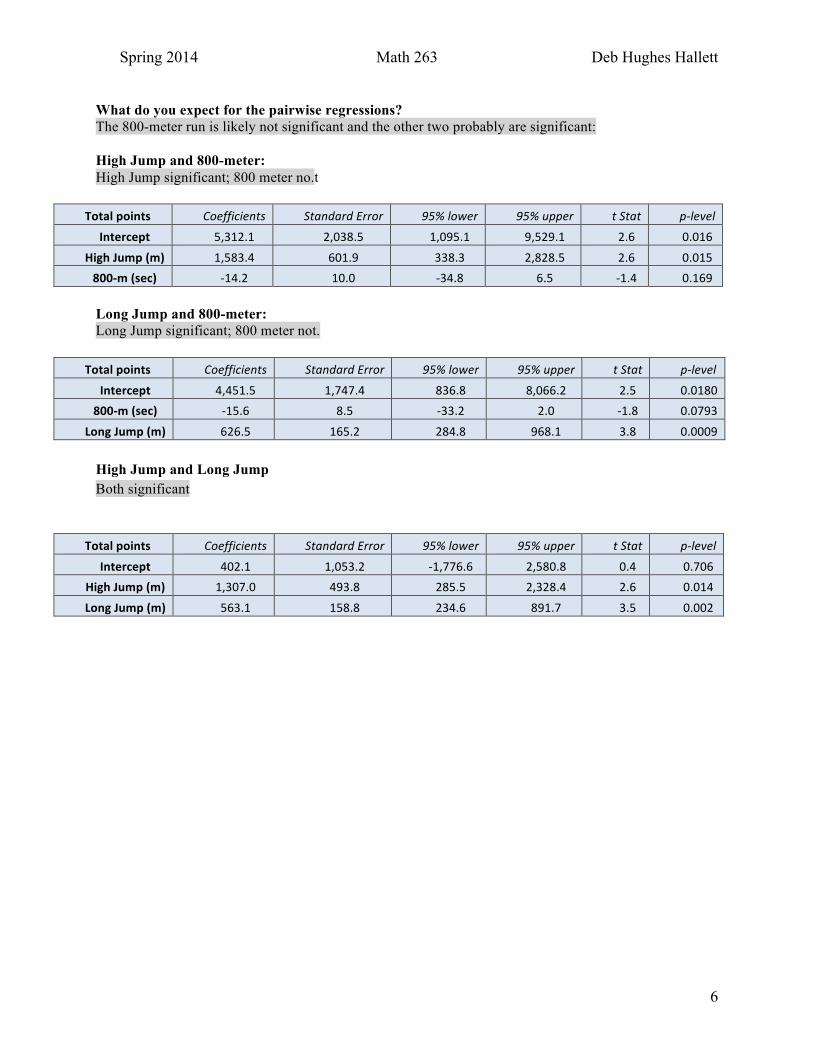
What do you expect for the pairwise regressions? The 800-meter run is likely not significant and the other two probably are significant: High Jump and 800-meter: High Jump significant; 800 meter no.t
Total points Coefficients Standard Error 95% lower 95% upper t Stat p-‐level
Intercept 5,312.1 2,038.5 1,095.1 9,529.1 2.6 0.016
High Jump (m) 1,583.4 601.9 338.3 2,828.5 2.6 0.015 800-‐m (sec) -‐14.2 10.0 -‐34.8 6.5 -‐1.4 0.169 Long Jump and 800-meter: Long Jump significant; 800 meter not.
Total points Coefficients Standard Error 95% lower 95% upper t Stat p-‐level
Intercept 4,451.5 1,747.4 836.8 8,066.2 2.5 0.0180 800-‐m (sec) -‐15.6 8.5 -‐33.2 2.0 -‐1.8 0.0793
Long Jump (m) 626.5 165.2 284.8 968.1 3.8 0.0009
High Jump and Long Jump Both significant
Total points Coefficients Standard Error 95% lower 95% upper t Stat p-‐level
Intercept 402.1 1,053.2 -‐1,776.6 2,580.8 0.4 0.706 High Jump (m) 1,307.0 493.8 285.5 2,328.4 2.6 0.014
Long Jump (m) 563.1 158.8 234.6 891.7 3.5 0.002


![Index [oncallinafrica.files.wordpress.com]Alexander, Capt 225 Alexandra College for Girls 263 ambulance 132 ambulance unit 47, 53, 70, 71, 77 ... Hughes, Lt 229 humpback bridge 70,](https://static.fdocuments.us/doc/165x107/5f4b11373c40001f7f62f973/index-alexander-capt-225-alexandra-college-for-girls-263-ambulance-132-ambulance.jpg)