SpO Monitoring Pulse Oximeter Accuracy Study · SpO2 Monitoring Pulse Oximeter Accuracy Study 2...
19
Pulse Oximeter Accuracy Study SpO2 Monitoring P atient Monitoring T echnical Library 0614-902709A Printed : 2014/5/26
-
Upload
truongdiep -
Category
Documents
-
view
220 -
download
1
Transcript of SpO Monitoring Pulse Oximeter Accuracy Study · SpO2 Monitoring Pulse Oximeter Accuracy Study 2...

Pulse Oximeter Accuracy StudySpO2 Monitoring
Patient Monitoring Technical Library
0614-902709APrinted : 2014/5/26

This document is owned or controlled by Nihon Kohden and is protected by copyright law.Use of this document is permitted for personal, non-commercial purposes only.Modification, reproduction, transmission or distribution of this document is prohibited without prior, written authorization.
©NIHON KOHDEN CORPORATION. All rights reserved.
Information in this document is subject to change without notice.

Nihon Kohden commissioned 2 studies to evaluate Nihon Kohden pulse oximeter and probes at the Hypoxia Research Laboratory, University of California, San Francisco in 2008 and 2010. The following document is a summarized version of the report from those studies, created by Nihon Kohden Corporation. This document has been reviewed and approved by the investigators.
This document is owned and controlled by Nihon Kohden and is protected by copyright law.Use of this document is permitted for personal, non-commercial purposes only.Modification, reproduction, transmission or distribution of this document is prohibited without prior written authorization.©NIHON KOHDEN CORPORATION. All rights reserved.
Information in this document is true accurate to the best of our knowledge at the time of publication.
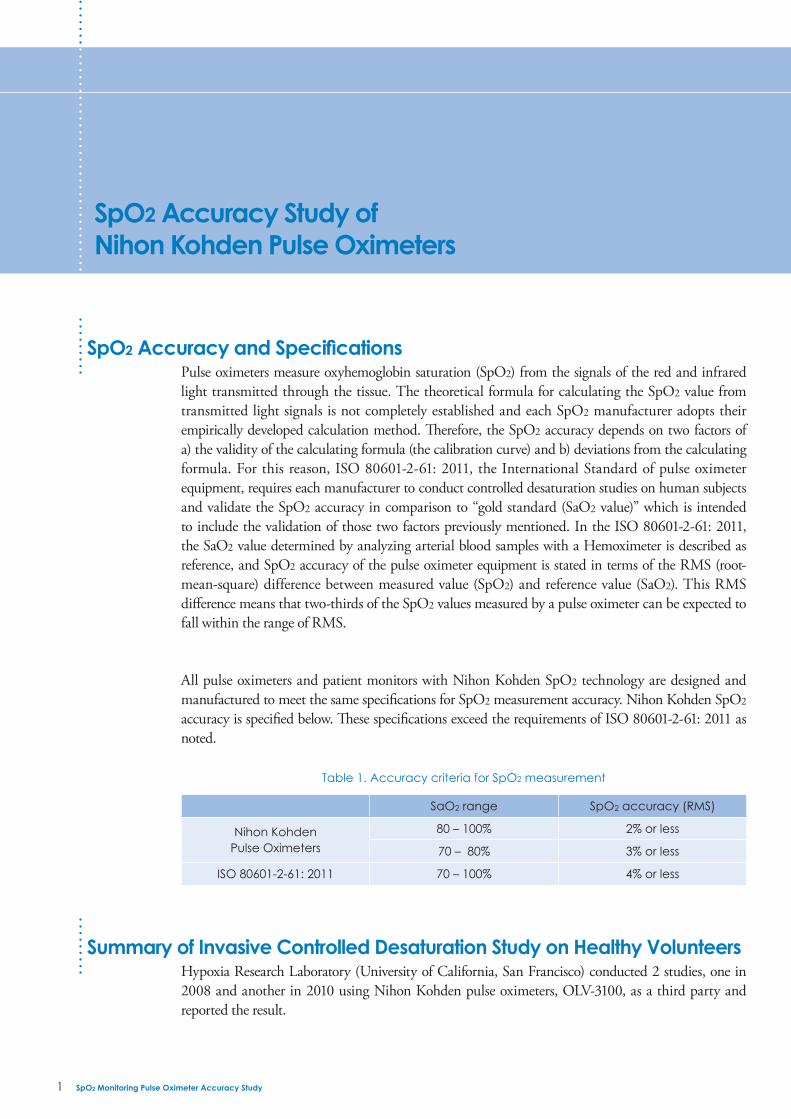
SpO2 Accuracy Study of Nihon Kohden Pulse Oximeters
Table 1. Accuracy criteria for SpO2 measurement
SaO2 range SpO2 accuracy (RMS)
Nihon KohdenPulse Oximeters
80 – 100% 2% or less
70 – 80% 3% or less
ISO 80601-2-61: 2011 70 – 100% 4% or less
1 SpO2 Monitoring Pulse Oximeter Accuracy Study
SpO2 Accuracy and SpecificationsPulse oximeters measure oxyhemoglobin saturation (SpO2) from the signals of the red and infrared light transmitted through the tissue. The theoretical formula for calculating the SpO2 value from transmitted light signals is not completely established and each SpO2 manufacturer adopts their empirically developed calculation method. Therefore, the SpO2 accuracy depends on two factors of a) the validity of the calculating formula (the calibration curve) and b) deviations from the calculating formula. For this reason, ISO 80601-2-61: 2011, the International Standard of pulse oximeter equipment, requires each manufacturer to conduct controlled desaturation studies on human subjects and validate the SpO2 accuracy in comparison to “gold standard (SaO2 value)” which is intended to include the validation of those two factors previously mentioned. In the ISO 80601-2-61: 2011, the SaO2 value determined by analyzing arterial blood samples with a Hemoximeter is described as reference, and SpO2 accuracy of the pulse oximeter equipment is stated in terms of the RMS (root-mean-square) difference between measured value (SpO2) and reference value (SaO2). This RMS difference means that two-thirds of the SpO2 values measured by a pulse oximeter can be expected to fall within the range of RMS.
All pulse oximeters and patient monitors with Nihon Kohden SpO2 technology are designed and manufactured to meet the same specifications for SpO2 measurement accuracy. Nihon Kohden SpO2
accuracy is specified below. These specifications exceed the requirements of ISO 80601-2-61: 2011 as noted.
Summary of Invasive Controlled Desaturation Study on Healthy VolunteersHypoxia Research Laboratory (University of California, San Francisco) conducted 2 studies, one in 2008 and another in 2010 using Nihon Kohden pulse oximeters, OLV-3100, as a third party and reported the result.

SpO2 Monitoring Pulse Oximeter Accuracy Study 2
During these studies, each subject was induced hypoxia to different arterial oxyhemoglobin saturation levels between 70% to 100% by controlling the inspired oxygen concentration, the SpO2 readings of pulse oximeters were recorded simultaneously with drawing arterial blood samples, and statistical analysis was performed between the SpO2 readings and SaO2 reference values from the Hemoximeters. The SaO2 reference values are determined from the readings of the two Hemoximeters.
Exclusion criteria for this statistical analysis were predefined as follows:
- Data which drifted 4% or more during the 10 second plateau reading.
- Data where the two Hemoximeter values disagreed to 2% or more.
A summary for the test result is shown below. The test results show that all tested probes meet the accuracy specifications.
Table 2. SpO2 accuracy (RMS difference) studied byHypoxia Research Laboratory, University of California, San Francisco
Probe typeSaO2 range
70 – 80% 80 – 100%
Finger Probe TL-201T 1.62% 1.07%
Multi-site Y Probe TL-260T 1.83% 1.56%Multi-site Y Probe with clip
adapter for ear lobe TL-260T 2.14% 1.62%
Disposable SpO2 Probe TL-271T 2.05% 1.39%
Finger Probe TL-631T 2.79% 1.45%
Disposable SpO2 Probe TL-051S 1.93% 1.59%
Disposable SpO2 Probe TL-535U 2.01% 1.37%
3 0614-902709A Nihon Kohden Pulse Oximeter Accuracy Study
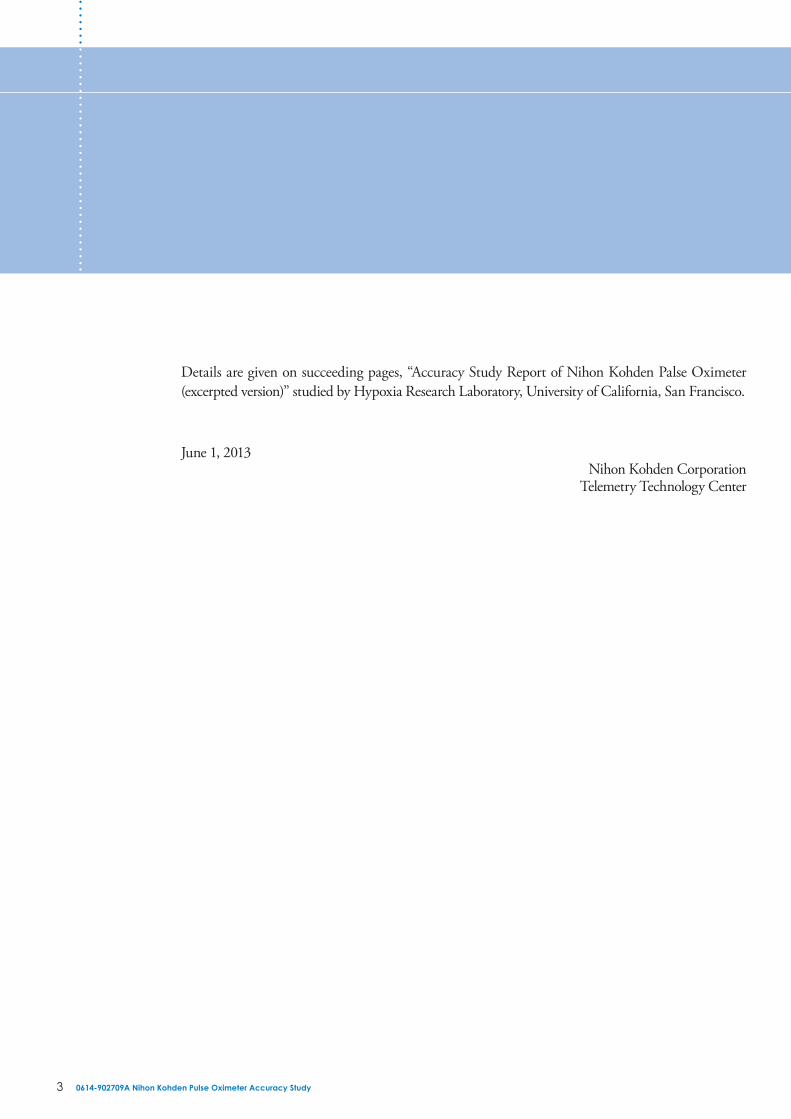
Details are given on succeeding pages, “Accuracy Study Report of Nihon Kohden Palse Oximeter (excerpted version)” studied by Hypoxia Research Laboratory, University of California, San Francisco.
June 1, 2013Nihon Kohden Corporation
Telemetry Technology Center

0614-902709A Nihon Kohden Pulse Oximeter Accuracy Study 4
Accuracy Study Report of
Nihon Kohden Pulse Oximeter Report
Hypoxia Research Laboratory
University of California, San Francisco
March 12-13 and April 16, 2008
John R. Feiner, M.D.
Phillip E. Bickler, Ph.D. M.D.
John W. Severinghaus, M.D.
October 20 and 21, 2010
Phillip E. Bickler, Ph.D. M.D.
John R. Feiner, M.D.

5 0614-902709A Nihon Kohden Pulse Oximeter Accuracy Study
The first study performed March 12-13 and April 16, 2008, included 18 subjects – 5 women and 13 men for four Nihon Kohden oximeter probes, TL-201T, TL-260T, TL-271T, and TL-631T. TL-260T was also tested with a clip adapter for ear lobe in 14 subjects – 4 women and 10 men. And the second study performed October 20 and 21, 2010, included 12 subjects – 7 women and 5 men for 2 probes, TL-535U and TL-051S. All were on model OLV-3100 oximeters. A radial arterial cannula was placed in either the left or right wrist of each subject. Blood gas analysis to determine oxyhemoglobin saturation was performed on two OSM 3® multi-wavelength oximeters (Hemoximeter, Radiometer, Copenhagen). No subject was anemic (Hemoglobin < 10 gm・dl-1).
Each subject had control data taken at the beginning of each experiment, with two control blood samples drawn while breathing room air. Hypoxia was induced to different levels of oxyhemoglobin saturation (between 70 - 100%) by having subjects breathe mixtures of nitrogen, room air, and carbon dioxide. Each plateau level of oxyhemoglobin saturation was maintained for at least 30 seconds and until pulse oximeters readings had stabilized. Two arterial blood samples were then obtained, approximately 30 seconds apart. A total of 24 and 20 samples were obtained per subject, respectively, in the first study and the second study. Data were recorded by Nihon Kohden and provided to UCSF for analysis.
Figure 1. Probes and Pulse Oximeter OLV-3100 used for study
Methods

0614-902709A Nihon Kohden Pulse Oximeter Accuracy Study 6
Data analysis was performed on Excel. Data was excluded if Hemoximeter values disagreed to 2 points or more, or if there was failure to achieve stable pulse oximeter measurements. In the figures, a different marker is used for each study subject. Tables of mean, standard deviation, count and root mean square are provided for each oximeter’s bias in the following ranges of SaO2 (Hemoximeter): 70 - 80%, 80 - 100%. Root mean square error (RMS error) is calculated as follows:
Table 3 and Table 4 show subject data for the first study. Subject #7 in Table 3 was excluded because of an apparent upper respiratory infection. Subject #9 in Table 3 and Subject #6 in Table 5 was excluded because the subjects were unable to complete the study.Table 5 shows subject data for the second study.
Table 3. Subject data for the study for TL-201T, TL-260T, TL-271T, and TL-631T
Subject #1 Caucasian M 30 MediumSubject #2 African M 23 DarkSubject #3 Asian M 25 LightSubject #4 Caucasian F 29 MediumSubject #5 Caucasian M 22 LightSubject #6 Caucasian M 24 LightSubject #7 Caucasian M 33 LightSubject #8 Caucasian F 30 LightSubject #9 Caucasian F 34 LightSubject #10 Caucasian M 28 LightSubject #11 Caucasian M 22 LightSubject #12 Indian F 25 DarkSubject #13 Indian M 25 MediumSubject #14 African M 27 DarkSubject #15 Hispanic/Caucasian F 23 MediumSubject #16 Indian M 21 Med/Dark
Subject Ethnicity Gender Age Skin tone
RMSError = ∑(SpO2 -SaO2)2
n
Data Analysis

7 0614-902709A Nihon Kohden Pulse Oximeter Accuracy Study
Table 4. Subject data for the study for TL-260T with clip adapter for ear lobe
Subject #1 Caucasian M 30 MediumSubject #2 Indian M 28 MediumSubject #3 Asian M 25 LightSubject #4 Caucasian F 29 MediumSubject #5 Caucasian M 22 LightSubject #6 Caucasian M 24 LightSubject #7 Caucasian M 33 LightSubject #8 Caucasian F 30 LightSubject #9 Caucasian F 34 LightSubject #10 Caucasian M 28 LightSubject #11 Caucasian M 22 LightSubject #12 Hispanic/Caucasian M 24 MediumSubject #13 Indian M 25 MediumSubject #14 Hispanic/Caucasian F 23 Medium
Subject Ethnicity Gender Age Skin tone
Table 5. Subject data for the study for TL-535U and TL-051S
Subject #1 Hispanic M 28 MediumSubject #2 Caucasian F 28 Light/MediumSubject #3 Indian M 27 DarkSubject #4 Indian F 28 DarkSubject #5 Asian M 26 MediumSubject #6 Hispanic M 28 MediumSubject #7 Asian F 27 MediumSubject #8 Caucasian F 23 Light/MediumSubject #9 Haitian F 29 DarkSubject #10 Caucasian M 24 LightSubject #11 Hispanic F 25 Light/MediumSubject #12 Asian F 24 Light/Medium
Subject Ethnicity Gender Age Skin tone

0614-902709A Nihon Kohden Pulse Oximeter Accuracy Study 8
‐2
0
2
4
6
8
10
Bias SpO
2‐S
aO2[%
}
Subject 1
Subject 2
Subject 3
Subject 4
Subject 5
Subject 6
Subject 8
Subject 10
Subject 11
Subject 12
‐10
‐8
‐6
‐4
60 65 70 75 80 85 90 95 100
Hemoximeter SaO2 [%}
Subject 12
Subject 13
Subject 14
Subject 15
Subject 16
TL-201T Finger ProbeSpO2 accuracy
Table 6. Result for TL-201T Bias (SpO2-SaO2) Analysis
Probe TL-201T
Hemoximeter SaO2 Range 70 – 80% 80 – 100%
Count 158 464
Mean -0.47% -0.46%
Standard Deviation 1.56% 0.97%
Root Mean Square (RMS) 1.62% 1.07%
Figure 2. TL-201T Bias (SpO2-SaO2)
Pulse Oximeter:OLV-3100Hemoximeter:OSM 3®
Data supply: Hypoxia Research Laboratory, University of California, San Francisco

9 0614-902709A Nihon Kohden Pulse Oximeter Accuracy Study
‐2
0
2
4
6
8
10
Bias SpO
2 ‐S
aO2[%
]
Subject 1
Subject 2
Subject 3
Subject 4
Subject 5
Subject 6
Subject 8
Subject 10
Subject 11
Subject 12
‐10
‐8
‐6
‐4
60 65 70 75 80 85 90 95 100
Hemoximeter SaO2 [%]
Subject 12
Subject 13
Subject 14
Subject 15
Subject 16
TL-260T Multi-site Y ProbeSpO2 accuracy
Table 7. Result for TL-260T Bias (SpO2-SaO2) Analysis
Probe TL-260T
Hemoximeter SaO2 Range 70 – 80% 80 – 100%
Count 158 464
Mean 0.08% -1.01%
Standard Deviation 1.84% 1.18%
Root Mean Square (RMS) 1.83% 1.56%
Figure 3. TL-260T Bias (SpO2-SaO2)
Pulse Oximeter:OLV-3100Hemoximeter:OSM 3®
Data supply: Hypoxia Research Laboratory, University of California, San Francisco

0614-902709A Nihon Kohden Pulse Oximeter Accuracy Study 10
TL-260T Multi-site Y Probe with Clip Adapter for ear lobeSpO2 accuracy
Table 8. Result for TL-260T with clip adapter for ear lobe Bias (SpO2-SaO2) Analysis
Probe TL-260T
Hemoximeter SaO2 Range 70 – 80% 80 – 100%
Count 136 394
Mean 0.20% 0.65%
Standard Deviation 2.14% 1.48%
Root Mean Square (RMS) 2.14% 1.62%
Figure 4. TL-260T with clip adapter for ear lobe Bias (SpO2-SaO2)
Pulse Oximeter:OLV-3100Hemoximeter:OSM 3®
Data supply: Hypoxia Research Laboratory, University of California, San Francisco
‐10
‐8
‐6
‐4
‐2
0
2
4
6
8
10
60 65 70 75 80 85 90 95 100
Bias
SpO
2‐SaO
2 〔%〕
Hemoximeter SaO2 〔%〕
Subject 1
Subject 2
Subject 3
Subject 4
Subject 5
Subject 6
Subject 8
Subject 10
Subject 11
Subject 12
Subject 13
Subject 14

11 0614-902709A Nihon Kohden Pulse Oximeter Accuracy Study
‐2
0
2
4
6
8
10
Bias SpO
2‐S
aO2[%
]
Subject 1
Subject 2
Subject 3
Subject 4
Subject 5
Subject 6
Subject 8
Subject 10
Subject 11
Subject 12
‐10
‐8
‐6
‐4
60 65 70 75 80 85 90 95 100
Hemoximeter SaO2 [%]
Subject 12
Subject 13
Subject 14
Subject 15
Subject 16
TL-271T Adult Disposable SpO2 ProbeSpO2 accuracy
Table 9. Result for TL-271T Bias (SpO2-SaO2) Analysis
Probe TL-271T
Hemoximeter SaO2 Range 70 – 80% 80 – 100%
Count 158 464
Mean 0.84% 0.53%
Standard Deviation 1.88% 1.29%
Root Mean Square (RMS) 2.05% 1.39%
Figure 5. TL-271T Bias (SpO2-SaO2)
Pulse Oximeter:OLV-3100Hemoximeter:OSM 3®
Data supply: Hypoxia Research Laboratory, University of California, San Francisco

0614-902709A Nihon Kohden Pulse Oximeter Accuracy Study 12
‐2
0
2
4
6
8
10
Bias SpO
2‐S
aO2[%
]
Subject 1
Subject 2
Subject 3
Subject 4
Subject 5
Subject 6
Subject 8
Subject 10
Subject 11
S bj 2
‐10
‐8
‐6
‐4
60 65 70 75 80 85 90 95 100
Hemoximeter SaO2 [%}
Subject 12
Subject 13
Subject 14
Subject 15
Subject 16
TL-631T Finger ProbeSpO2 accuracy
Table 10. Result for TL-631T Bias (SpO2-SaO2) Analysis
Probe TL-631T
Hemoximeter SaO2 Range 70 – 80% 80 – 100%
Count 158 464
Mean -1.81% -0.76%
Standard Deviation 2.13% 1.24%
Root Mean Square (RMS) 2.79% 1.45%
Figure 6. TL-631T Bias (SpO2-SaO2)
Pulse Oximeter:OLV-3100Hemoximeter:OSM 3®
Data supply: Hypoxia Research Laboratory, University of California, San Francisco

13 0614-902709A Nihon Kohden Pulse Oximeter Accuracy Study
‐2
0
2
4
6
8
10
Bias SpO
2‐S
aO2[%
]
Subject 1
Subject 2
Subject 3
Subject 4
Subject 5
Subject 7
Subject 8
Subject 9
‐10
‐8
‐6
‐4
60 65 70 75 80 85 90 95 100
Hemoximeter SaO2 [%]
j
Subject 10
Subject 11
Subject 12
Table 11. Result for TL-051S Bias (SpO2-SaO2) Analysis
Probe TL-051S
Hemoximeter SaO2 Range 70 – 80% 80 – 100%
Count 81 178
Mean 0.81% 0.09%
Standard Deviation 1.77% 1.59%
Root Mean Square (RMS) 1.93% 1.59%
Figure 7. TL-051S Bias (SpO2-SaO2)
Pulse Oximeter:OLV-3100Hemoximeter:OSM 3®
Data supply: Hypoxia Research Laboratory, University of California, San Francisco
TL-051S Disposable SpO2 ProbeSpO2 accuracy
0614-902709A Nihon Kohden Pulse Oximeter Accuracy Study 14
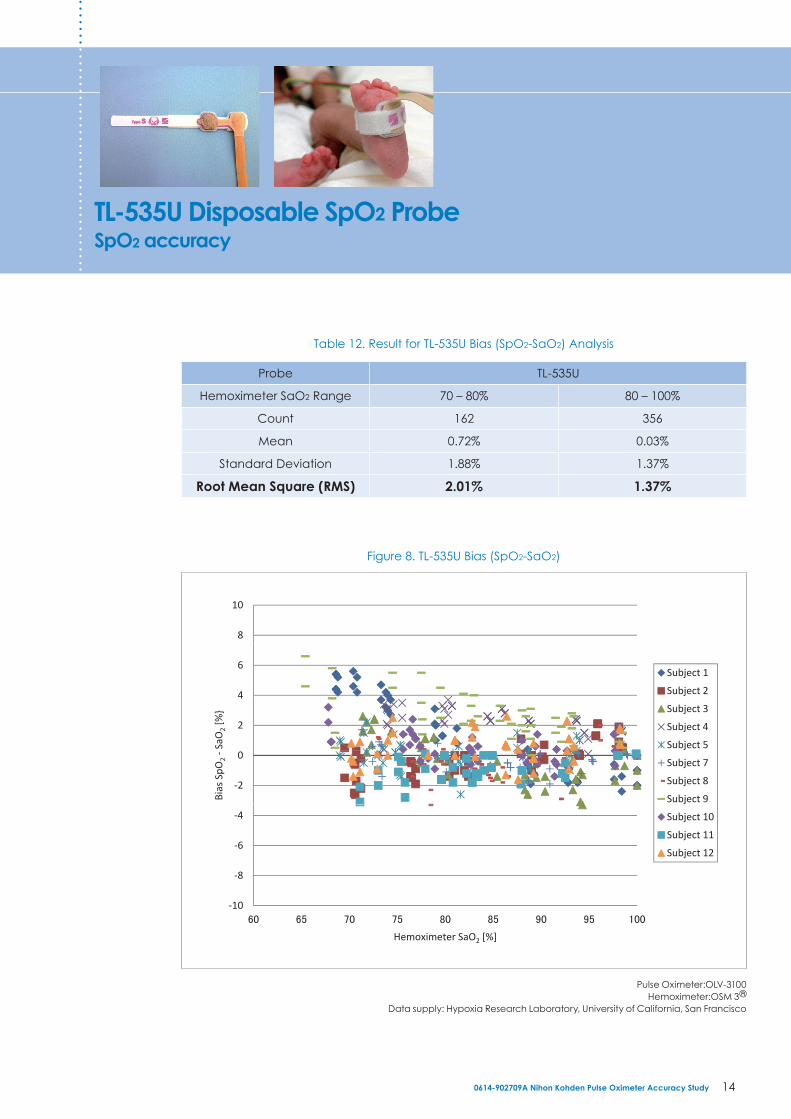
TL-535U Disposable SpO2 ProbeSpO2 accuracy
Table 12. Result for TL-535U Bias (SpO2-SaO2) Analysis
Probe TL-535U
Hemoximeter SaO2 Range 70 – 80% 80 – 100%
Count 162 356
Mean 0.72% 0.03%
Standard Deviation 1.88% 1.37%
Root Mean Square (RMS) 2.01% 1.37%
Figure 8. TL-535U Bias (SpO2-SaO2)
8
10
4
6Subject 1
Subject 2
2
4
SaO
2[%
} Subject 3
Subject 4
Subject 5
‐2
0
Bias SpO
2‐
Subject 7
Subject 8
Subject 9
‐6
‐4 Subject 10
Subject 11
Subject 12
‐10
‐8
j
60 65 70 75 80 85 90 95 100
Hemoximeter SaO2 [%]
Pulse Oximeter:OLV-3100Hemoximeter:OSM 3®
Data supply: Hypoxia Research Laboratory, University of California, San Francisco

First Edition: December 19th, 2008Second Edition: April 1st, 2014
SpO2 MonitoringPulse Oximeter Accuracy StudyPatient Monitoring Technical Library
NIHON KOHDEN CORPORATION1-31-4 Nishiochiai, Shinjuku-ku, Tokyo161-8560, JapanPhone +81 (3) 5996-8036 Fax +81 (3) 5996-8100

Pulse Oximeter Accuracy StudySpO2 Monitoring
http://www.nihonkohden.co.jp/NIHON KOHDEN CORPORATION1-31-4 Nishiochiai, Shinjuku-ku, Tokyo 161-8560, JapanPhone +81 (3) 5996-8036 Fax +81 (3) 5996-8100