
Specifications for Modeling Forest Vegetation and...
29
Appendix E Specifications for Modeling Forest Vegetation and Characterization of Pre and Post-Fire Condition Salvage Recovery Project
-
Upload
duongkhanh -
Category
Documents
-
view
225 -
download
0
Transcript of Specifications for Modeling Forest Vegetation and...

Appendix E
Specifications for Modeling Forest Vegetation and
Characterization of Pre and Post-Fire Condition
Salvage Recovery Project
Appendix E
School Fire Salvage Recovery E-1
APPENDIX E
Specifications For Modeling Forest Vegetation
And National Forest Management Act Analysis:
Pre and Post-Fire Forest Vegetation Conditions
CHANGES BETWEEN DRAFT EIS AND FINAL EIS Changes in Appendix E between the Draft and Final EIS include:
• Minor editorial changes. This appendix describes how vegetation databases were compiled to characterize both pre-fire and post-fire conditions for the School Fire analysis area. It also summarizes pre- and post-fire vegetation conditions using five indicators relevant to the upland forestland portion of the analysis area: potential vegetation, species composition, forest structure, tree density, and insect and disease susceptibility.
This section includes a detailed discussion of the modeling process and assumptions used with the Forest Vegetation Simulator (FVS) and the Fire and Fuels Extension (FFE) to FVS. The documentation, description, instructions and software for the FVS program are available on the internet at www.fs.fed.us/fmsc/fvs. FFE documentation is provided by Reinhardt and Crookston (2003).
Overview of Methods Vegetative analysis and characterizations of stand conditions prior to and following the fire were based on stand examination information, photo interpretation, satellite imagery and the Most-Similar-Neighbor (MSN) imputation program (Crookston et al. 2002). MSN is a method for utilizing existing data to fill in missing data for similar stands (their most similar neighbors) across an analysis area.
MSN requires that general information be available for all stands, such as Landsat satellite imagery and physical site factors derived from a digital elevation model (DEM), and that detailed information be available for some stands, such as field-sampled stand examination data.
The general information available for all stands is used by the MSN program to identify stands without field-sampled data that are most similar to stands having field-sampled data. MSN then supplies, or imputes, the data for stands without field-sampled information. At the conclusion of this process, all forestland within the analysis area can be characterized using field-sampled data.
For the School Fire project, analysis was conducted at two different scales: a mid-scale area formed by combining subwatersheds that include and directly adjoin the School Fire perimeter, and a fine-scale analysis area consisting exclusively of National Forest System lands within the fire perimeter. Note that the mid-scale analysis area includes significant acreage outside the fire perimeter.
In order to examine the environmental effects associated with implementing the School Fire Salvage Recovery Project, it was desirable to have detailed stand examination data for both of the analysis areas.

Appendix E
School Fire Salvage Recovery E-2
To meet this need, the MSN program was used to impute field-sampled data for the north half of the Umatilla National Forest, including both the Pomeroy and Walla Walla Ranger Districts. The MSN imputations were completed in December 2004.
The MSN imputations used a photo-delineated polygon layer derived from aerial photography acquired in 2001 for the Walla Walla Ranger District and in 2002 for the Pomeroy Ranger District. The photo-delineated polygon layer, prepared under contract in 2003-2004, served as the base vegetation layer for the School Fire vegetation analyses.
Satellite imagery (a 2001 Landsat 7 thematic mapper scene) and the DEM variables were used as the general data for every stand, and to determine stand similarity for detailed data imputation. Stand exam data (acquired between 1986 and 2003) was the detailed data used for imputing field-sampled information for polygons without stand exam data.
The MSN program is a module within INFORMS, a nationally supported analysis framework provided with the Natural Resource Information System (NRIS). The field-sampled information used for MSN is stored in an NRIS database application called Field Sampled Vegetation (FSVeg).
The Pomeroy Ranger District has stand examination data for 21% of forestland in the mid-scale analysis area, and for 68% of forestland in the fine-scale analysis area delineated using the School Fire perimeter.
The reference and imputed data for both analysis areas was entered into the Forest Vegetation Simulator (FVS) model developed by the USDA Forest Service (Dixon 2003). In essence, the Forest Vegetation Simulator is a collection of forest growth and development simulation models. Since its initial development in 1973, FVS has evolved to a system of tightly integrated analytical tools.
These modeling and simulation tools, based on a growing body of scientific knowledge gleaned from decades of natural resources research, are built on the framework of the original Prognosis growth and yield model (Stage 1973).
The Fire and Fuels Extension (FFE) to FVS simulates fuel dynamics and potential fire behavior over time and can be used to simulate and predict snag falldown rates, fuel loadings, and parameters affecting fuels accumulation and decay (Reinhardt and Crookston 2003).
The FVS model was used to compare alternative effects for the School Fire Salvage Recovery Project, including salvage timber harvest, fuels treatment, reforestation by planting and natural regeneration, and development of forested wildlife habitat over time.
The FVS model has a variant calibrated for the Blue Mountains (Johnson 1990); it is based on local studies measuring stand characteristics throughout the Blue Mountains physiographic province.
The FVS program models growth and stand characteristics such as canopy cover, average diameter and trees per acre by size class and species composition. This information is used to compare the effects of treatment alternatives on future forest development. The FVS and FFE models were used to examine fuel loadings, habitat conditions, and plant succession scenarios
The growth algorithms in FVS vary by plant association; FVS has the capability to increase or decrease stand growth if measured tree-growth information is included with the input data. Growth projections within FVS are based on average plant association productivity.

Appendix E
School Fire Salvage Recovery E-3
The FVS model uses stand density index (SDI) to estimate tree mortality rates. SDI-based stocking level information for the Blue Mountains is used to calibrate the FVS tree mortality rates. The maximum SDI values used for this purpose are derived from Cochran et al. (1994) and Powell (1999, 2005a).
The FVS model also includes local information about snag falldown rates and decomposition (decay) in order to predict snag and down wood dynamics through time. These decay and falldown rates vary by tree species, size class and the current condition of snags or down logs.
The breaking and falling of snags are simulated in FVS/FFE and the resulting down wood is then added to other surface fuels where further decay modeling occurs. Falldown rates and resulting fuel loadings are important when comparing the environmental effects of removing fuel (or not removing it) on post-fire forest development.
Limitations of the Most Similar Neighbor (MSN) Analysis MSN uses field-sampled stands to impute (or attribute) data for similar stands that do not have field-sampled data. Consequently, MSN results improve as the size of the analysis area increases because this results in a larger number of field-sampled stands for imputation purposes. For the School Fire analysis, MSN results from two neighboring Ranger Districts were used, an area of approximately 745,500 acres.
The MSN program produces “best match” imputations as based on a statistical analysis of specific stand attributes. Thresholds have been established for the normal range of statistical variability for each attribute and when the best match between a sampled and an unsampled stand falls within these thresholds, then the match is deemed “high”. However, when the best match falls outside of these thresholds, then the match is deemed “low”.
For the mid-scale analysis area (approximately 142,240 acres including all ownership categories), the field-sampled reference stands represented 7% of the forestland area, stands with a “high” imputation result represented 80% of the forestland area and stands with a “low” imputation result represented 13% of the forestland area. Many of the “low” imputation results are older regeneration harvest units (plantations) and they are poorly represented by field-sampled stands.
For the fine-scale analysis area (approximately 28,359 acres including all ownership categories within the School Fire perimeter), the field-sampled reference stands represented 9% of the forestland area, stands with a “high” imputation result represented 80% of the forestland area and stands with a “low” imputation result represented 11% of the forestland area. Many of the “low” imputation results are older regeneration harvest units (plantations) and they are poorly represented by field-sampled stands.
Effects of Wildfire Fire effects modeling varied by whether the trees were alive or dead at the time of the fire.
1. Dead Trees In the modeling process, trees that were dead (i.e., snags) at the time of the fire (2005) were either left standing or felled and left on site, depending on species, tree diameter and length of time as a snag. Existing snags that fell during the fire were then partially consumed (in the modeling process) by using the “fuelmove” keyword. Refer to the Wildlife specialist report for further information about how the snags and down logs were modeled.
2. Live Trees Live trees present at the time of the wildfire (2005) were variably killed based on the species, diameter size class and fire severity. The tree mortality rate was based on professional judgment using local

Appendix E
School Fire Salvage Recovery E-4
knowledge about fire effects and how they vary by tree species. The type of fire effects information used in this phase of the process is presented in Table E-1.
All polygons within the School Fire analysis area were assigned to a fire severity level of low, moderate or high based on predicted tree mortality. Tree mortality ranges associated with the fire severity levels are: low (0 to 30% predicted tree mortality), moderate (31 to 74% predicted tree mortality) and high (75%+ predicted tree mortality).
Tree mortality predictions were based on interpretation of orthorectified, multispectral, sub-meter resolution satellite imagery (two QuickBird scenes acquired on September 15 and 20, 2005 by DigitalGlobe, Inc.), and on estimated stand mortality levels that vary by the type and amount of fire injury (Scott et al. 2002, 2003).
Table E-1 Fire Resistance Characteristics For Common Conifer Trees Of The Blue Mountains.
Tree Species
Bark Thickness
Rooting Habit
Bark Resin(Old Bark)
Branching Habit
Foliage Flammability
Overall Resistance
Western larch Very thick Deep Very little High and very open
Low Very high
Ponderosa pine
Very thick Deep Abundant Moderately high and open
Medium High
Douglas-fir (interior)
Very thick Deep Moderate Moderately low and dense
High High
Grand fir Thick Shallow Very little Low and dense High Medium
Western white pine
Medium Medium Abundant High and dense
Medium Medium
Lodgepole pine
Very thin Medium Abundant Moderately high and open
Medium Low
Engelmann spruce
Thin Shallow Moderate Low and dense Medium Low
Subalpine fir Very thin Shallow Moderate Very low and dense
High Very low
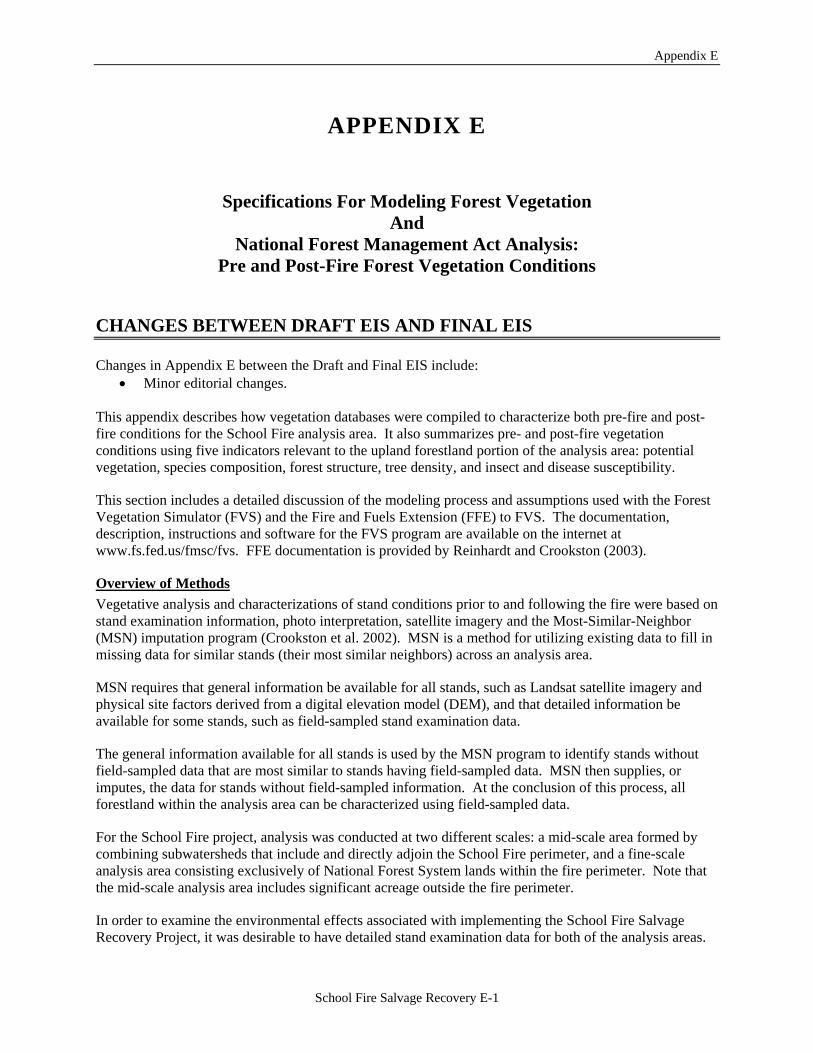
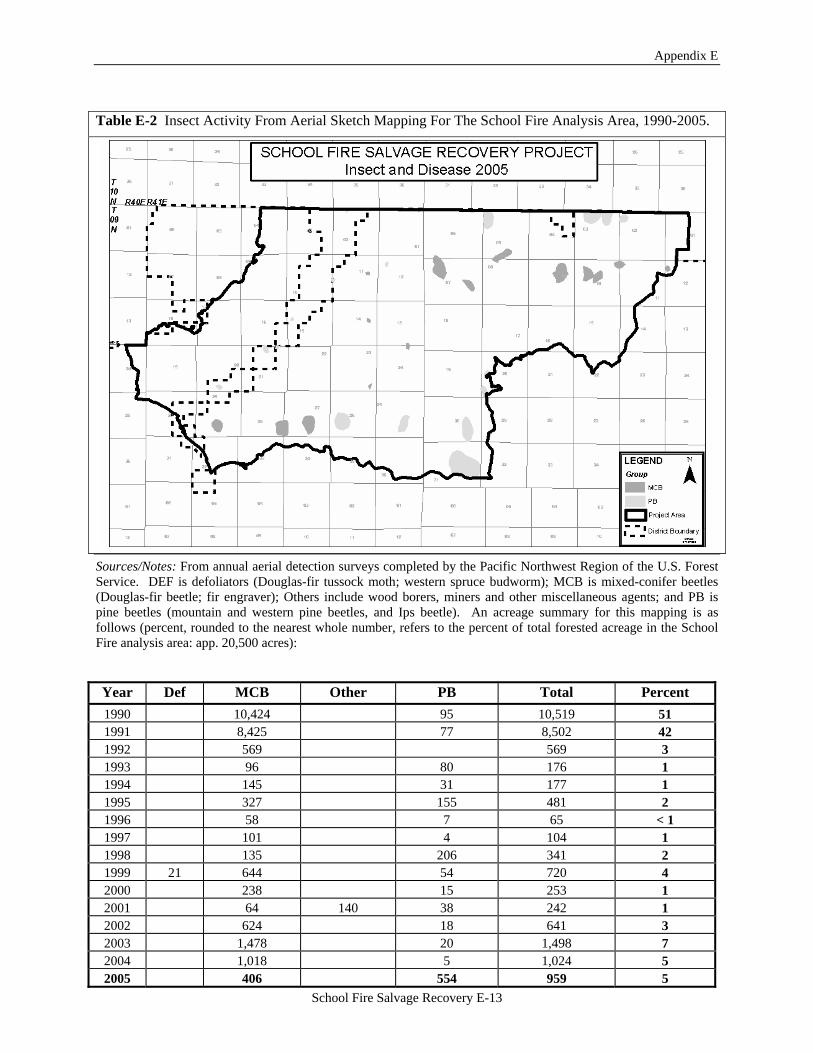
Sources/Notes: Adapted from Flint (1925), Klinka et al. (2000) and Starker (1934). Species rankings reflect the predominant situation for each trait. Species traits can vary during the lifespan of an individual tree, and from one individual to another in a population. For example, grand fir’s bark is thin when young, but relatively thick when mature. Bark Beetle Mortality Consultation with an entomologist from the Blue Mountains Service Center (Donald W. Scott), in conjunction with aerial sketch map information showing insect activity in the School Fire analysis area between 1990 and 2005 (Table E-2), formed the basis for modeling bark beetle mortality for ponderosa pine and interior Douglas-fir.
A wide variety of insects are now present in the School Fire analysis area, or they could be present in the near future as based on historical occurrence patterns: western pine beetle in ponderosa pine; mountain pine beetle in ponderosa, lodgepole or western white pines; pine engraver in lodgepole or ponderosa pines; red turpentine beetle in pines; Douglas-fir beetle in interior Douglas-fir; fir engraver in grand fir (primarily); ambrosia beetles in dead grand firs; and several wood borer species in recently killed trees.

Appendix E
School Fire Salvage Recovery E-5
Tree mortality associated with western pine beetle affecting ponderosa pine was included in the FVS modeling at variable rates differing by host-tree size and abundance. Tree mortality related to Douglas-fir beetle was also included at variable rates based on host-tree diameter and abundance. Wildlife Habitat Wildlife habitat, including snags and down wood, was simulated using FVS and the Fire and Fuels Extension. Refer to the Wildlife specialist report for detailed information about modeling wildlife habitat dynamics through time and the effects of the salvage timber harvest silvicultural activity. Management Activities by EIS Alternative Activities for each unit in each alternative were simulated using the FVS and FFE models. Post-fire conditions, and their evolution through time, were also simulated for all of the vegetation polygons regardless of whether they were included in a recommended activity unit. A description of the activities for each alternative is provided in chapter 2 of the EIS.
Fuel Activities Fuel activities were simulated with the Fire and Fuels Extension to FVS. Refer to the Fuels specialist report for detailed information about modeling fuel dynamics through time and the fuel activities associated with the salvage timber harvest silvicultural activity.
Table E-2 Insect Activity From Aerial Sketch Mapping For The School Fire Analysis Area, 1990-2005.
Appendix E
School Fire Salvage Recovery E-6
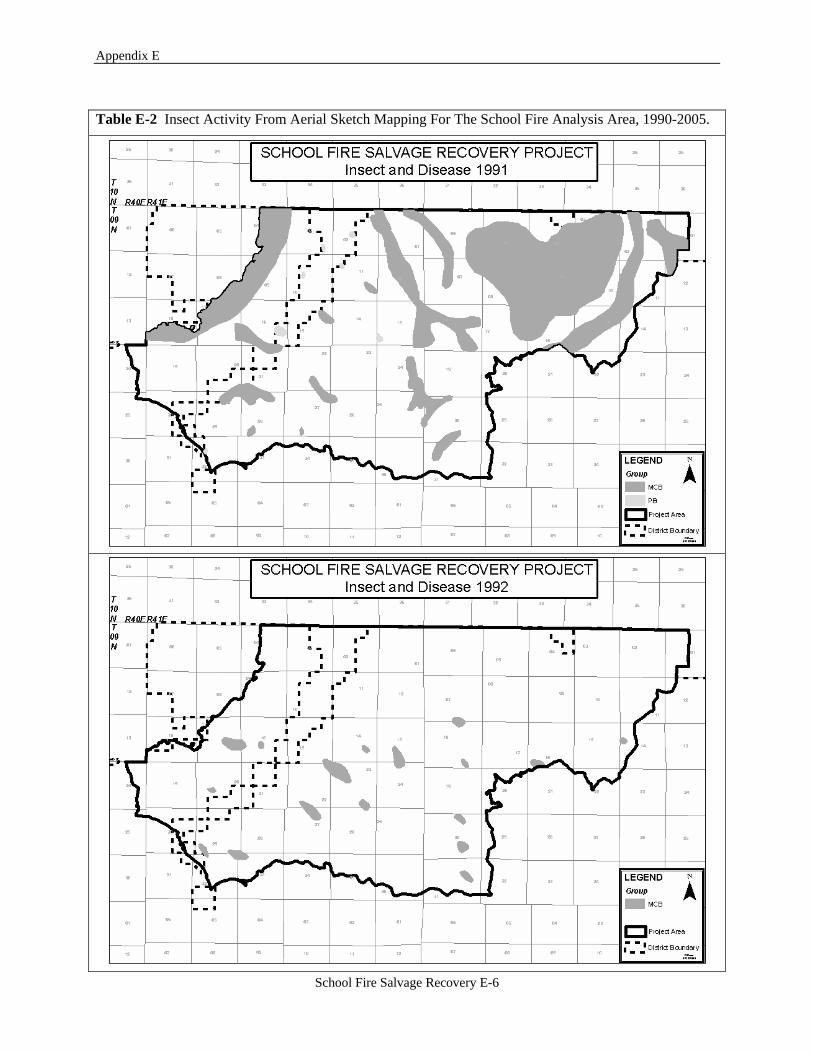
Table E-2 Insect Activity From Aerial Sketch Mapping For The School Fire Analysis Area, 1990-2005.
Appendix E
School Fire Salvage Recovery E-7
Table E-2 Insect Activity From Aerial Sketch Mapping For The School Fire Analysis Area, 1990-2005.

Appendix E
School Fire Salvage Recovery E-8
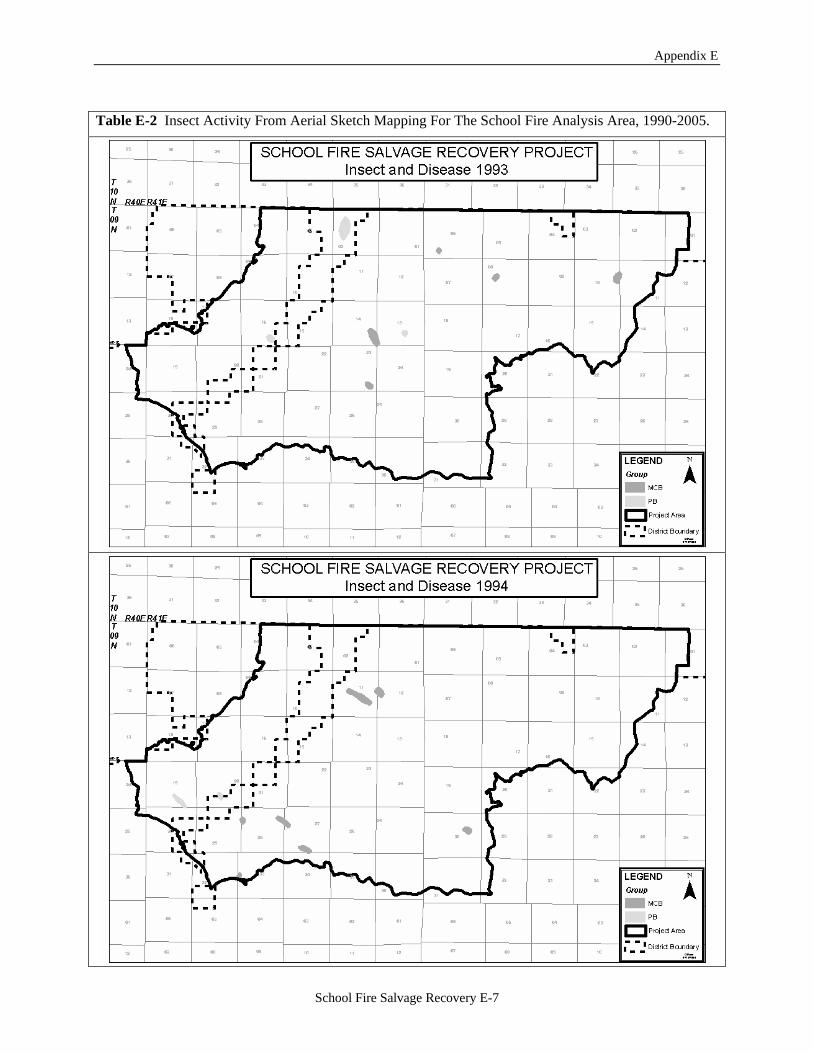
Table E-2 Insect Activity From Aerial Sketch Mapping For The School Fire Analysis Area, 1990-2005.
Appendix E
School Fire Salvage Recovery E-9
Table E-2 Insect Activity From Aerial Sketch Mapping For The School Fire Analysis Area, 1990-2005.

Appendix E
School Fire Salvage Recovery E-10
Table E-2 Insect Activity From Aerial Sketch Mapping For The School Fire Analysis Area, 1990-2005.

Appendix E
School Fire Salvage Recovery E-11
Table E-2 Insect Activity From Aerial Sketch Mapping For The School Fire Analysis Area, 1990-2005.

Appendix E
School Fire Salvage Recovery E-12
Table E-2 Insect Activity From Aerial Sketch Mapping For The School Fire Analysis Area, 1990-2005.
Appendix E
School Fire Salvage Recovery E-13
Table E-2 Insect Activity From Aerial Sketch Mapping For The School Fire Analysis Area, 1990-2005.
Sources/Notes: From annual aerial detection surveys completed by the Pacific Northwest Region of the U.S. Forest Service. DEF is defoliators (Douglas-fir tussock moth; western spruce budworm); MCB is mixed-conifer beetles (Douglas-fir beetle; fir engraver); Others include wood borers, miners and other miscellaneous agents; and PB is pine beetles (mountain and western pine beetles, and Ips beetle). An acreage summary for this mapping is as follows (percent, rounded to the nearest whole number, refers to the percent of total forested acreage in the School Fire analysis area: app. 20,500 acres):
Year Def MCB Other PB Total Percent 1990 10,424 95 10,519 51 1991 8,425 77 8,502 42 1992 569 569 3 1993 96 80 176 1 1994 145 31 177 1 1995 327 155 481 2 1996 58 7 65 < 1 1997 101 4 104 1 1998 135 206 341 2 1999 21 644 54 720 4 2000 238 15 253 1 2001 64 140 38 242 1 2002 624 18 641 3 2003 1,478 20 1,498 7 2004 1,018 5 1,024 5 2005 406 554 959 5
Appendix E
School Fire Salvage Recovery E-14
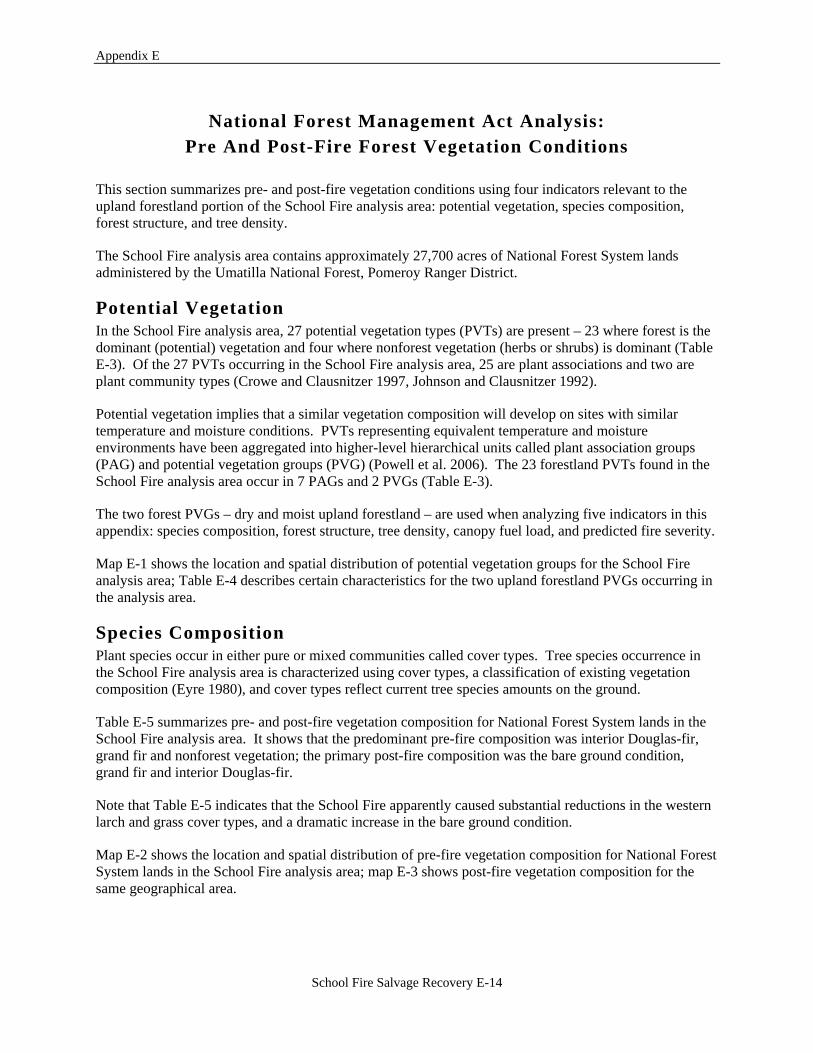
National Forest Management Act Analysis: Pre And Post-Fire Forest Vegetation Conditions
This section summarizes pre- and post-fire vegetation conditions using four indicators relevant to the upland forestland portion of the School Fire analysis area: potential vegetation, species composition, forest structure, and tree density.
The School Fire analysis area contains approximately 27,700 acres of National Forest System lands administered by the Umatilla National Forest, Pomeroy Ranger District.
Potential Vegetation In the School Fire analysis area, 27 potential vegetation types (PVTs) are present – 23 where forest is the dominant (potential) vegetation and four where nonforest vegetation (herbs or shrubs) is dominant (Table E-3). Of the 27 PVTs occurring in the School Fire analysis area, 25 are plant associations and two are plant community types (Crowe and Clausnitzer 1997, Johnson and Clausnitzer 1992).
Potential vegetation implies that a similar vegetation composition will develop on sites with similar temperature and moisture conditions. PVTs representing equivalent temperature and moisture environments have been aggregated into higher-level hierarchical units called plant association groups (PAG) and potential vegetation groups (PVG) (Powell et al. 2006). The 23 forestland PVTs found in the School Fire analysis area occur in 7 PAGs and 2 PVGs (Table E-3).
The two forest PVGs – dry and moist upland forestland – are used when analyzing five indicators in this appendix: species composition, forest structure, tree density, canopy fuel load, and predicted fire severity.
Map E-1 shows the location and spatial distribution of potential vegetation groups for the School Fire analysis area; Table E-4 describes certain characteristics for the two upland forestland PVGs occurring in the analysis area.
Species Composition Plant species occur in either pure or mixed communities called cover types. Tree species occurrence in the School Fire analysis area is characterized using cover types, a classification of existing vegetation composition (Eyre 1980), and cover types reflect current tree species amounts on the ground.
Table E-5 summarizes pre- and post-fire vegetation composition for National Forest System lands in the School Fire analysis area. It shows that the predominant pre-fire composition was interior Douglas-fir, grand fir and nonforest vegetation; the primary post-fire composition was the bare ground condition, grand fir and interior Douglas-fir.
Note that Table E-5 indicates that the School Fire apparently caused substantial reductions in the western larch and grass cover types, and a dramatic increase in the bare ground condition.
Map E-2 shows the location and spatial distribution of pre-fire vegetation composition for National Forest System lands in the School Fire analysis area; map E-3 shows post-fire vegetation composition for the same geographical area.

Appendix E
School Fire Salvage Recovery E-15
Table E-3 Potential Vegetation Of The School Fire Analysis Area
PVG PVT and PAG PVT Acronym Acres Percentof Total
Percent of Forest
ponderosa pine/bluebunch wheatgrass PIPO/AGSP 81 0.3 0.4 Hot dry upland forestland PAG 81 0.3 0.4 Douglas-fir/pinegrass PSME/CARU 207 0.7 1.0 Douglas-fir/common snowberry PSME/SYAL 1,090 3.9 5.3 Douglas-fir/ninebark PSME/PHMA 7,918 28.6 38.6 Douglas-fir/big huckleberry PSME/VAME 292 1.1 1.4 ponderosa pine/common snowberry PIPO/SYAL 251 0.9 1.2 grand fir/elk sedge ABGR/CAGE 24 0.1 0.1 grand fir/birchleaf spiraea ABGR/SPBE 51 0.2 0.2 D
ry U
plan
d Fo
rest
(9
,914
acr
es; 3
6%)
Warm dry upland forestland PAG 9,833 35.5 48.0 subalpine fir/false bugbane ABLA2/TRCA3 22 0.1 0.1 subalpine fir/queencup beadlily ABLA2/CLUN 1,556 5.6 7.6 subalpine fir/big huckleberry ABLA2/VAME 514 1.9 2.5 lodgepole pine(gf)/big huckleberry/pinegrass PICO(ABGR)/VAME/CARU* 6 0.0 0.0 grand fir/twinflower ABGR/LIBO2 2,220 8.0 10.8 grand fir/queencup beadlily ABGR/CLUN 1,200 4.3 5.9 grand fir/big huckleberry ABGR/VAME 2,746 9.9 13.4 Cool moist upland forestland PAG 8,264 29.8 40.3 grand fir/oakfern ABGR/GYDR 156 0.6 0.8 grand fir/sword fern-ginger ABGR/POMU-ASCA3 238 0.9 1.2 Cool very moist upland forestland PAG 394 1.4 1.9 grand fir/Pacific yew/queencup beadlily ABGR/TABR/CLUN 12 0.0 0.1 grand fir/Pacific yew/twinflower ABGR/TABR/LIBO2 60 0.2 0.3 Cool wet upland forestland PAG 72 0.3 0.4 Douglas-fir/oceanspray PSME/HODI 734 2.6 3.6 Douglas-fir/RM maple-ninebark PSME/ACGL-PHMA 99 0.4 0.5 grand fir/RM maple-ninebark ABGR/ACGL-PHMA* 362 1.3 1.8 Warm moist upland forestland PAG 1,195 4.3 5.8 grand fir/Rocky Mountain maple ABGR/ACGL 663 2.4 3.2
Moi
st U
plan
d Fo
rest
(10,
588
acre
s; 3
8%)
Warm very moist upland forestland PAG 663 2.4 3.2 bluebunch wheatgrass AGSP-POSA3 6,565 23.7 Idaho fescue-bluebunch wheatgrass FEID-AGSP 616 2.2 western needlegrass STOC* < 1 0.0 ninebark-common snowberry PHMA-SYAL 4 0.0 administrative site ADMIN < 1 0.0 N
onfo
rest
(2
6%)
Nonforest PVTs 7,185 26.0 Sources/Notes: Summarized from the School Fire vegetation database (NFS lands only). USDA Forest Service (2002a) and Powell et al. (2006) describes how potential vegetation types (PVT) were assigned to plant association groups (PAG) and to potential vegetation groups (PVG). * These PVTs are plant community types; all others are plant associations.

Appendix E
School Fire Salvage Recovery E-16
Dry upland herblandDry upland forestlandMoist upland herblandMoist upland shrublandMoist upland forestlandCold upland herblandAdministrative
Figure E-1 - Map E-1. Potential vegetation groups for National Forest System lands in the School Fire analysis area.
Table E-4 Biophysical Characteristics For Upland Forest Potential Vegetation Groups (PVG).
PVG Area (Acres)
Distur-bances
Fire Regime
Patch Size
Elevation (Feet)
Slope (Percent)
Dominant Aspects
Dry Upland
Forestland
9,914 Fire Insects Harvest
Frequent Surface
1-2,000
4,150 (2584-5207)
46 (0-69)
East South
Southwest
Moist Upland
Forestland
10,588 Insects Fire
Diseases
InfrequentMixed
1-10,000
4,701 (2928-6126)
33 (3-73)
Southwest Southeast
East
Sources/Notes: Acreage values, elevations, slope percents and aspects were summarized from the School Fire vegetation database. Patch size was taken from Johnson (1993). For elevations and slope percents, values are presented in this format: average (minimum-maximum). Fire regime names correspond to Schmidt et al. (2002).
Table E-5 Pre And Post-Fire Vegetation Cover Types For The School Fire Analysis Area.
Code Cover Type Description Pre-FireAcres
Percent Post-Fire Acres
Percent
Grass Grassland communities 7,181 25.9 164 0.6 Shrub Shrubland communities 4 < 0.1 0 0.0
Bare ground Areas without species data (burns) 116 0.4 13,686 49.4 Miscellaneous Administrative site and water < 1 < 0.1 < 1 < 0.1
Nonforest Nonforest cover types 7,301 26.4 13,850 50.0 PSME Douglas-fir forestland 8,793 31.8 5,692 20.6
mix-PSME Mixed Douglas-fir forestland 112 0.4 112 0.4 Douglas-fir Douglas-fir cover types 8,905 32.2 5,804 21.0
ABGR Grand fir forestland 7,974 28.8 6,302 22.8 mix-ABGR Mixed grand fir forestland 106 0.4 106 0.4 Grand fir Grand fir cover types 8,080 29.2 6,408 23.2

Appendix E
School Fire Salvage Recovery E-17
Code Cover Type Description Pre-FireAcres
Percent Post-Fire Acres
Percent
PICO Lodgepole pine forestland 211 0.8 112 0.4 mix-PICO Mixed lodgepole pine forestland 22 0.1 22 0.1
Lodgepole pine Lodgepole pine cover types 233 0.9 134 0.5 ABLA2 Subalpine fir forestland 51 0.2 51 0.2 LAOC Western larch forestland 1,109 4.0 20 0.1 PIPO Ponderosa pine forestland 1,927 7.0 1,339 4.8 PIEN Engelmann spruce forestland 81 0.3 81 0.3
Sources/Notes: Summarized from the School Fire vegetation database; acres and percents include NFS lands only. Forest cover types where one tree species comprises a majority (it has 50% or more of total tree stocking) are named for that species (Eyre 1980). For polygons where no single species predominates, the cover type is named for the plurality species preceded by “mix” to denote a mixed-species composition.
Grand firSubalpine firWestern larchLodgepole pineEngelmann spruceInterior Douglas-firPonderosa pineGrass/Herbs/ShrubsWaterBaregroundAdministrative
Figure E-2 -Map E-2. Pre-fire vegetation composition for National Forest System lands in the School Fire analysis area.
Historical Range of Variability A recurring theme in forest ecology literature is the historical range of variability (HRV). The HRV concept is used to characterize fluctuations or variations in ecosystem conditions and processes over a period of time (Figure E-4).
It is now understood that ecosystem conditions change as disturbance processes affect them; when disturbances act with a characteristic frequency and magnitude (severity, intensity), ecosystems respond by exhibiting a particular behavior and complexity (Aplet and Keeton 1999, Landres et al. 1999, Morgan et al. 1994, Swanson et al. 1994).

Appendix E
School Fire Salvage Recovery E-18
HRV recognizes that complex ecosystems have a range of conditions in which they are resilient and self-sustaining, and beyond which they move into a state of disequilibrium (Egan and Howell 2001, Holling and Meffe 1996, Kaufmann et al. 1994). HRV generally refers to a range of reference conditions existing prior to Euro-American emigration (a timeframe typically defined as the early to mid 1800s).
Grand firSubalpine firWestern larchLodgepole pineEngelmann spruceInterior Douglas-firPonderosa pineGrass/Herbs/ShrubsWaterBaregroundAdministrative
Figure E-3 - Map E-3. Post-fire vegetation composition for National Forest System lands in the School Fire analysis area.
The type and frequency of presettlement disturbances can serve as a management template for maintaining sites within their historical range of plant composition and vegetation structures if landscapes can be maintained within HRV, they stand a good chance of maintaining their biological diversity and ecological integrity through time (Aplet and Keeton 1999, Holling and Meffe 1996, Landres et al. 1999).
At a landscape scale, a forest might be considered healthy or sustainable if the spatial and temporal patterns of composition, structure and density are within HRV for that landscape type (Schmidt et al. 2002). HRV is intended to serve as a benchmark from which change can be measured; it is not a specific condition that active restoration treatments attempt to recreate (USDA Forest Service 1997).

Appendix E
School Fire Salvage Recovery E-19
Upper limitof range
Lower limitof range
TIME
PER
CEN
T O
F LA
ND
SCAP
E
Figure E-4 The historical range of variability (HRV) is used to evaluate whether ecosystem components are functioning properly in a temporal context (Aplet and Keeton 1999, Morgan et al. 1994, Swanson et al. 1994).
Broad-scale assessments completed for the Blue Mountains physiographic province and the interior Columbia River basin suggest that upland forest ecosystems could be characterized as healthy, sustainable and resilient if three of their components (species composition, forest structure, tree density) are within HRV (Caraher et al. 1992; Gast et al. 1991; Lehmkuhl et al. 1994; Quigley et al. 1996; USDA Forest Service 2002b, 2002c).
HRV Analysis for Species Composition Recent broad-scale assessments concluded that for dry forestland, existing vegetation conditions are out-of-balance when compared with historical conditions (Caraher et al. 1992, Hessburg et al. 1999, Lehm-kuhl et al. 1994, Quigley and Arbelbide 1997).
Because active management suppressed surface fires over several return intervals (fire cycles), dry sites historically dominated by ponderosa pine have changed more than any other forest ecosystem over the past 90 years (Hessburg et al. 2005).
Seventy-four percent of National Forest System lands in the School Fire analysis area are forested (Table E-3); 48 percent of this acreage is classified as dry upland forestland and 52 percent is moist upland forestland (Table E-4).
An historical range of variability (HRV) analysis was completed for existing species composition on each of these PVGs separately (dry and moist upland forestland); HRV results are presented in Table E-6 for the pre-fire vegetation composition and in Table E-7 for the post-fire vegetation composition.
Table E-6 Historical range of variability analysis for pre-fire vegetation composition.
DRY UPLAND FORESTLAND PVG MOIST UPLAND FORESTLAND PVG Historical Range Pre-Fire Amount Historical Range Pre-Fire Amount
Cover Type
Percent Acres Percent Acres Percent Acres Percent Acres Grass-forb 0-5 0-496 0 0 0-5 0-529 1 116
Shrub 0-5 0-496 0 0 0-5 0-529 0 0 Western juniper 0-5 0-496 0 0 Ponderosa pine 50-90 4957-8923 12 1226 5-15 529-1588 7 700
Douglas-fir 5-15 496-1487 70 6974 15-30 1588-3176 18 1931 Western larch 0-10 0-991 0 0 10-30 1059-3176 11 1109
Broadleaved trees 0-5 0-529 0 0

Appendix E
School Fire Salvage Recovery E-20
DRY UPLAND FORESTLAND PVG MOIST UPLAND FORESTLAND PVG Historical Range Pre-Fire Amount Historical Range Pre-Fire Amount
Cover Type
Percent Acres Percent Acres Percent Acres Percent Acres Lodgepole pine 0-5 0-496 0 0 5-30 529-3176 2 233
Western white pine 0-5 0-529 0 0 Grand fir 1-5 99-496 17 1714 5-30 529-3176 60 6366 Spruce-fir 0-15 0-1588 1 132
Sources/Notes: Pre-fire amounts, derived from the School Fire vegetation database, include NFS lands only. Gray shading indicates cover types that are either above or below the historical range of variability. Historical ranges are approximate and were adapted from Morgan and Parsons (2000); they were based on multiple 1200-year simulations representing landscapes in a “dynamic equilibrium” with their disturbance regimes.
The information presented in Table E-6 suggests that for the pre-fire vegetation composition, dry upland forestland supported too much of the grand fir and interior Douglas-fir forest cover types and too little of the ponderosa pine forest cover type; moist upland forestland supported too much of the grand fir forest cover type and too little of the lodgepole pine forest cover type.
Table E-7 Historical Range Of Variability Analysis For Immediate Post-Fire Vegetation Composition.
DRY UPLAND FORESTLAND PVG MOIST UPLAND FORESTLAND PVG Historical Range Post-Fire Amount Historical Range Post-Fire Amount
Cover Type
Percent Acres Percent Acres Percent Acres Percent Acres Grass-forb 0-5 0-496 36 3609 0-5 0-529 29 3056
Shrub 0-5 0-496 0 0 0-5 0-529 0 0 Western juniper 0-5 0-496 0 0 Ponderosa pine 50-90 4957-8923 8 756 5-15 529-1588 6 583
Douglas-fir 5-15 496-1487 45 4417 15-30 1588-3176 13 1388 Western larch 0-10 0-991 0 0 10-30 1059-3176 0 20
Broadleaved trees 0-5 0-529 0 0 Lodgepole pine 0-5 0-496 0 0 5-30 529-3176 1 135
Western white pine 0-5 0-529 0 0 Grand fir 1-5 99-496 11 1133 5-30 529-3176 50 5275 Spruce-fir 0-15 0-1588 1 132
Sources/Notes: Post-fire amounts, derived from the School Fire vegetation database, include NFS lands only. Gray shading indicates cover types that are either above or below the historical range of variability. Historical ranges are approximate and were adapted from Morgan and Parsons (2000); they were based on multiple 1200-year simulations representing landscapes in a “dynamic equilibrium” with their disturbance regimes.
The post-fire vegetation composition information presented in Table E-7 suggests that dry upland forestland currently supports too much of the grass-forb, grand fir and interior Douglas-fir vegetation cover types and too little of the ponderosa pine forest cover type; moist upland forestland supports too much of the grass-forb and grand fir vegetation cover types and too little of the interior Douglas-fir, western larch and lodgepole pine forest cover types.
The post-fire results presented in Table E-7 demonstrate the temporal aspects of an HRV analysis – they illustrate that the entire School Fire analysis area was recently affected by wildfire and the resulting structure classes are not yet in dynamic equilibrium with a landscape-scale disturbance regime (Blackwood 1998).
Appendix E
School Fire Salvage Recovery E-21
Forest Structure Oliver and Larson (1996) developed a classification system for forest structure involving 4 structural stages. Oliver and Larson’s (1996) classification system works well for conifer forests west of the Cascade Mountains, but it does not adequately describe forest conditions for the interior Pacific Northwest where structure is more varied. Therefore, the Oliver and Larson (1996) system was expanded to 8 classes to include a wider spectrum of structural variation (O’Hara et al. 1996).
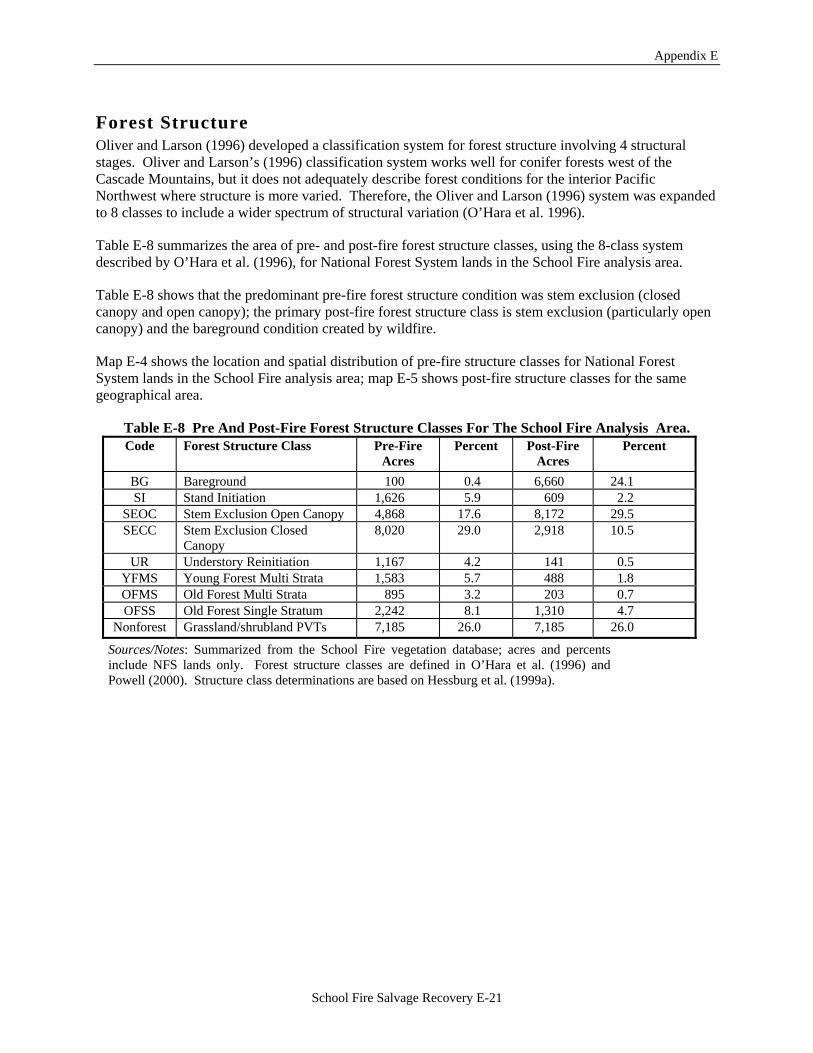
Table E-8 summarizes the area of pre- and post-fire forest structure classes, using the 8-class system described by O’Hara et al. (1996), for National Forest System lands in the School Fire analysis area.
Table E-8 shows that the predominant pre-fire forest structure condition was stem exclusion (closed canopy and open canopy); the primary post-fire forest structure class is stem exclusion (particularly open canopy) and the bareground condition created by wildfire.
Map E-4 shows the location and spatial distribution of pre-fire structure classes for National Forest System lands in the School Fire analysis area; map E-5 shows post-fire structure classes for the same geographical area.
Table E-8 Pre And Post-Fire Forest Structure Classes For The School Fire Analysis Area. Code Forest Structure Class Pre-Fire
Acres Percent Post-Fire
Acres Percent
BG Bareground 100 0.4 6,660 24.1 SI Stand Initiation 1,626 5.9 609 2.2
SEOC Stem Exclusion Open Canopy 4,868 17.6 8,172 29.5 SECC Stem Exclusion Closed
Canopy 8,020 29.0 2,918 10.5
UR Understory Reinitiation 1,167 4.2 141 0.5 YFMS Young Forest Multi Strata 1,583 5.7 488 1.8 OFMS Old Forest Multi Strata 895 3.2 203 0.7 OFSS Old Forest Single Stratum 2,242 8.1 1,310 4.7
Nonforest Grassland/shrubland PVTs 7,185 26.0 7,185 26.0
Sources/Notes: Summarized from the School Fire vegetation database; acres and percents include NFS lands only. Forest structure classes are defined in O’Hara et al. (1996) and Powell (2000). Structure class determinations are based on Hessburg et al. (1999a).

Appendix E
School Fire Salvage Recovery E-22
BaregroundNonforestStand initiationYoung forest multi strataStem exclusion (CC & OC)Understory reinitiationOld forest (SS & MS)
Figure E-5 - Map E-4. Pre-fire forest structure classes for National Forest System lands in the School Fire analysis area.
HRV Analysis for Forest Structure An historical range of variability (HRV) analysis was used to evaluate forest structure for the School Fire analysis area; results are provided in Table E-9 for pre-fire forest structure classes and in Table E-10 for post-fire forest structure classes.
Tables E-9 and E-10 summarize the current percentage of each forest structure class by potential vegetation group (PVG); the historical range for each structure class is also shown.
The HRV results for pre-fire forest structure classes (Table E-9) show that: • For dry upland forestland, the stand initiation (SI), young forest multi strata (YFMS) and old forest
single stratum (OFSS) structure classes are below the lower limits of their historical ranges, and the stem exclusion closed canopy (SECC) structure class is above the upper limit of its historical range.
• For moist upland forestland, only one structure class is within its historical range of variability (stem exclusion closed canopy, SECC); all other structure classes are either above or below the limits of their historical ranges.

Appendix E
School Fire Salvage Recovery E-23
BaregroundNonforestStand initiationYoung forest multi strataStem exclusion (CC & OC)Understory reinitiationOld forest (SS & MS)
Figure E-6 - Map E-5. Post-fire forest structure classes for National Forest System lands in the School Fire analysis area.
Table E-9 Historical Range Of Variability Analysis For Pre-Fire Forest Structure Classes. DRY UPLAND FORESTLAND PVG MOIST UPLAND FORESTLAND PVG Historical Range Pre-Fire Amount Historical Range Pre-Fire Amount Structure
Class Percent Acres Percent Acres Percent Acres Percent Acres BG/SI 5-15 496-1487 1 75 1-10 106-1059 16 1651 SEOC 5-20 496-1983 9 924 0-5 0-529 37 3945 SECC 1-10 99-991 63 6279 5-25 529-2647 16 1741
UR 1-10 99-991 9 865 5-25 529-2647 3 302 YFMS 5-25 496-2478 3 330 40-60 4235-6353 12 1253 OFMS 5-20 496-1983 7 699 10-30 1059-3176 2 196 OFSS 15-55 1487-5453 7 742 0-5 0-529 14 1501
Sources/Notes: Summarized from the School Fire vegetation database; pre-fire amounts include NFS lands only. Gray shading indicates structure classes that are either above or below the historical range of variability. Upland forestland potential vegetation groups (PVG) are described in Table E-3. Historical percentages (H%) were derived from Hall (1993), Johnson (1993) and USDA Forest Service (1995), as summarized in Blackwood (1998). Forest structure classes are described in Table E-8. Note that the bareground structure class (BG in Table E-8) was combined with stand initiation (SI) for this analysis.
The HRV results for post-fire forest structure classes (Table E-10) show that: • For dry upland forestland, only one structure class is within its historical range of variability
(understory reinitiation, UR); all other structure classes are either above or below the limits of their historical ranges.
• For moist upland forestland, every structure class is either above or below the limits of its historical range.

Appendix E
School Fire Salvage Recovery E-24
Table E-10 Historical Range Of Variability Analysis For Immediate (2005) Post-Fire Forest Structure Classes.
DRY UPLAND FORESTLAND PVG MOIST UPLAND FORESTLAND PVG Historical Range Post-Fire Amount Historical Range Post-Fire AmountStructure
Class Percent Acres Percent Acres Percent Acres Percent Acres BG/SI 5-15 496-1487 40 3947 1-10 106-1059 31 3322 SEOC 5-20 496-1983 26 2529 0-5 0-529 53 5643 SECC 1-10 99-991 26 2591 5-25 529-2647 3 327
UR 1-10 99-991 1 60 5-25 529-2647 1 82 YFMS 5-25 496-2478 1 74 40-60 4235-6353 4 415 OFMS 5-20 496-1983 1 109 10-30 1059-3176 1 94 OFSS 15-55 1487-5453 6 605 0-5 0-529 7 706
Sources/Notes: Summarized from the School Fire vegetation database; post-fire amounts include NFS lands only. Gray shading indicates structure classes that are either above or below the historical range of variability. Upland forestland potential vegetation groups (PVG) are described in Table E-3. Historical percentages (H %) were derived from Hall (1993), Johnson (1993) and USDA Forest Service (1995), as summarized in Blackwood (1998). Forest structure classes are described in Table E-8. Note that the bareground structure class (BG in Table E-8) was combined with stand initiation (SI) for this analysis.
The post-fire results presented in Table E-10 demonstrate the temporal aspects of an HRV analysis – they illustrate that the entire School Fire analysis area was recently affected by wildfire and the resulting structure classes are not yet in dynamic equilibrium with a landscape-scale disturbance regime (Blackwood 1998).
Forest Canopy Layering After fire suppression allowed interior Douglas-fir and grand fir to accumulate on dry sites because surface fire was prevented from fulfilling its role as a tree-thinning process, vertical forest structure was transformed when leaf area (foliage biomass) shifted downward from one high canopy layer to multiple low layers (Agee 1996a, Arno et al. 1995, Brown et al. 2003, Graham et al. 1999).
This transformation of vertical forest structure created understory layers functioning as ladder fuel, increasing the probability that surface fire will transition to crown fire (Fiedler et al. 2004, Graham et al. 2004, Mason et al. 2003, Peterson et al. 2005, Stephens 1998).
HRV Analysis for Pre-Fire Canopy Layering How much single-layer and multi-layer structure would have been expected for upland forestland sites? Table E-11 presents an historical range of variability (HRV) analysis for pre-fire canopy layering on upland forestland sites (Powell 2003).
Table E-11 shows that for pre-fire conditions on dry upland forestland, both single and multiple canopy layering are within their historical ranges of variability.
For pre-fire conditions on moist upland forestland, Table E-11 shows that both single and multiple layering are within their historical ranges of variability, but they are right at the upper or lower limits of the historical ranges.
Because the School Fire Salvage Recovery Project analysis area was recently affected by broad-scale wildfire, the existing tree canopy layering situation is not yet in dynamic equilibrium with a landscape-level disturbance regime; therefore, post-fire tree canopy layering was not analyzed.

Appendix E
School Fire Salvage Recovery E-25
Table E-11 HRV Analysis For Tree Canopy Layering For Pre-Fire Conditions.
Dry Upland Forestland PVG Moist Upland Forestland PVG Canopy Layering Historical
Percentage Current
Percentage Historical
Percentage Current
Percentage Single 25-100 52 6-45 45
Multiple 10-55 48 55-115 55
Sources/Notes: Current percentages, summarized from the School Fire vegetation database, include NFS lands only. Gray shading indicates canopy layering that is either above or below the historical range of variability. Historical ranges were derived from Table E-8; the single-layer condition is a combination of SI, SEOC, SECC and OFSS; the multiple-layer condition is a combination of UR, YFMS and OFMS.
Tree Density Overstocked forests have tree density levels in a self-thinning zone where trees compete aggressively for moisture, sunlight and nutrients. Forests in the self-thinning zone experience mortality as crowded trees die from competition or are killed by insects and diseases that preferentially seek out trees under stress (Powell 1999).
Published stocking guidelines were used to analyze pre-fire tree density levels for the School Fire analysis area (Cochran et al. 1994, Powell 1999). By using the stocking guidelines in conjunction with potential vegetation groups, it was possible to estimate how much forestland acreage was overstocked before the fire occurred (Table E-12); the assessment protocol is described in Powell (2005a).
Results of the tree density analysis are summarized in Table E-12; it shows that a very high percentage of dry upland forestland in the School Fire analysis area was overstocked before the fire, and that a smaller proportion of moist upland forestland had moderate or high tree density levels.
The high amount of overstocked dry upland forestland (which is defined as a combination of the moderate and high density classes in Table E-12) was one result of fire suppression since early in the 20th century (Heyerdahl 1997, Heyerdahl et al. 2001) – dry forests became uncharacteristically dense after surface fire was prevented from functioning as a tree-thinning ecosystem process (Powell et al. 2001).
Historical Tree Density Percentages It is estimated that with a properly functioning disturbance regime influenced primarily by frequent surface fire (Agee 1998), dry upland forestland had 60% of its acreage supporting low-density forest, 30% supporting moderate-density forest and 10% supporting high-density forest.
Table E-12 shows that the dry upland forestland portion of the School Fire analysis area had more acreage supporting high-density forest than would be expected (78% now; 10% historically), and less acreage supporting low-density forest (16% now; 60% historically) or moderate-density forest (6% now; 30% historically).
It is estimated that with a properly functioning disturbance regime influenced primarily by mixed-severity fire (Agee 1998) and defoliating insects, moist forestland had 30% of its acreage supporting low-density forest, 50% supporting moderate-density forest and 20% supporting high-density forest.
Table E-12 shows that the moist forestland portion of the School Fire analysis area had more acreage supporting high-density forest (28% now; 20% historically) or low-density forest (47% now; 30% historically) than would be expected, and less acreage supporting moderate-density forest (25% now; 50% historically).
Appendix E
School Fire Salvage Recovery E-26
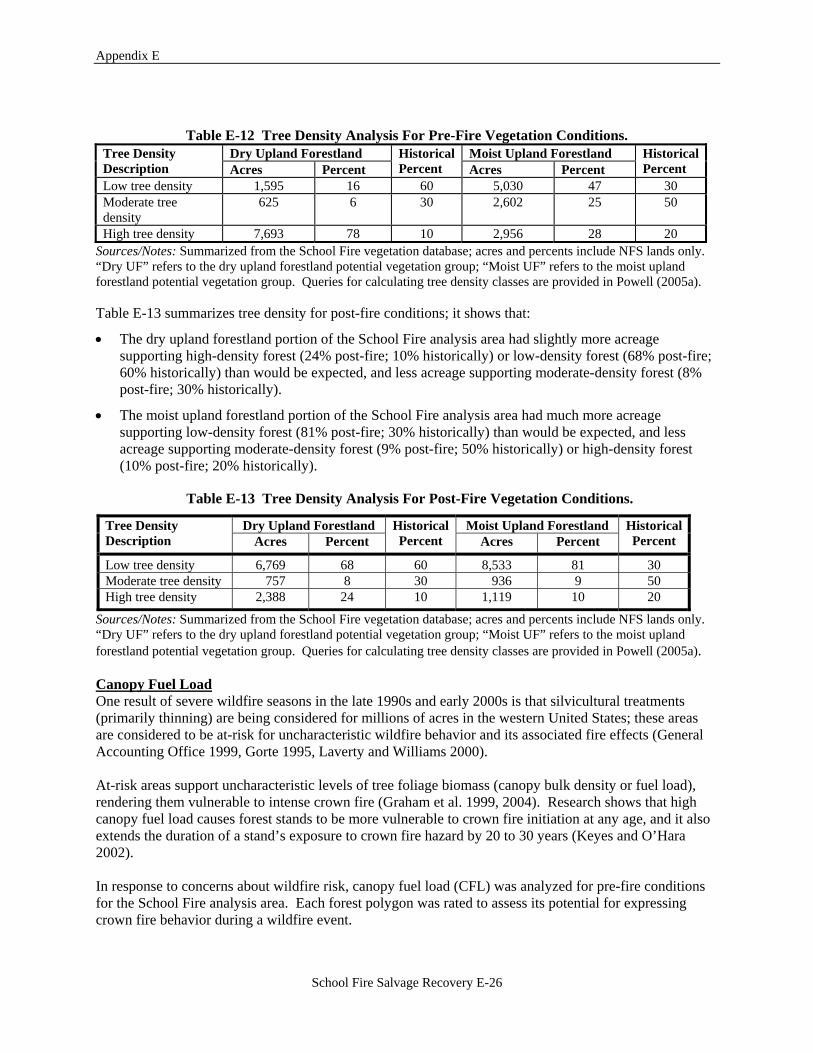
Table E-12 Tree Density Analysis For Pre-Fire Vegetation Conditions.
Dry Upland Forestland Moist Upland Forestland Tree Density Description Acres Percent
HistoricalPercent Acres Percent
HistoricalPercent
Low tree density 1,595 16 60 5,030 47 30 Moderate tree density
625 6 30 2,602 25 50
High tree density 7,693 78 10 2,956 28 20 Sources/Notes: Summarized from the School Fire vegetation database; acres and percents include NFS lands only. “Dry UF” refers to the dry upland forestland potential vegetation group; “Moist UF” refers to the moist upland forestland potential vegetation group. Queries for calculating tree density classes are provided in Powell (2005a). Table E-13 summarizes tree density for post-fire conditions; it shows that:
• The dry upland forestland portion of the School Fire analysis area had slightly more acreage supporting high-density forest (24% post-fire; 10% historically) or low-density forest (68% post-fire; 60% historically) than would be expected, and less acreage supporting moderate-density forest (8% post-fire; 30% historically).
• The moist upland forestland portion of the School Fire analysis area had much more acreage supporting low-density forest (81% post-fire; 30% historically) than would be expected, and less acreage supporting moderate-density forest (9% post-fire; 50% historically) or high-density forest (10% post-fire; 20% historically).
Table E-13 Tree Density Analysis For Post-Fire Vegetation Conditions.
Dry Upland Forestland Moist Upland Forestland Tree Density Description Acres Percent
HistoricalPercent Acres Percent
HistoricalPercent
Low tree density 6,769 68 60 8,533 81 30 Moderate tree density 757 8 30 936 9 50 High tree density 2,388 24 10 1,119 10 20
Sources/Notes: Summarized from the School Fire vegetation database; acres and percents include NFS lands only. “Dry UF” refers to the dry upland forestland potential vegetation group; “Moist UF” refers to the moist upland forestland potential vegetation group. Queries for calculating tree density classes are provided in Powell (2005a). Canopy Fuel Load One result of severe wildfire seasons in the late 1990s and early 2000s is that silvicultural treatments (primarily thinning) are being considered for millions of acres in the western United States; these areas are considered to be at-risk for uncharacteristic wildfire behavior and its associated fire effects (General Accounting Office 1999, Gorte 1995, Laverty and Williams 2000). At-risk areas support uncharacteristic levels of tree foliage biomass (canopy bulk density or fuel load), rendering them vulnerable to intense crown fire (Graham et al. 1999, 2004). Research shows that high canopy fuel load causes forest stands to be more vulnerable to crown fire initiation at any age, and it also extends the duration of a stand’s exposure to crown fire hazard by 20 to 30 years (Keyes and O’Hara 2002). In response to concerns about wildfire risk, canopy fuel load (CFL) was analyzed for pre-fire conditions for the School Fire analysis area. Each forest polygon was rated to assess its potential for expressing crown fire behavior during a wildfire event.

Appendix E
School Fire Salvage Recovery E-27
Crown fire susceptibility was estimated using stand density thresholds related to the canopy fuel load of tree foliage (Agee 1996b, Keyes and O’Hara 2002); see Powell (2005b) for the crown fire susceptibility protocol. Results of the canopy fuel load assessment are summarized in Table E-14. It shows that about 43% of the dry upland forestland acreage in the School Fire analysis area had sufficient canopy fuel load to sustain a crown fire, at least marginally (in Table E-14, 43% is a total for the moderate and high CFL categories combined). Table E-14 indicates that about 61% of the moist upland forestland in the School Fire analysis area had sufficient canopy load to sustain a crown fire, at least marginally (in Table E-14, this is a total for the moderate and high CFL categories combined). Most (if not all) of the moderate and high CFL acreage qualifies as fire-regime condition class 2 and 3, whereas the low canopy fuel load acreage can probably be assigned to fire-regime condition class 1.
Due to recent concerns about uncharacteristic wildfire impacts, current Forest Service policy emphasizes fuel treatments that convert condition class 2 or 3 back to condition class 1 (USDA Forest Service 2004).
The primary purpose of fuel treatments is to change the behavior of a fire entering a fuel-altered zone, thus lessening its impact to areas of concern. This change in fire behavior is often quantified as a reduction in flame length or fireline intensity, or in spread rate, and it is typically expressed as a change in fire severity or fire growth (Stratton 2004).
Because the entire School Fire analysis area was recently affected by wildfire, the existing canopy fuel load situation is not yet in dynamic equilibrium with a landscape-scale disturbance regime; therefore, post-fire canopy fuel load was not analyzed.
Table E-14 Canopy Fuel Load Assessment For Pre-Fire Vegetation Conditions.
Dry Upland Forestland Moist Upland Forestland Canopy Fuel Load Description Acres Percent Acres Percent Low canopy fuel load 5,624 57 4,090 39 Moderate canopy fuel load
4,234 43 4,958 47
High canopy fuel load 56 < 1 1,540 14 Sources/Notes: Summarized from the School Fire vegetation database; acres and percents include NFS lands only. Criteria for determining canopy fuel load, as described in Powell (2005b), are from Agee (1996b) and Keyes and O’Hara (2002). HRV Analysis for Predicted Fire Severity An historical range of variability (HRV) analysis was completed for predicted fire severity (Table E-14). It was a simplistic analysis because there was no explicit characterization of surface or ladder fuels; the canopy fuel load categorical ratings presented in table E-14 (high, moderate, low) were assumed to reflect predicted fire severity.
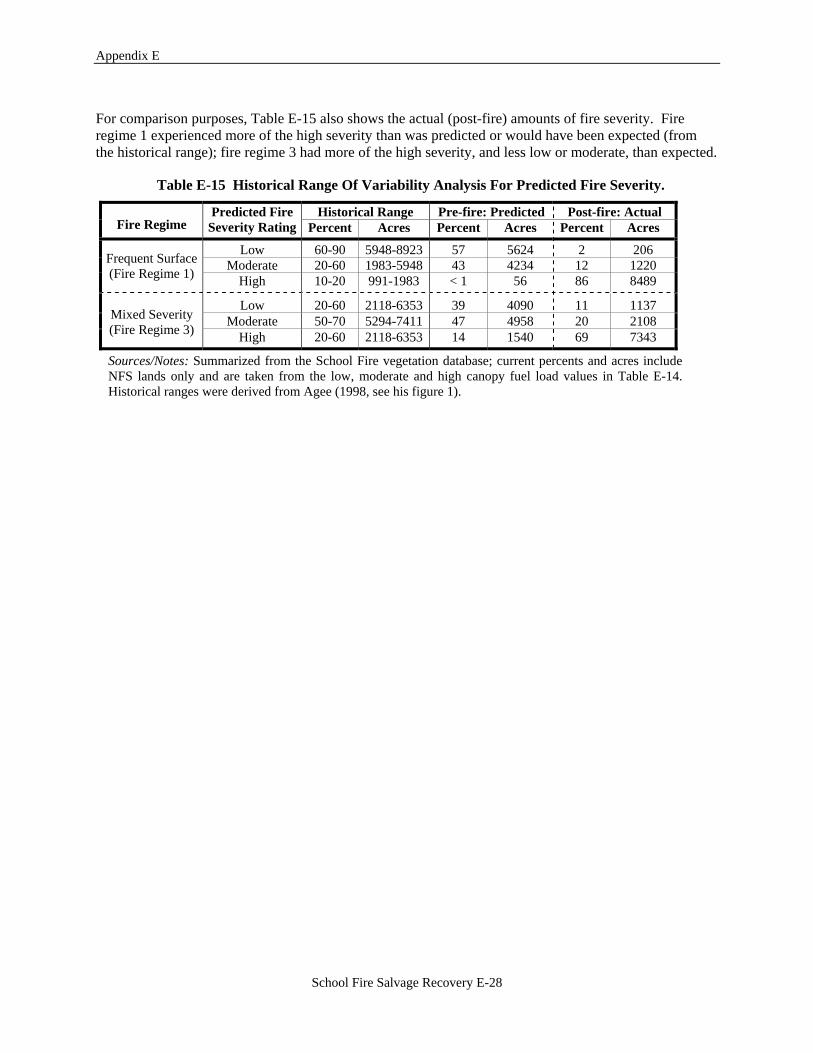
For dry upland forestland (fire regime 1), Table E-15 shows that pre-fire conditions would support less low or high fire severity than would be expected, and a reasonable percentage of moderate fire severity. For moist upland forestland (fire regime 3), pre-fire conditions would support slightly less moderate or high fire severity than would be expected, and a reasonable percentage of low fire severity.
Appendix E
School Fire Salvage Recovery E-28
For comparison purposes, Table E-15 also shows the actual (post-fire) amounts of fire severity. Fire regime 1 experienced more of the high severity than was predicted or would have been expected (from the historical range); fire regime 3 had more of the high severity, and less low or moderate, than expected.
Table E-15 Historical Range Of Variability Analysis For Predicted Fire Severity.
Historical Range Pre-fire: Predicted Post-fire: Actual Fire Regime
Predicted Fire Severity Rating Percent Acres Percent Acres Percent Acres
Low 60-90 5948-8923 57 5624 2 206 Moderate 20-60 1983-5948 43 4234 12 1220 Frequent Surface
(Fire Regime 1) High 10-20 991-1983 < 1 56 86 8489
Low 20-60 2118-6353 39 4090 11 1137 Moderate 50-70 5294-7411 47 4958 20 2108 Mixed Severity
(Fire Regime 3) High 20-60 2118-6353 14 1540 69 7343
Sources/Notes: Summarized from the School Fire vegetation database; current percents and acres include NFS lands only and are taken from the low, moderate and high canopy fuel load values in Table E-14. Historical ranges were derived from Agee (1998, see his figure 1).


