Spatiotemporal Data Representation in R
14
Spatiotemporal Data Representation in R Lorena A. Santos 1 , Karine R. Ferreira 1 , Gilberto R. Queiroz 1 , Lubia Vinhas 1 1 National Institute for Space Research Av. dos Astronautas, 1758, 12227-010 - S˜ ao Jos´ e dos Campos (SP) - Brazil {lorena.santos,karine.ferreira,gilberto.queiroz,lubia.vinhas}@inpe.br Abstract. Recent advances in devices that collect geospatial information have produced massive spatiotemporal data sets. Earth observation and GPS sa- tellites, sensor networks and mobile gadgets are examples of technologies that have created large data sets with better spatial and temporal resolution than ever. This scenario brings a challenge for Geoinformatics: we need software tools to represent, process and analyze these large data sets efficiently. R is a environment widely used for data analysis. In this work, we present a study of spatiotemporal data representation in R. We evaluate R packages to access and create three spatiotemporal data types as different views on the same observa- tion set: time series, trajectories and coverage. 1. Introduction Recently, the amount of devices that collect geospatial information has greatly increased. Earth observation and GPS satellites, sensor networks and mobile gadgets are examples of technologies that have created large data sets with better spatial and temporal resolution than ever. This technological advance brings many challenges for Geoinformatics. We need novel software tools to represent, process and analyze big spatiotemporal data sets efficiently. In Geoinformatics, spatiotemporal data representation is an open issue. Spatial information is represented following well-established models and concepts. This includes the dichotomy between object-based and field-based models [Galton 2004]. Examples of long-standing concepts are vector and raster data structures, topological operators, spatial indexing, and spatial joins [RIGAUX et al. 2002]. Most existing GIS and spatial database systems, such as PostGIS and Oracle Spatial, are grounded on these concepts. However, there is no consensus on how to represent spatiotemporal information in computational systems. Many existing proposals of spatiotemporal data models focus on representing the evolution of objects and fields over time. Some proposals are specific for discrete changes in objects [Worboys 1994] [Hornsby and Egenhofer 2000], others for moving objects [Guting and Schneider 2005] [ISO 2008] and still others for fields or coverage [Liu et al. 2008] [OGC 2006]. To properly capture changes in the world, representing evolution of objects and fields over time is not enough. We also need to represent events and relationships between events and objects explicitly [Worboys 2005]. Events are oc- currents [Galton and Mizoguchi 2009]. They are individual happenings with definite be- ginnings and ends. The demand for models that describe events has encouraged recent research on spatiotemporal data modeling [Galton and Mizoguchi 2009]. Proceedings XVII GEOINFO, November 27-30, 2016, Campos do Jord˜ ao, Brazil 178
Transcript of Spatiotemporal Data Representation in R
Spatiotemporal Data Representation in R
Lorena A. Santos1, Karine R. Ferreira1, Gilberto R. Queiroz 1, Lubia Vinhas1
1National Institute for Space ResearchAv. dos Astronautas, 1758,
12227-010 - Sao Jose dos Campos (SP) - Brazil
{lorena.santos,karine.ferreira,gilberto.queiroz,lubia.vinhas}@inpe.br
Abstract. Recent advances in devices that collect geospatial information haveproduced massive spatiotemporal data sets. Earth observation and GPS sa-tellites, sensor networks and mobile gadgets are examples of technologies thathave created large data sets with better spatial and temporal resolution thanever. This scenario brings a challenge for Geoinformatics: we need softwaretools to represent, process and analyze these large data sets efficiently. R is aenvironment widely used for data analysis. In this work, we present a study ofspatiotemporal data representation in R. We evaluate R packages to access andcreate three spatiotemporal data types as different views on the same observa-tion set: time series, trajectories and coverage.
1. IntroductionRecently, the amount of devices that collect geospatial information has greatly increased.Earth observation and GPS satellites, sensor networks and mobile gadgets are examples oftechnologies that have created large data sets with better spatial and temporal resolutionthan ever. This technological advance brings many challenges for Geoinformatics. Weneed novel software tools to represent, process and analyze big spatiotemporal data setsefficiently.
In Geoinformatics, spatiotemporal data representation is an open issue. Spatialinformation is represented following well-established models and concepts. This includesthe dichotomy between object-based and field-based models [Galton 2004]. Examples oflong-standing concepts are vector and raster data structures, topological operators, spatialindexing, and spatial joins [RIGAUX et al. 2002]. Most existing GIS and spatial databasesystems, such as PostGIS and Oracle Spatial, are grounded on these concepts. However,there is no consensus on how to represent spatiotemporal information in computationalsystems.
Many existing proposals of spatiotemporal data models focus on representingthe evolution of objects and fields over time. Some proposals are specific for discretechanges in objects [Worboys 1994] [Hornsby and Egenhofer 2000], others for movingobjects [Guting and Schneider 2005] [ISO 2008] and still others for fields or coverage[Liu et al. 2008] [OGC 2006]. To properly capture changes in the world, representingevolution of objects and fields over time is not enough. We also need to represent eventsand relationships between events and objects explicitly [Worboys 2005]. Events are oc-currents [Galton and Mizoguchi 2009]. They are individual happenings with definite be-ginnings and ends. The demand for models that describe events has encouraged recentresearch on spatiotemporal data modeling [Galton and Mizoguchi 2009].
Proceedings XVII GEOINFO, November 27-30, 2016, Campos do Jordao, Brazil
178

R is a software tool widely used for data analysis[R Development Core Team 2011]. It provides a broad variety of statistical methods(time-series analysis, classification and clustering) and a high-level programmingenvironment and language suitable for fast developing new algorithms. R is extended viapackages. Although there are many packages for spatial data handling and analyzing,few of them can properly deal with the temporal dimension of spatial data.
This paper presents a study of spatiotemporal data handling in R. We evaluate Rpackages for spatiotemporal data access and representation. To guide this evaluation, weconsider the spatiotemporal data types proposed by Ferreira et al. (2014). They proposea data model that represents objects and fields that change over time as well as events.Based on this model, we describe in this work how to load and create three spatiotemporaldata types in R as different views on the same observation set: time series, trajectory andcoverage.
2. An Observation-based Model for Spatiotemporal DataFerreira et al. (2014) propose a data model for spatiotemporal data and specify it using analgebraic formalism. Algebras describe data types and their operations in a formal way,independently of programming languages. The proposed algebra is extensible, definingdata types as building blocks for other types. It takes observations as basic units forspatiotemporal data representation and allows users to create different views on the sameobservation set, meeting application needs.
Observations are our means to assess spatiotemporal phenomena in the real world.Recent research draws attention to the importance of using observations as a basis fordesigning geospatial applications [Kuhn 2009]. The proposed model defines three spa-tiotemporal data types as abstractions built on observations: time series, trajectory andcoverage. A time series represents the variation of a property over time in a fixed location.A trajectory represents how locations or boundaries of an object change over time. A co-verage represents the variation of a property in a spatial extent at a time. We also definean auxiliary type called coverage series that represents a time-ordered set of coveragesthat have the same boundary. Using these types, we can represent objects and fields thatchange over time as well as events.
2.1. Different Views on the Same Observation Set
Figure 1 shows an example of observations collected by five moving objects. Each ob-servation is represented as a tuple in the form (id, x, y, t, p), where id is the object identi-fication, x and y are spatial locations, t is time and p is a property value collected in thespatial local x and y and in time t. In this example, the property collected is air pollution.
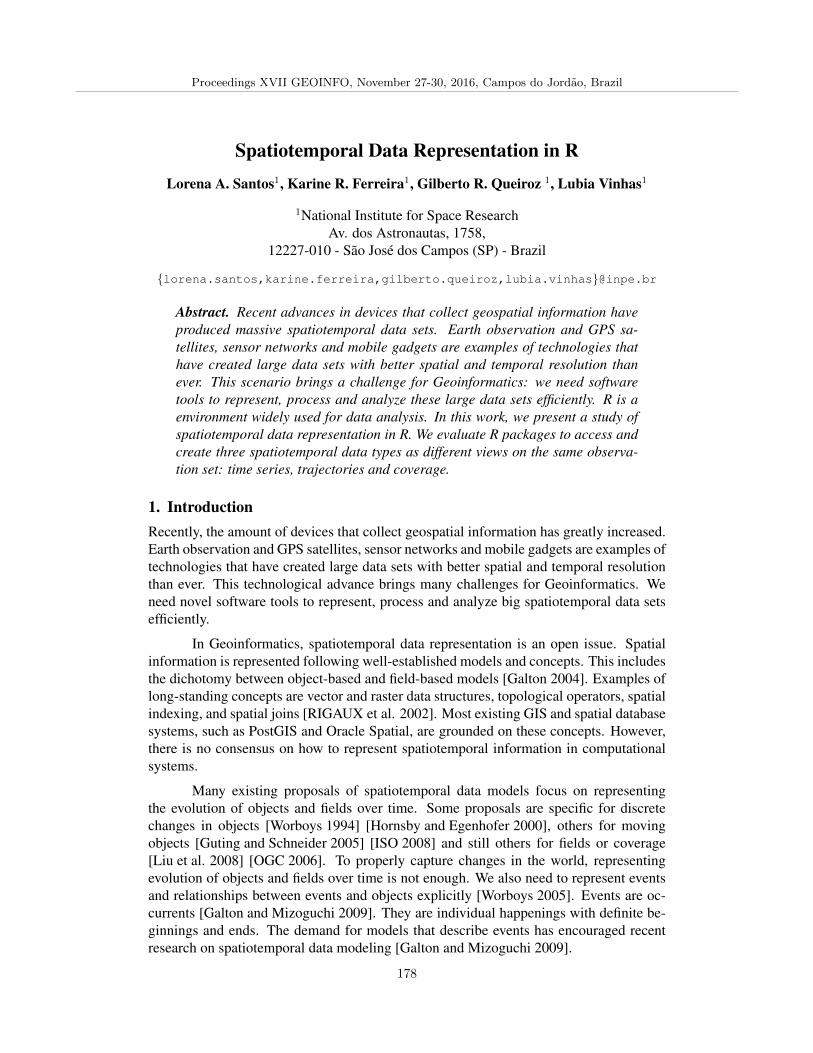
On these observations, we can create different views depending on the kinds ofanalysis we want to perform on them. Each view is materialized as a data type. Figure2 illustrates trajectory and coverage instances built on the same observation set shown inFigure 1. For example, to analyze how the objects move over time and space, we createan instance of the trajectory data type for each object. Each trajectory instance containsobservations of an specific object. To analyze how the air pollution varies in a region, wecreate instances of the coverage data type. Each coverage instance contains observationsin a specific period, mixing observations of different objects. To analyze how the air
Proceedings XVII GEOINFO, November 27-30, 2016, Campos do Jordao, Brazil
179
Figura 1. Spatiotemporal observations
pollution varies in a given spatial location over time, we can create an instance of timeseries data type.
Figura 2. Different data types built on the same observation set
In the proposed model, each spatiotemporal data type instance, time series, trajec-tory and coverage, has an interpolation function, called interpolator, suitable for it. A timeseries has an interpolator that estimates property values in non-measured times. A trajec-tory has an interpolator able to estimate locations in non-observed times. A coverage has
Proceedings XVII GEOINFO, November 27-30, 2016, Campos do Jordao, Brazil
180

an interpolator to estimate property values in non-observed locations.
The capability of creating different views or data types on the same observationset is an important requirement for spatiotemporal data representation. In this work, weevaluate how to do this using R. We use equivalent R data types to represent observationsets and to create trajectory, time series and coverage from these sets.
3. Spatiotemporal Data Representation in RIn this section, we describe a set of R packages for spatiotemporal data representationand access. Packages for data access are Rgdal [Bivand et al. 2013a], Rpostgres[Conway et al. 2008] and Rodbc [Ripley and Lapsley 2016]. Packages with data ty-pes that can be used to represent spatiotemporal data are spacetime [Pebesma 2012],xst [Ryan and Ulrich 2012], trajectories [Pebesma and Klus 2015] and raster[Hijmans 2016]. Furthermore, we evaluate some R package that provide interpola-tion functions that are crucial for creating spatiotemporal data type, such as gstat[Pebesma and Graeler 2016].
Figure 3 shows a diagram with these packages and the relationships among them.
Figura 3. Relationships between packages
Spatiotemporal data can be obtained from different data source, such as, data-base (e.g. Postgis), data files (e.g. shapefiles and geotif raster files) and web services[Ferreira et al. 2015]. In R, there are packages that can access data from distinct type ofsource. However, these packages do not work directly with the concept of spatiotemporaldata.
The Rgdal [Bivand et al. 2013a] package allows a broader range of spatial datasources [Lovelace and Cheshire 2014], such as shapefiles, raster data files and databasesystems. RODBC and Rpostgres packages allow to create SQL queries in R for acces-sing data in database systems, but they do not deal with spatial data.
The spacetime package contains a set of base classes for spatiotemporal datarepresentation that are widely used for other R packages for spatiotemporal analyses. Itis built upon the classes and methods for spatial data from package sp and for time seriesdata from package xts [Pebesma 2012]. The xts package was chosen due to its support
Proceedings XVII GEOINFO, November 27-30, 2016, Campos do Jordao, Brazil
181
to represent several types of date and time. Moreover, it extends functionality of zoopackage, that has good tools for aggregation over time [Zeileis and Grothendieck 2005].
Each spatial data type from sp package has two slots that contain bound box,a matrix of numerical coordinates and other slots that contain a CRS class object defi-ning the coordinate reference system [Bivand et al. 2013b]. The spatial data can be aparticular spatial point, line, polygon or set of polygons, or a pixel (grid or raster cell)[Pebesma 2012].
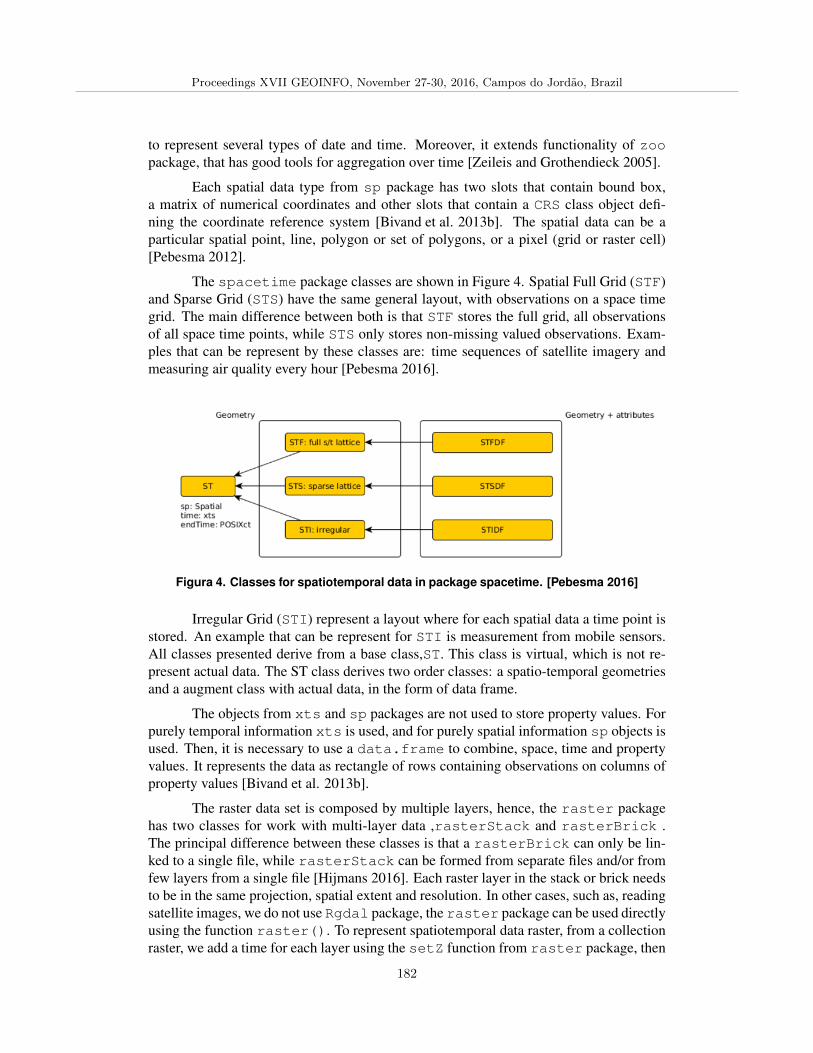
The spacetime package classes are shown in Figure 4. Spatial Full Grid (STF)and Sparse Grid (STS) have the same general layout, with observations on a space timegrid. The main difference between both is that STF stores the full grid, all observationsof all space time points, while STS only stores non-missing valued observations. Exam-ples that can be represent by these classes are: time sequences of satellite imagery andmeasuring air quality every hour [Pebesma 2016].
Figura 4. Classes for spatiotemporal data in package spacetime. [Pebesma 2016]
Irregular Grid (STI) represent a layout where for each spatial data a time point isstored. An example that can be represent for STI is measurement from mobile sensors.All classes presented derive from a base class,ST. This class is virtual, which is not re-present actual data. The ST class derives two order classes: a spatio-temporal geometriesand a augment class with actual data, in the form of data frame.
The objects from xts and sp packages are not used to store property values. Forpurely temporal information xts is used, and for purely spatial information sp objects isused. Then, it is necessary to use a data.frame to combine, space, time and propertyvalues. It represents the data as rectangle of rows containing observations on columns ofproperty values [Bivand et al. 2013b].
The raster data set is composed by multiple layers, hence, the raster packagehas two classes for work with multi-layer data ,rasterStack and rasterBrick .The principal difference between these classes is that a rasterBrick can only be lin-ked to a single file, while rasterStack can be formed from separate files and/or fromfew layers from a single file [Hijmans 2016]. Each raster layer in the stack or brick needsto be in the same projection, spatial extent and resolution. In other cases, such as, readingsatellite images, we do not use Rgdal package, the raster package can be used directlyusing the function raster(). To represent spatiotemporal data raster, from a collectionraster, we add a time for each layer using the setZ function from raster package, then
Proceedings XVII GEOINFO, November 27-30, 2016, Campos do Jordao, Brazil
182

we can coerce these data to spatiotemporal type from spacetime package.
Trajectories package provides three data types to represent trajectories,Track, Tracks and TracksCollection, based on the STIDF type. The classTrack represents a single trajectory followed by a person, animal or object. Tracksembodies a collection of trajectories followed by a single person, animal or object. Theclass TracksCollection represents a collection of trajectories followed by differentpersons, animals or objects. Besides that, this package provides a set of operations overtrajectories, such as computing of trajectories STBox and calculating distances betweentwo tracks.
Figura 5. Classes for spatiotemporal data as trajectories. [Pebesma 2016]
The package gstat provides spatial and spatiotemporal interpolation functions.Types derived from sp and spacetime packages can be utilized in this package.
4. Case StudyIn this section, we present the use of the R packages listed in the previous section ap-proaching the data types proposed by [Ferreira et al. 2014]. We performed a case studyusing observations of vessels around the Brazilian coast. These observations are stored ina PostGIS database and contain trajectories of 993 vessels collected during 4 years, from2008 to 2011. The Figure 6 presents the observations of all vessels.
Figura 6. All Observation Set ploted against the map of Brazil
4.1. Observation SetIn this case study, we selected a small subset, containing trajectories of 166 vessels. Wefiltered data temporally obtaining trajectories only one day and spatially for locations inRio de Janeiro State. Our subset is shown in Figure 7.
Proceedings XVII GEOINFO, November 27-30, 2016, Campos do Jordao, Brazil
183

Figura 7. Filtered Data
The filtered vessel observations are stored in table of PostGIS database, whereeach row contains an observation of a vessel. Each observations contains the vessel id(integer type), time (timestamp type), spatial location (geometry type) and velocity ofeach vessel (numeric type). The table format is shown in Figure 8.
Figura 8. Observation set
In this case study, we used RODBC to connect in the database and filter the obser-vation data using SQL language inside R environment. This this step is shown in Figure 9.
Figura 9. Acessing data from Postgis
RODBC does not work with spatial data. Therefore, coordinates data is returned asnumeric type and so must be converted to spatial type of R. A matrix is created with coor-dinate values and then we transform this matrix in a SpatialPoint in R format with acoordinate reference system. For temporal data, we do not need realize changes, becausethe data was returned in POSIXct type. This type is standard way of representing timein R [Wuertz et al. 2015], and also in spacetime package.
Proceedings XVII GEOINFO, November 27-30, 2016, Campos do Jordao, Brazil
184

Finally we created a data.frame with only one column, containing velocitydata, named VelocityDF. Combining the spatial, temporal and data frame objects wecan apply in a spacetime class. In this case we apply STIDF , because our observationsare irregular data. Figure 10 shows how these data are prepared in R.
Figura 10. Creating STIDF object
4.2. Trajectories and Time Series
Two vessels from the observation set was selected. We created two objects of typeSTIDF, one for each vessel, vesselST1 and vesselST2. Then, we created two ins-tances of Track type from trajectories package; each one to represent a trajectoryof an object. The R code for this step is shown in Figure. 11 and the trajectories generateare show in Figure 12.
Figura 11. Creating Trajectories from STIDF
Here, we can also analyze how two vessels are moving together. Thetrajectories has a function to calculate distances between two tracks using themethod compare. This function returns a object of type difftrack. From this objectwe can obtain the distance between trajectories over time and create a time series usingthe xts type. This time series represents the distance variation between two trajectoriesover time. The Figure 13 shows the time series and how it is generated.
Proceedings XVII GEOINFO, November 27-30, 2016, Campos do Jordao, Brazil
185

Figura 12. Visualizing spatiotemporal data as Trajectories
Figura 13. Time Series: distance variation over time
4.3. Coverage
To represent the velocity variation over time and space, we create coverages. We puttogether observations obtained by vessels during one day and produced a coverage thatinvestigate how velocity varies within the boundary delimited by spatiotemporal boundingbox object created previously. This kind of view on the vessel observations allows usersto identify possible regions where vessels are fishing. In fishing areas, vessels have lowvelocity.
Our observations are discrete. They need to be combined with interpolation func-tions to estimate values in non-observed spatial locations [Ferreira et al. 2014]. We useda spatial interpolation and created a grid where every cell has a velocity value.
To create a grid, we constructed a GridTopoloy object using the bounding boxof our subset region and a cell size of 0.01◦ in each direction. From the GridTopoloyobject, we constructed the SpatialGrid object and associated a coordinate referencesystem (CRS) to it. Figure 14 shows the code used to create this grid.
We created a coverage for each hour of a day, using the Inverse Distance WeightedInterpolator (IDW) interpolation function. In this case, each coverage contains the obser-vations of a specific hour, mixing observations of different vessels. The type returned by
Proceedings XVII GEOINFO, November 27-30, 2016, Campos do Jordao, Brazil
186

the IDW interpolator is SpatialGridDataframe. This type is typical for representa-tion raster GIS [Bivand et al. 2013b]. Using Rgdal, each grid can be saved as Tif format.Figure 15 shows the code to obtain the time interval from STIDF object to be spatiallyinterpolated over the grid created earlier. This step was realized 24 times, for each hour.
Figura 14. Creating a spatiotemporal grid
Figura 15. Inverse Distance Weighted Interpolator
Once all grids were created, we read the 24 grids using stack() function fromraster package and put these raster grids together using stack::raster function.Two stacks are generated, one containing all raster grids during 00:00 until 12:00 andanother containing all raster grids during 12:00pm until 23:59pm. Furthermore, eachraster pushed in the stack was associated to time interval using setZ() function fromraster package. These raster stacks contain spatial and temporal data. They can beconverted to the spatiotemporal data type STFDF of the spacetime package. The Fi-gure 16 shows the code that describes this step for one period.
The Figure 17 shows the spatiotemporal raster grids to represent coverages in R.These coverages represent how the velocity varies over time within a specific region ofthe ocean. Looking these coverages, we can visually identify areas where the velocity islow. Such areas can be possible regions where vessels are fishing. Thus, using coveragetypes built on the vessel observations, we can extract information about the variation ofvelocity over time and space, using spatiotemporal data mining techniques.
It is important to note that the interval between 12:00 and 15:00, figures 17, con-tains large regions where the vessel velocity is low. We contrast with red circles regionswhere velocity is lower than others. Visually, we observed that these regions have lowvelocity in all time intervals since 12:00 until 23:59 pm.
Proceedings XVII GEOINFO, November 27-30, 2016, Campos do Jordao, Brazil
187
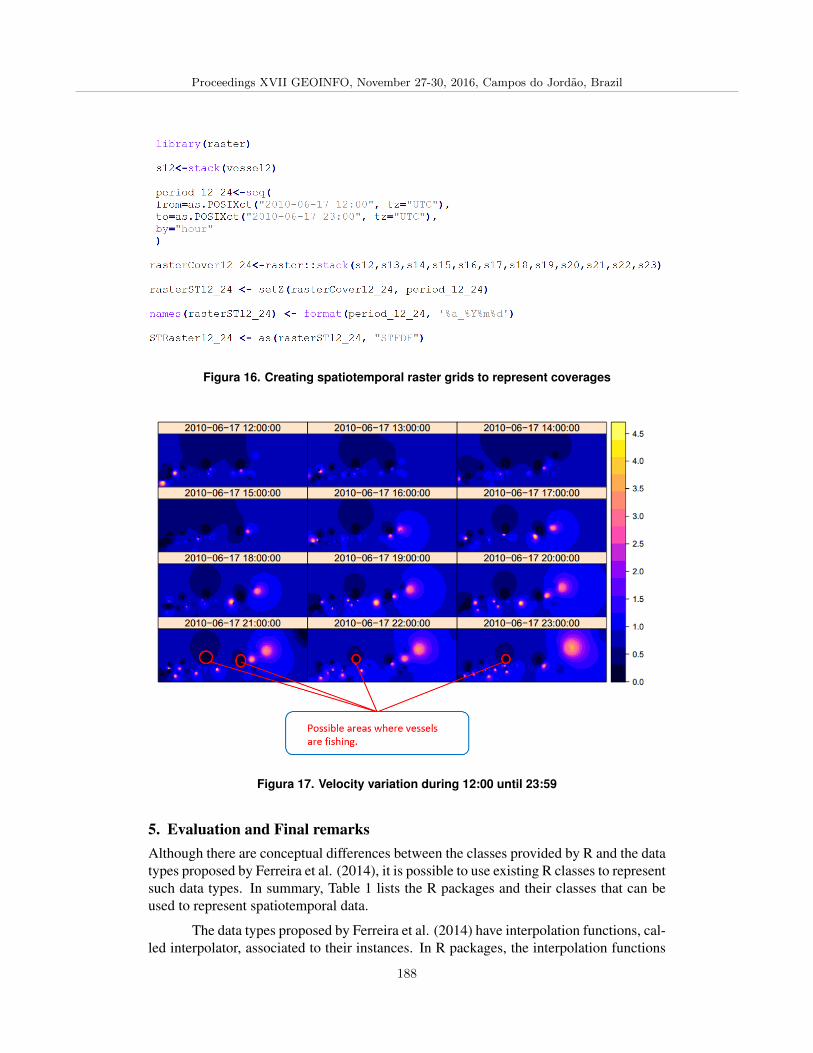
Figura 16. Creating spatiotemporal raster grids to represent coverages
Figura 17. Velocity variation during 12:00 until 23:59
5. Evaluation and Final remarksAlthough there are conceptual differences between the classes provided by R and the datatypes proposed by Ferreira et al. (2014), it is possible to use existing R classes to representsuch data types. In summary, Table 1 lists the R packages and their classes that can beused to represent spatiotemporal data.
The data types proposed by Ferreira et al. (2014) have interpolation functions, cal-led interpolator, associated to their instances. In R packages, the interpolation functions
Proceedings XVII GEOINFO, November 27-30, 2016, Campos do Jordao, Brazil
188

are not directly associated to their objects. Thus, we have to use interpolation functi-ons provided by other packages to estimate values in non-observed locations and times.For example, to create the coverages shown Figure 16, we used the IDW interpolationfunction from gstat package.
We can conclude that the spacetime package plays a key role in spatiotemporaldata representation in R. It provides base data types, STIDF, STFDF and STSDF, that areused for many other packages to represent and analyze spatiotemporal data. For example,the packages trajectories defines their classes to represent trajectories based on theSTIDF type. The package gstat provides spatiotemporal interpolation functions, suchas spatiotemporal kriging, based on the STFDF class.
Tabela 1. R Packages and their classes to represent spatiotemporal data
Using existing R packages, such RODBC and Rgdal, we can access data fromdifferent data sources. Furthermore we can load subsets of data using queries in the caseof vector data or creating several stacks of raster data to be processed in batches avoidoverhead in memory. However, they do not deal with spatiotemporal data.
When we load the observation set using the RODBC package, spatial data sets areloaded as textual or numerical types. Then, it is necessary to convert these data types tospatial type. Using the Rgdal package, we can access the observation set as spatial datatypes. Neither of them can access spatiotemporal data directly. It is necessary to preparespatial and temporal data separately and then construct spatiotemporal data types.
A disadvantage of not having packages that directly access spatiotemporal datasets, such as trajectory and coverage, is that we can not filter such data sets properly. Forexample, we can not load from data sources to R classes only the trajectories whose spati-otemporal bounding boxes intersect a given box. Or, we can not load from data sources toR classes only a part of coverages based on a spatiotemporal restriction. These filters areimportant because R has limitations of memory on handling large objects. According toKane et al. [Kane et al. 2013], R is not well-suited for working with data structures largerthan about 10-20% of a computer RAM memory. Thus, it is necessary to handle data setsby parts in R, using filters to restrict the amount of data in memory.
As future work, we intend to use spatiotemporal data mining algorithms in R to
Proceedings XVII GEOINFO, November 27-30, 2016, Campos do Jordao, Brazil
189

analyze the coverages showed in Figure 16. The goal is to identify regions where vesselvelocities are low, that is, regions where vessels are probably fishing.
ReferenciasBivand, R., Keitt, T., and Rowlingson, B. (2013a). Rgdal: Bindings for the geospatial
data abstraction library. r package version 0.8-10.
Bivand, R. S., Pebesma, E., and Gomez-Rubio, V. (2013b). Applied spatial data analysiswith R, Second edition. Springer, NY.
Conway, J., Eddelbuettel, D., Nishiyama, T., Prayaga, S. K., and Tiffin, N. (2008). Rpost-gresql: R interface to the postgresql database system.
Ferreira, K. R., Camara, G., and Monteiro, A. M. V. (2014). An algebra for spatiotemporaldata from observations to events. Transactions in GIS, 18(2):253–269.
Ferreira, K. R., de Oliveira, A. G., Monteiro, A. M. V., and de Almeida, D. B. (2015).Temporal GIS and spatiotemporal data sources. In XVI Brazilian Symposium on Ge-oInformatics(GEOINFO), Campos do Jordao, Sao Paulo, Brazil, November 29 - De-cember 2, 2015., pages 1–13.
Galton, A. (2004). Fields and objects in space, time, and space-time. Spatial cognitionand computation, 4(1):39–68.
Galton, A. and Mizoguchi, R. (2009). The water falls but the waterfall does not fall: Newperspectives on objects, processes and events. Applied Ontology, 4(2):71–107.
Guting, R. H. and Schneider, M. (2005). Moving Objects Databases. Morgan Kaufmann.
Hijmans, R. J. (2016). Introduction to the raster package.
Hornsby, K. and Egenhofer, M. (2000). Identity-based change: a foundation for spatio-temporal knowledge representation. International Journal of Geographical Informa-tion Science, 14(3):207–224.
ISO (2008). Geographic information - schema for moving features. ISO 19141:2008,International Organization for Standardization, Geneva, Switzerland.
Kane, M. J., Emerson, J., and Weston, S. (2013). Scalable strategies for computing withmassive data. Journal of Statistical Software, 55(14):1–19.
Kuhn, W. (2009). A Functional Ontology of Observation and Measurement, pages 26–43.Springer Berlin Heidelberg, Berlin, Heidelberg.
Liu, Y., Goodchild, M. F., Guo, Q., Tian, Y., and Wu, L. (2008). Towards a generalfield model and its order in GIS. International Journal of Geographical InformationScience, 22(6):623–643.
Lovelace, R. and Cheshire, J. (2014). Introduction to visualising spatial data in R. Natio-nal Centre for Research Methods Working Papers, 14(03).
OGC (2006). Opengis implementation specification for geographic information - sim-ple feature access-part 1:common architecture. Technical Report 19141:2008, OPENGEOSPATIAL CONSORTIUM, Geneva, Switzerland.
Pebesma, E. (2012). spacetime: Spatio-temporal data in R. Journal of Statistical Soft-ware, 51(7):1–30.
Proceedings XVII GEOINFO, November 27-30, 2016, Campos do Jordao, Brazil
190

Pebesma, E. (2016). Handling and analyzing spatial, spatiotemporal and movement data.
Pebesma, E. and Graeler, B. (2016). gstat: Spatial and spatio-temporal geostatisticalmodelling, prediction and simulation.
Pebesma, E. and Klus, B. (2015). Analysing trajectory data in R.
R Development Core Team (2011). R: A Language and Environment for Statistical Com-puting. R Foundation for Statistical Computing, Vienna, Austria. ISBN 3-900051-07-0.
RIGAUX, P., SCHOLL, M., and VOISARD (2002). Spatial Databases with Applicationto GIS. Morgan Kaufmann Publishers Inc., San Francisco, CA, USA.
Ripley, B. and Lapsley, M. (2016). Rodbc: Odbc database access.
Ryan, J. and Ulrich, J. (2012). xts: extensible time series. r package version 0.8-6.
Worboys, M. F. (1994). A unified model for spatial and temporal information. Comput.J., 37(1):36–34.
Worboys, M. F. (2005). Event-oriented approaches to geographic phenomena. Internati-onal Journal of Geographical Information Science, 19(1):1–28.
Wuertz, D., Setz, T., Chalabi, Y., and Byers, M. M. J. W. (2015). Package timedate.
Zeileis, A. and Grothendieck, G. (2005). zoo: S3 infrastructure for regular and irregulartime series. Journal of Statistical Software, 14(6):1–27.
Proceedings XVII GEOINFO, November 27-30, 2016, Campos do Jordao, Brazil
191