Spatial pattern and temporal variation of water … and carrying capacity for seaweed mariculture in...
17
AACL Bioflux, 2017, Volume 10, Issue 4. http://www.bioflux.com.ro/aacl 894 Spatial pattern and temporal variation of water quality and carrying capacity for seaweed mariculture in Takalar, Indonesia 1,3 Ati Rahadiati, 2 Kadarwan Soewardi, 2 Yusli Wardiatno, 3 Dewayany 1 Study Program of Coastal and Marine Resources Management, Graduate Program, Bogor Agricultural University, Bogor, Indonesia; 2 Department of Aquatic Resources Management, Faculty of Fisheries and Marine Sciences, Bogor Agricultural University, Bogor, Indonesia; 3 Geospatial Information Agency, Bogor, Indonesia. Corresponding author: A. Rahadiati, [email protected] Abstract. The potential for seaweed mariculture in Indonesia is quite large, especially in Takalar Regency as the largest seaweed producer in South Sulawesi Province. The success of the mariculture depends strongly on optimum water conditions and the spatial carrying condition without causing a negative impact on the environment. This study was aimed to assess the spatial and temporal water quality and carrying capacity for seaweed mariculture in Takalar Regency, South Sulawesi Province. The method employed was descriptive statistics of the water quality and spatial carrying capacity with an area suitability and water capacity approach. The results of the study revealed that the conditions of the Takalar waters were suitable for seaweed mariculture, especially during the west season and first transition season. The main limiting factor in seaweed mariculture in Takalar Regency was current velocity. The spatial carrying capacity for seaweed mariculture in Takalar is still quite large, where the potential area that is still not utilized reaches more than 75% for all four seasons. Key Words: seaweed mariculture, spatial carrying capacity, season, Geographic Information System. Introduction. Mariculture has been known for 50 years with an average production growth of 8% in the last three decades (Campbell & Pauly 2013). The mariculture production tends to be slowing down, but it is still rapid and cultivation production is dominated by a number of countries in Asia. The rapid growth of mariculture in Asia is encouraged by a number of factors such as the existing mariculture practices, the population and economic growth, supportive regulations, and excellent export opportunities (Bostoc et al 2010). In 2012, 49.1% of the total mariculture production was contributed by seaweed mariculture (Chopin 2014). Seaweed mariculture is an environmentally friendly cultivation because most are extensive cultivations, relying on naturally existing nutrients in the water column (Edwards 2015). The effect of seaweed mariculture on the waters is little, merely the shade effect that influences light penetration to the sea floor and the effect of using rope which affects the water’s hydrodynamics such as currents, waves, and stratification (Anonymous 2013). The main producers in seaweed mariculture is China, Indonesia, the Philippines, Korea Republic, Korea DP Rep., and Japan. These six countries produce 98% of the total global production (Figure 1). Indonesia is the country with the highest production growth among the six countries with an average growth of 31% in ten years; the highest growth at 47% occured in 2007 and the lowest in 2014 at 8%. China as the largest producer had an average production growth in the last ten years of only 3.9% (FAO 2016). The fish cultivation sub-sector could be a barometer for the Indonesia’s economic movements if managed optimally. The growth of seaweed production in Indonesia is still rapid because of the carrying capacity and potential area for development waiting to be utilized. Bixler & Porse (2011) stated that the potential for seaweed mariculture area extension, especially in eastern Indonesia, is quite large because the production in other
Transcript of Spatial pattern and temporal variation of water … and carrying capacity for seaweed mariculture in...

AACL Bioflux, 2017, Volume 10, Issue 4. http://www.bioflux.com.ro/aacl 894
Spatial pattern and temporal variation of water quality and carrying capacity for seaweed mariculture in Takalar, Indonesia 1,3Ati Rahadiati, 2Kadarwan Soewardi, 2Yusli Wardiatno, 3Dewayany
1 Study Program of Coastal and Marine Resources Management, Graduate Program,
Bogor Agricultural University, Bogor, Indonesia; 2 Department of Aquatic Resources Management, Faculty of Fisheries and Marine Sciences, Bogor Agricultural
University, Bogor, Indonesia; 3 Geospatial Information Agency, Bogor, Indonesia. Corresponding author: A. Rahadiati, [email protected]
Abstract. The potential for seaweed mariculture in Indonesia is quite large, especially in Takalar Regency as the largest seaweed producer in South Sulawesi Province. The success of the mariculture depends strongly on optimum water conditions and the spatial carrying condition without causing a negative impact on the environment. This study was aimed to assess the spatial and temporal water quality and carrying capacity for seaweed mariculture in Takalar Regency, South Sulawesi Province. The method employed was descriptive statistics of the water quality and spatial carrying capacity with an area suitability and water capacity approach. The results of the study revealed that the conditions of the Takalar waters were suitable for seaweed mariculture, especially during the west season and first transition season. The main limiting factor in seaweed mariculture in Takalar Regency was current velocity. The spatial carrying capacity for seaweed mariculture in Takalar is still quite large, where the potential area that is still not utilized reaches more than 75% for all four seasons. Key Words: seaweed mariculture, spatial carrying capacity, season, Geographic Information System.
Introduction. Mariculture has been known for 50 years with an average production growth of 8% in the last three decades (Campbell & Pauly 2013). The mariculture production tends to be slowing down, but it is still rapid and cultivation production is dominated by a number of countries in Asia. The rapid growth of mariculture in Asia is encouraged by a number of factors such as the existing mariculture practices, the population and economic growth, supportive regulations, and excellent export opportunities (Bostoc et al 2010). In 2012, 49.1% of the total mariculture production was contributed by seaweed mariculture (Chopin 2014). Seaweed mariculture is an environmentally friendly cultivation because most are extensive cultivations, relying on naturally existing nutrients in the water column (Edwards 2015). The effect of seaweed mariculture on the waters is little, merely the shade effect that influences light penetration to the sea floor and the effect of using rope which affects the water’s hydrodynamics such as currents, waves, and stratification (Anonymous 2013).
The main producers in seaweed mariculture is China, Indonesia, the Philippines, Korea Republic, Korea DP Rep., and Japan. These six countries produce 98% of the total global production (Figure 1). Indonesia is the country with the highest production growth among the six countries with an average growth of 31% in ten years; the highest growth at 47% occured in 2007 and the lowest in 2014 at 8%. China as the largest producer had an average production growth in the last ten years of only 3.9% (FAO 2016).
The fish cultivation sub-sector could be a barometer for the Indonesia’s economic movements if managed optimally. The growth of seaweed production in Indonesia is still rapid because of the carrying capacity and potential area for development waiting to be utilized. Bixler & Porse (2011) stated that the potential for seaweed mariculture area extension, especially in eastern Indonesia, is quite large because the production in other

AACL Bioflux, 2017, Volume 10, Issue 4. http://www.bioflux.com.ro/aacl 895
countries tends to decrease. The area potential for mariculture in Indonesia reaches up to 12,123,383 ha and only approximately 281,474 ha are currently being utilized (KKP 2015).
Figure 1. The production and product values of six main seaweed mariculture producer countries (FAO 2016).
Seaweed mariculture is a superior commodity in South Sulawesi, especially in Takalar Regency. The types of seaweed commonly cultivated in this regency are Kappaphycus alvarezii and Eucheuma spinosum. Based on data from the Takalar Regency Fisheries and Marine Affairs Agency, the production of K. alvarezii seaweed or what is more commonly known as cottonii seaweed in the last five years has constantly increased. The production in 2012 was 429,609 tons, in 2013 it was 491,958 tons, and in 2014 it was 623,720 tons with a production increase reaching 45% (BPS 2015).
The main issue in seaweed mariculture is the seaweed mariculture productivity which is not yet optimal due to the lack of a seaweed mariculture zonation map which considers the spatial carrying capacity based on season (temporal). Radiarta et al (2013) stated that one of the limiting factors in seaweed mariculture is the planting season which is affected by climatic conditions.
The environmental carrying capacity is a very important concept in an ecosystem-based management, defined as how much cultivation production can be expected without changing the natural ecosystem and without social loss. The term ‘carrying capacity’ in general is the level of utilization of a resource by humans which is optimally sustainable in the long term (Ross et al 2013). The environmental carrying capacity could be increased by humans by adding or inserting science and technology to a certain environment. Technological innovation will not increase the area’s carrying capacity, but it will play a role in improving the efficiency in utilizing the natural resources.
In general, there are four types of environment carrying capacities for the development of coastal cultivation (Inglis et al 2000), namely: 1) the physical carrying capacity which is the total area of various activities on the coast and sea that can be supported by a certain/the available area, 2) the production carrying capacity which is the maximum total number of natural resources that can be utilized sustainably, 3) the ecological carrying capacity which is the limit of activities that can be developed without causing damage to the ecological environment, and 4) the social carrying capacity which is the maximum development activities that can be undergone in a certain area which is not socially damaging or does not cause conflict with other activities.
AACL Bioflux, 2017, Volume 10, Issue 4. http://www.bioflux.com.ro/aacl 896
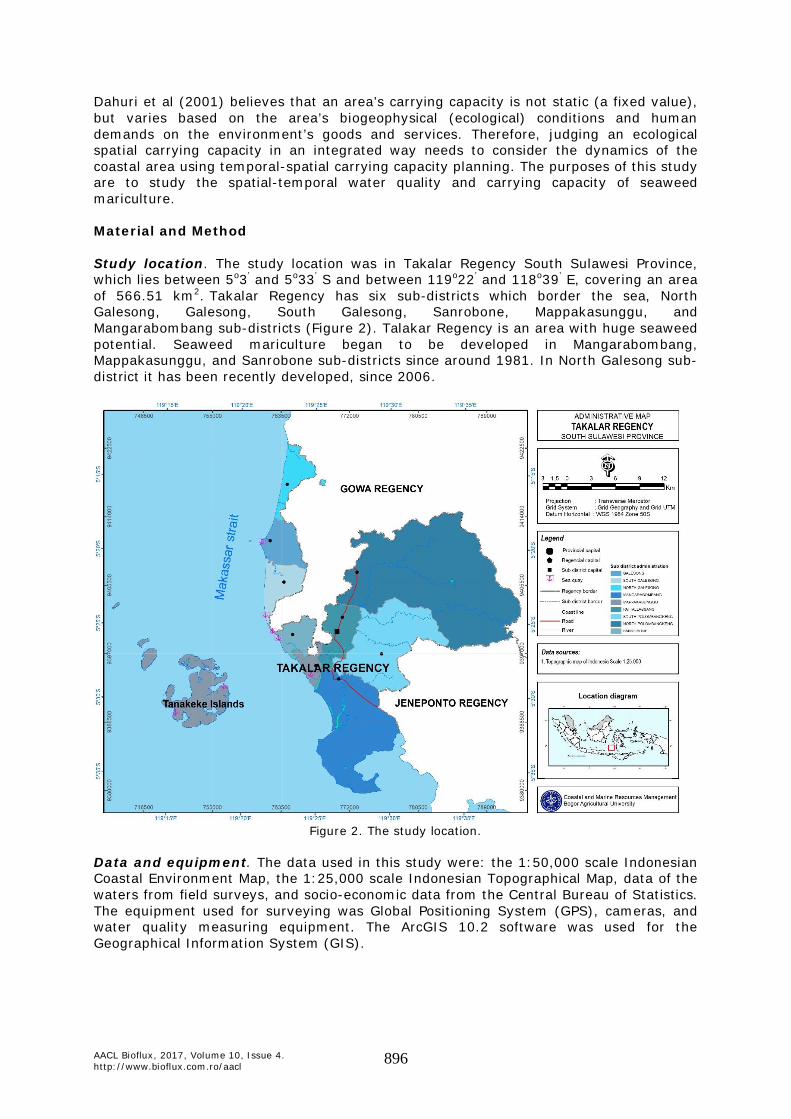
Dahuri et al (2001) believes that an area’s carrying capacity is not static (a fixed value), but varies based on the area’s biogeophysical (ecological) conditions and human demands on the environment’s goods and services. Therefore, judging an ecological spatial carrying capacity in an integrated way needs to consider the dynamics of the coastal area using temporal-spatial carrying capacity planning. The purposes of this study are to study the spatial-temporal water quality and carrying capacity of seaweed mariculture. Material and Method Study location. The study location was in Takalar Regency South Sulawesi Province, which lies between 5o3’ and 5o33’ S and between 119o22’ and 118o39’ E, covering an area of 566.51 km2. Takalar Regency has six sub-districts which border the sea, North Galesong, Galesong, South Galesong, Sanrobone, Mappakasunggu, and Mangarabombang sub-districts (Figure 2). Talakar Regency is an area with huge seaweed potential. Seaweed mariculture began to be developed in Mangarabombang, Mappakasunggu, and Sanrobone sub-districts since around 1981. In North Galesong sub-district it has been recently developed, since 2006.
Figure 2. The study location.
Data and equipment. The data used in this study were: the 1:50,000 scale Indonesian Coastal Environment Map, the 1:25,000 scale Indonesian Topographical Map, data of the waters from field surveys, and socio-economic data from the Central Bureau of Statistics. The equipment used for surveying was Global Positioning System (GPS), cameras, and water quality measuring equipment. The ArcGIS 10.2 software was used for the Geographical Information System (GIS).
AACL Bioflux, 2017, Volume 10, Issue 4. http://www.bioflux.com.ro/aacl 897
Measurement of water quality data. The determination of study stations was based on the purposive sampling method which is a sampling method to determine sampling points on the basis of areas that represent seaweed mariculture locations. Seaweed mariculture in Takalar Regency was found in four sub-districts, namely Mangarabombang, Mappakasunggu, Sanrobone, and North Galesong sub-districts. Therefore, the sampling locations were set in these four sub-districts with the number of stations based on the area of cultivation. Primary data of the waters included salinity, pH, sea surface temperature, dissolved oxygen, nitrate, phosphate, water substrates, currents, clarity, turbidity, and water depth.
The water surface quality parameters that were measured directly in this study were water depth, current velocity, clarity, salinity, pH, sea surface temperature, and dissolved oxygen (DO). The depth of the waters was measured using Speedtech depthmate portable sounder, the current velocity was measured using a drift floating, the clarity was measured with a secchi disk, the salinity was measured using Atago refractometer, and the water pH was measured using a pH meter by Hanna HI Combo pH-EC which was equipped with a sea surface temperature sensor. The DO was measured using Lutron DO-5510 Dissolved Oxygen Meter. At each observation point 500 mL of water was taken using a sample bottle and stored in a cool box. The water sample was then analyzed for its nitrate, phosphate, and turbidity in the Laboratory of Chemical Oceanography, Faculty of Marine Sciences and Fisheries, Hasanuddin University. The collection of substrate samples from the sea floor was conducted once during the seconds survey and samples were then analyzed in the Productivity and Environment Laboratory, Faculty of Fisheries and Marine Sciences, Bogor Agricultural University.
Measurement of the water quality was conducted four times to represent the four seasons, the west season (January-February 2016), the first transition season (May 2016), the east season (August-September 2016), and the second transition season (November-December 2016). The measurement of each of the variables was conducted mostly in the morning between 07.00 and 12.00.
Data analysis Suitability analysis. The initial phase in the analysis of the carrying capacity was by conducting a suitability analysis based on physical, chemical, biological, infrastructural, and socio-economic factors for seaweed mariculture. The parameters used included current velocity, sea floor substrates, water depth, dissolved oxygen, salinity, sea surface temperature, clarity, pH, nitrate and phosphate concentration, coastal ecosystem, infratructure facilities, the distance from shoreline, and distance from settlements. The result of the GIS analysis was that the area of waters is suitable for seaweed mariculture. The method used in the suitability analysis was the matching method, where the results of the suitable (Smatch) were based on the lowest condition of the existing parameters (Spar). The formula used is as follows: (1) where is the suitable area for seaweed mariculture, and is the minimum condition of the first parameter until n number of parameter.
Waters carrying capacity analysis a. Seaweed mariculture waters capacity. The waters capacity for seaweed mariculture was defined as the area of waters that could be utilized continuously for seaweed mariculture activities which would not socially cause conflict and would not ecologically disturb the coastal ecosystem. The waters’ capacity was analyzed using the following formula (modified from Rauf 2008):
(2)
Where: = seaweed mariculture water capacity (%);
= area of cultivation units managed (m2); = area suitable for one cultivation unit (m2);
AACL Bioflux, 2017, Volume 10, Issue 4. http://www.bioflux.com.ro/aacl 898
= the width of the cultivation unit managed (m); = the length of the cultivation unit managed (m); = the width of the cultivation unit managed plus the distance between units (m); = the length of the cultivation unit managed plus the distance between units (m).
The area of the cultivation unit managed was based on the average area of cultivation units in Takalar Regency. The fishermen usually plant seaweed with a rope length of 25 depa or approximately 45 meters and the distance between rope stretches of 1 meter with the average number of rope stretches 50 stretches, so one managed cultivation unit was 2,250 m2 or 0.225 hectares. The suitable area for one cultivation unit was determined based on the area of the cultivation unit managed plus the distance between cultivation units. The distance between cultivation units was assumed to be 10 meters based on the consideration that there needed to be an aisle for boats, twice the average length of the boats used by the fishermen.
b. Waters carrying capacity. Waters carrying capacity demonstrates the area’s maximum ability to continuously support cultivation activities without causing a decrease in the quality of both the biophysical and social environment. The waters carrying capacity for seaweed mariculture was calculated from the area of suitable waters multiplied by the water capacity. The area of suitable waters was obtained from the matching analysis. The equation for waters carrying capacity is as follows:
(3) Where:
= water carrying capacity for seaweed mariculture (ha); = the area of suitable waters (ha);
= seaweed mariculture waters capacity (%).
In order to calculate the number of cultivation units that could be supported based on the calculated water carrying capacity, this equation was used: (4) Where:
= the number of seaweed mariculture units (unit); = water carrying capacity (ha); = area of managed cultivation units (ha unit-1).
Results Water characteristics and coastal ecosystem. Descriptive statistics of the results of the water quality measurements in the seaweed mariculture area in Takalar Regency, South Sulawesi Province, can be seen in Table 1. The lowest average salinity was measured during the west season and the highest during the east season. The average salinity during the west season was 31.9 psu, season first transition season 33.5 psu, and 32.4 psu during the second transition season. During the three seasons, the salinity was in line with the optimum standard range, but during the east season, the average salinity reached 35.9 psu which exceeded the optimum standard for seaweed mariculture (BSN 2010). The maximum salinity occurred during the east season, reaching 38 psu on the south coast of Tanakeke Islands and the coast of Sanrobone sub-district.
The salinity distribution pattern during the west season was nearly the same in all Takalar waters, ranging between 31 and 33 psu (Figure 3). The salinity of 33-35 psu was measured in the eastern part of Tanakeke Island and Laikang Bay. The Sanrobone Coast and Laikang Bay which bordered Jeneponto Regency had a salinity of 29-31 psu. During first transition season, the salinity was higher with a distribution in the Tanakeke Island and Sanrobone area. The salinity of 31-33 psu was distributed in the coast of North Galesong, Galesong and Mangarabombang. In the east season, the distribution of salinity was dominated by 35-39 psu and the lower salinity was only found in North Galesong.

AACL Bioflux, 2017, Volume 10, Issue 4. http://www.bioflux.com.ro/aacl 899
The salinity decreased during the second transition season with a distribution dominated by 31-33 psu.
The maximum DO was inversely proportionate to salinity, the highest DO was during the west season, reaching 10.2 mg L-1 and the lowest was during the east season at 5.4 mg L-1. The average DO for the four seasons according to the Ministry of Environment standard No. 51 Year 2004 pertaining to the seawater quality standards for biota is 5 mg L-1.
The acidity (pH) for a certain body of water reveals the balance between acid and base in the water and is the measurement of the concentration of hydrogen ions in a certain liquid. Lüning (1990) stated that the degree of acidity (pH) is one important factor which influences seaweed growth. The pH during the four seasons in Takalar were in line with the optimum standard with a fairly similar average; during the west season it was 8.20, the first transition season 7.83, the east season 7.97, and the second transition season 8.57.
Table 1
Descriptive statistics for water quality data
Parameter Unit Season N Average Minimum Maximum Std. deviation 1 64 31.91 28.00 35.00 1.47701 2 64 33.53 28.00 37.00 1.99180 3 118* 35.92 29.00 38 2.44430
Salinity psu
4 75 32.36 27.00 35.00 1.49675 1 64 8.20 7.90 8.70 0.12963 2 64 7.83 7.72 8.00 0.07474 3 54 7.97 7.76 8.15 0.10155
pH
4 75 8.57 7.80 9.00 0.30323 1 64 6.64 3.80 10.20 1.36529 2 64 5.95 3.00 7.60 0.74848 3 118* 6.70 5.20 9.20 1.17418
DO mg L-1
4 75 7.73 6.00 9.10 0.71823 1 64 30.72 28.80 32.20 0.86038 2 64 31.01 29.00 33.70 1.04678 3 54 28.83 26.00 32.00 1.28506
Sea surface temperature
oC
4 75 31.28 29.30 34.40 0.88483 1 3 0.033 0.010 0.060 0.00669 2 64 0.029 0.017 0.056 0.007645 3 54 0.041 0.020 0.083 0.015323
Nitrate (NO3)
mg L-1
4 75 0.058 0.024 0.098 0.021098 1 18 0.276 0.012 1.490 0.010000 2 64 0.067 0.040 0.129 0.019289 3 54 0.062 0.023 0.098 0.018492
Phosphate (PO4)
mg L-1
4 75 0.011 0.002 0.040 0.006267 1 64 81.66 43 100 22.002 2 58 87.29 35 100 19.080 3 54 87.93 40 100 18.550
Clarity %
4 75 83.67 25 100 21.392 1 64 4.58 0.01 12.12 2.62254 2 64 0.07 0.01 0.41 0.09266 3 118* 18.95 0 60 9.60221
Current velocity
cm s-1
4 75 9.31 1.30 43.10 7.63741 NTU 3 54 2.10 0.34 8.74 1.43111 Turbidity
4 75 3.09 0.39 21.73 3.62019 Note: Season 1: west season, season 2: first transition season, season 3: east season and season 4: second transition season. * Some of the data were obtained from BIG (2016).

AACL Bioflux, 2017, Volume 10, Issue 4. http://www.bioflux.com.ro/aacl 900
The results for the laboratory analysis for nitrate concentration in all stations were relatively stable, ranging between 0.01-0.098 mg L-1 with an average of 0.044 mg L-1. The lowest average phosphate measured was during the second transition season at 0.011 mg L-1. The average during the first transition season was not so different from that of the east season with an average of 0.067 mg L-1. The highest measured average was during the west season reaching 0.276 mg L-1.
West season 1st transition season
East season 2nd transition season
A
B
C
D
Figure 3. The water quality spatial distribution pattern: a. salinity, b. sea surface
temperature, c. pH and d. dissolved oxygen for the four seasons. The average sea surface temperature during the four seasons ranged between 28.83 and 31.28oC. This was in line with Nontji’s statement (2002) that declared the temperature of the water surface in Indonesian waters ranged between 28 and 31oC. The surface temperature distribution in Takalar waters during first transition season and second transition season was dominated by temperatures ranging between 31 and 33oC (Figure 3). During the east season, the temperature distribution tended to be lower in the Flores

AACL Bioflux, 2017, Volume 10, Issue 4. http://www.bioflux.com.ro/aacl 901
Sea which is located in the South of Takalar than in the northern area. The distribution pattern of the water surface temperature during first transition season and second transition season tended to be higher than the west season and the east season. During the monsoons, between April-May and November, the temperature would be at its highest because during season change the winds are usually weak and the sea very calm, so the heating process at the surface occurs more intensely (Nontji 2002).
The average clarity was greater than 80% for all seasons. The laboratory analysis for turbidity conducted during the east season and second transition season surveys demonstrated that the average was less than 4 NTU. Turbidity which was higher than the seawater quality standards for biota was only found at two sampling locations in Sanrobone area during the east season and a number of sampling points in the outer part of Mangarabombang Bay during the second transition season.
The tide type in the Takalar waters that is part of the Makassar Strait is a mixed type, with diurnal tendencies where in a single day there is one high tide and one low tide. The Takalar Regency stretches from the North to the South so the current runs mostly in a meridional direction (BIG 2016). The waters in the cultivation area are relative calm, seen from the average current velocity which is less than 20 cm s-1 for the four seasons. The field measurements were less than the 2010 Indonesian National Standards (Standar Nasional Indonesia (SNI)) pertaining to the cottonii seaweed production, stating that the standard current velocity for optimum seaweed mariculture is 20-40 cm s-1. In the field, this was overcome by the fishermeners by moving the rope frequently so that algae does not adhere to the seaweed.
The depth of waters in the seaweed mariculture area is mostly less than 10 m, and only in a few sampling points in Laikang Bay does the depth exceed 10 m. The substrate on the floor of Takalar waters is dominated by sand and muddy sand. The coral Acropora sp. was numerous on Tanakeke Island and dead coral in Laikang Bay area. The types of seagrass found in Takalar were Thalassia hemprichii, Enhalus acoroides, and Syringodium isoetifolium with the most dominant species E. acoroides (Mulyawan et al 2015).
The mangrove forest found on the coast of Takalar Regency and Tanakeke Islands covering an area of 1,057 ha, consisting of a 78 ha protected area and a 979 ha utilization zone. The size of the mangrove forest on Tanakeke Islands was 51 ha which is recorded as the largest mangrove area in South Sulawesi Province. The mangrove mapping results from the 2015 Geospatial Information Agency in Takalar Regency recorded that the mangrove area was 1,258.32 ha with the following canopy densities: 48.18 ha very dense, 415.5 ha dense, 471.11 ha fair, 231.66 ha sparse, and 91.87 ha very sparse. There are 5 types of mangrove found there, Rhizophora sp., Avicennia sp., Nypa sp., Lumnitzera sp., and Bruguiera sp. The fauna living in the mangrove area included Littoria intermedia, Littoria scabra, Neripteron violacea, Hemigrapsus sp., Clistcoeloma sp., Dorippe sp., Pagurus sp., Xylotrupes gideon, Ardeola speciosa, and Nycticorax nycticorax. There were also lizards, monitor lizards, insects, molluscs, and crustaceans from the gastropoda, bivalvia and maxillopoda classes (BIG 2015). The water suitability for seaweed mariculture. The seaweed mariculture suitability analysis was conducted using 15 parameters, including physical, chemical, biology, infrastructure and socio-economic parameters (Table 2). The standard value based on BSN (2010) and KLH (2004) is the optimum seaweed mariculture growth value. For the suitability analysis, a suitability value range was used because cultivated seaweed could still survive in water conditions under less or greater values than the optimum value, even though the yield is not maximum. The suitability value range considers the minimum and maximum limits for seaweed growth and the cultivation technology used (Kapetsky & Aquilar-Manjarrez 2007; Radiarta et al 2004).
The analysis method used was based on the matching method, where the suitability of one area was based on one area was determined in the basis of the least suitability class of the existing parameters. The selection of this method was based on the field observation results of the water parameters which were mostly in line with the standards (Table 2).

AACL Bioflux, 2017, Volume 10, Issue 4. http://www.bioflux.com.ro/aacl 902
The results of the seaweed mariculture suitability were classified into two classes, suitable and unsuitable based on the parameters in Table 2. The seaweed mariculture temporal suitability analysis using the matching method resulted in the greatest suitable area during the west season and the least during the east season (Table 3). The main limiting factor in seaweed mariculture in Takalar Regency was current velocity. Seaweed requires a current velocity of 20-40 cm s-1, while the actual current velocity in this area was 0-30 cm s-1, influencing the locations suitable for the cultivation.
Table 2
Seaweed mariculture suitability parameters
No. Parameter Suitability range Standard Reference 1 Physical Depth (m) 1-10 ≥ 2 BSN (2010) 2 Current velocity
(cm s-1) 1-40 20-40 BSN (2010)
3 Water surface temperature (0C)
25-33 26-32 BSN (2010)
4 Clarity (%) 50-100 5 Substrate Sand, muddy
sand, coral debris Sand with
coral BSN (2010)
6 Chemical Salinity (o/00) 25-35 28-34 BSN (2010) 7 Dissolved oxygen
(mg L-1) > 4 >5 KLH (2004)
8 pH 6.5-9 7-8.5 BSN (2010) 9 Nitrate (mg L-1) 0.008-0.1 0.008 KLH (2004) 10 Phosphate (mg L-1) 0.01-0.1 0.015 KLH (2004) 11 Biological Coastal and marine
resources Open sea Natural
seaweed /seagrass
BSN (2010)
12 Infrastructural facilities Available 13 Distance to residential
areas (km) < 3 < 3 Radiarta et al
(2004) 14 Distance to dock (m) > 500 > 500 Radiarta et al
(2004) 15
Infrastructure and socio-economy
Distance to shoreline (km)
< 3 0.5 – 3 Muir (2004) in Kapetsky et al
(2007)
Table 3 Size of seaweed-mariculture suitable area (hectare)
Season Class
West 1st transition East 2nd transition Suitable 16,555.31 15,688.94 9,830.18 14,810.19
Unsuitable 777.21 1,643.67 7,502.70 2,504.92 The size of the area unsuitable during the west season and first transition season was very small with the limiting factor being current velocity. The limiting factor during the east season was salinity and current velocity. The size of suitable area during the east season was the least in the four seasons. This was because during this season, the weather and environmental conditions were not supportive, for example the winds were strong, causing high waves. The high waves could cause the seaweed-tethering lines and the seaweed itself to break. In addition, during the east season the salinity was very high above the standard range for seaweed mariculture. Seaweed is very sensitive to sharp fluctuations in salinity. Extreme changes in salinity also cause the ice-ice disease. This was supported by the study conducted by Asni (2015) who demonstrated that the following parameters: salinity, nitrate and clarity, had a significant effect of seaweed production during the dry season.

AACL Bioflux, 2017, Volume 10, Issue 4. http://www.bioflux.com.ro/aacl 903
The limiting factor during the second transition season was current velocity, phosphate concentration, and clarity. Current velocity, phosphate concentration, and clarity percentage during this season had a tendency of being lower than the seaweed mariculture standards.
The locations suitable for yearlong seaweed mariculture were found in Laikang Bay, Mangarabombang sub-district and the northern part of Tanakeke Island (Figure 4). These locations were sheltered from currents (water movements) and strong waves, allowing cultivated seaweed to grow well.
(a)
(b)
(c)
(d)
Figure 4. The seaweed mariculture suitability map: a. the west season, b. the first
transition season, c. the east season and d. the second transition season. Waters carrying capacity. Waters carrying capacity for seaweed mariculture was calculated based on the size of the suitable area based on the GIS analysis and water capacity. The water capacity depended on the cultivation method. In Takalar Regency, all the fishermen used the method long line method. The water capacity was obtained from the percentage of managed cultivation unit size divided by the size suitable for one cultivation unit. The average size for a cultivation unit managed in Takalar was 0.225 hectares and the suitable size was 0.33 hectare, so the percentage of water capacity was

AACL Bioflux, 2017, Volume 10, Issue 4. http://www.bioflux.com.ro/aacl 904
68%. The results of the seaweed mariculture waters carrying capacity analysis using the water capacity approach is presented in Table 4.
Based on the results of the waters carrying capacity analysis for seaweed maricultural activities, the greatest carrying capacity was during the west season at 11,257.61 ha with 50,034 cultivation units, followed by first transition season at 10,668.48 ha, second transition season at 10,070.93 ha, and lastly by the east season at 6,684.52 ha.
Table 4 Waters carrying capacity for seaweed mariculture
Waters carrying capacity No. Season Suitable
waters (ha) Water
capacity (%) Ha Units 1 West 16,555.31 68 11,257.61 50,034 2 1st transion 15,688.94 68 10,668.48 47,415 3 East 9,830.18 68 6,684.52 29,709 4 2nd transition 14,810.19 68 10,070.93 44,760
Discussion
Water quality. Seaweed growth and mariculture productivity are strongly affected by the physical and chemical factors in the waters such as the currents (water movement), temperature, salinity, nurient contents, and optimum sunlight intensity (Shi et al 2011; Sahu et al 2011; Peteiro & Freire 2011; Bezerra & Marinho-Soriano 2010; Hayashi et al 2007; Munoz et al 2004; Dy & Yap 2001; Kaladharan et al 1996; Mclachlan & Bird 1986; Guist et al 1982). Seasonal changes also strongly influence seaweed growth, observed by Hurtado et al (2001) who conducted a research on K. alvarezii in Panagatan, the Philippines, discovering that the highest daily growth rate was achieved between January and February. Another study conducted in Madagascar demonstrated that the average seaweed growth using the long-line method was higher during the colder seasons, between April and August (Ateweberhan et al 2015).
The water quality measurement results in the seaweed cultivation area in Takalar Regency South Sulawesi Province mostly revealed values within the suitable range for seaweed mariculture. The salinity for the three seasons ranged between 27 and 35 psu, making almost the entire Takalar waters suitable for seaweed mariculture. However, during the east season, there were a number of areas that exceeded the standards. Nontji (2002) stated that the salinity during the east season in the eastern Indonesian waters, including Makassar Strait, had values exceeding 34 ppt. Salinity influences the growth of cultivated seaweed where low or higher salinity would cause slow seaweed growth or even seaweed mortality (Mosquera-Murillo & Pena-Salamanca 2016; Ding et al 2013; Yong et al 2014; Hayashi et al 2011; Arisandi et al 2011; Choi et al 2010). According to Parenrengi et al (2012), the seaweed’s salinity tolerance ranges between 28 and 35 ppt and the study by Hayashi et al (2011) demonstrated that the K. alvarezii growth would be normal at a salinity between 25 and 45 psu. Kasim & Mustafa (2017) stated that the average growth of K. alvarezii is very much influenced by salinity, current velocity, and nitrate and phosphate concentrations.
Dissolved oxygen influences the seaweed’s respiration process, and the DO suitable for mariculture is greater than 5 mg L-1 (Radiarta et al 2004). In general, the DO in Takalar waters for the four seasons was very suitable for seaweed mariculture. Only during the west season and first transition season, a number of locations were not quite suitable because the DO was less than 4 mg L-1. The distribution pattern during second transition season was dominated by a DO of 7-9 mg L-1 and during the first transition season between 5 and 8 mg L-1.
The acidity level (pH) range at the study location (pH) was small, between 7 and 9. This indicated that the Takalar waters were not polluted and is suitable for mariculture. Effendi (2003) declared that the pH range for marine waters is 7.4 to 8.5, and if it is higher or lower, this indicates that the waters are polluted or is harboring intense
AACL Bioflux, 2017, Volume 10, Issue 4. http://www.bioflux.com.ro/aacl 905
biological activities. The study by Tee et al (2015) revealed that the average daily growth of K. alvarezii was highest at pH 8.4 and seaweed would exerience stress at a pH of 6. The pH influenced the seaweed’s karageenen yield. The carrageenan yield increases at a pH of 7.5-8.5 and decreases at a pH of 9 (Gundo et al 2011).
The results of the sea surface temperature measurements during the four seasons revealed that the minimum range was 26oC and the maximum was 34oC. Sea surface temperature has a strong influence on seaweed growth. Msuya (2011) demonstrated that the effect of a rise in water temperature was a decline in K. alvarezii production. Production on Songo-songo Island in Tanzania in 2003 reached 420 tons but droped to 26 tons in 2008. Temperature affects the photosynthetic pigments in the seaweed (Ding et al 2013). A study by Munoz et al (2004) demonstrated that K. alvarezii’s maximum photosynthesis occurred when water surface temperature was 30oC. The optimum photosynthesis for E. spinosum is between 30-35oC and the optimum water surface temperature for K. alvarezii ranges between 25-28oC (Dawes 1989 in Ask & Azanza 2002), while according to Kangkan (2006) it is between 26 and 28oC. The results of a study by Ateweberhan et al (2015) demonstrated that the seaweed’s average growth was higher during the winter, when the maximum daily temperature had a significant effect on K. alvarezii. Wenno et al (2015) stated green strain of K. alvarezii was influenced by the prolonged period of heavy rain, while brown strain of K. alvarezii by rainy and hot weather.
The mineral phosphate and nitrate are needed for the growth and development of seaweed. A lack of nitrogen would inhibit the growth of seaweed because nitrogen is the element used in the photosynthesis process (Kushartono et al 2009). In general, the average nitrate and phosphate concentration in the study location during the four seasons was above the optimum concentration for marine biota standards based on the KLH (2004), only during the second transition season was the phosphate concentration below the 0.015 mg L-1 standard. The high nitrate and phosphate concentration was due to the increase in waste products disposed to the waters through rivers, making the waters tend to be fertile. The concentration of nitrate in Takalar was still normal for a tropical area which is less than 0.1 mg L-1. Nitrate is the main form of nitrogen in natural waters with a concentration higher than 0.1 mg L-1 and if it exceeds 0.2 mg L-1 would cause eutrofication (Effendi 2003).
Seaweed mariculture area suitability and spatial carrying capacity. Seaweed mariculture area suitability and spatial carrying capacity was assessed using criteria based on literature study and was adjusted to the conditions of study location. The results of the suitability analysis show the size of the potential area based on physical, chemical, aquatic biology, ecosystem, socio-economic, and existing infrastructure characteristics. Spatial carrying capacity demonstrates the potential area based on the suitability analysis by considering the cultivation method employed.
The spatial carrying capacity for seaweed mariculture was different for every season, the west season > first transition season > second transition season > east season. This was in line with the results of field observations of different sized seaweed mariculture, depending on the season. In the survey at August-September, which is the east season, most of the area was left fallow and part of it was sown for seed because the weather conditions were not supportive. This condition was similar to the study by Kurnianto & Triandiza (2013) in South East Maluku, revealing that seaweed growth was slowest from mid June to August.
Data from the Takalar Regency Central Bureau for Statistics stated that the area of sea utilized for seaweed mariculture in 2014 was 13,386 hectares or reaching 81% of the suitable area during the west season. This condition demonstrated that most of the Takalar waters was already utilized for cultivation. The area in Mangarabombang and Sanrobone sub-districts, the area utilized was larger than the area according to the analysis results. The area suitable in Mangarabombang sub-district was 6,280.66 ha during the west season, smaller than the area actually utilized, 7,210 ha (BPS 2015). This means that the entire water of this sub-district’s coast had been utilized, including areas that were unsuitable according to the analysis results. This study employed the

AACL Bioflux, 2017, Volume 10, Issue 4. http://www.bioflux.com.ro/aacl 906
matching method in the suitability analysis where if one of the parameters were unsuitable, the area becomes rendered unsuitable. The unsuitable parameter during the west season was current velocity. As mentioned previously, the fishermen often move the line if the currents are calm. This had an impact on the mariculture, allowing seaweed to grow in that particular condition.
The untounched potential for seaweed mariculture in Takalar Regency could be calculated from the carrying capacity size subtracted by the size of the existing seaweed mariculture area (Table 5). The existing seaweed mariculture was calculated based on an analysis of the 2016 Landsat 8 image. Based on the results of the analysis potential, more than 75% of the potential has not yet been utilized from all four seasons. The potentials listed in Table 5 are the potentials for one regency which includes six coastal sub-districts. Data for the BPS (2015) and field observations revealed that seaweed mariculture was only found in four sub-districts: Mangarabombang, Mappakasunggu, Sanrobone and North Galesong. Moreover, based on the Regional Spatial Plan (Rencana Tata Ruang Wilayah /RTRW) for Takalar Regency, there are three strategic areas on the coast of Galesong sub-district: the Sanrobenge tourism area, Be’ba fishery development area, and Galesong warehouse and dock area, making this sub-district to be excluded from the seaweed mariculture development plans. This is why the size of the potential area was then reduced further by subtracting the size of the potential area in these two sub-districts. The results of the spatial carrying capacity analysis in the two sub-districs, Galesong and South Galesong, covered an area of 1,269.38 hectares. The potential for seaweed mariculture for the four sub-districts, Mangarabombang, Mappakasunggu, Sanrobone and North Galesong, can be seen in Figure 5. According to the results of the spatial utilization spatial availability analysis, the spatial carrying capacity in Takalar Regency is still abundantly available. Most of the percentage of the untouched area was more than 70% for four seasons, only in Mappakasunggu sub-district which was below 70% in the west season and first transition season. The development of seaweed mariculture could be increased by adding the number of cultivation units for each fisherman with hopes that their income increases.
Figure 5. Potency of four sub-districts.

AACL Bioflux, 2017, Volume 10, Issue 4. http://www.bioflux.com.ro/aacl 907
Table 5 The potential for seaweed mariculture in Takalar Regency
Potential No. Season Carrying
capacity (ha) Existing area
(ha)* Ha Units % 1 West 11,257.61 2,451.00 8,806.61 39,140 78 2 1st transition 10,668.48 2,017.11 8,651.37 38,451 81 3 East 6,684.52 637.94 6,046.58 26,874 90 4 2nd transition 10,070.93 1,169.18 8,901.75 39,563 88
Note: * The existing cultivation area was based on an analysis of 2016 Landsat 8 image. Based on the area size and production data from BPS (2015), the Eucheuma seaweed’s productivity in Takalar Regency reached 62.32 ton ha-1. The results of the study by Hidayat (1994) was that in 1 hectare of seaweed mariculture using the long-line method yielded a production of 67.2 ton dry weight. This proved that the productivity in Takalar Regency was fairly high.
Conclusions. The growth and development of seaweed mariculture is strongly influenced by an optimum water qualities. The water conditions in Takalar Regency waters were very suitable for seaweed mariculture, especially during the west and first transition season. The carrying capacity of the west season was the broadest compared to the other seasons, followed by first transition season, second transition season, and lastly the east season. The spatial potential that is still untouched for all four seasons is still large, exceeding 75%. Acknowledgements. The authors would like to thank all parties, both individuals and institutions, that had helped in this study. This article was part of a graduate program research funded by the Ministry of Research, Technology, and Higher Education of the Republic of Indonesia. References Anonymous, 2013 Overview of ecological effects of aquaculture. Ministry for Primary
Industries. Wellington, New Zealand, ISBN 978-0-478-40536-1, 78 pp. Arisandi A., Marsoedi, Nursyam H., Sartimbul A., 2011 [The effect of different salinity on
morphology, size and number of cells, growth and yield of carrageenan Kappaphycus alvarezii]. Ilmu Kelautan 16(3):143-150. [in Indonesian]
Ask E. I., Azanza R. V., 2002 Advances in cultivation technology of commercial eucheumatoid species: a review with suggestions for future research. Aquaculture 206:257-277.
Asni A., 2015 [Seaweed production analysis (Kappaphycus alvarezii) based on season and distance of cultivation location in waters of Bantaeng Regency]. Jurnal Akuatika 6(2):140-153. [in Indonesian]
Ateweberhan M., Rougier A., Rakotomahazo C., 2015 Influence of environmental factors and farming technique on growth and health of farmed Kappaphycus alvarezii (cottonii) in south-west Madagascar. Journal of Applied Phycology 27:923-934.
Bezerra A. F., Marinho-Soriano E., 2010 Cultivation of the red seaweed Gracilaria birdiae (Gracilariales, Rhodophyta) in tropical waters of northeast Brazil. Biomass and Bioenergy 34(12):1813-1817.
[BIG] Geospatial Information Agency, 2015 [Description of Sulawesi mangrove map: West Sulawesi, South Sulawesi and Southeast Sulawesi]. BIG [in Indonesian]
[BIG] Geospatial Information Agency, 2016 [Characteristics of marine shallow waters in South and Southeast Sulawesi]. BIG. [in Indonesian]
Bixler H. J., Porse H., 2011 A decade of change in seaweed hydrocolloids industry. Journal of Applied Phycology 23:321-335.

AACL Bioflux, 2017, Volume 10, Issue 4. http://www.bioflux.com.ro/aacl 908
Bostoc J., McAndrew B., Richards R., Jauncey K., Telfer T., Lorenzen K., Little D., Ross L., Handisyde N., Gatward I., Corner R., 2010 Aquaculture: global status and trends. Philosophical Transactions of the Royal Society B 365:2897-2912.
[BPS] Statistics Indonesia, 2015 [Takalar in Figures 2015]. BPS Kabupaten Takalar. [in Indonesian]
[BSN] National Standardization Agency, 2010 [Seaweed production (Eucheuma cottonii) – Part 2: Long-line method. SNI 7579.2:2010. [in Indonesian]
Campbell B., Pauly D., 2013 Mariculture: a global analysis of production trends since 1950. Marine Policy 39:94-100.
Choi T. S., Kang E. J., Kim J. H., Kim K. Y., 2010 Effect of salinity on growth and nutrient uptake of Ulva pertusa (Chlorophyta) from an eelgrass bed. Algae 25(1):17-26.
Chopin T., 2014 Seaweeds: top mariculture crop, ecosystem service provider. Global Aquaculture Advocate 17:54-56.
Dahuri R., Rais J., Ginting S. P., Sitepu M. J., 2001 [Integrated coastal and marine resource management]. PT. Pradnya Paramita, Jakarta, 328 pp. [in Indonesian]
Ding L., Ma Y., Huang B., Chen S., 2013 Effects of seawater salinity and temperature on growth and pigment contents in Hypnea cervicornis J. Agardh (Gigartinales, Rhodophyta). BioMed Research International 2013:594308, 10 pp.
Dy D. T., Yap H. T., 2001 Surge ammonium uptake of the cultured seaweed, Kappaphycus alvarezii (Doty) Doty (Rhodophyta: Gigartinales). Journal of Experimental Marine Biology and Ecology 265:89-100.
Edwards P., 2015 Aquaculture environment interaction: past, present and likely future trends. Aquaculture 447:2-14.
Effendi H., 2003 [Water quality study for resource and environmental management]. Kanisius, Yogyakarta, 256 pp. [in Indonesian]
[FAO] Food and Agriculture Organization, 2016 FAO Yearbook 2014: Fishery and Aquaculture Statistics. ISBN 978-92-5-009268-3.
Guist Jr. G. G., Dawes C. J., Castle J. R., 1982 Mariculture of the red seaweed, Hypnea musciformis. Aquaculture 28:375-384.
Gundo C., Soemarno, Arfiati D., Harahap N., Kaunang T. D., 2011 [Oceanographic parameters analysis at development site of Eucheuma spinosum in Nain Island North Minahasa Regency]. Ilmu Kelautan 16(4):193-198. [in Indonesian]
Hayashi L., De Paula E. J., Chow F., 2007 Growth rate and carrageenan analyses in four strains of Kappaphycus alvarezii (Rhodophyta, Gigartinales) farmed in the subtropical waters of Sao Paulo State Brazil. Journal of Applied Phycology 19:393-399.
Hayashi L., Faria G. S. M., Nunes B. G., Zitta C. S., Scariot L. A., Rover T., Felix M. R. L., Bouzon Z. L., 2011 Effects of salinity on the growth rate, carrageenan yield, and cellular structure of Kappaphycus alvarezii (Rhodophyta, Gigartinales) cultured in vitro. Journal of Applied Phycology 23:439-447.
Hidayat A., 1994 [Seaweed cultivation]. Penerbit Usaha Nasional, 96 pp. [in Indonesian] Hurtado A. Q., Agbayani R. F., Sanares R., de Castro-Mallare M. T. R., 2001 The
seasonality and economic feasibility of cultivating Kappaphycus alvarezii in Panagatan Cays, Caluya, Antique, Philippines. Aquaculture 199:295-310.
Inglis G. J., Hayden B. J., Ross A. H., 2000 An overview of factors affecting the carrying capacity of coastal embayments for mussel culture. National Institute of Water and Atmospheric Research Ltd (NIWA), New Zealand, pp. 3-16.
Kaladharan P., Vijayakumaran K., Chennubhotla V. S. K., 1996 Optimization of certain physical parameters for the mariculture of Gracilaria edulis (Gmelin) Silva in Minicoy lagoon (Laccadive Archipelago). Aquaculture 139:265-270.
Kangkan A. L., 2006 [Site determination study for marine aquaculture development based on physics, chemistry and biology parameters in Kupang Bay, East Nusa Tenggara]. MSc Thesis, Diponegoro University, 102 pp. [in Indonesian]
Kapetsky J. M., Aquilar-Manjarrez J. A., 2007 Geographic information system, remote sensing and mapping for the development and management of marine aquaculture. FAO Fisheries Technical Paper, No. 458, Rome, FAO, 125 pp.
AACL Bioflux, 2017, Volume 10, Issue 4. http://www.bioflux.com.ro/aacl 909
Kasim M., Mustafa A., 2017 Comparison growth of Kappaphycus alvarezii (Rhodophyta, Solieriaceae) cultivation in floating cage and longline in Indonesia. Aquaculture Reports 6:49-55.
[KLH] Ministry of Environment, 2004 [The Ministry of Environment Standard No. 51 Year 2004 pertaining to the seawater quality standards for biota]. [in Indonesian]
[KKP] Ministry of Marine Affairs and Fisheries Republic of Indonesia, 2015 [Marine and fisheries in figure 2015]. [in Indonesian]
Kurnianto D., Triandiza T., 2013 [Seasonal influences on the growth and yield of Eucheuma cottonii seaweed planted in two waters locations in Southeast Maluku]. National Seminar on Science & Technology V, Research Organization of University of Lampung, 19-20 November, pp. 1534-1541. [in Indonesian]
Kushartono E. W., Suryono, Setiyaningrum E., 2009 [Application of different composition of N, P and K on the cultivation of Eucheuma cottonii in Awur Bay, Jepara]. Ilmu Kelautan 14(3):164-169. [in Indonesian]
Lüning K., 1990 Seaweeds: their environment, biogeography and ecophysiology. John Wiley and Sons, New York, 544 pp.
Mclachlan J., Bird C. J., 1986 Gracilaria (Gigartinales, Rhodophyta) and productivity. Aquatic Botany 26:27-49.
Mosquera-Murillo Z., Pena-Salamanca E. J., 2016 Effect of salinity on growth of the green alga Caulerpa sertularioides (Bryopsidales, Chlorophyta) under laboratory conditions. Hidrobiologica 26(2):277-282.
Msuya F. E., 2011 Environmental changes and their impact on seaweed farming in Tanzania. World Aquaculture 42:34-37.
Mulyawan A. E., Saokani J., 2015 [Characteristics of habitat and abundance of sea horses (Hippocampus barbouri) caught in the Tanakeke Islands, Takalar Regency]. Jurnal Balik Diwa 6(2):13-19. [in Indonesian]
Munoz J., Freile-Pelegrin Y., Robledo D., 2004 Mariculture of Kappaphycus alvarezii (Rhodophyta, Solieriaceae) color strains in tropical waters of Yucatan, Mexico. Aquaculture 239:161-177.
Nontji A., 2002 [Archipelago sea]. Third printing, Penerbit Djambatan, Jakarta, pp. 53-67. [in Indonesian]
Parenrengi A., Rachmansyah, Suryati E., 2012 [Seaweed cultivation: Karaginan Producer (Karaginofit)]. Seri Teknologi untuk Minapolitan. Third edition, Badan Penelitian dan Pengembangan Kelautan dan Perikanan – Kementerian Kelautan dan Perikanan, pp. 21-26. [in Indonesian]
Peteiro C., Freire Ó., 2011 Effect of water motion on the cultivation of the commercial seaweed Undaria pinnatifida in a coastal bay of Galicia, Northwest Spain. Aquaculture 314(1-4):269-276.
Radiarta I. N., Saputra A., Priono B., 2004 [Mapping of land eligibility for mariculture development in Saleh Bay West Nusa Tenggara]. Jurnal Penelitian Perikanan Indonesia 10:19-32. [in Indonesian]
Radiarta I. N., Erlania, Rusman, 2013 [Impact of climate on seaweed, Kappaphycus alvarezii planting periods in Gerupuk Bay, Central Lombok Regency, West Nusa Tenggara]. J Ris Akuakultur 8(3):453-464. [in Indonesian]
Rauf A., 2008 [Integrated development of Tanakeke Archipelago land utilization based on carrying capacity]. PhD Thesis, Bogor Agricultural University, 211 pp. [in Indonesian]
Ross L. G., Telfer T. C., Falconer L., Soto D., Aguilar-Manjarrez J., Asmah R., Bermúdez J., Beveridge M. C. M., Byron C. J., Clément A., Corner R., Costa-Pierce B. A., Cross S., De Wit M., Dong S., Ferreira J. G., Kapetsky J. M., Karakassis I., Leschen W., Little D., Lundebye A. K., Murray F. J., Phillips M., Ramos L., Sadek S., Scott P. C., Valle-levinson A., Waley D., White P. G., Zhu C., 2013 Carrying capacities and site selection within the ecosystem approach to aquaculture. In: Site selection and carrying capacities for inland and coastal aquaculture. Ross L. G., Telfer T. C., Falconer L., Soto D., Aguilar-Manjarrez J. (eds), FAO Fisheries and Aquaculture Proceedings No. 21, Rome, FAO, pp. 19-46.

AACL Bioflux, 2017, Volume 10, Issue 4. http://www.bioflux.com.ro/aacl 910
Sahu N., Meena R., Ganesan M., 2011 Effect of grafting on the properties of kappa-carrageenan of the red seaweed Kappaphycus alvarezii (Doty) Doty ex Silva. Carbohydrate Polymers 84(1):584-592.
Shi J., Wei H., Zhao L., Yuan Y., Fang J., Zhang J., 2011 A physical-biological coupled aquaculture model for a suspended aquaculture area of China. Aquaculture 318(3-4):412-424.
Tee M. Z., Yong Y. S., Rodrigues K. F., Yong W. T. L., 2015 Growth rate analysis and protein identification of Kappaphycus alvarezii (Rhodophyta, Gigartinales) under pH induced stress culture. Aquaculture Reports 2:112-116.
Wenno P. A., Syamsuddin R., Zainuddin E. N., Ambo-Rappe R., 2015 Cultivation of red seaweed Kappaphycus alvarezii (Doty) at different depths in South Sulawesi, Indonesia. AACL Bioflux 8(3):468-473.
Yong W. T. L., Ting S. H., Yong Y. S., Thien V. Y., Wong S. H., Chin W. L., Rodrigues K. F., Anton A., 2014 Optimization of culture conditions for the direct regeneration of Kappaphycus alvarezii (Rhodophyta, Solieriaceae). Journal of Applied Phycology 26(3):1597-1606.
Received: 12 June 2017. Accepted: 05 August 2017. Published online: 12 August 2017. Authors: Ati Rahadiati, Study Program of Coastal and Marine Resources Management, Graduate Program Bogor Agricultural University (IPB), Kampus IPB Darmaga Bogor 16680, Indonesia; Geospatial Information Agency (BIG), Jl. Raya Jakarta – Bogor KM 46 Cibinong Bogor 16911, Indonesia, e-mail: [email protected] Kadarwan Soewardi, Department of Aquatic Resources Management, Faculty of Fisheries and Marine Sciences, Bogor Agricultural University (IPB), Kampus IPB Darmaga Bogor 16680, Indonesia, e-mail: [email protected] Yusli Wardiatno, Department of Aquatic Resources Management, Faculty of Fisheries and Marine Sciences, Bogor Agricultural University (IPB), Kampus IPB Dramaga Bogor 16680, Indonesia, e-mail: [email protected] Dewayany, Geospatial Information Agency (BIG), Jl. Raya Jakarta – Bogor KM 46 Cibinong Bogor 16911, Indonesia, e-mail: [email protected] This is an open-access article distributed under the terms of the Creative Commons Attribution License, which permits unrestricted use, distribution and reproduction in any medium, provided the original author and source are credited. How to cite this article: Rahadiati A., Soewardi K., Wardiatno Y., Dewayany, 2017 Spatial pattern and temporal variation of water quality and carrying capacity for seaweed mariculture in Takalar, Indonesia. AACL Bioflux 10(4):894-910.