Spatial and temporal variability of precipitation and ...idlcc.fc.ul.pt/pdf/Spatial and temporal...
9
Nat. Hazards Earth Syst. Sci., 12, 1493–1501, 2012 www.nat-hazards-earth-syst-sci.net/12/1493/2012/ doi:10.5194/nhess-12-1493-2012 © Author(s) 2012. CC Attribution 3.0 License. Natural Hazards and Earth System Sciences Spatial and temporal variability of precipitation and drought in Portugal D. S. Martins 1 , T. Raziei 1,2 , A. A. Paulo 1,3 , and L. S. Pereira 1 1 CEER-Biosystems Engineering, Instituto Superior de Agronomia, Universidade T´ ecnica de Lisboa, Portugal 2 Soil Conservation and Watershed Management Research Institute, Tehran, Iran 3 Escola Superior Agr´ aria de Santar´ em, Portugal Correspondence to: L. S. Pereira ([email protected]) Received: 2 January 2012 – Revised: 8 March 2012 – Accepted: 20 March 2012 – Published: 16 May 2012 Abstract. The spatial variability of precipitation and drought are investigated for Portugal using monthly precipitation from 74 stations and minimum and maximum temperature from 27 stations, covering the common period of 1941– 2006. Seasonal precipitation and the corresponding percent- ages in the year, as well as the precipitation concentration index (PCI), was computed for all 74 stations and then used as an input matrix for an R-mode principal component anal- ysis to identify the precipitation patterns. The standardized precipitation index at 3 and 12 month time scales were com- puted for all stations, whereas the Palmer Drought Severity Index (PDSI) and the modified PDSI for Mediterranean con- ditions (MedPDSI) were computed for the stations with tem- perature data. The spatial patterns of drought over Portugal were identified by applying the S-mode principal component analysis coupled with varimax rotation to the drought indices matrices. The result revealed two distinct sub-regions in the country relative to both precipitation regimes and drought variability. The analysis of time variability of the PC scores of all drought indices allowed verifying that there is no linear trend indicating drought aggravation or decrease. In addition, the analysis shows that results for SPI-3, SPI-12, PDSI and MedPDSI are coherent among them. 1 Introduction In Portugal, precipitation mainly occurs in the autumn and winter months and is characterized by a large time variabil- ity. Droughts are relatively frequent. Drought can be defined as a natural but temporary imbalance of water availability, consisting of persistent lower-than-average precipitation of uncertain frequency, duration and severity, of unpredictable or extremely hard to predict occurrences, resulting in dimin- ished water resources availability and reduced carrying ca- pacity of the ecosystems (Pereira et al., 2009). Various drought indices have been developed with the ob- jective of showing that a drought is in progress or has oc- curred, as well as to identify the intensity, duration, sever- ity, magnitude and spatial variability of droughts (Mishra and Singh, 2010). Most relevant indices include the Palmer Drought Severity Index, PDSI (Palmer, 1965) and the Stan- dardized Precipitation Index, SPI (McKee et al., 1993, 1995), which are considered herein together with a modification of the PDSI for Mediterranean conditions, the MedPDSI (Pereira et al., 2007; Pereira and Rosa, 2010). The SPI is a normalized index for calculating the deviation from the precipitation normal, allowing identification and character- ization of droughts at different time scales. Shorter time scales like 3 months seem to be adequate for the identifica- tion of agricultural droughts, while longer time scales, e.g. 12 months, better describe hydrological and water resources droughts (Mishra and Singh, 2010; Paulo and Pereira, 2006). The PDSI, unlike the SPI, uses precipitation associated with evapotranspiration and a soil water balance is performed. It was created to characterize and evaluate meteorological droughts by measuring the deviations between the observed and the expected precipitation, which are first transformed into an anomaly moisture index and then into a drought in- dex, which is classified in terms of severity (Palmer, 1965). The MedPDSI is a modification of the original PDSI to adapt it to the Mediterranean conditions. It mainly consists of (a) assuming a rainfed olive orchard as a drought ref- erence crop, (b) replacing the potential climatic evapotran- spiration (ET) computed with the Thornthwaite method by the reference ET computed with the FAO-PM method (Allen Published by Copernicus Publications on behalf of the European Geosciences Union.
Transcript of Spatial and temporal variability of precipitation and ...idlcc.fc.ul.pt/pdf/Spatial and temporal...
Nat. Hazards Earth Syst. Sci., 12, 1493–1501, 2012www.nat-hazards-earth-syst-sci.net/12/1493/2012/doi:10.5194/nhess-12-1493-2012© Author(s) 2012. CC Attribution 3.0 License.
Natural Hazardsand Earth
System Sciences
Spatial and temporal variability of precipitation and drought inPortugal
D. S. Martins1, T. Raziei1,2, A. A. Paulo1,3, and L. S. Pereira1
1CEER-Biosystems Engineering, Instituto Superior de Agronomia, Universidade Tecnica de Lisboa, Portugal2Soil Conservation and Watershed Management Research Institute, Tehran, Iran3Escola Superior Agraria de Santarem, Portugal
Correspondence to:L. S. Pereira ([email protected])
Received: 2 January 2012 – Revised: 8 March 2012 – Accepted: 20 March 2012 – Published: 16 May 2012
Abstract. The spatial variability of precipitation and droughtare investigated for Portugal using monthly precipitationfrom 74 stations and minimum and maximum temperaturefrom 27 stations, covering the common period of 1941–2006. Seasonal precipitation and the corresponding percent-ages in the year, as well as the precipitation concentrationindex (PCI), was computed for all 74 stations and then usedas an input matrix for an R-mode principal component anal-ysis to identify the precipitation patterns. The standardizedprecipitation index at 3 and 12 month time scales were com-puted for all stations, whereas the Palmer Drought SeverityIndex (PDSI) and the modified PDSI for Mediterranean con-ditions (MedPDSI) were computed for the stations with tem-perature data. The spatial patterns of drought over Portugalwere identified by applying the S-mode principal componentanalysis coupled with varimax rotation to the drought indicesmatrices. The result revealed two distinct sub-regions in thecountry relative to both precipitation regimes and droughtvariability. The analysis of time variability of the PC scoresof all drought indices allowed verifying that there is no lineartrend indicating drought aggravation or decrease. In addition,the analysis shows that results for SPI-3, SPI-12, PDSI andMedPDSI are coherent among them.
1 Introduction
In Portugal, precipitation mainly occurs in the autumn andwinter months and is characterized by a large time variabil-ity. Droughts are relatively frequent. Drought can be definedas a natural but temporary imbalance of water availability,consisting of persistent lower-than-average precipitation ofuncertain frequency, duration and severity, of unpredictable
or extremely hard to predict occurrences, resulting in dimin-ished water resources availability and reduced carrying ca-pacity of the ecosystems (Pereira et al., 2009).
Various drought indices have been developed with the ob-jective of showing that a drought is in progress or has oc-curred, as well as to identify the intensity, duration, sever-ity, magnitude and spatial variability of droughts (Mishraand Singh, 2010). Most relevant indices include the PalmerDrought Severity Index, PDSI (Palmer, 1965) and the Stan-dardized Precipitation Index, SPI (McKee et al., 1993, 1995),which are considered herein together with a modificationof the PDSI for Mediterranean conditions, the MedPDSI(Pereira et al., 2007; Pereira and Rosa, 2010). The SPI isa normalized index for calculating the deviation from theprecipitation normal, allowing identification and character-ization of droughts at different time scales. Shorter timescales like 3 months seem to be adequate for the identifica-tion of agricultural droughts, while longer time scales, e.g. 12months, better describe hydrological and water resourcesdroughts (Mishra and Singh, 2010; Paulo and Pereira, 2006).The PDSI, unlike the SPI, uses precipitation associated withevapotranspiration and a soil water balance is performed.It was created to characterize and evaluate meteorologicaldroughts by measuring the deviations between the observedand the expected precipitation, which are first transformedinto an anomaly moisture index and then into a drought in-dex, which is classified in terms of severity (Palmer, 1965).The MedPDSI is a modification of the original PDSI toadapt it to the Mediterranean conditions. It mainly consistsof (a) assuming a rainfed olive orchard as a drought ref-erence crop, (b) replacing the potential climatic evapotran-spiration (ET) computed with the Thornthwaite method bythe reference ET computed with the FAO-PM method (Allen
Published by Copernicus Publications on behalf of the European Geosciences Union.

1494 D. S. Martins et al.: Spatial and temporal variability of precipitation in Portugal
et al., 1998) to estimate the actual evapotranspiration (ETa)of the reference olive orchard, (c) computing ETa with thedual crop coefficient approach, thus, partitioning it into planttranspiration and soil evaporation to make ETa more sensi-tive to the available soil water, (d) performing a sequentialsoil water balance that overcomes the limitations of the orig-inal Palmer formulation, (e) replacing the climate charac-teristic used for the standardization of the Palmer moistureanomaly index z by the inverse of the standard deviation ofthe monthly moisture departures, which are precursors of thez index. The resulting soil water balance components showa better adherence to the vegetation reality than for the orig-inal PDSI, e.g., actual ET for the MedPDSI is higher duringwinter and spring and is generally lower in summer, and theMedPDSI is more sensitive to dry and wet anomalies thanthe PDSI (Pereira et al., 2007; Paulo et al., 2012; Rosa et al.,2010a).
Geostatistical and multivariate techniques are commonlyused to analyze the spatial and temporal variability of pre-cipitation, droughts and other variables of interest. Precip-itation and drought spatial variability analyses through theprincipal component analysis (PCA) have been undertakenby many authors (e.g., Bonaccorso et al., 2003; Cannarozzoet al., 2006; Raziei et al., 2008, 2009). A few of these studiesrefer to the Iberian Peninsula, not detailing Portuguese con-ditions (e.g., Rodriguez-Puebla et al., 1998; Serrano et al.,1998; Vicente-Serrano et al., 2006). Various studies wereconducted for Portugal on temporal variability of precipi-tation using spectral analysis (Antunes et al., 2006; Corte-Real et al., 1998), non-parametric trend tests (de Lima et al.,2010), or geostatistical techniques applied to precipitationextremes (Durao et al., 2009). Santos et al. (2010) used PCAand cluster analysis to study the spatial patterns of droughtswith the SPI at different time scales in mainland Portugal.Costa (2011) also focused on the same region in a spatial andtemporal analysis of droughts.
The present research aims to study the spatial variabilityof precipitation and drought over entire mainland Portugal.The selected drought indices are SPI-computed at 3- and12-month time scales, the PDSI and MedPDSI. To identifysub-regions characterized by different precipitation regimesand drought variability, the PCA with varimax rotation wasapplied to various sets of precipitation-based variables anddrought indices time series, respectively.
2 Data and methods
2.1 Data
For the present study monthly precipitation and temperaturedata from 27 meteorological stations and monthly precipi-tation records from 47 rainfall stations were used (Fig. 1a).The common time period for the analysis was 1941 to 2006(66 yr). Therefore, for the analysis of variability of precipita-
Fig. 1. (a) Distribution of meteorological stations (x) and pluvio-metric stations (
17
374
375
Fig. 1. Distribution of meteorological stations (x) and pluviometric stations (▲) 376
377
); (b) Spatial pattern of the precipitation concen-tration index.
tion and computation of SPI, monthly precipitation data from74 stations were used, while only 27 meteorological stationshaving also monthly maximum and minimum temperaturewere used for computation of PDSI and MedPDSI.
Annual precipitation datasets were investigated for ran-domness, homogeneity and absence of trends. The Kendallautocorrelation test, the Mann–Kendall trend test and the ho-mogeneity tests of Mann–Whitney for the mean and the vari-ance (Helsel and Hirsch, 1992), as described by Paulo etal. (2003) and Rosa et al. (2010b), were used for this pur-pose. In cases when the hypothesis of homogeneity fails(significance level of 5 %), the monthly precipitation serieswas corrected by the method of cumulative residuals usingthe homogeneous dataset of the nearby stations as a refer-ence series and considering a confidence level of 80 % (cf.Allen et al., 1998). Linear models using maintenance ofvariance extension techniques, which preserve the varianceand extreme order statistics of the reference site in the filledseries (Hirsch, 1982; Vogel and Stedinger, 1985), were ap-plied to estimate missing monthly precipitation or maximumand minimum temperature data. The reference sites were se-lected as those having the highest linear correlation coeffi-cient relative to the station of interest.
2.2 Methods
Two sets of variables were used to delineate precipitation pat-terns. The first includes 5 variables: the 4 mean seasonal
Nat. Hazards Earth Syst. Sci., 12, 1493–1501, 2012 www.nat-hazards-earth-syst-sci.net/12/1493/2012/

D. S. Martins et al.: Spatial and temporal variability of precipitation in Portugal 1495
Fig. 2. Spatial distribution of seasonal precipitation amounts:(a) winter, (b) spring,(c) summer;(d) autumn.
precipitation amounts and the precipitation concentration in-dex (PCI) relative to each weather station. The PCI is anintra-annual precipitation variability index defined as the ra-tio of the monthly squared precipitation to the squared an-nual precipitation (De Luıs et al., 2000). The index rangesfrom less than 10, when monthly rainfall distribution overthe year is quite uniform, to values above 20, correspond-ing to climates with substantial monthly variability in rainfalland large concentrations of the precipitation in a few months.The second set includes 9 variables, with the percentage ofseasonal precipitation in the annual total in addition to the5 variables of the first set. The approach follows that adoptedby Raziei et al. (2008). Using two sets of variables aims atchecking if appropriate results may be achieved with fewervariables. All variables were normalized prior to PCA appli-cation.
The procedures used to compute the SPI follow those pro-posed by Edwards (2000) and are described by Paulo etal. (2003). The calculation of PDSI and MedPDSI was per-
formed with local calibration of the indices and is describedby Pereira et al. (2007) and Pereira and Rosa (2010).
The PCA is a technique for forming new uncorrelatedvariables that are linear combinations of the original ones(Sharma, 1996). The principal components are computed in adecreasing order of importance; the first component explainsthe maximum possible variance of total data, and the sec-ond component explains the maximum variance not yet ex-plained, meaning that the last component is the one that leastcontributes to explain the variance of the original data. ThePCA is obtained by calculating the eigenvalues and eigenvec-tors from the correlation matrix, where the eigenvectors giveinformation about the weight that the original data have inthe new-formed components and the eigenvalues provide theamount of explained variance by each new variable. Whennormalized, the eigenvectors are called “loadings” and theyrepresent the correlation between the original data and thecorresponding principal component time series. The PCAcan be computed in several modes, including the R-modeand S-mode PCA (Richman, 1986), which differ on the typeof data used and the way that data is organized as an inputmatrix for PCA. The R-mode PCA is used here for precipi-tation regionalisation in order to obtain the interrelationshipbetween the considered variables, while the S-mode PCA isused for capturing drought variability and allows the identifi-cation of co-variability between the stations, considering thetime variability of a given drought index.
The R-mode PCA was applied to the two above-mentionedprecipitation sets separately, in order to recognize the mostinfluencing parameters responsible for climate patterns de-lineation, to be used subsequently in cluster analysis. Tocapture spatial patterns of drought variability over Portugal,the S-mode PCA was applied to 74 series of SPI-3 and SPI-12, and 27 series of PDSI and MedPDSI, separately; i.e.,we performed S-mode PCA four times, one for each in-dex. The quality of the PCAs was tested using the Kaiser-Meyer-Olkin (KMO) statistic (Sheskin, 2007), whereas thedecision on how many components to retain was made us-ing North’s rule of thumb (North et al., 1982). The varimaxrotation, which is an orthogonal method used to maximizethe variance between the weights of each principal compo-nent, was used to identify areas with independent droughtvariability (Raziei et al., 2009). The loadings correspondingto each dataset were mapped to show the spatial patterns ofdrought variability across the country; their associated PCscores were used for drought indices inter-comparison andtrend analysis.
The resultant retained PC scores corresponding to R-mode PCAs were then subjected to cluster analysis (CA) tobetter identify different precipitation sub-regions (Marzbanand Sandgathe, 2006). The Ward method, which is anagglomerative hierarchical cluster analysis method, was usedhere (Sharma, 1996). Additionally, the distribution ofthe cumulative seasonal precipitation at selected stationswithin the identified sub-regions was checked using the
www.nat-hazards-earth-syst-sci.net/12/1493/2012/ Nat. Hazards Earth Syst. Sci., 12, 1493–1501, 2012

1496 D. S. Martins et al.: Spatial and temporal variability of precipitation in Portugal
Fig. 3. Spatial distribution of the first(a) and second(b) rotated PCscores of precipitation over Portugal using 9 variables.
Kolmogorov-Smirnov test to examine the null hypothesisthat the distributions are the same (results not shown).
3 Results
3.1 Precipitation patterns
The spatial patterns of PCI are presented in Fig. 1b, whichshows a gradual variation from north to south, indicating thatthe precipitation in Northern Portugal has slight seasonality,while it shows substantial seasonality in the southern regionswhere the precipitation is very concentrated in a few monthsof the year. This is well-confirmed by the spatial patternof seasonal precipitation represented in Fig. 2, illustratingthat northern areas receive more even seasonal precipitation,whereas spring and summer are dry seasons for the southernareas.
The KMO statistics applied to the precipitation sets with9 and 5 variables are respectively 0.72 and 0.79, thus, sug-gesting that both are adequate for PCA (KMO test> 0.5).Following North’s rule of thumb and inspection of the screeplots of the eigenvalues associated with both considered sets,two principal components (PCs) were retained and then ro-tated using varimax rotation. Table 1 shows the explainedvariances of un-rotated and varimax rotated components.Considering the set of 9 precipitation variables, the first twoPCs explain 91.5 % of the total variance; the first two ro-tated components associated with these 9 variables account
Fig. 4. Varimax rotated loadings of the used drought indices: SPI-3(a ande); SPI-12 (b andf); PDSI (c andg), MedPDSI (d andh).
for 46.2 % and 45.3 % of the total variance. In the case ofthe set of 5 variables, the first two components account for98.4 % of total variance. However, the first two rotated com-ponents explained respectively 67.4 % and 31 % of the totalvariance, hence indicating that the second component is lessimportant and might not be considered. The spatial patternof the first un-rotated loading relative to the 5 variables setsshowed a dipole pattern (not shown), pointing relatively tothe same sub-regions represented by the first two leading ro-tated loading patterns of the 9 variables set. Thus, in Fig. 3only the results for the 9 variables set are shown as they bet-ter represents the precipitation sub-regions of Portugal. Thisis likely to be due to the fact that variables not included inthe 5 variables set are those illustrating the seasonal percent-age of precipitation, which are of great importance to explainthe spatial variability together with PCI (Table 2). The per-centages of spring, summer and autumn precipitation in con-junction with the PCI values are responsible for differentiat-ing Northern from Southern Portugal. Therefore, it could beconcluded that the 9 variables set is the best for representa-tion of the spatial variability of precipitation and delineationof precipitation based sub-regions.
The Kolgomorov-Smirnov test was applied to verify if thenorthern and southern sub-regions identified in Fig. 3 couldbe considered statistically different; results show p-values<0.01 when comparing Braga in north with Faro in south.For the set of 9 variables, CA was applied to the first tworotated PC scores using the Ward method. However, resultsdid not improve the classification of precipitation representedby varimax PC score patterns and therefore CA results are
Nat. Hazards Earth Syst. Sci., 12, 1493–1501, 2012 www.nat-hazards-earth-syst-sci.net/12/1493/2012/

D. S. Martins et al.: Spatial and temporal variability of precipitation in Portugal 1497
Table 1. Explained variances of the un-rotated and rotated components corresponding to sets with 9 and 5 variables.
PC9 variables 5 variables
Un-Rotated ( %) Varimax Rotated (%) Un-Rotated (%) Varimax Rotated (%)
PC-1 58.7 46.2 83.6 67.4PC-2 32.8 45.3 14.7 31.0Cumulative 91.5 91.5 98.3 98.4
Table 2. Rotated loadings associated with the PC scores illustrated in Fig. 2.
Variables Rotated loadings
9 variables set 5 variables set
PC1 PC2 PC1 PC2
Winter precipitation amount 0.996 0.037 0.972 0.214Spring precipitation amount 0.958 −0.259 0.883 0.455Summer precipitation amount 0.906−0.383 0.799 0.568Autumn precipitation amount 0.989 0.065 0.997 0.184PCI −0.484 0.780 −0.226 −0.969Winter precip. % 0.218 0.863Spring precip. % −0.038 −0.949Summer precip. % 0.264 −0.912Autumn precip. % −0.315 −0.878
not shown herein. Note that results in Fig. 3 are in agreementwith those in Fig. 2, which means that the spatial distributionof PC1 and PC2 represent well the spatial distribution of pre-cipitation throughout the country.
3.2 Drought: spatial variability and trend
Based on North’s rule of thumb and the scree plot, the firsttwo components were retained for all used drought indices.The two retained components for each drought index werevarimax rotated. Table 3 illustrates the explained variancesof un-rotated and varimax rotated components for the fourdrought indices. In all cases, the cumulative total explainedvariances of the two retained PCs are higher than 75 %; thehighest value is for the SPI-12 (83.2 %) and the lowest forthe PDSI (75.1 %). The first un-rotated PC explains much ofthe total variance for all the PCAs, ranging from 65 % for thePDSI to 75 % in case of SPI-12. The explained variance ofthe first varimax rotated PC accounts for 39.6 % and 46 % forPDSI and SPI-12, respectively.
Figure 4 depicts the spatial distribution of the rotated load-ings over Portugal for the four drought indices, suggestingthat the country is composed of two distinct sub-regionscharacterized by different drought variability. The load-ing patterns for all drought indices are identical, delineat-ing North-Western and Southern Portugal as two distinctivesub-regions with different drought variability and character-
istics. The first component has the highest positive loadingover the northern part of the country, including the regionswith higher annual rainfall and lower evapotranspiration. Asfor the first PC loading, the loading patterns corresponding tothe second component are very similar for all the drought in-dices, indicating Southern Portugal as a distinct sub-region,considering drought variability. Apparently, the first com-ponent coincides relatively well with the humid areas in thenorth and the second component refers to the dry sub-humidand semi-arid areas in Southern Portugal.
Achieving the same sub-regions, Northern and SouthernPortugal, both precipitation and drought variability reflect therole played by latitude in controlling precipitation and conse-quently drought variability over the country. These featuresagree with the country’s climate classification according toKoppen (IM, 2011), which refers to a temperate climate withA dry and mild summer (Csb) in the littoral and the northernareas, a temperate climate with a dry and hot summer (Csa)in the south and the interior, and a steppe climate (Bsk) in avery small area of southeastern. The time behaviour of thedrought indices MedPDSI and SPI-12 for a northern loca-tion, Braga, and a southern one, Faro, makes evident that thedry and wet occurrences and respective intensity are differ-ent between the identified sub-regions, while in each repre-sentative station both indices are in close agreement (Fig. 5).The sub-regions identified here are in close agreement withthose obtained by Santos et al. (2010), applying PCA to SPI
www.nat-hazards-earth-syst-sci.net/12/1493/2012/ Nat. Hazards Earth Syst. Sci., 12, 1493–1501, 2012
1498 D. S. Martins et al.: Spatial and temporal variability of precipitation in Portugal
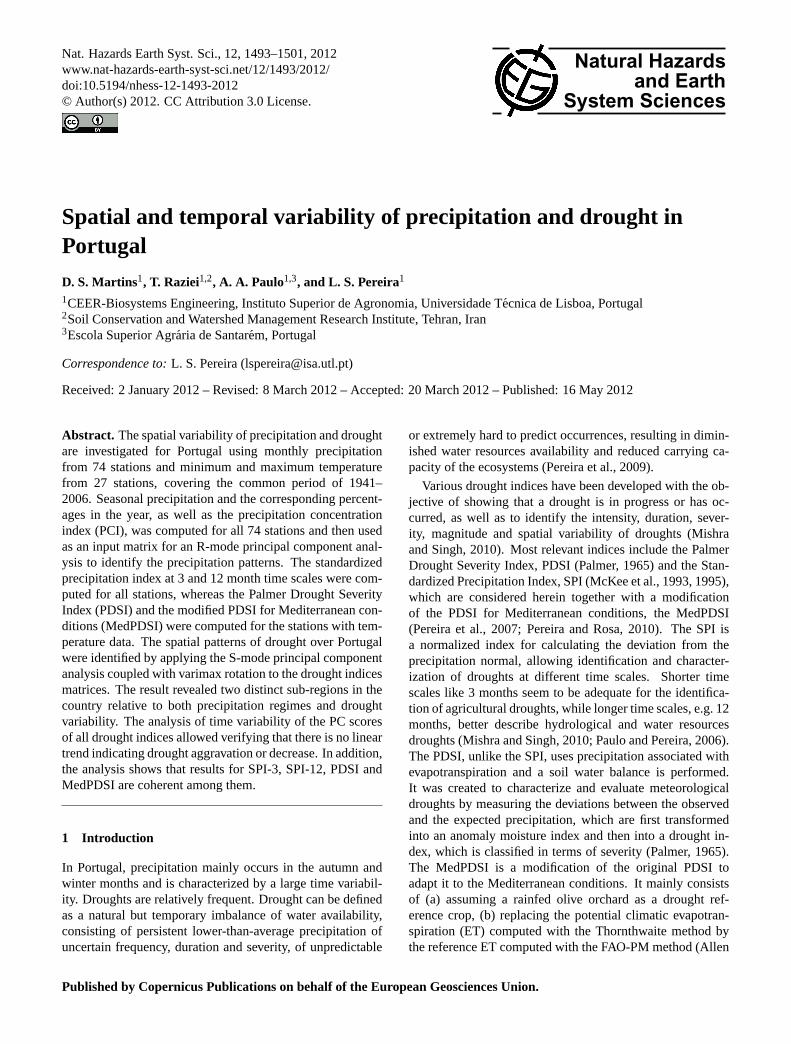
Table 3. Explained variance (%) by the loadings with and without rotation for the 4 drought indices.
PC SPI-3 SPI-12Un-Rotated Varimax Rotated Un-Rotated Varimax Rotated
PC-1 72.3 43.1 75.0 46.0PC-2 8.4 37.6 8.2 37.3
Cumulative 80.7 80.7 83.2 83.2
PDSI MedPDSIUn-Rotated Varimax Rotated Un-Rotated Varimax Rotated
PC-1 65.4 39.6 65.9 40.7PC-2 9.7 35.5 9.8 35.0
Cumulative 75.1 75.1 75.7 75.7
Fig. 5. Time behaviour of MedPDSI (- - -) and SPI-12 (
21
389
Fig. 5 Time behaviour of MedPDSI (- - -) and SPI-12 (___
) for two stations a) Braga in the northern region and 390
b) Faro in the southern region. 391
) for two stations(a) Braga in the northern region and(b) Faro in the southernregion.
at different time scales. It is worth noticing that present re-sults indicate a good agreement between the four indices.
Table 4 shows the correlation coefficients between the PCscores of all drought indices used. The lowest correlationis between SPI-3 and SPI-12, which is due to different timescales; the highest correlation is observed between the PDSIand MedPDSI for both PC scores, which relates to the factthat both indices are computed with the same variables, andapparently because of inherent long-term memory and sea-sonal time variability (Rosa et al., 2010a). The agreements
between the PC scores of SPI-3 and SPI-12 with those forPDSI and MedPDSI are also reasonably high for both PCscores, though their time scales are different. Thus, the cor-relations between the second PC score of SPI-12 with thosefor PDSI and MedPDSI are much higher than that of SPI-3with those of PDSI and MedPDSI.
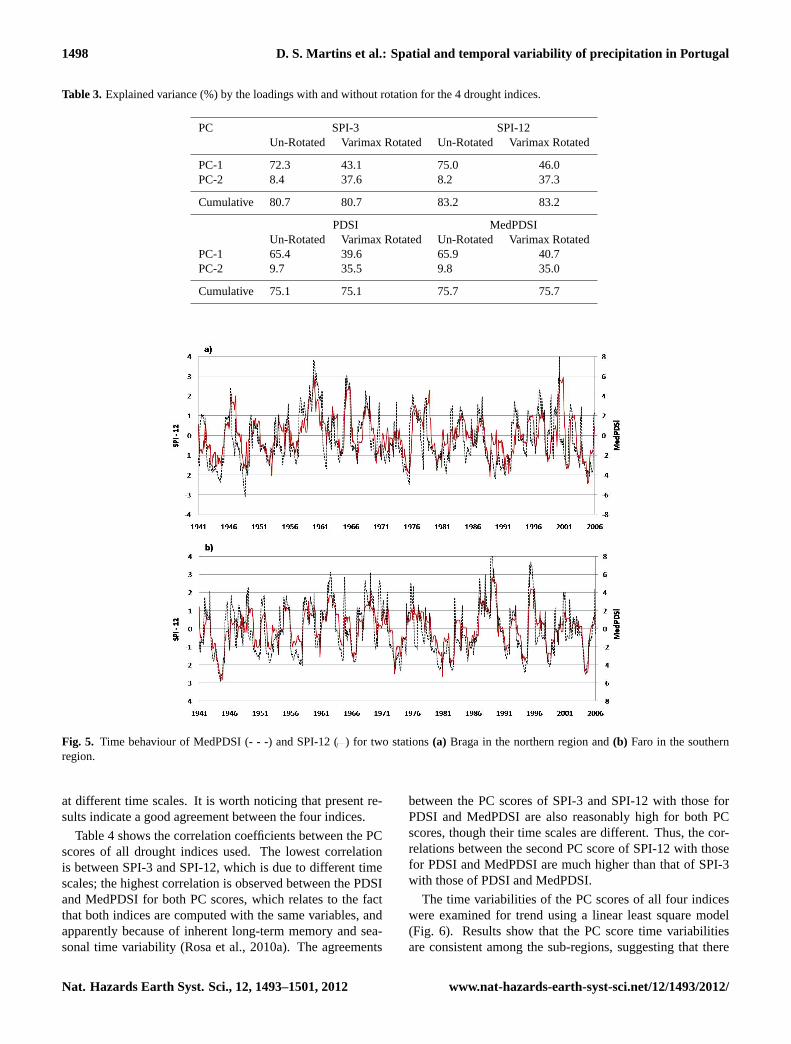
The time variabilities of the PC scores of all four indiceswere examined for trend using a linear least square model(Fig. 6). Results show that the PC score time variabilitiesare consistent among the sub-regions, suggesting that there
Nat. Hazards Earth Syst. Sci., 12, 1493–1501, 2012 www.nat-hazards-earth-syst-sci.net/12/1493/2012/
D. S. Martins et al.: Spatial and temporal variability of precipitation in Portugal 1499
Fig. 6. Time variability of the PC scores of the drought indices and the respective linear trend (–).
Table 4. Correlations between the PC scores of all the drought in-dices.
PC1 SPI-3 SPI-12 PDSI MedPDSI
SPI 3 1 0.24 0.59 0.56SPI 12 1 0.50 0.50PDSI 1 0.94MedPDSI 1
PC 2 SPI-3 SPI-12 PDSI MedPDSI
SPI 3 1 0.25 0.44 0.41SPI 12 1 0.66 0.68PDSI 1 0.87MedPDSI 1
is no evidence for a long-term trend for drought increase ordecrease in both identified sub-regions and for the 4 indices.This absence of trend is justified by the quite small lineartrends in precipitation and temperature identified by Paulo etal. (2012). These results are also in agreement with thosefound by Moreira et al. (2006) and Sousa et al. (2011) forPortugal. The first authors used log-linear models appliedto contingency tables relative to SPI drought class transitionsand found no trend in drought occurrence and severity for thelast 60 yr. The second used a modified version of the Mann-Kendal test applied to the self-calibrated PDSI for a period of100 yr and found no trend for increasing drought occurrence
and severity in Portugal. It is important to note that resultsfrom all considered indices are compatible.
4 Conclusions
The spatial variability of the precipitation was studied usingR-mode PCA. Two sub-regions with different precipitationpatterns were identified, one representing the North-Westernand the other the Southern Portugal. The cluster analysis didnot induce any improvement in this study, since the mapscomputed with the PC scores allowed a more accurate un-derstanding of the precipitation than with the CA.
The drought spatial variability was assessed by applyingS-mode PCA to different drought indices (SPI-3, SPI-12,PDSI and MedPDSI); for all four cases two distinctive sub-regions were identified. The first one covers the north and thesecond one the southern part of Portugal. These results arein agreement with the identified precipitation variability, andare also consistent with recent studies on drought variabil-ity. PC1 explains the drought variability in the northern sub-region, while PC2 mainly refers to the southern sub-region.This applies to all drought indices considered. Results of alldrought indices are similar in the identification of the sub-regions and regarding the scores, which are highly correlated,except for the SPI-3 month because of its smaller time scale.Checking the stability of the identified sub-regions using fineresolution, gridded datasets should be a topic for future re-search.
www.nat-hazards-earth-syst-sci.net/12/1493/2012/ Nat. Hazards Earth Syst. Sci., 12, 1493–1501, 2012

1500 D. S. Martins et al.: Spatial and temporal variability of precipitation in Portugal
A trend analysis using a linear least squares model wasperformed using the PC scores of the four drought indicesand, again, results are similar among them, not showingevidence of a trend for either an increase or decrease ofdrought occurrence or severity in both sub-regions. Theseresults agree with those of previous studies on the temporalanalysis of droughts in Portugal. Further analysis will be de-veloped for various climate change scenarios and models tobetter examine impacts of climate change on drought tenden-cies over the target area.
Acknowledgements.Data relative to weather stations were pro-vided by the Institute of Meteorology and those of the rainfallstations were obtained from the SNIRH, Lisbon.
Edited by: C. AndradeReviewed by: two anonymous referees
References
Allen, R. G., Pereira, L. S., Raes, D., Smith, M.: Crop Evapotran-spiration Guidelines for Computing Crop Water Requirements,FAO Irrig. Drain, 56, FAO, Rome, 300 pp., 1998.
Antunes, S., Oliveira, P., and Rocha, A.: Detecting spatio-temporalprecipitation variability in Portugal using multichannel singularspectral analysis, Int. J. Climatol., 26, 2199–2212, 2006.
Bonaccorso, B., Bordi, I., Cancelliere, A., Rossi, G., and Sutera, A.:Spatial variability of drought: An analysis of the SPI in Sicily,Water Resour. Manage., 17, 273–296, 2003.
Cannarozzo, M., Noto, L. V., and Viola, F.: Spatial distributionof rainfall trends in Sicily (1921–2000), Phys. Chem. Earth, 31,1201–1211, 2006.
Corte-Real, J., Qian, B., and Xu, H.: Regional climate change inPortugal: Precipitation variability associated with large-scale at-mospheric circulation, Int. J. Climatol., 18, 619–635, 1998.
Costa, A. C.: Local patterns and trends of the Standard PrecipitationIndex in southern Portugal (1940–1999), Adv. Geosci., 30, 11–16, doi:10.5194/adgeo-30-11-2011, 2011.
De Luıs, M., Reventos, J., Gonzalez-Hidalgo, J. C., Sanchez, I. R.and Cortina, J.: Spatial analysis of rainfall trends in the region ofValencia (East Spain), Int. J. Climatol., 20, 1451–1469, 2000.
de Lima, M. I. P., Carvalho, S. C. P., de Lima, J. L. M. P., andCoelho, M. F. E. S.: Trends in precipitation: analysis of longannual and monthly time series from mainland Portugal, Adv.Geosci., 25, 155–160, doi:10.5194/adgeo-25-155-2010, 2010.
Durao, R., Pereira, M. J., Costa, A. C., Corte-Real, J. M., andSoares, A.: Indices of precipitation extremes in Southern Por-tugal a geostatistical approach, Nat. Hazards Earth Syst. Sci., 9,241–250, doi:10.5194/nhess-9-241-2009, 2009.
Edwards, D.: SPI defined, in:http://ulysses.atmos.colostate.edu/SPI.html, Colorado, 2000.
Helsel, D. R. and Hirsch, R. M.: Statistical Methods in Water Re-sources, Elsevier, Amsterdam, 522 pp., 1992.
Hirsch, R. M.: A comparison of four streamflow record extensiontechniques. Water Resour. Res., 18, 1081–1088, 1982.
IM: Classificacao climatica de Koppen, http://www.meteo.pt/pt/oclima/clima.normais/December, 2011.
Marzban, C. and Sandgathe, S.: Cluster Analysis for verification ofprecipitation fields, Weather Forecast., 21, 824–838, 2005.
McKee, T. B., Doesken, N. J. and Kleist, J.: The relationship ofdrought frequency and duration to time scales, in: 8th Confer-ence on Applied Climatology, Boston, Am. Meteor. Soc., 179–184, 1993.
McKee, T. B., Doesken, N. J., and Kleist, J.:Drought monitoringwith multiple time scales, in: 9th Conference on Applied Clima-tology, Boston, Am. Meteor. Soc., 233–236, 1995.
Mishra, A. K. and Singh, V. P.: A review of drought concepts, J.Hydrol., 391, 202–216, 2010.
Moreira, E. E., Paulo, A. A., Pereira, L. S., and Mexia, J. T.: Anal-ysis of SPI drought class transitions using loglinear models, J.Hydrol., 331, 349–359, 2006.
North, G. R., Bell, T. L., and Cahalan, R. F.: Sampling errors in theestimation of empirical orthogonal functions, Mon. Wea. Rev.,110, 699–706, 1982.
Palmer, W. C.: Meteorological Drought, Research Paper 45, U.S.Department of Commerce Weather Bureau, Washington, D.C.,1965.
Paulo, A. A. and Pereira, L. S.: Drought concepts and characteri-zation: comparing drought indices applied at local and regionalscales, Water Int., 31, 37–49, 2006.
Paulo, A. A., Pereira, L. S., and Matias, P. G.: Analysis of localand regional droughts in southern Portugal using the theory ofruns and the Standardized Precipitation Index, edited by: Rossi,G., Cancelliere, A., Pereira, L. S., Oweis, T., Shatanawi, M.,and Zairi, A., Tools for Drought Mitigation in Mediterranean Re-gions, Dordrecht: Kluwer, 55–78, 2003.
Paulo, A. A., Rosa, R., and Pereira, L. S.: Climate trends anddrought indices based on precipitation and evapotranspiration inPortugal, Nat. Hazards Earth Syst. Sci., in press, 2012.
Pereira, L. S. and Rosa, R. D.: O MedPDSI, uma modificacao doındice de Palmer para clima mediterraaneo. 1. Desenvolvimento.In: Pereira, L. S., Mexia, J. T., Pires, C. A. L. (eds.), Gestaodo Risco em Secas. Metodos, Tecnologias e Desafios, EdicoesColibri, CEER, 15–33, 2010.
Pereira, L. S., Rosa, R. D., and Paulo, A. A.: Testing a modificationof the Palmer drought severity index for Mediterranean environ-ments, in: Methods and Tools for Drought Analysis and Manage-ment, edited by: Rossi, G., Vega, T., Bonaccorso, B., Springer,Dordrecht, 149–167, 2007.
Pereira, L. S., Cordery, I., and Iacovides, I.: Coping with Wa-ter Scarcity. Addressing the Challenges. Springer, Dordrecht,382 pp., 2009.
Raziei, T., Bordi, I., and Pereira, L. S.: A precipitation-based re-gionalization for Western Iran and regional drought variability,Hydrol. Earth Syst. Sci., 12, 1309–1321, doi:10.5194/hess-12-1309-2008, 2008.
Raziei, T., Saghafian, B., Paulo, A. A., Pereira, L. S., Bordi, I.:Spatial patterns and temporal variability of drought in WesternIran, Water Res. Manage., 29, 439–455, 2009.
Richman, M. B.: Rotation of principal components, J. Climatol., 6,293–335, 1986.
Rodriguez-Puebla, C., Encinas, A. H., Nieto, S., and Garmendia, J.:Spatial and temporal patterns of annual precipitation variabilityover the Iberian Peninsula, Int. J. Climatol., 18, 299–316, 1998.
Rosa, R. D., Pereira, L. S. and Paulo, A. A.: O MedPDSI, umamodificacao do ındice de Palmer para clima mediterranico. 2.
Nat. Hazards Earth Syst. Sci., 12, 1493–1501, 2012 www.nat-hazards-earth-syst-sci.net/12/1493/2012/

D. S. Martins et al.: Spatial and temporal variability of precipitation in Portugal 1501
Aplicacao no paıs, in: Metodos, Tecnologias e Desafios, editedby: Pereira, L. S., Mexia, J. T., and Pires, C. A. L., Gestao doRisco em Secas, Edicoes Colibri, CEER, 35-58, 2010a.
Rosa, R. D., Paulo, A. A., Matias, P. G., Espırito Santo, M. F.,and Pires, V. C.: Tratamento da qualidade das series de dadosclimaticos quanto a homogeneidade, aleatoriedade e tendencia ecompletagem de series de dados, in: Gestao do Risco em Se-cas, edited by: Pereira, L. S., Mexia, J. T., and Pires, C. A. L.,Metodos, Tecnologias e Desafios, Edicoes Colibri, CEER, 119–139, 2010b.
Santos, J. F., Pulido-Calvo, I., and Portela, M. M.: Spatial and tem-poral variability of droughts in Portugal, Water Resour. Res., 46,W03503, doi:10.1029/2009WR008071, 2010.
Serrano, A., Garcia, J. A., Mateos, V. L., Cancillo, M. L., and Gar-rido, J.: Monthly modes of variation of precipitation over theIberian Peninsula, J. Climate, 12, 2894–2918, 1998.
Sharma, S.: Applied Multivariate Techniques, John Wiley & Sons,512 pp., 1996.
Sheskin, D.: Handbook of parametric and nonparametric statisticalprocedures, Chapman & Hall/CRC, 1736 pp., 2007.
Sousa, P. M., Trigo, R. M., Aizpurua, P., Nieto, R., Gimeno, L.,and Garcia-Herrera, R.: Trends and extremes of drought indicesthroughout the 20th century in the Mediterranean, Nat. Haz-ards Earth Syst. Sci., 11, 33–51, doi:10.5194/nhess-11-33-2011,2011.
Vicente-Serrano, S. M.: Differences in Spatial Patterns of Droughton Different Time Scales: An Analysis of the Iberian Peninsula,Water Res. Manage., 20, 37–60, 2006.
Vogel, R. M. and Stedinger, J. R.: Minimum variance streamflowrecord augmentation procedures, Water Resour. Res., 21, 715–723, 1985.
www.nat-hazards-earth-syst-sci.net/12/1493/2012/ Nat. Hazards Earth Syst. Sci., 12, 1493–1501, 2012