Sovereign credit risk, liquidity, and the ecb intervention: deus ex machina? - Loriana Pelizzon,...
38
SOVEREIGN CREDIT RISK, LIQUIDITY, AND THE ECB INTERVENTION: DEUS EX MACHINA? SYstemic Risk TOmography: Signals, Measurements, Transmission Channels, and Policy Interventions Loriana Pelizzon, Goethe University Marti Subrahmanyam, NYU Stern Davide Tomio, Copenhagen Business School Jun Uno, Waseda University
-
Upload
syrto-project -
Category
Economy & Finance
-
view
60 -
download
3
Transcript of Sovereign credit risk, liquidity, and the ecb intervention: deus ex machina? - Loriana Pelizzon,...
SOVEREIGN CREDIT RISK, LIQUIDITY, AND THE ECB INTERVENTION: DEUS EX MACHINA?
SYstemic Risk TOmography:
Signals, Measurements, Transmission Channels, and Policy Interventions
Loriana Pelizzon, Goethe University Marti Subrahmanyam, NYU Stern Davide Tomio, Copenhagen Business School Jun Uno, Waseda University
THE MOTIVATION
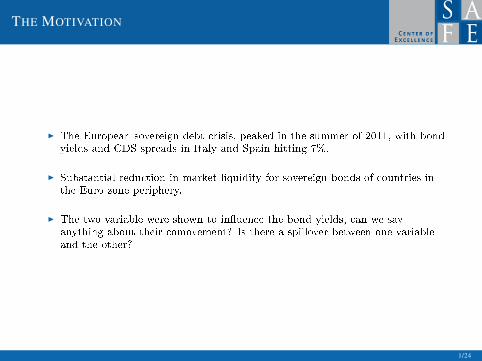
I The European sovereign debt crisis, peaked in the summer of 2011, with bondyields and CDS spreads in Italy and Spain hitting 7%.
I Substantial reduction in market liquidity for sovereign bonds of countries inthe Euro-zone periphery.
I The two variable were shown to in�uence the bond yields, can we sayanything about their comovement? Is there a spillover between one variableand the other?
1/24
ITALIAN AND GERMAN 10-YEAR BOND YIELD AND SPREAD
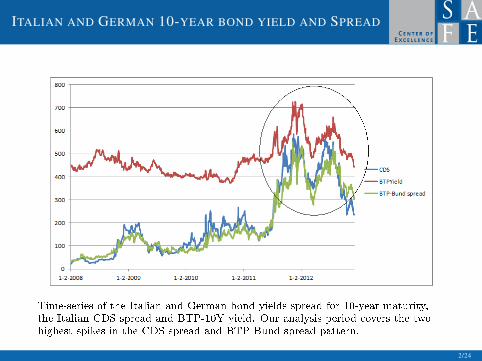
Time-series of the Italian and German bond yields spread for 10-year maturity,the Italian CDS spread and BTP-10Y yield. Our analysis period covers the twohighest spikes in the CDS spread and BTP-Bund spread pattern.
2/24
EVOLUTION OF THE BID-ASK AND CDS SPREAD
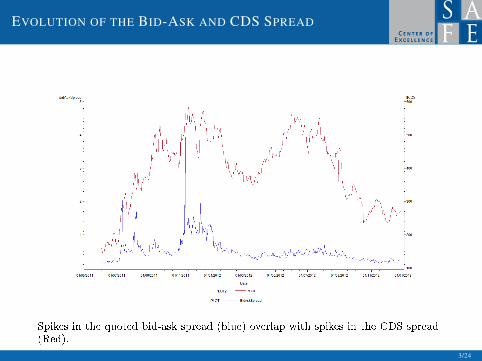
Spikes in the quoted bid-ask spread (blue) overlap with spikes in the CDS spread(Red).
3/24

EVOLUTION OF THE BID-ASK AND CDS SPREAD
Spikes in the quoted bid-ask spread (blue) overlap with spikes in the CDS spread(Red).
3/24
THE CONTRIBUTION
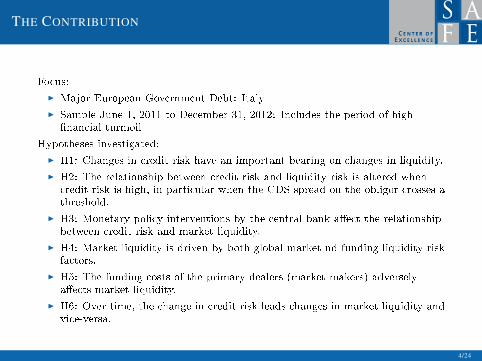
Focus:
I Major European Government Debt: Italy
I Sample June 1, 2011 to December 31, 2012: Includes the period of high�nancial turmoil
Hypotheses investigated:
I H1: Changes in credit risk have an important bearing on changes in liquidity.
I H2: The relationship between credit risk and liquidity risk is altered whencredit risk is high, in particular when the CDS spread on the obligor crosses athreshold.
I H3: Monetary policy interventions by the central bank a�ect the relationshipbetween credit risk and market liquidity.
I H4: Market liquidity is driven by both global market nd funding liquidity riskfactors.
I H5: The funding costs of the primary dealers (market makers) adverselya�ects market liquidity.
I H6: Over time, the change in credit risk leads changes in market liquidity andvice-versa.
4/24
THE CONTRIBUTION
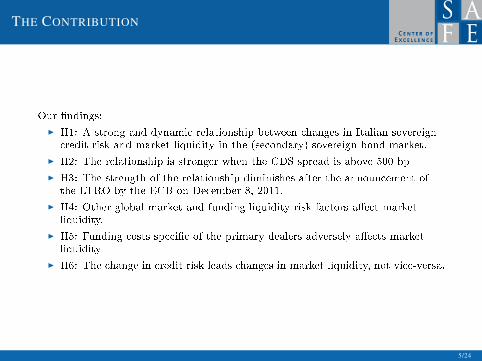
Our �ndings:
I H1: A strong and dynamic relationship between changes in Italian sovereigncredit risk and market liquidity in the (secondary) sovereign bond market.
I H2: The relationship is stronger when the CDS spread is above 500 bp
I H3: The strength of the relationship diminishes after the announcement ofthe LTRO by the ECB on December 8, 2011.
I H4: Other global market and funding liquidity risk factors a�ect marketliquidity.
I H5: Funding costs speci�c of the primary dealers adversely a�ects marketliquidity
I H6: The change in credit risk leads changes in market liquidity, not vice-versa.
5/24

PREVIOUS LITERATURE: OVERVIEW
CONTRIBUTION
We investigate the e�ect of credit risk on the market liquidity of governmentbonds.
I Theoretical Background: Inventory models, Amihud and Mendelson (1980),Ho and Stoll (1980); Funding liquidity: Brunnermeier and Pedersen (2009).
I Papers on the market liquidity of the US Treasury bond market: Fleming,Remolona '99, Fleming '03, Goyenko, Subrahmanyam, and Ukhov '11
I Paper on the liquidity of the corporate bond market: Friewald, Jankowitsch,Subrahmanyam '12, Dick-Nielsen, Feldhuetter, and Lando '12
I Papers on Euro-zone sovereign bonds: Beber, Brandt, Kavajecz '08, Cheung,de Jong, Rindi '05
6/24

THE MARKET STRUCTURE
MTS, Mercato dei Titoli di Stato, is an Electronic, Inter-Dealer market.
I In 2000, MTS executed 65% Volume of secondary market for IT-debt
I In 2003, MTS executed 74% Volume of secondary market for EU-debt
I In 2005, the largest market for EU government bonds (with public dailyturnover 25Be).
The MTS is a system of markets.
I The European Market: European Bond Market (EBM).
I Domestic Markets: Several, for larger countries.
I Dealer to Retail client. Not covered.
There are two kinds of participants in the market:
I Primary Dealers: Market-makers
I Dealers: Price takers
7/24
THE DATA: A UNIQUE DATASET IN A UNIQUE PERIOD
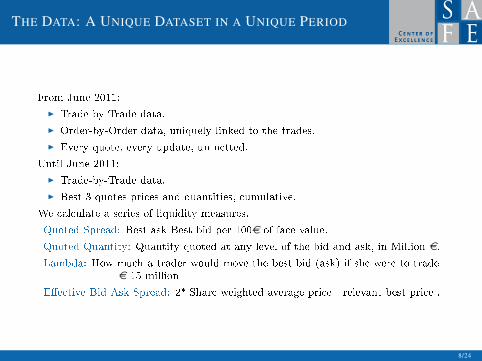
From June 2011:
I Trade-by-Trade data.
I Order-by-Order data, uniquely linked to the trades.
I Every quote, every update, un-netted.
Until June 2011:
I Trade-by-Trade data.
I Best 3 quotes prices and quantities, cumulative.
We calculate a series of liquidity measures.
Quoted Spread: Best ask-Best bid per 100e of face value.
Quoted Quantity: Quantity quoted at any level of the bid and ask, in Million e.
Lambda: How much a trader would move the best bid (ask) if she were to tradee 15 million
E�ective Bid-Ask Spread: 2*|Share-weighted average price - relevant best price|.
8/24
THE DATABONDS COMPOSITION AND MARKET VOLUME
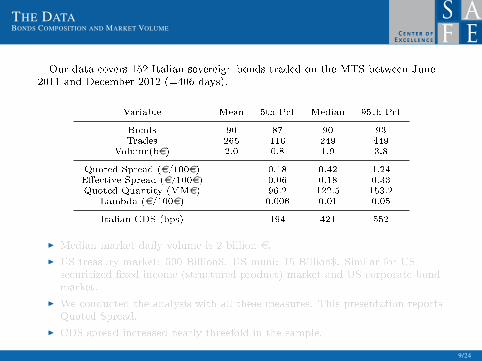
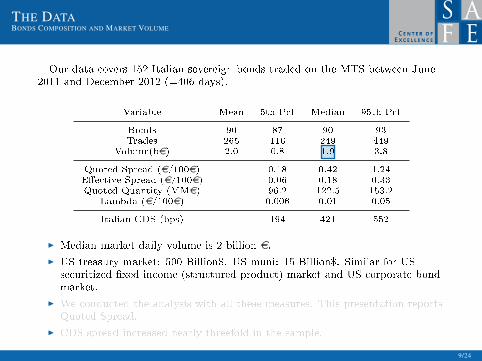
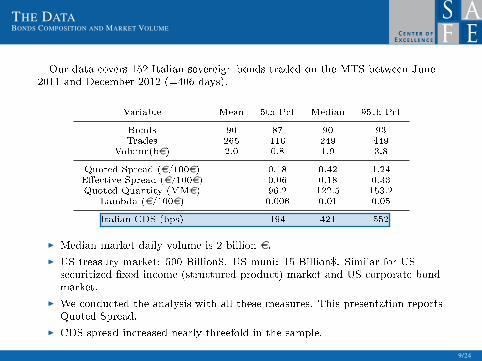
Our data covers 152 Italian sovereign bonds traded on the MTS between June2011 and December 2012 (=406 days).
Variable Mean 5th Pct Median 95th Pct
Bonds 90 87 90 93Trades 265 116 249 449
Volume(be) 2.0 0.8 1.9 3.8
Quoted Spread (e/100e) 0.18 0.42 1.24E�ective Spread (e/100e) 0.06 0.18 0.33Quoted Quantity (MMe) 96.2 122.5 153.2
Lambda (e/100e) 0.006 0.01 0.05
Italian CDS (bps) 194 421 552
I Median market daily volume is 2 billion e.
I US treasury market: 500 Billion$. US muni: 15 Billion$. Similar for USsecuritized �xed income (structured product) market and US corporate bondmarket.
I We conducted the analysis with all these measures. This presentation reportsQuoted Spread.
I CDS spread increased nearly threefold in the sample.
9/24
THE DATABONDS COMPOSITION AND MARKET VOLUME
Our data covers 152 Italian sovereign bonds traded on the MTS between June2011 and December 2012 (=406 days).
Variable Mean 5th Pct Median 95th Pct
Bonds 90 87 90 93Trades 265 116 249 449
Volume(be) 2.0 0.8 1.9 3.8
Quoted Spread (e/100e) 0.18 0.42 1.24E�ective Spread (e/100e) 0.06 0.18 0.33Quoted Quantity (MMe) 96.2 122.5 153.2
Lambda (e/100e) 0.006 0.01 0.05
Italian CDS (bps) 194 421 552
I Median market daily volume is 2 billion e.
I US treasury market: 500 Billion$. US muni: 15 Billion$. Similar for USsecuritized �xed income (structured product) market and US corporate bondmarket.
I We conducted the analysis with all these measures. This presentation reportsQuoted Spread.
I CDS spread increased nearly threefold in the sample.
9/24
H1: CHANGES IN CREDIT RISK AFFECT CHANGESIN LIQUIDITY
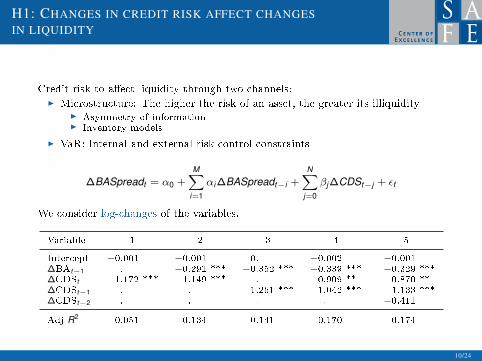
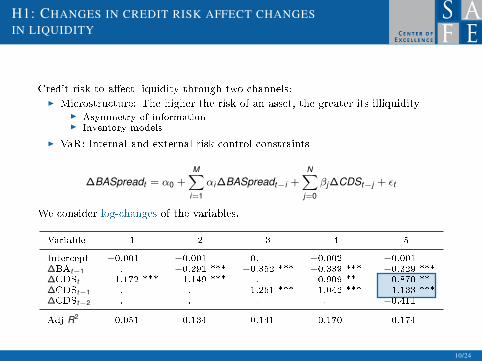
Credit risk to a�ect liquidity through two channels:I Microstructure: The higher the risk of an asset, the greater its illiquidity
I Asymmetry of informationI Inventory models
I VaR: Internal and external risk control constraints
∆BASpreadt = α0 +M∑
i=1
αi ∆BASpreadt−i +N∑
j=0
βj ∆CDSt−j + εt
We consider log-changes of the variables.
Variable 1 2 3 4 5
Intercept −0.001 −0.001 0. −0.002 −0.001∆BAt−1 . −0.291 *** −0.352 *** −0.339 *** −0.329 ***∆CDSt 1.172 *** 1.149 *** . 0.909 ** 0.870 **∆CDSt−1 . . 1.261 *** 1.042 *** 1.133 ***∆CDSt−2 . . . . −0.411
Adj R2 0.051 0.134 0.141 0.170 0.174
10/24
H1: CHANGES IN CREDIT RISK AFFECT CHANGESIN LIQUIDITY
Credit risk to a�ect liquidity through two channels:I Microstructure: The higher the risk of an asset, the greater its illiquidity
I Asymmetry of informationI Inventory models
I VaR: Internal and external risk control constraints
∆BASpreadt = α0 +M∑
i=1
αi ∆BASpreadt−i +N∑
j=0
βj ∆CDSt−j + εt
We consider log-changes of the variables.
Variable 1 2 3 4 5
Intercept −0.001 −0.001 0. −0.002 −0.001∆BAt−1 . −0.291 *** −0.352 *** −0.339 *** −0.329 ***∆CDSt 1.172 *** 1.149 *** . 0.909 ** 0.870 **∆CDSt−1 . . 1.261 *** 1.042 *** 1.133 ***∆CDSt−2 . . . . −0.411
Adj R2 0.051 0.134 0.141 0.170 0.174
10/24
H2: THE RELATIONSHIP CHANGES WHENCREDIT RISK IS HIGH
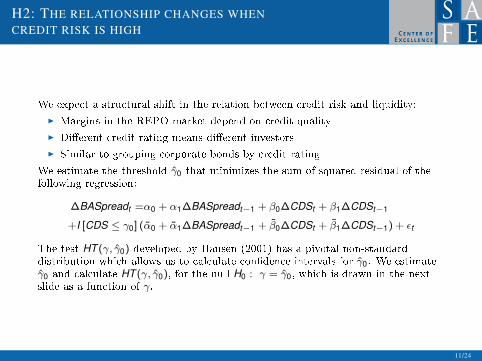
We expect a structural shift in the relation between credit risk and liquidity:
I Margins in the REPO market depend on credit quality
I Di�erent credit rating means di�erent investors
I Similar to grouping corporate bonds by credit rating
We estimate the threshold γ̂0 that minimizes the sum of squared residual of thefollowing regression:
∆BASpreadt =α0 + α1∆BASpreadt−1 + β0∆CDSt + β1∆CDSt−1
+I [CDS ≤ γ0] (α̃0 + α̃1∆BASpreadt−1 + β̃0∆CDSt + β̃1∆CDSt−1) + εt
The test HT (γ, γ̂0) developed by Hansen (2001) has a pivotal non-standarddistribution which allows us to calculate con�dence intervals for γ̂0. We estimateγ̂0 and calculate HT (γ, γ̂0), for the null H0 : γ = γ̂0, which is drawn in the nextslide as a function of γ.
11/24

H2: THE RELATIONSHIP CHANGES WHENCREDIT RISK IS HIGH
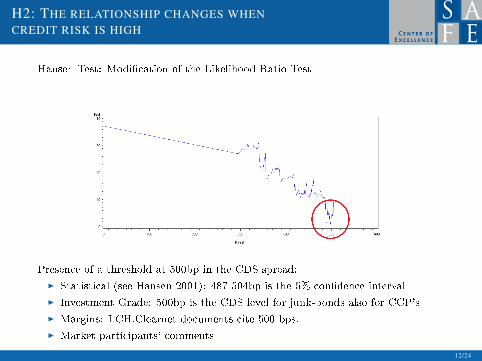
Hansen Test: Modi�cation of the Likelihood Ratio Test
Presence of a threshold at 500bp in the CDS spread:
I Statistical (see Hansen 2001): 487-504bp is the 5% con�dence interval
I Investment Grade: 500bp is the CDS level for junk-bonds also for CCP's
I Margins: LCH.Clearnet documents cite 500 bps.
I Market participants' comments
12/24
H2: THE RELATIONSHIP CHANGES WHENCREDIT RISK IS HIGH
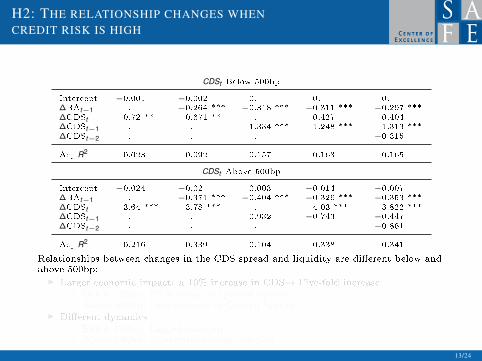
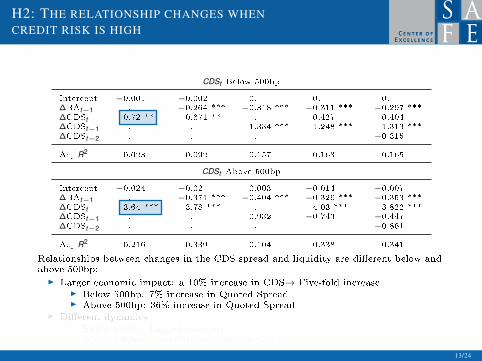
CDSt Below 500bp
Intercept −0.001 −0.002 0. 0. 0.∆BAt−1 . −0.264 *** −0.318 *** −0.311 *** −0.297 ***
∆CDSt 0.72 ** 0.671 ** . 0.427 0.404∆CDSt−1 . . 1.334 *** 1.248 *** 1.313 ***
∆CDSt−2 . . . . −0.315
Adj R2 0.023 0.092 0.157 0.163 0.165
CDSt Above 500bp
Intercept −0.024 −0.02 0.003 −0.014 −0.007∆BAt−1 . −0.371 *** −0.404 *** −0.326 *** −0.353 ***
∆CDSt 3.64 *** 3.78 *** . 4.03 *** 3.822 ***∆CDSt−1 . . 0.932 −0.743 −0.447∆CDSt−2 . . . . −0.861
Adj R2 0.216 0.339 0.104 0.338 0.341
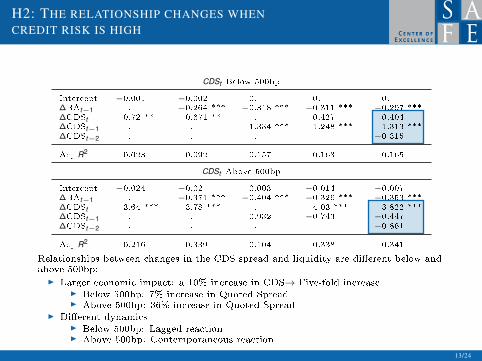
Relationships between changes in the CDS spread and liquidity are di�erent below andabove 500bp:
I Larger economic impact: a 10% increase in CDS→ Five-fold increaseI Below 500bp: 7% increase in Quoted SpreadI Above 500bp: 36% increase in Quoted Spread
I Di�erent dynamicsI Below 500bp: Lagged reactionI Above 500bp: Contemporaneous reaction
13/24
H2: THE RELATIONSHIP CHANGES WHENCREDIT RISK IS HIGH
CDSt Below 500bp
Intercept −0.001 −0.002 0. 0. 0.∆BAt−1 . −0.264 *** −0.318 *** −0.311 *** −0.297 ***
∆CDSt 0.72 ** 0.671 ** . 0.427 0.404∆CDSt−1 . . 1.334 *** 1.248 *** 1.313 ***
∆CDSt−2 . . . . −0.315
Adj R2 0.023 0.092 0.157 0.163 0.165
CDSt Above 500bp
Intercept −0.024 −0.02 0.003 −0.014 −0.007∆BAt−1 . −0.371 *** −0.404 *** −0.326 *** −0.353 ***
∆CDSt 3.64 *** 3.78 *** . 4.03 *** 3.822 ***∆CDSt−1 . . 0.932 −0.743 −0.447∆CDSt−2 . . . . −0.861
Adj R2 0.216 0.339 0.104 0.338 0.341
Relationships between changes in the CDS spread and liquidity are di�erent below andabove 500bp:
I Larger economic impact: a 10% increase in CDS→ Five-fold increaseI Below 500bp: 7% increase in Quoted SpreadI Above 500bp: 36% increase in Quoted Spread
I Di�erent dynamicsI Below 500bp: Lagged reactionI Above 500bp: Contemporaneous reaction
13/24
H3: CENTRAL BANK INTERVENTIONS AFFECT THECREDIT RISK - MARKET LIQUIDITY RELATIONSHIP
Euro-zone �nancial regulators took actions which we expect to a�ect thecredit-liquidity relationship
I EU bail-outs.
I ECB Monetary interventions: SMP, LTRO, OMT.
I Draghi's �The ECB is ready to do whatever it takes to preserve the Euro and,believe me, it will be enough.�
The ECB can a�ect market liquidity through 3 channels:
I Purchase of bonds on the market
I Provide liquidity to the banks
I Moral Suasion
14/24
H3: CENTRAL BANK INTERVENTIONS AFFECT THECREDIT RISK - MARKET LIQUIDITY RELATIONSHIP
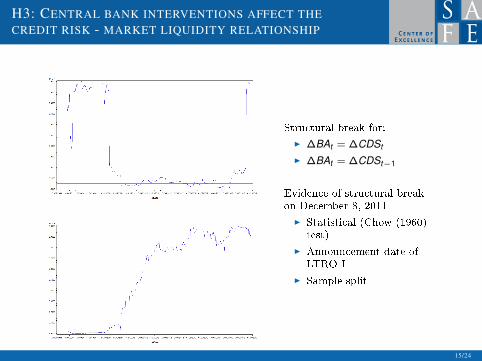
Structural break for:
I ∆BAt = ∆CDSt
I ∆BAt = ∆CDSt−1
Evidence of structural breakon December 8, 2011
I Statistical (Chow (1960)test)
I Announcement date ofLTRO I
I Sample split
15/24
H3: CENTRAL BANK INTERVENTIONS AFFECT THECREDIT RISK - MARKET LIQUIDITY RELATIONSHIP
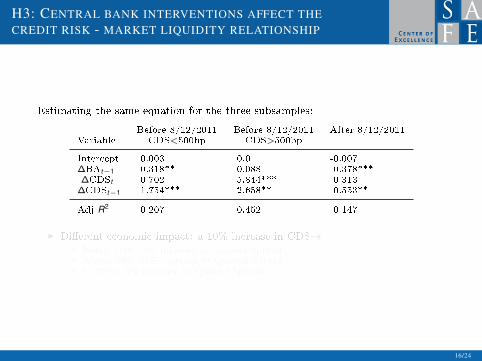
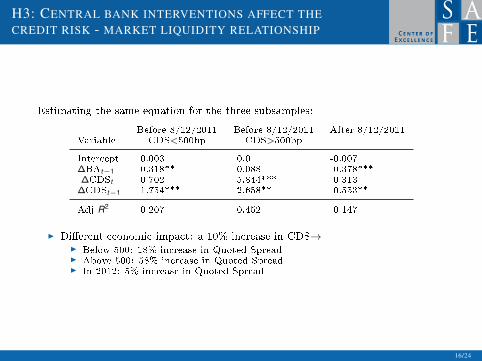
Estimating the same equation for the three subsamples:
Before 8/12/2011 Before 8/12/2011 After 8/12/2011Variable CDS<500bp CDS>500bp
Intercept 0.003 0.0 -0.007∆BAt−1 -0.318** -0.088 -0.378***∆CDSt 0.702 5.844*** 0.313
∆CDSt−1 1.754*** -2.658** 0.553**
Adj R2 0.207 0.452 0.147
I Di�erent economic impact: a 10% increase in CDS→I Below 500: 18% increase in Quoted SpreadI Above 500: 58% increase in Quoted SpreadI In 2012: 5% increase in Quoted Spread
16/24
H3: CENTRAL BANK INTERVENTIONS AFFECT THECREDIT RISK - MARKET LIQUIDITY RELATIONSHIP
Estimating the same equation for the three subsamples:
Before 8/12/2011 Before 8/12/2011 After 8/12/2011Variable CDS<500bp CDS>500bp
Intercept 0.003 0.0 -0.007∆BAt−1 -0.318** -0.088 -0.378***∆CDSt 0.702 5.844*** 0.313
∆CDSt−1 1.754*** -2.658** 0.553**
Adj R2 0.207 0.452 0.147
I Di�erent economic impact: a 10% increase in CDS→I Below 500: 18% increase in Quoted SpreadI Above 500: 58% increase in Quoted SpreadI In 2012: 5% increase in Quoted Spread
16/24

H4: MARKET LIQUIDITY IS DRIVEN BY MARKET AND FUNDING RISKFACTORS.
Do global factors have an e�ect on the liquidity of the Italian bond market? Globalsystemic factors impact liquidity through risk-aversion and inventory concerns:
I Cost and availability of funding liquidity (Euribor-Eonia, Eonia-DeTBill,CCBSS)
I Appetite for risk (USVIX)
I Funding Liquidity: Di�Euribor:
FLrt,τ =
∑Mi=1 ri,t,τ
M− r̂t,τ
17/24
H5: FUNDING COST OF THE MARKETMAKERS ADVERSELY AFFECTS MARKET LIQUIDITY.
Can we disentangle market-wide liquidity concerns and market-maker speci�cliquidity concerns?
I Brunnermeier and Pedersen (2009) show how funding liquidity a�ects marketliquidity. Higher margins will have market-wide e�ect on market liquidity.
18/24
H5: FUNDING COST OF THE MARKETMAKERS ADVERSELY AFFECTS MARKET LIQUIDITY.
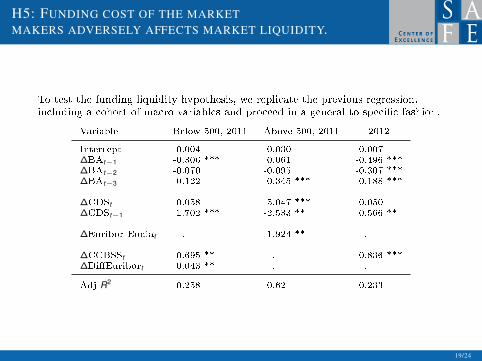
To test the funding liquidity hypothesis, we replicate the previous regression,including a cohort of macro variables and proceed in a general-to-speci�c fashion.
Variable Below 500, 2011 Above 500, 2011 2012
Intercept 0.004 -0.030 -0.007∆BAt−1 -0.306 *** 0.061 -0.496 ***∆BAt−2 -0.070 -0.095 -0.307 ***∆BAt−3 -0.122 -0.345 *** -0.188 ***
∆CDSt 0.058 5.047 *** -0.050∆CDSt−1 1.702 *** -2.533 ** 0.566 **
∆Euribor-Eoniat . 1.924 ** .
∆CCBSSt 0.695 ** . 0.836 ***∆Di�Euribort 0.043 ** . .
Adj R2 0.258 0.62 0.233
19/24
H6: THE CHANGE IN CREDIT RISK LEADSCHANGES IN MARKET LIQUIDITY, NOT VICE VERSA.
The market perception of credit risk could depend on market liquidity. So far, wehave investigated one direction, although the causality might run both ways.
20/24
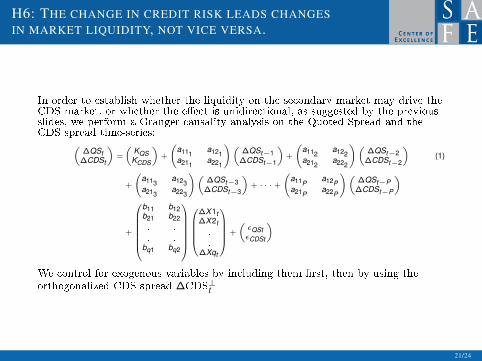
H6: THE CHANGE IN CREDIT RISK LEADS CHANGESIN MARKET LIQUIDITY, NOT VICE VERSA.
In order to establish whether the liquidity on the secondary market may drive theCDS market, or whether the e�ect is unidirectional, as suggested by the previousslides, we perform a Granger causality analysis on the Quoted Spread and theCDS spread time-series:(
∆QSt∆CDSt
)=
(KQSKCDS
)+
(a111
a121a211
a221
)(∆QSt−1
∆CDSt−1
)+
(a112
a122a212
a222
)(∆QSt−2
∆CDSt−2
)(1)
+
(a113
a123a213
a223
)(∆QSt−3
∆CDSt−3
)+ · · · +
(a11P
a12Pa21P
a22P
)(∆QSt−P
∆CDSt−P
)
+
b11 b12b21 b22...
.
.
.bq1 bq2
∆X1t∆X2t...
∆Xqt
+
(εQStεCDSt
)
We control for exogenous variables by including them �rst, then by using theorthogonalized CDS spread ∆CDS⊥t
21/24
H6: THE CHANGE IN CREDIT RISK LEADS CHANGESIN MARKET LIQUIDITY, NOT VICE VERSA.
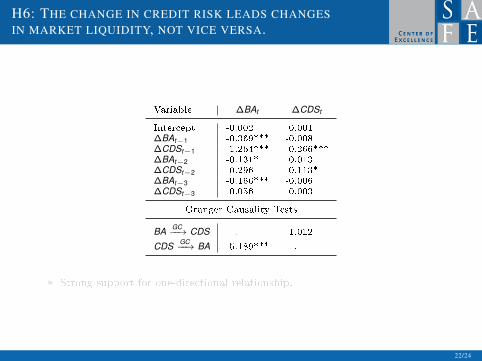
Variable ∆BAt ∆CDSt
Intercept -0.002 0.001∆BAt−1 -0.369*** -0.008∆CDSt−1 1.264*** 0.266***∆BAt−2 -0.131* 0.013∆CDSt−2 -0.296 -0.113*∆BAt−3 -0.166*** -0.006∆CDSt−3 0.056 0.003
Granger Causality Tests
BA GC−−→ CDS . 1.012
CDS GC−−→ BA 5.189*** .
I Strong support for one-directional relationship.
22/24
H6: THE CHANGE IN CREDIT RISK LEADS CHANGESIN MARKET LIQUIDITY, NOT VICE VERSA.
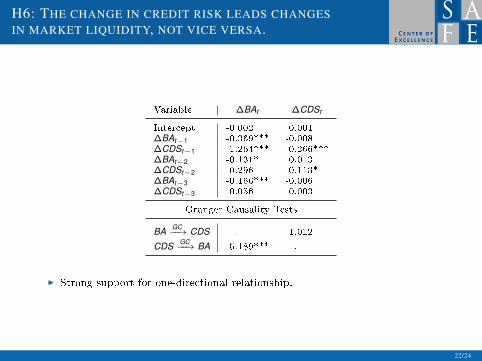
Variable ∆BAt ∆CDSt
Intercept -0.002 0.001∆BAt−1 -0.369*** -0.008∆CDSt−1 1.264*** 0.266***∆BAt−2 -0.131* 0.013∆CDSt−2 -0.296 -0.113*∆BAt−3 -0.166*** -0.006∆CDSt−3 0.056 0.003
Granger Causality Tests
BA GC−−→ CDS . 1.012
CDS GC−−→ BA 5.189*** .
I Strong support for one-directional relationship.
22/24
THE CONCLUSIONS
I Strong negative e�ect of credit risk on market liquidity (with nofeedback e�ect).
I CDS-Liquidity linkage is stronger and faster when the CDS levelrises above 500 bp.
I The relationship is weaker after the Central Bank intervention.
23/24
THE CONCLUSIONS
Policy implications:
I Euro-zone national treasuries: to understand the dynamic nature of therelationship between credit risk, global risk factors and market liquidity,which has strong consequences for the pricing of their issues in the auctions aswell as in secondary markets.
I ECB: to understand the impact of the unconventional instruments of newmonetary policy and focus on the market's perceptions of sovereign creditrisk. The introduction of the LTRO program, providing short-term liquidityto banks, shows that the channel from bank bailout to sovereign risk could bereversed: o�ering liquidity to banks may improve the market liquidity ofsovereign bonds and also indirectly reduce sovereign risk!
I Market regulators (the national central banks or European market regulatorssuch as ESMA): to identify the main factors that a�ect sovereign bonds'market liquidity in the Euro area.
I Bank regulators: to improve their tools for monitoring both bank capitaladequacy and liquidity risk. Changes in bank regulation impact marketliquidity, close coordination between regulators may prevent strong negativeexternalities.
24/24

Thank you for your attention!

This project has received funding from the European Union’s Seventh Framework Programme for research, technological
development and demonstration under grant agreement n° 320270
www.syrtoproject.eu
This document reflects only the author’s views.The European Union is not liable for any use that may be made of the information contained therein.


![Mika Ninagawa Self-image - Hara Museum Web · [6] noir, 2010 ©mika ninagawa Courtesy of Tomio Koyama Gallery [7][8] noir, 2010 ©mika ninagawa Courtesy of Tomio Koyama Gallery Gallery](https://static.fdocuments.us/doc/165x107/6023eb475775bd7e632f38a9/mika-ninagawa-self-image-hara-museum-6-noir-2010-mika-ninagawa-courtesy-of.jpg)