DAMPING STUDIES IN FLEXURAL VIBRATION by...
78
Damping studies in flexural vibration Item Type text; Thesis-Reproduction (electronic) Authors Uchiyama, Jerome Tomio, 1939- Publisher The University of Arizona. Rights Copyright © is held by the author. Digital access to this material is made possible by the University Libraries, University of Arizona. Further transmission, reproduction or presentation (such as public display or performance) of protected items is prohibited except with permission of the author. Download date 20/06/2018 14:37:23 Link to Item http://hdl.handle.net/10150/551669
Transcript of DAMPING STUDIES IN FLEXURAL VIBRATION by...
Damping studies in flexural vibration
Item Type text; Thesis-Reproduction (electronic)
Authors Uchiyama, Jerome Tomio, 1939-
Publisher The University of Arizona.
Rights Copyright © is held by the author. Digital access to this materialis made possible by the University Libraries, University of Arizona.Further transmission, reproduction or presentation (such aspublic display or performance) of protected items is prohibitedexcept with permission of the author.
Download date 20/06/2018 14:37:23
Link to Item http://hdl.handle.net/10150/551669
DAMPING STUDIES IN FLEXURAL VIBRATION
byJerome Tomio Uchiyama
A Thesis Submitted to the Faculty of the
DEPARTMENT OF CIVIL.ENGINEERING
In Partial Fulfillment of the Requirements For the Degree of
MASTER OF SCIENCE
In the Graduate College
THE UNIVERSITY OF ARIZONA
1963

STATEMENT BY AUTHOR
This thesis has been submitted in partial fulfillment of requirements for an advanced degree at The University of Arizona and is deposited in The University Library to be made available to borrowers under rules of the Library.
Brief quotations from this thesis are allowable without special permission, provided that accurate acknowledgment of source is made. Requests for permission for extended quotation from or reproduction of the manuscript in whole or in part may be granted by the head of the major department or the Dean of the Graduate College when in their judgment the proposed use of the material is in the interests of scholarship. In all other instances, however, permission must be obtained from the author.
This thesis has been approved on the date shown below:
SIGNED:
APPROVAL BY THESIS DIRECTOR
"\ r - K/ l/WCLe/yA. 'LINGER O
Professor of Civil EngineeringDate

ACKNOWLEDGMENT
The author wishes to acknowledge Dr. D. A.
Linger for the many helpful suggestions made
during the course of study and the many hours
of assistance in the preparation of this manuscript.
iii
TABLE OP CONTENTS
ABSTRACT e o o e e o e e e o o o o o o o yChapter 1 - STATEMENT OP PROBLEM • • • » 1
Chapter 2 _ GENERAL THEORY .............. 5
Chapter 3 - EXPERIMENTAL PROCEDURE - » « 21Chapter 4 - DISCUSSION AND CONCLUSIONS • 35REFERENCES 'ol
F E N I D X 1 C 0 0 © 0 < S 0 0 0 0 0 G 0 6 P 0 0
iv

ABSTRACT
An experimental investigation of the dynamic response
of bimaterial beams is reported. The effect of adding a
viscoelastic material to an elastic material is compared.Two model beams and two prototype beams are studied. Damp
ing forces are evaluated by calculating the response of the
system under the action of a constant sinusoidal force and
by using logarithmic decrement values of the decay curves.
Results show that the addition of a viscoelastic
material to an elastic system does not change the damping
mechanism, although a change in the magnitude of damping
is noticeable. Experimental results of the prototype beams
indicate that the load history of the bimaterial beams
strongly affect their response. As a result, interesting nonlinear softening effects and nonlinear damping are encountered in the low stress regions. Suggestions for further studies are presented.
v
Chapter 1
STATEMENT OF PROBLEM
IntroductionIn structural analysis„ considerations of the dynamic
effects due to earthquake and blast loadings are being given
more attention. Standard design codes apply statical ampli
fication factors in structural design whire these effects are
considered. The application of these"dynamic forces result in elastic systems being set into a vibrating motion. This motion
is primarily dependent upon the amount of damping in the materials that are used in the geometrical configuration, and upon the interaction of different materials.
When the dynamic forces are removed from the system,
the vibrating motion eventually dies out due to internal
damping forces. Damping forces in a vibrating system can be derived from a number of sources. In elastic structural systems, the viscous damping is the most familiar and widely
used. In viscous damping the damping forces are assumed to
be proportional to velocity. In some systems this offers
a fair approximation and also yields a simple mathematical solution. However, viscous type damping often does not pro
vide a realistic estimate of the damping characteristic of
a structural system. The damping force of structural systems1
2
is often independent of the frequency but strongly effected
by the amplitude.
Another linear mathematical theory, in which the
damping energy is Independent of the frequency, is called
the.hysteretic damping theory, Hysteretic damping in a
single degree of freedom system is similar to the familiar
viscous damping in that it implies a resisting force which
is in phase with the velocity. Further discussion of this theory is given in the next chapter.
As was stated previously, the amount of damping is dependent upon the type of material and upon the config
uration . In addition, two or more materials used simultaneously in a system can take advantage of various types
of materials for their energy dissipating characteristics.
As a result of this, composite structural systems have been
recognized for their ability to dissipate large amounts of
energy. It has been found in particular that the addition
of viscoelastic materials to an elastic system will greatly
increase the magnitude of damping. The addition of a visco
elastic material to an elastic material results in a struc
tural system known as a vis coelastic-elastic bimaterial system
Objective
' The objective of this study was to explore the qualitative aspects of the structural damping of a visco-
3
elastic-elastic bimaterial system and to attempt to evalu
ate the primary type and amount of damping in this type of
structural system. This study was therefore, and experi
mental investigation of damping forces in flexural vibrating viscoelastic-elastic systems. The effects of variations
in the' frequency and amplitude of vibration on the struc
tural systems were studied. The effects on damping proper
ties due to the addition of a viscoelastic element to a vib
rating elastic system were also considered. A verification of the composite action between the viscoelastic and elastic
material, the type of intermaterial connection, and the amount of increase in damping was attempted.
Scope
Damping forces in a structural system are derived
from two major sources; (a) material damping and"(b) system
damping. This report has not distinguished between these
mechanisms of energy dissipation, because the evaluation of
the entire system and not the individual components was the
objective of this study. The values given therefore are
the results of both material and system damping and provide
comparative studies for the addition of a viscoelastic material to an elastic system and also for the specific type
of connection used between the elastic and viscoelastic mat
erials in the system.
Damping forces can be defined in a number of ways
and also, a wide variety of nomenclature is used by different
> 4
authors in these definitions. A more complete discussion by.several noted authors is given in Reference 12. For this study9 the logarithmic decrement and the forced vibration
response methods have been used to determine the damping forces. No attempt is made to treat the full dynamical
problem, rather, a..given simple harmonic motion is used fgr
the beam without reference to the exciting force. Although this approach is grossly simplified, some conclusions can
be. drawn from the results. The stress level investigated was well within the endurance limit, since the maximum stress
did not exceed 3,000 psi in the prototype steel-concrete
beam. Only the simply supported configuration was investigated and it is felt that other configurations might be even
more informative. -
Chapter 2
GENERAL THEORY
History
Investigation of the damping properties of materials:
was first started in 1784 by Coulomb. He hypothesized and
experimentally proved that in torsional oscillation, damp-
ing is / caused by Internal losses in the material. The
earliest measurement of internal friction by the free-decay
method was performed by W. Weber in 1837. In this method,
the logarithmic decrement was observed by watching the rate
of decay of the amplitude of vibration. Later investigations
were made with models in the form of a wire by T. S. Ke,
which proved to be successful.
In 1862, Helmhotz presented a discussion on the
steady state bandwidth method as well as the decay-rate
method. The bandwidth method denotes a particular analysis
in a steady state system. This method, often called the
resonant method, employs a harmonic forcing function. The
amplitude of vibration is observed as the frequency of the forcing function is varied. The frequency at which the
response amplitude Is a maximum is called the critical
resonant frequency, and width of the amplitude versus forcing
frequency curve is a measure of the damping. The resonant5
6
method is employed when the damping forces are large and the
response curve is broad. The decay method is somewhat com
plementary to the resonant method' in that, if damping is
large the resonant method yields good resultss but an ac
curate measurement of the logarithmic decrement is difficult.
Conversely» the decay method gives good results when a system is lightly damped/,_ and in which case it is difficult to ^bbtain"
good results using the resonant method.In 1912$, Hopkinson and Williams presented damping as
the hysteretic phenomenon. They suggested that these losses
were due to the incongruencies in the stress-strain relationship. This concept was later refined by Foppl when he as
sumed strain was composed of an elastic and plastic portion,
in which the plastic strain causes the hysteresis or energy
'loss (10)(15).
Theories of Damping.
When a mechanical system vibrates, energy is dis
sipated due to internal damping forces. If the excitation
and response are harmonic, or nearly so, the mathematical
treatment can fulfil certain ideal conditions. These con
ditions require that the amplitude of the response, phase
angle of the response, and the energy dissipated per cycle
should all be related to the frequency and amplitude of the
applied forces. For a mathematical solution, it is not
required that the magnitude or type of damping be adequately
7
^escribed or even approximately representative of that in an]
actual, structure.' In damping theory, a thorough mathematical
treatment is. essential.. As a consequence, an exact repre
sentation of the damping forces is usually sacrificed in
order to preserve the linearity of the equations.
The two distinct linear damping theories are the
1 viscous damping theory, and the hysteretic damping theory.
I A-spring with a damper in parallel with the spring can be used to describe the character of the damping theories. If
a viscous damper is mounted in parallel with the spring, the
damping forces are proportional and in phase with the veloc
ity. For the case of a hysteretic damper, as harmonic mo
tion is initiated into the system, the mechanism of damping
has changed. The damping force is proportional to the displacement and in phase with the velocity. An equivalent
viscous damping can be used, to represent the hysteretic
damping in a forced vibration. The results will be the
same for both cases for the representation of hysteretic
damping if the viscous damping coefficient c is inversely
proportional to the forced frequency p.
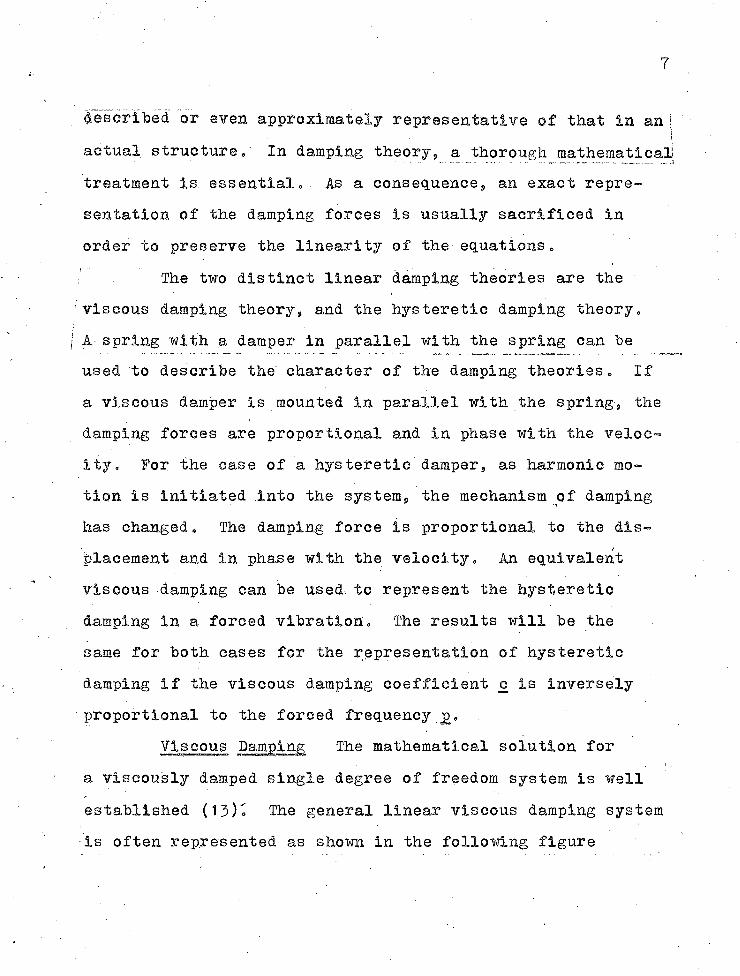
Viscous Damping The mathematical solution for
a viscously damped single degree of freedom system is well
established (13)» The general linear viscous damping system
is often represented as shown in the following figure
8
Viscous Damping Model
c = dashpot constant (Ib-sec/ft)
k = spring constant (lb/ft)
f = force (lb)
x = displacement (ft)
m = mass (Ib-secVft) The damping force in viscous damping theory is assumed to be proportional to the velocity. The total force (f) due to
an instantaneous displacement (x) is
f = kx + cx
and the equation of motion for a free vibrating system becomes
mx + cx + kx = 0
for which the solution has the form
ct2m
x = e !|V! ‘(in) } Og sin {]/m ‘ (k)2} (1)
where1 Og = coefficients which depend upon the initial
conditions
wo = undamped natural circular frequency yjk/m = damped natural circular frequency = \k/m -(c/2m)
= 6J0\1 - (c^/Akm) ; the damping is considered
critical when c = 2/km" = cc.
For the case of a forced'vibration with viscous damping,
the equation of motion for a steady-state sinusoidal
forcing function ( F sinpt ) is
mx + cx + kx = F sinptwhere p is the forced circular frequency.
The solution for this nonhomogeneous differential equation
contains two portions; a complementary solution and a par
ticular solution. The complementary part is the free yi-
;bration solution given in equation (1). The steady-state
portion of the solution of the differential equation is
x = A cospt + B sinpt (2)
which takes the final form:
where:
The term
x = — sih(pt - 9)j[l - (p/*0 ) f + (cp/mcu2)2j s
9 = tan ■g - tan" . p2)
- (p/cu0 )2j2 + (cp/mw2 )2)
(3)
(4)
is called the magnification factor. The magnitude of this
term is dependent, upon the ratio of the forced frequency to
the undamped natural frequency and also upon the damping
term (c/mv>0 ). When (p/(i>0 ) approaches unity, the magnifi
cation factor is strongly effected by the damping value. •
A plot of the magnification factor vs (p/eo0) for different values of (c/mu>0 ) can be found in most vibration texts (13).
10
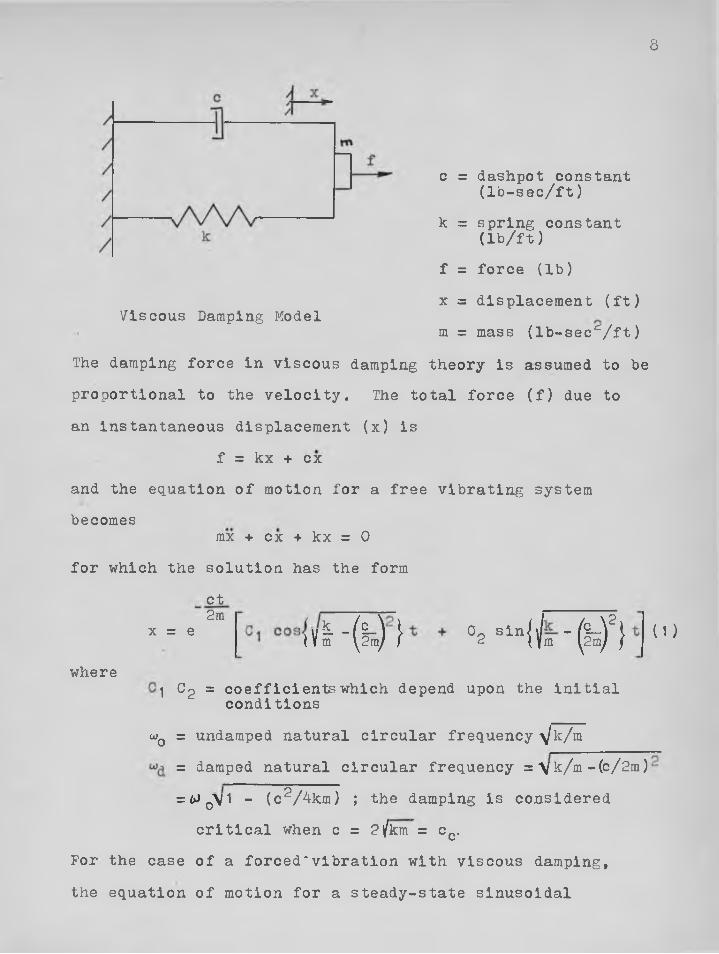
To determine the amount of energy dissipated In
a viscously damped system, It Is assumed that the extension
of the spring Is given by the displacement function x = X slnpt. The resisting force becomes
f = kX slnpt + cpX cosptEliminating t,
f = kx + c p ^ X ? - x2 .
This Is an equation of an ellipse which has a major axis which
Is Inclined at tan~1k to the x-axls
tan"1K
Hysteresis Loop For Viscous System
The area enclosed by the ellipse Is
‘E =211 2U
(kX slnpt + cX cospt) pX cosptdt
0
which reduces to
E = X2cpn . (5 )This is the energy dissipated per cycle by the dashpot.
From Equation (5) it is apparent that the energy loss is
directly proportional to the frequency and the square of the
amplitude.
11 *
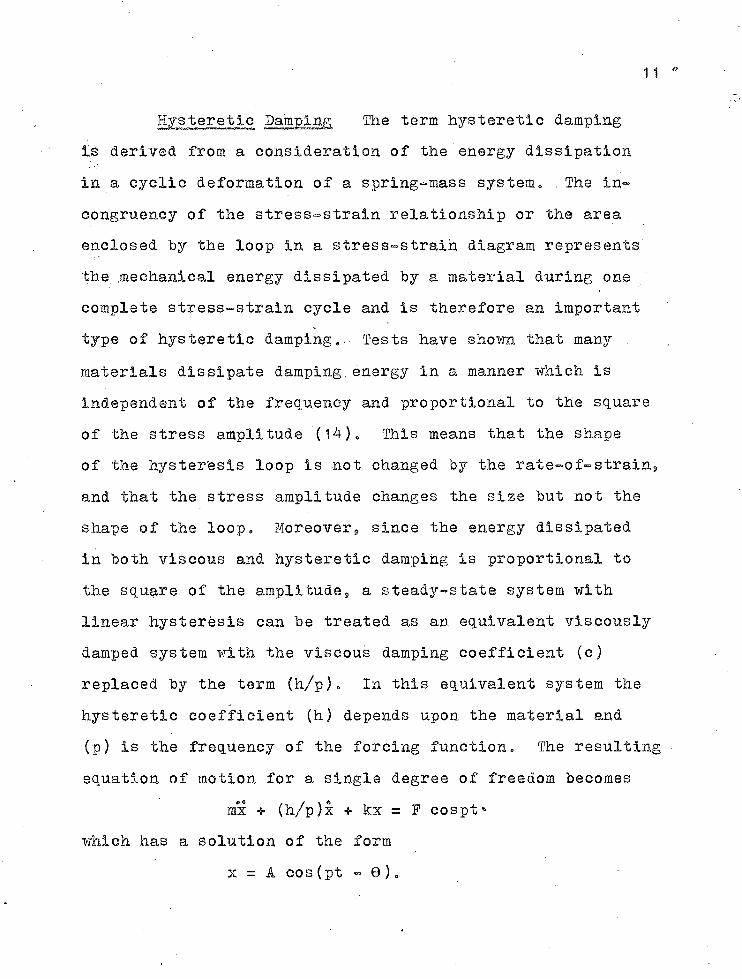
Hysterettc Damping The term hysteretic damping is derived from a consideration of the energy dissipation
in a cyclic deformation of a spring-mass system, . The in
congruency of the stress-strain relationship or the area enclosed by the loop in a stress-strain diagram represents
the mechanical energy dissipated by a material during one
complete stress-strain cycle and is therefore an important
type of hysteretic damping. Tests have shown that many
materials dissipate damping.energy in a manner which is
independent of the frequency and proportional to the square
of the stress amplitude (14). This means that the shape
of the hysteresis loop is not changed by the rate-of-strain,
and that the stress amplitude changes the size but not the
shape of the loop. Moreover, since the energy dissipated
in both viscous and hysteretic damping is proportional to
the square of the amplitude, a steady-state system with linear hysteresis can be treated as an equivalent viscously
damped system with the viscous damping coefficient (c)
replaced by the term (h/p). In this equivalent system the
hysteretic coefficient (h) depends upon the material and
(p) is the frequency of the forcing function. The resulting
equation of motion for a single degree of freedom becomes
mx + (h/p)x + kx = F cospt'
which has a solution of the form
x = A cos (pt - 0)o-
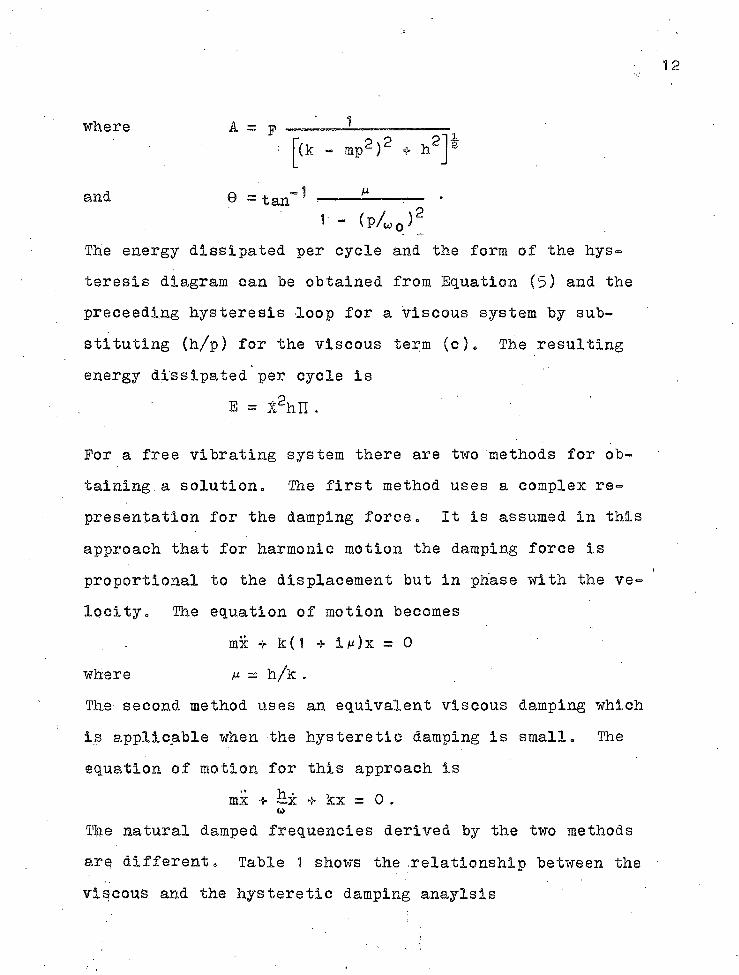
where A = p
and 6 -tan"11 M1 “ (P/W 0 )2
The energy dissipated per cycle and the form of the hys
teresis diagram can be obtained from Equation (5) and the
proceeding hysteresis loop for a viscous system by sub
stituting (h/p) for the viscous term (c)„ The resulting
energy dissipated per cycle is
For a free vibrating system there are two methods for ob
taining . a solution. The first method uses a complex: re
presentation for the damping force, It is assumed in this
approach that for harmonic motion the damping force is
proportional to the displacement but in phase with the ve
locity. The equation of motion becomes
The second method uses an equivalent viscous damping which
is applicable when the hysteretic damping is small. The
equation of motion for this approach is
The natural damped frequencies derived by the two methods
are different. Table 1 shows the relationship between the
viscous and the hysteretic damping anaylsis
e = A n .
where
mx + k (1 + 1m)x = 0 m = h / k .
mx + —x + kx = 0 .
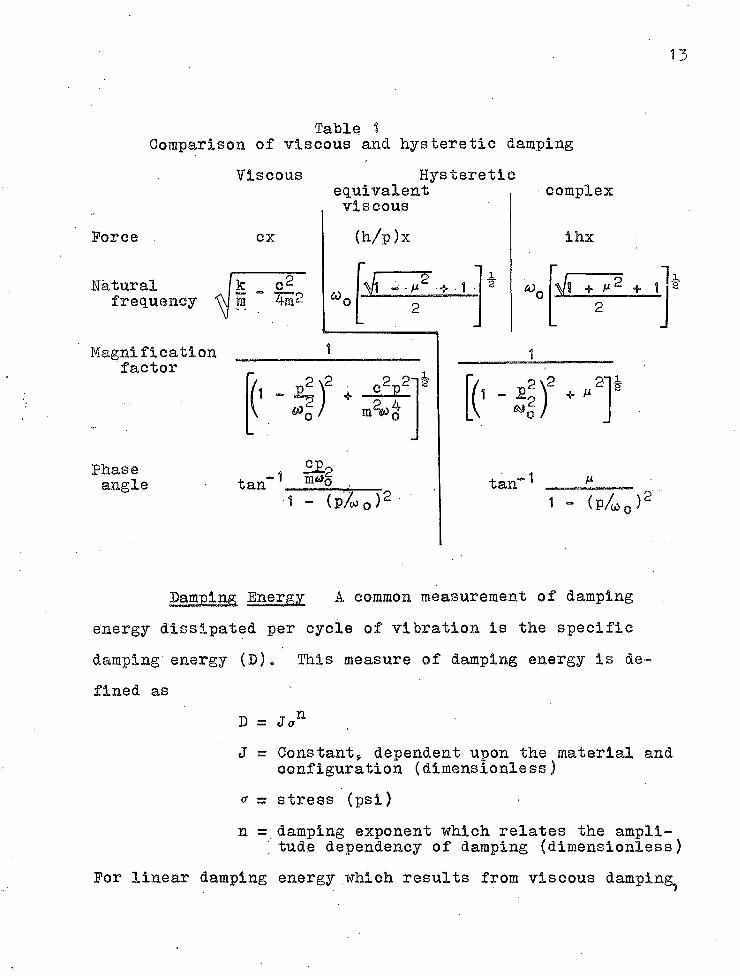
13
Table 1Comparison of viscous and hysteretic damping
Viscous Hystereticequivalent complexviscous
Force
Naturalfrequency
Magnification factor
I 3i2
4 f + - ^ 2'1m%)^
Phaseangle tan” 1 m^o
1 " (p/w o)2
(h/p)x
*
ihx
/l «« - M 4* 1 • *>0 Vs + m 2 + 12 2
1
(■ - .1) + M 2
tan"1 - (p/c q )2
Damping Energy A common measurement of damping
energy dissipated per cycle of vibration is the specific
damping energy (D). This measure of damping energy is defined as
D = J<rnJ = Constants, dependent upon the material and
configuration (dimensionless)
= stress (psi)
n =,damping exponent which relates the amplitude dependency of damping (dimensionless)
For linear damping energy which results from viscous damping^
14
the specific damping energy (D) increases with the square
of the stress. In nonlinear systems the exponent (n) has a value varying from 2 to 3 in the low and intermediate
stress regions and a value of 5 to 30 for the high stress
regions (8). The specific damping energy is proportional
to the area within the stress-strain hysteresis loop. It i
represents the energy absorbed by a uniformly stressed mat
erial, The resulting specific damping energy dissipated per
cycle due to the damping forces is equal to ( 2 n ) ,The loss modulus (Eg) is defined as the stress divided by
the component of strain that is 90° out of phase with the stress. This form of the specific -damping energy (D) is
quantitatively applicable only for uniformly stressed specimens, However, since the distribution of stress and the
distribution of the stress volume is the same for both model
beams and both prototype beams, a qualitative comparison
■between each type can be made by using the specific damping energy based on maximum ffiber stress with no loss of accu- racy. Therefore, it was assumed in this study that the
specific damping en^eSgy for a flexural vibrating beam,is equal to the energy dissipated as computed on the basis of
the energy loss by the logarithmic decrement and the outer
fiber stress. This evaluation of the specific damping ener
gy was done in lieu of an evaluation of the complex stress- volumes 'in the bimaterial bfeams.
15
To evaluate the specific damping in terms of the logarithmic decrement and the stress, it is necessary to define the energy dissipated per cycle In terms of these
parameters. The logarithmic decrement (5), which will be
discussed in more detail later, is defined as.
where Xi and Xg are successive amplitudes of vibration. The'
exponential term can be expanded into a series and by re
taining only the first two terms in the series, it can be
written as ■ ■
. e5 ' ~ 1 + 5 ■
This approximation yields
s = S - T - l g = HXg X ■
The relationship.between logarithmic decrement and specific
damping eriergy can be obtained by defining the work energy as
W = kX2The work energy remaining after one cycle is
¥ - nw = k(X - AX)2
where (k) is the spring constant (Ib/ft)
(X) is the displacement.(ft)
(AW) is the work lost per cycle (ft-lb)
The ratio of work energy lost per cycle to the work energy
at X becomes, after discarding higher order terms
16
41 = 2AX = 2 5W XIf the work energy is described by the strain energy, the
work lost becomes the specific damping energy. Then5 — B
2 (total strain energy)
and by substituting the total strain energy {(T£/2) the equation becomes
D = <rx € x 5 = f(<r^,5 ) (6)This relationship will be used to correlate the logarithmic
decrement values to the specific damping energy values.
Using Equation (6), it is seen that if the specific damping
energy dissipated for a linear system is proportional to the
square of the stress, the logarithmic decrement is independ
ent of the strain. If the logarithmic decrement is a function of the strain amplitude, the the specific damping energy is no longer a function of the square of the strain
but of an order higher than two.Differentiating between a linear and a nonlinear
system is done by observing the relationship of the specific
damping and strain or stress amplitude (D = f (<rn )). if the
value of (n) Is much greater than 2, the energy dissipated
will not be proportional to the square of the stress and
the damping system is no longer a linear one. No general solution for arbitrary (n) values have been developed,
although there have been empirical relationships suggested. .
Distinguishing between a linear viscous and a linear hysteresis
17
damping is accomplished by observing the effects of frequency. The specific damping energy of both types is related to the square of the stress amplitude. For the case of viscous
damping the energy dissipated is proportional to the fre~
quency while the hysteretic damping is independent of the
frequency. The shape of the loop in the stress-strain
diagram is elliptical and its shape is affected by the rate
of straining for the viscous condition and the shape remains
unchanged for the hysteretic condition.Another type of damping of interest is a nonlinear
form of-hysteretic damping which offers a type of analysis
where a linear analysis insufficiently describes the problem.
The resulting nonlinear system demonstrates a dependence of
the motion on the amplitude of vibration for both free and
forced vibration systems. From previous investigations9
amplitude dependent mechanisms of damping are found to dis
sipate energy in proportion to the cube of the amplitude in the low and medium stress regions. Values of the 5th to 30th
power of the amplitude have been found in the high stress regions (2). Most typical structural systems will be exposed
to a wide range of stresses, frequencies and other variables.
Damping forces may be dominated by an amplitude dependent
or amplitude independent mechanism depending upon the material
and stress region. Steel, being elastic is relatively independent of amplitude until the stress approaches the
endurance limit (2).As the previous discussion indicates, the capacity of
a homogeneous material to dissipate energy is often limited
to the region of high stresses. Combining two or more mater
ials together offers a method of dissipating larger amounts
of energy in both high and low stress regions. Addition of
high damping viscoelastic materials to a lightly damped
system can Increase the damping forces greatly.• By proper
selection of material and shape, optimization of the damping can be achieved. Addition of a viscoelastic material, which follows closely the linear theory for viscous damping
will increase damping but will not change the mechanism of
damping in a linear system. In this case the exponent (n) remains constant .
Measurement■ As a measure of the energy loss per
cycle, the logarithmic decrement is used. The logarithmic
decrement is obtained from-a free vibrating system. A free
vibrating single degree of freedom system, which has viscous
damping, consists' of two 'factors. The first is a decreasing
exponential curve and the second is a sine wave, enveloped
by the exponential curve. The term "damped sine wave" is some
times used to describe this action of viscous damping.
During the time interval between two successive maximum
peak amplitudes, the amplitude of vibration is diminished
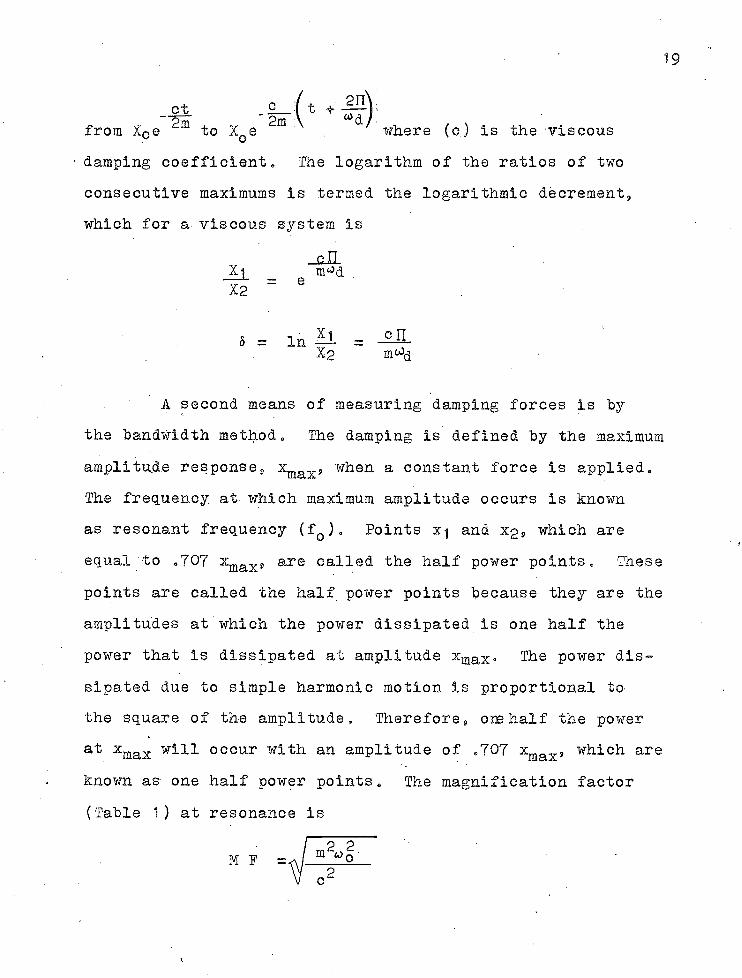
19
from X0ect2m to XQe where (c) is the viscous
damping coefficient„ The logarithm of the ratios of two consecutive maximums is termed the logarithmic decrement,
which for a viscous system is
the bandwidth method„ The damping is defined by the maximum
amplitude response, xmax, when a constant force is applied.
The frequency at which maximum amplitude occurs is known as resonant frequency (f0 ). Points x^ and xg, which are
equal to .707 xmax, are called the half power points. These
points are called the half power points because they are the
amplitudes at which the power dissipated is one half the
power that is dissipated at amplitude xmax. The power dis
sipated due to simple harmonic motion is proportional to
the square of the amplitude. Therefore, om half the power
at xmax will occur with an amplitude of .707 xmax, which are
known as one half power points. The magnification factor
(Table 1) at resonance is
m^d
A second means of measuring damping forces is by
M F
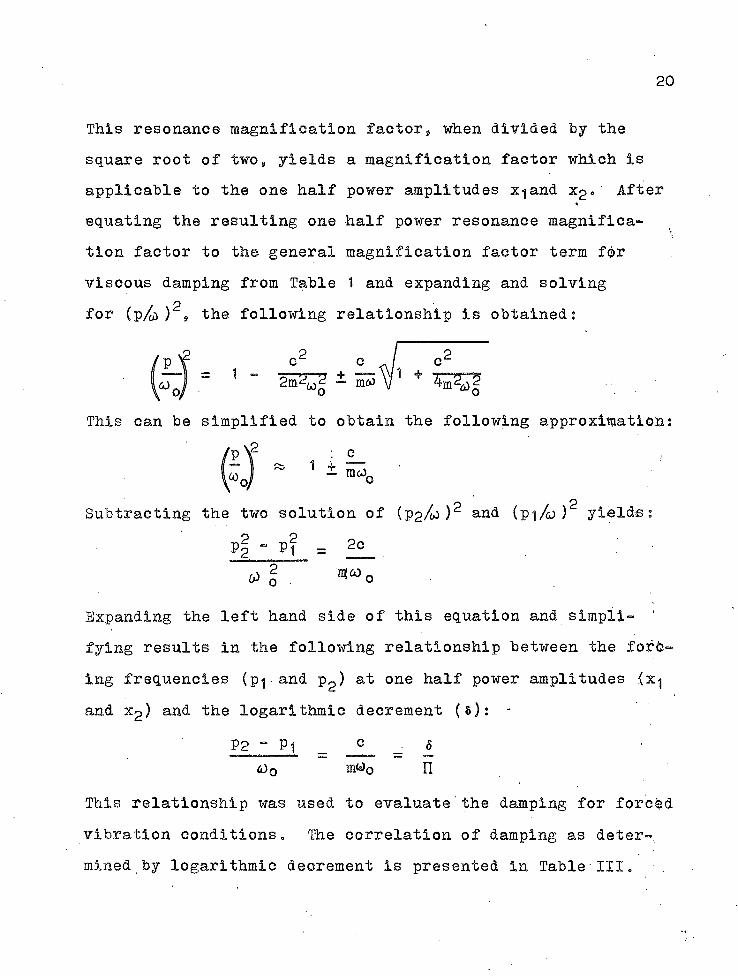
20
This resonance magnification factor, when divided by the square root of two, yields a magnification factor which is applicable to the one half power amplitudes x-jand xg. After equating the resulting one half power resonance magnification factor to the general magnification factor term for viscous damping from Table 1 and expanding and solving
for (p/o) )s> the following relationship is obtained:
c2 C c2z s q ? i w T +
This can be simplified to obtain the following approximation:
Subtracting the two solution of (pg/o )2 and (p-j/cj )2 yields:
p| - pf = 2°
(0 o “*"0
Expanding the left hand side of this equation and simpli- '
fying results in the following relationship between the ford
ing frequencies (p and p2 ) at one half power amplitudes (x
and Xg) and the logarithmic decrement (&): -
P2 " Pi c 64)0 m^o n
This relationship was used to evaluate the damping for forced
vibration conditions„ The correlation of damping as determined by logarithmic decrement is presented in Table III.
EXPERIMENTAL PROCEDURE
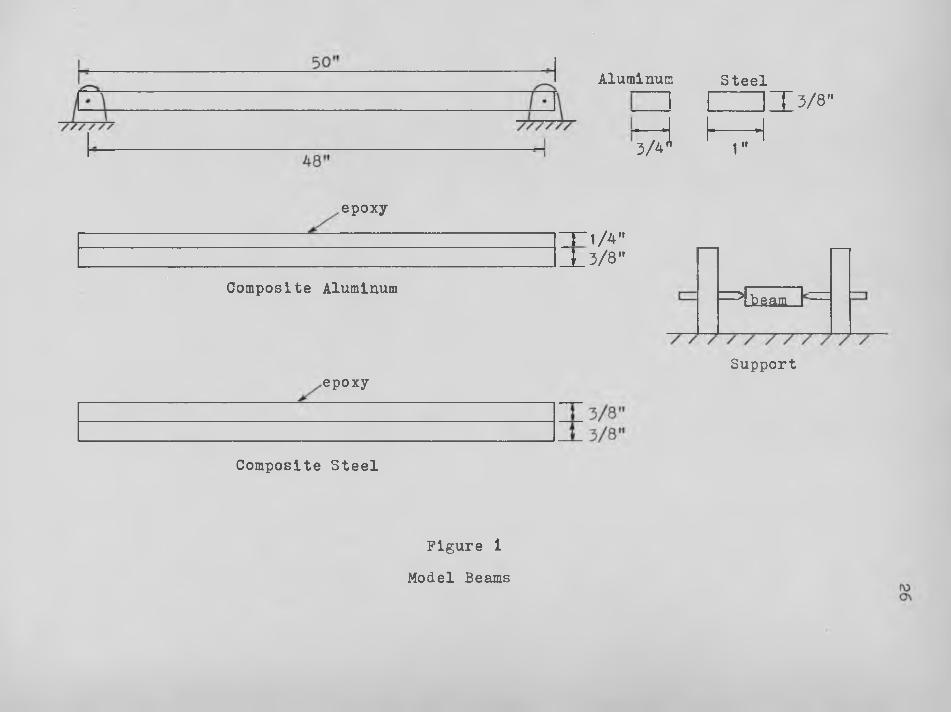
Description of SpecimensTwo model beams were studied in an Initial investi
gation of the dynamic response of bimaterial beams in flex
ure. These models were used for preliminary studies of
damping forces prior to the testing of larger prototype beams. These models provide an easily controlled method of
testing. Both beams were simply supported but were made
of different materials. The first model was a 3/411 x 3/8" 2024 clad aluminum bar 50 inches in length. The second
model was a 1" x 3/8" cold rolled steel bar 50 inches in '
length. The viscoelastic material, which was added to .the model beams after the first series of tests and prior to
the second series of tests,was an epoxy formulation. This
changed the elastic system to a viscoelastic-elastic bi
material system. To insure good bond, the surface was clean
ed with methyl ethyl keytone before the epoxy mixture was
placed on the beam. These beams are shown in Figure 1.
Simple supports for these models were made by inserting
tapered tip screws into the sides of the beam at the sup
ports •as shown in Figure 1. It is felt that this scheme
would allow the least amount of friction during vibration.The second phase of this experiment was conducted
Chapter 3
21
22
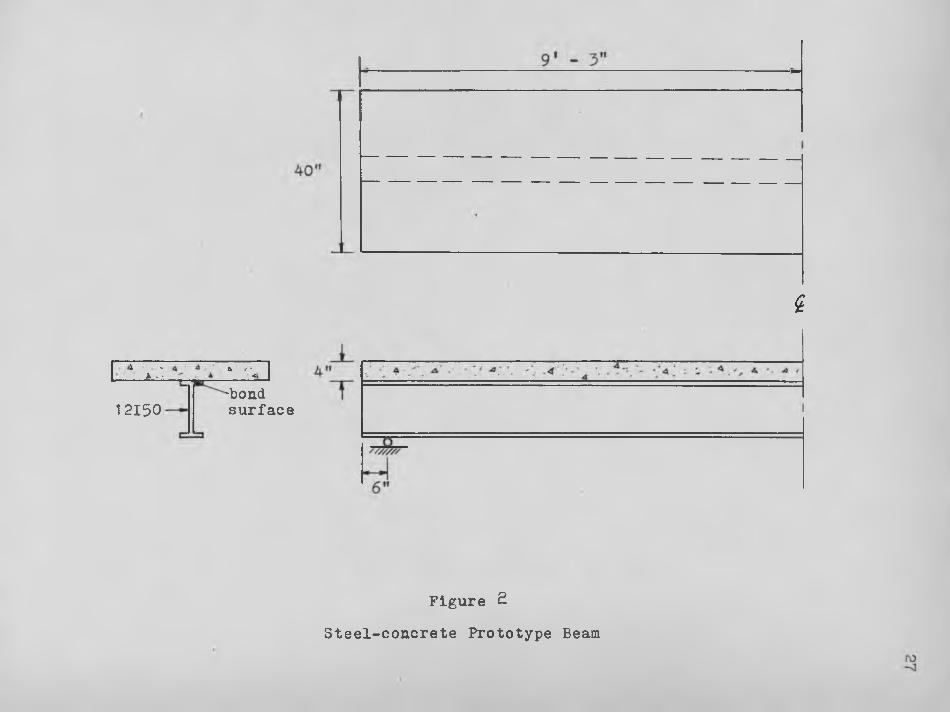
with two large composite steel-concrete highway bridge beams.
• The steel beams were 12 inch I beams weighing 50 Ib/ft upon which a reinforced concrete slab was connected throughout their lengths of 18 feet 6 inches. Both beams are identical
except for the manner in which the concrete was bonded to.
the steel. One beam was connected by the conventional stud
connecters while the other beam was bonded by an epoxy for
mulation. These beams are shown in Figure 2 and further
details can be found in Reference 6. These beams were supplied by the Engineering Research Laboratory at the Univer
sity of Arizona and had been subjected to dynamic fatigue
tests which simulated over a million cycles of live load
stress reversal. As a consequence, cracks in the concrete slab were visible which simulated very closely the slab
cracking which occurs in many highway bridges. Also, due to the previous cyclic loading, the concrete bond in the stud
connected beam had been broken between the top flange and the slab, however, the studs were still intact and funct
ioning as shear connecters.
Instrumentation and Test EquipmentData was collected on a dual channel Sanborn record
er, model 350-1100B and is shown in Figure 3. This instru
ment recorded time-strain measurements which provided the
information for the determination of the forced response curves and also gave information for the logarithmic
23
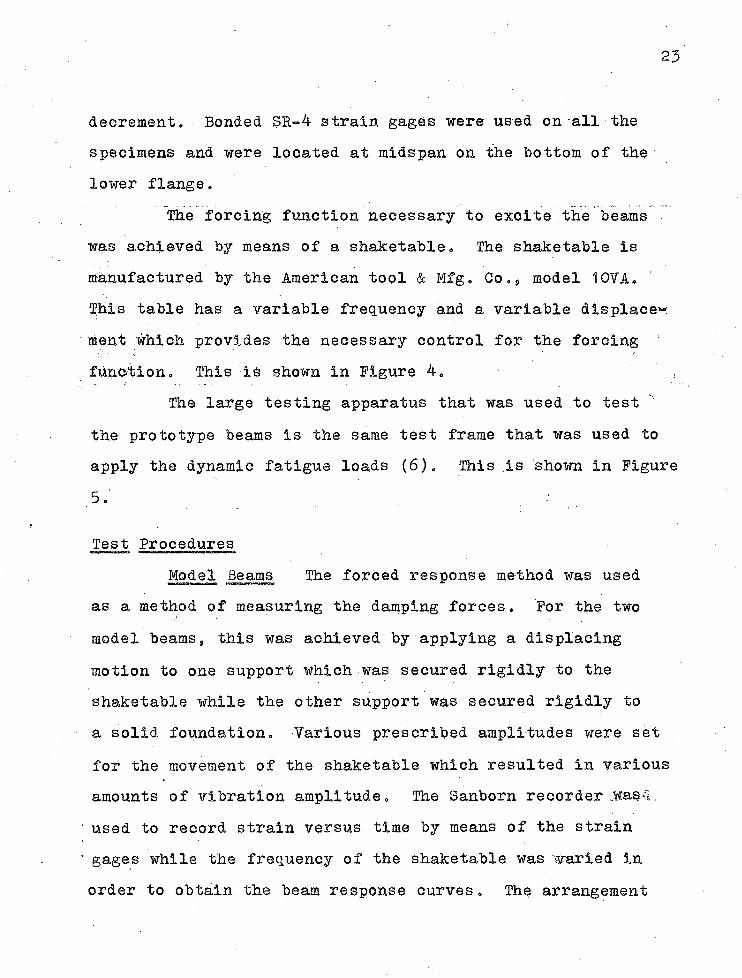
decrement. Bonded SR-4 strain gages were used on all the
specimens and were located at midspan on the bottom of the
lower flange.
The forcing function necessary to excite the beams was achieved by means of a shaketable. The shaketable is
manufactured by the American tool & Mfg. Go., model 10VA.This table has a variable frequency and a variable displace
ment which provides the necessary control for the forcing 1
function. This 16 shown in Figure 4.The large testing apparatus that was used to test
the prototype beams is the same test frame that was used to
apply the dynamic fatigue loads (6). This is shown in Figure
5.'
Test Procedures
Model Beams The forced response method was used
as a method of measuring the damping forces. For the two
model beams, this was achieved by applying a displacing
motion to one support which was secured rigidly to the
shaketable while the other support was secured rigidly to
a solid foundation. Various prescribed amplitudes were set
for the movement of the shaketable which resulted in various amounts of vibration amplitude. The Sanborn recorder wasd
used to record strain versus time by means of the strain
gages while the frequency of the shaketable was warled in
order to obtain the beam response curves. The arrangement
24
for this testing of the model beams can be seen in Figure 6,The test was conducted with a constant amplitude setting and by!
varying the frequency from less than resonance to beyond the
resonant frequency. The response of each system was observed throughout the range of the varied frequencies. Several
different amplitudes were used for each test beam.The decay method was used as a second method of
measuring damping forces. Bach specimen was manually dis
placed and then suddenly released. The Sanborn instrument recorded strain versus time measurements throughout the
decay period. It was observed at certain amplitudes that
there were Interferences in its first mode of vibration.
It was found that by striking the specimen sharply, much of the interference was eliminated. The logarithmic decre
ment values were computed from measuring successive ampli
tudes and taking the logarithm of their ratios.
Prototype Beams Damping force measurements for the
prototype beams were made in the same manner as those used for the model beams. However, the force response curves
were obtained by applying a prescribed forcing function
instead of a prescribed displacement, as was done in the
model beam test. The physical arrangement for the beams and
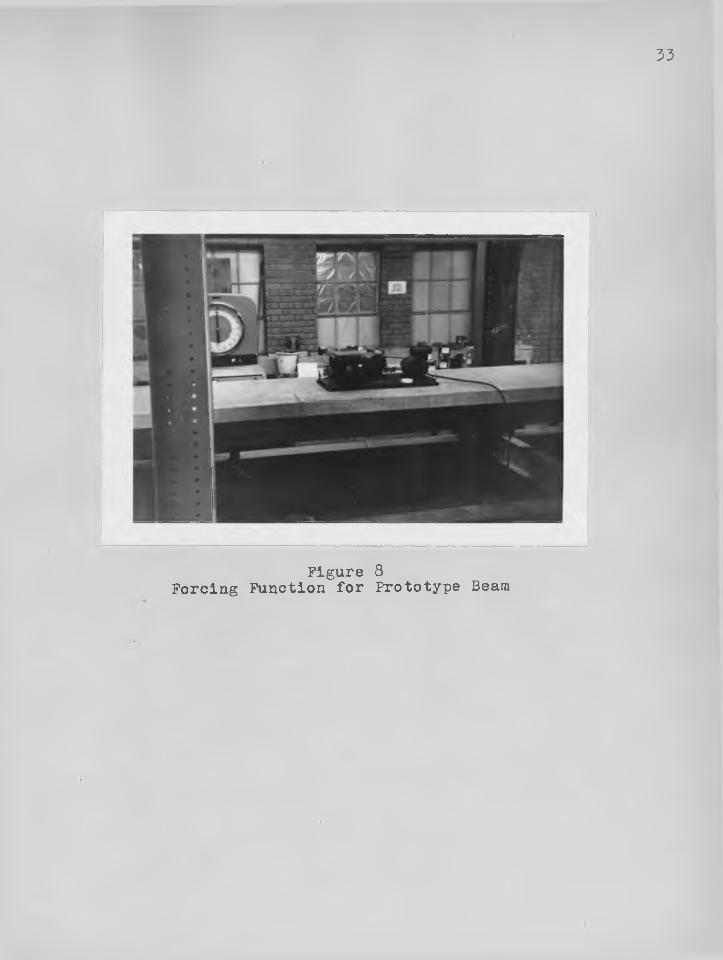
its supports can be seen in Figures 5, 7, and 8. The shake-
table can be seen mounted directly on the center span of the
beam in Figure 8. The magnitude of the forcing function
was limited by the capacity of the shaketable, however, the
25
resulting vibratory stresses were still in the range of
actual highway bridge live load stresses which were ex
perimentally observed by others (4)„ The supports for the
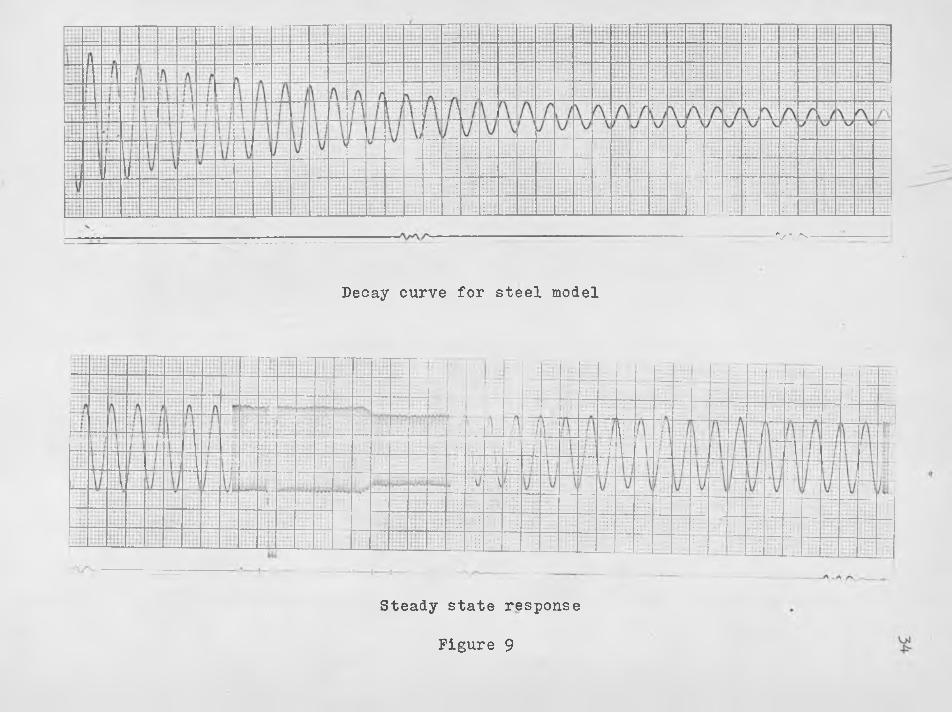
prototype beams simulated a rocker and roller supporting system which was secured so that no bouncing or adverse movement of the supports oocured. Decay curves were obtained
by stopping the shaketable and observing the damping« A typical decay curve and also a steady-state response curve
is shown in Figure 9=
The model beams have the same basic geometrical
shape and also the beams are subjected to the same type of
loading. Results will indicate relative differences in
their damping character because of these similarities in
a model single material to a model bimaterlal comparison.The prototype beams are also similar to each other in their
shape and loading and comparative results of each other will
indicate relative differences in their damping character.
Aluminum Steel~ I 1 IT 3/8"
*— i I*— 43/A* 1"
epoxy
IT 1/4"ZL3/8"
Composite Aluminum
epoxy
^ beam
Support
Composite Steel
Figure 1
Model Beams
i
' 1 . - . ' ",
12150'bondsurface
Figure 2
Steel-concrete Prototype Beam
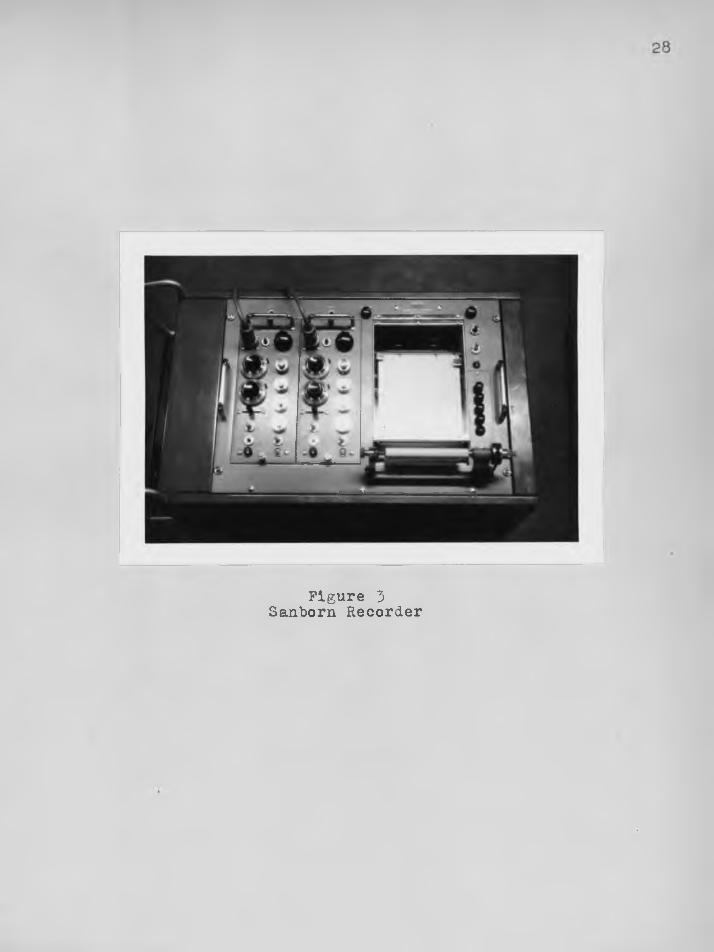
Figure 3Sanborn Recorder

Figure 4Variable Shaketable
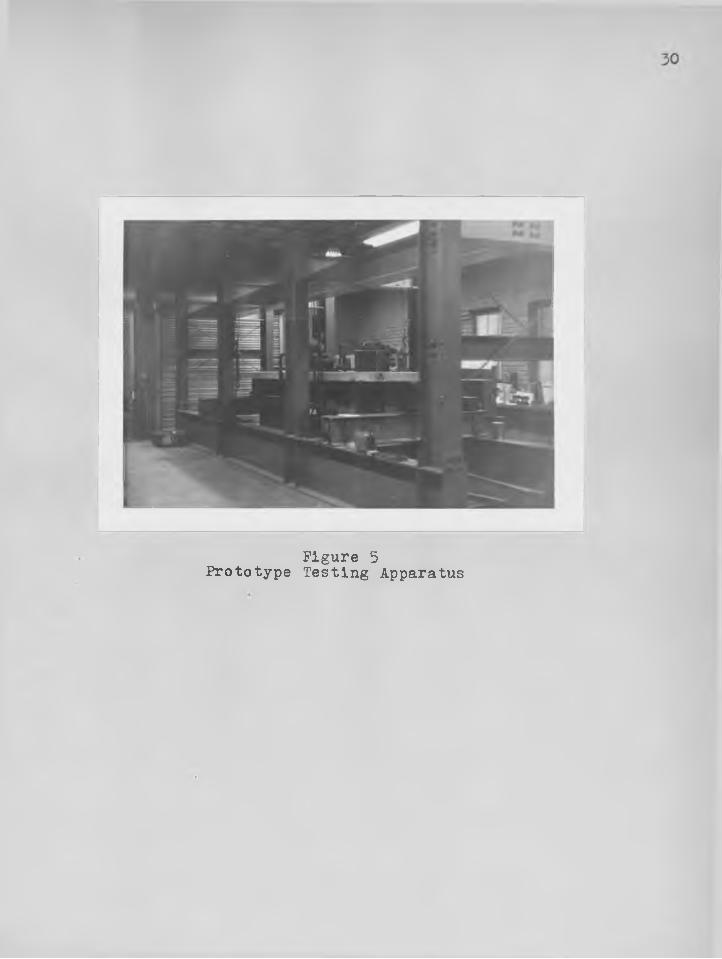
Figure 5Prototype Testing Apparatus

Figure 6Test Arrangement for Model Beams
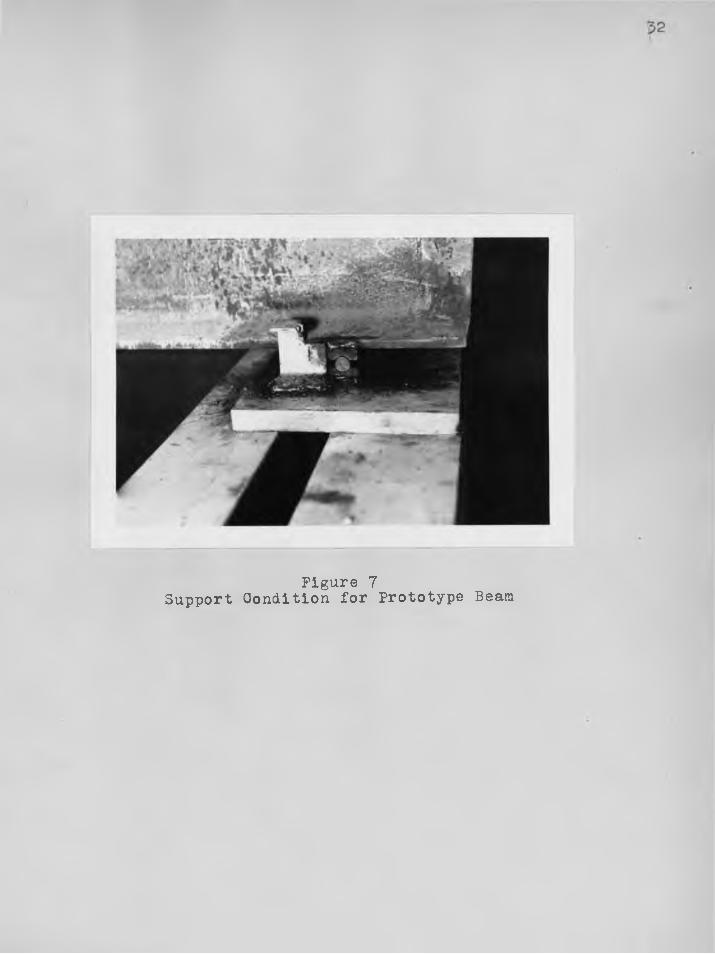
Figure 7Support Condition for Prototype Beam
33
Figure 8Forcing Function for Prototype Beam
AyA/
Decay curve for steel model
Steady state response
Figure 9
Chapter 4
DISCUSSION"AND. CONCLUSIONS
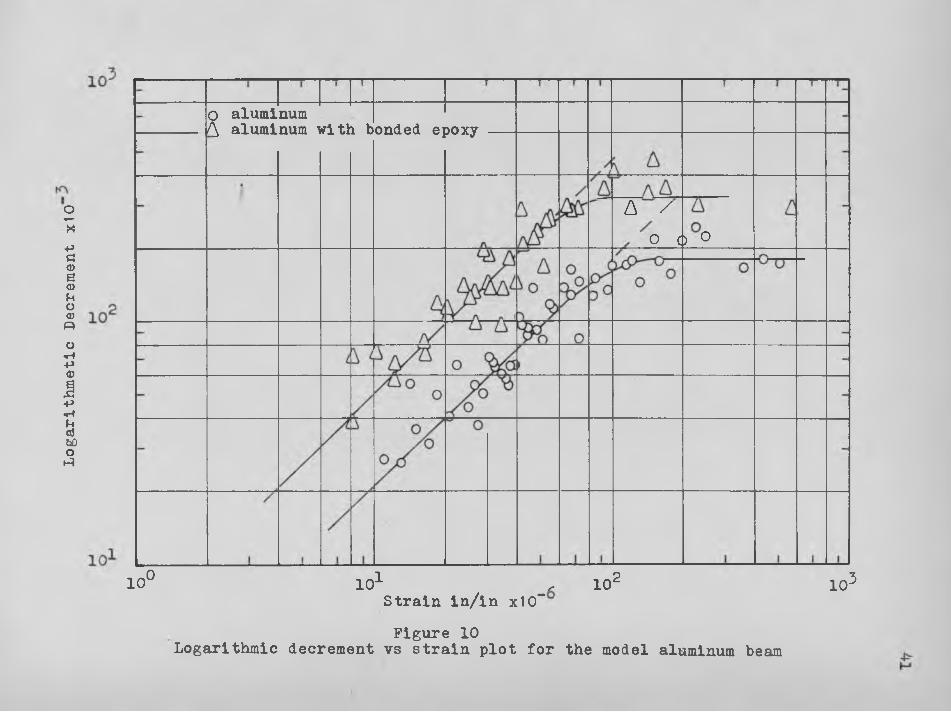
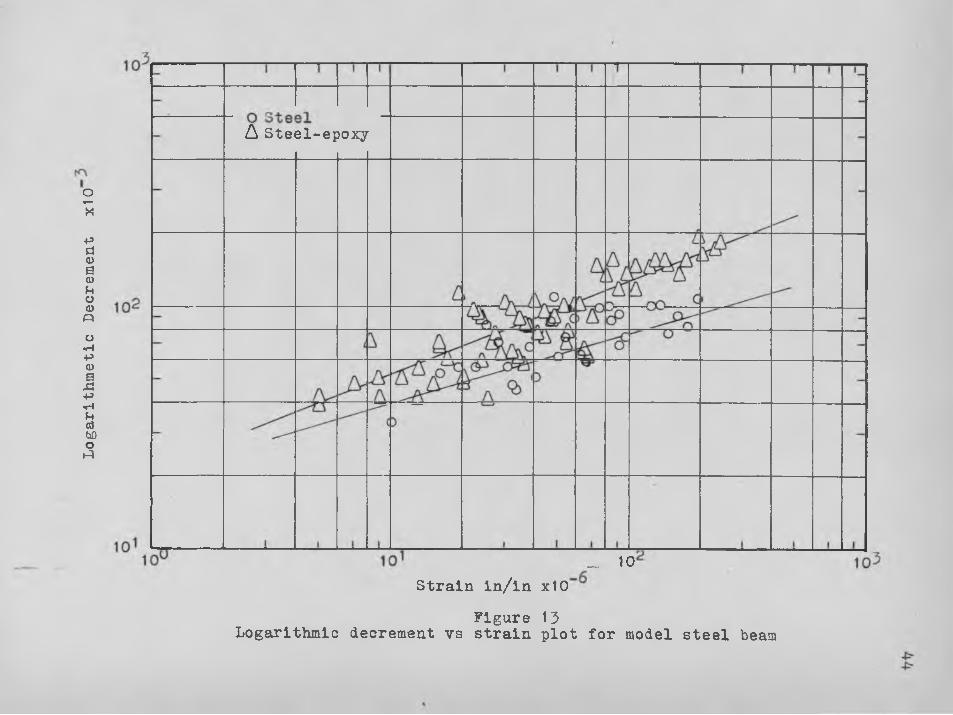
Discussion of ResultsThe studies conducted on the model steel and alumi
num beams indicate that a definite increase in the damping force's is developed with the addition of the viscoelastic
epoxy material. Figures 10 and 13 show a definite in
crease in the logarithmic decrement at any particular strain
amplitude with the added viscoelastic material. The slope
has remained approximately the same which indicate that the
mechanisms of damping are similar in their energy absorbing
characteristics. The amount of shift of the curves in
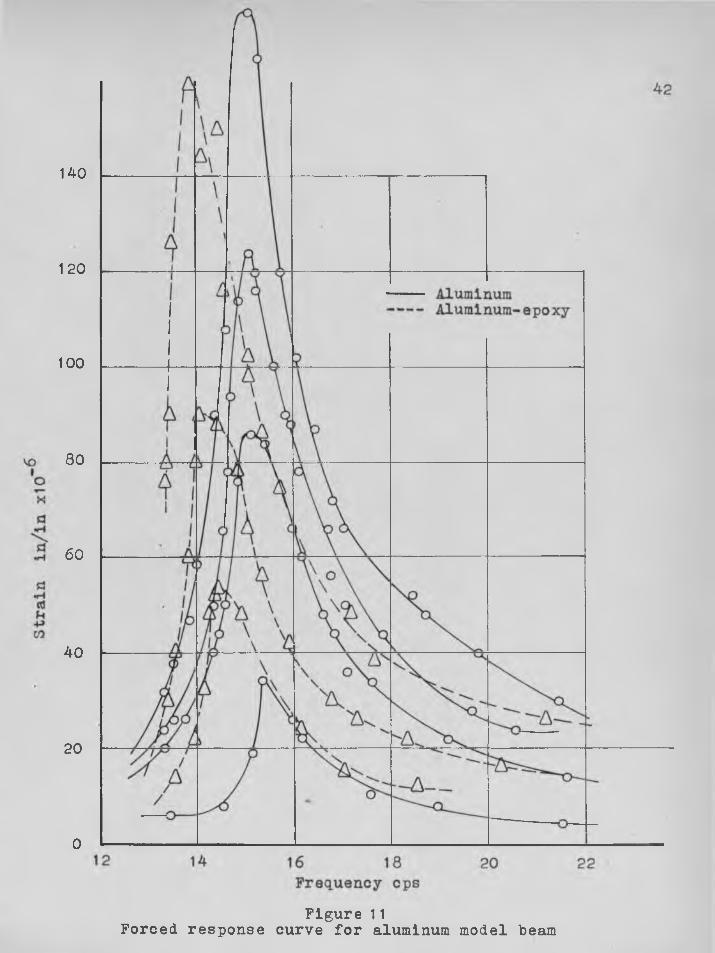
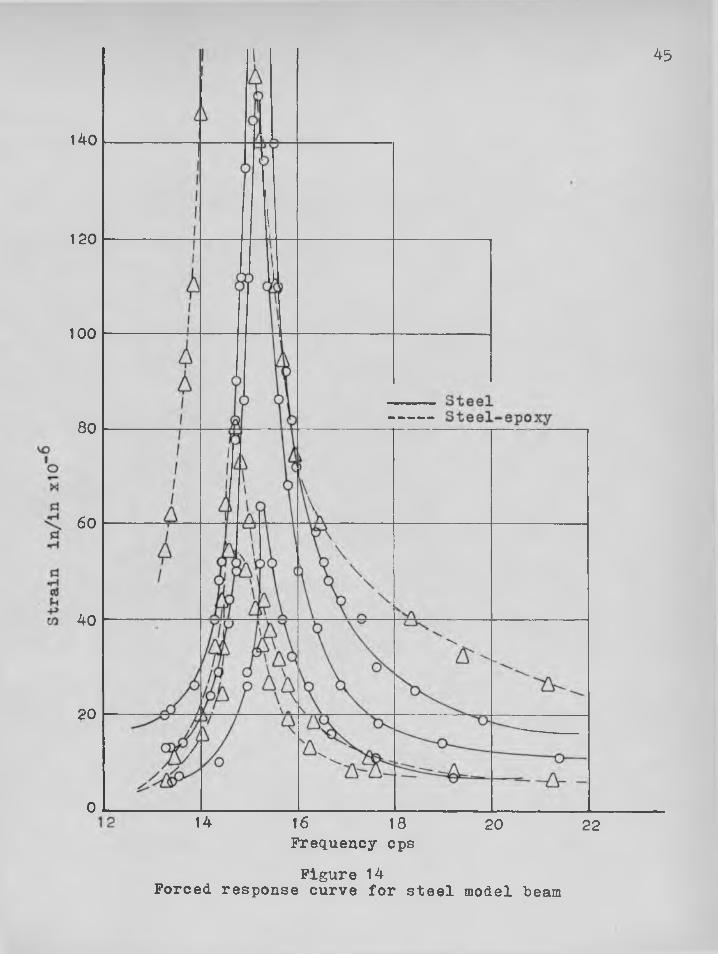
dicates the amount of increased damping. The forced vibration response curves for these beams ,indicates the change in
response which is dependent upon the relative amount of viscoelastic material added to the elastic beam and the
ratio of the dynamic elastic moduli of the two materials. This can be noticed by the magnitudes of the change in the
natural frequency for resonant condition shown in Figures
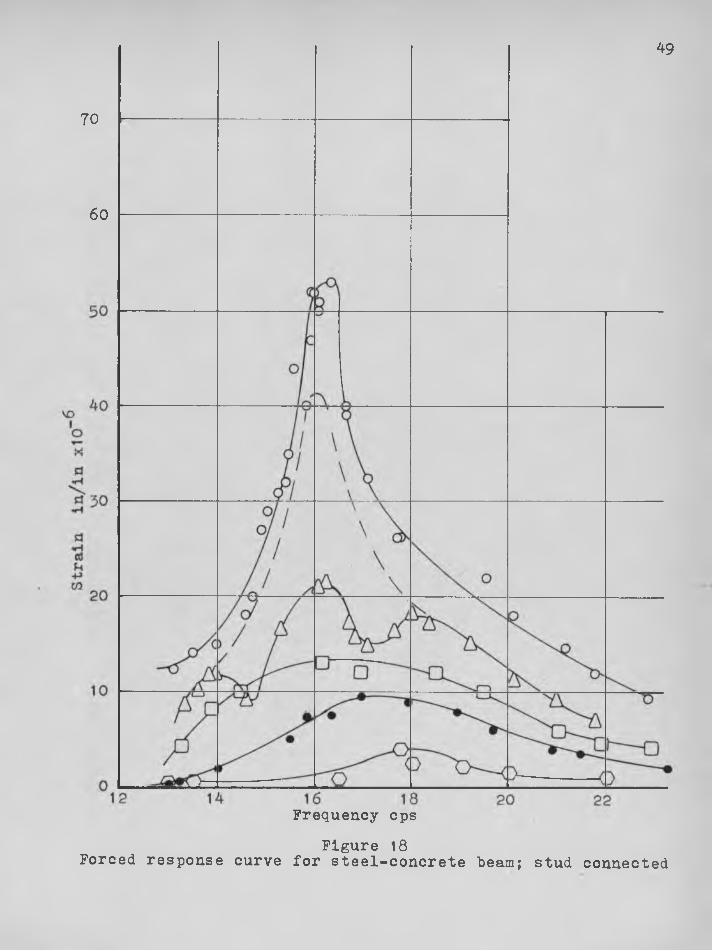
11 and 14. Each different curve in these forced response
figures and in Figures 17 and 18 represents the response
resulting from one magnitude of forcing function. After the magnitude of the forcing function was-increased a new re
sponse curve was obtained. The resulting family of curves
35
indicates the amount of damping at each maximum strain ampli
tude level, and provides an insight into the nonlinearities
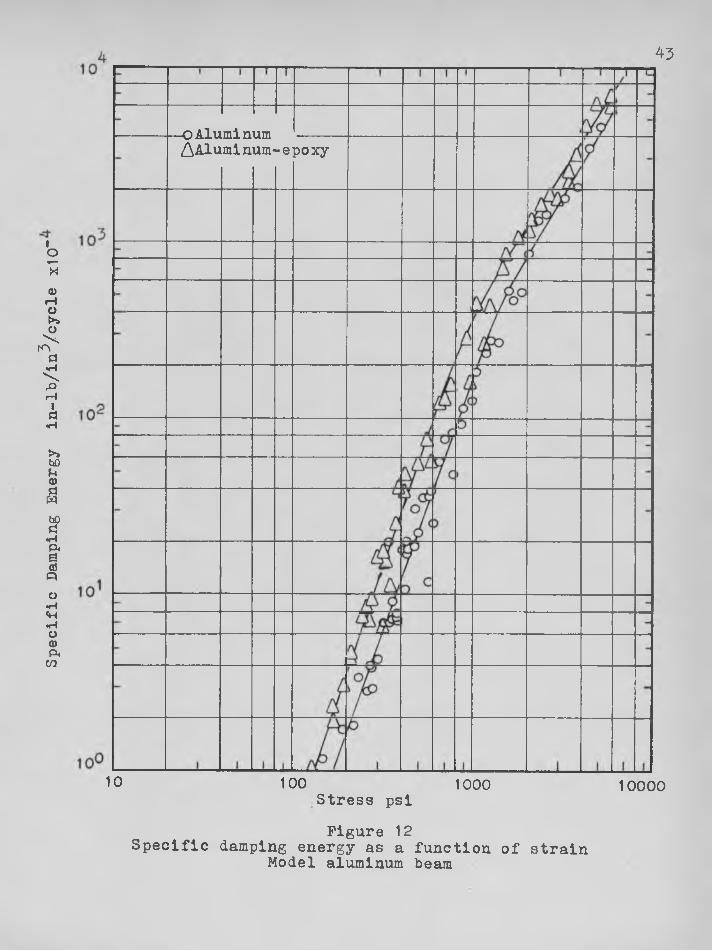
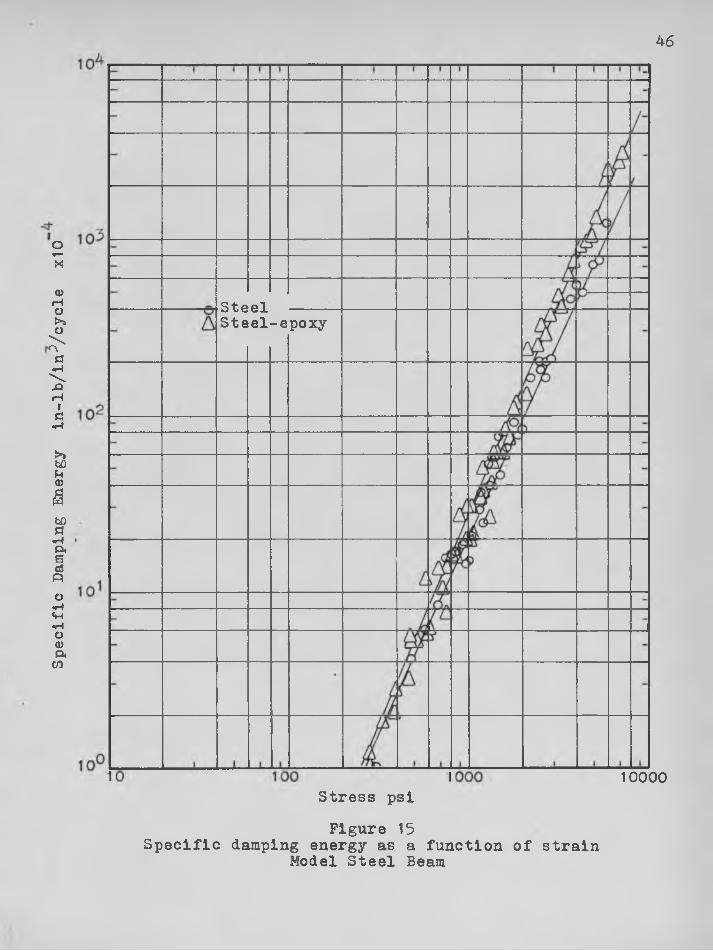
in the systems. The relationship between the specific damp
ing energy and the stress amplitude, D=f( &), as shown in
Figures 12 and 15, indicates that (n) is very close to 3.0
and 2.3 for the aluminum and steel model beams respectively.
The actual experimental values are given in Table IV. The ,=
steel model beam shows a very small increase in the damping
with the addition of the epoxy and thus, a much larger amount of secondary material must be added in order to in
crease the damping in flexure. However, the aluminum beam showed an increase of 50 to 150 percent in its specific damping energy which indicates the strong influence the
epoxy had on the damping. Both specimens had nearly the
same thickness of epoxy added but the eff of the added epoxy
on the stiffness was hardly noticed in the model steel beam.
This action can be clearly seen in Figures 11 and 14 by the
change in the resonant frequencies due to the added material
The model beams, also, demonstrate a slight nonlinearity by
the form of their resonance curves, as shown in Figures 11
and 14. This nonlinearity can be explained by the fact that
at higher strain values the damping has increased as is
shown in Figures 10 and 13, and as is shown in Table I, the
damped natural frequency decreases as the damping Increases.
The shift in the forced vibration response curves after the
addition of epoxy to both model specimens indicates that the
37
added epoxy layer resulted In a decrease In the natural frequency of the beams„ This is the result of the mass of
the beam being increased, by the epoxy without a proportional
increase in the moment of inertia. The ratio of the elastic
moduli of the aluminum and steel beams to the epoxy is ap
proximately 152 and 430 respectively.The results of the prototype beam tests indicates
a definite nonlinear character, as shown in Figures 17 and 18,
in which the peaks of the resonant response curves shift
strongly to the left as the vibrating force Increases. More
over, the experimental response curves of the two beams in
dicate a resonant frequency in the range of 16 to 20 cps, depending upon the amplitude of the forcing function. From a theoretical calculation, which included the composite
action of the concrete, the natural frequency for the first
ipode of vibration should be 26.8 cps. However, the steel
beam alone, with the concrete acting only as a uniform mass,
has a theoretical natural frequency for its first mode of
vibration as a pinned-pinned beam of 16C1 cps which agrees
well with the experimental values obtained. As was indi
cated in the specimen description, these composite beams
had previously been subjected to cyclic loading, therefore,
these beams are the equivalent of actual beams which have
been in service for a long period of time. As a result of the previous history of the beams, cracking had developed
38
in the concrete slab, and therefores during the experimental
studies, the beams responded as though the concrete was
not acting in a fully composite action with the steel portion
of the beam. It is felt that the major factor involved in
obtaining the low natural frequencies, was the cracks in the
concrete. This would have a tendency to decrease the stiff
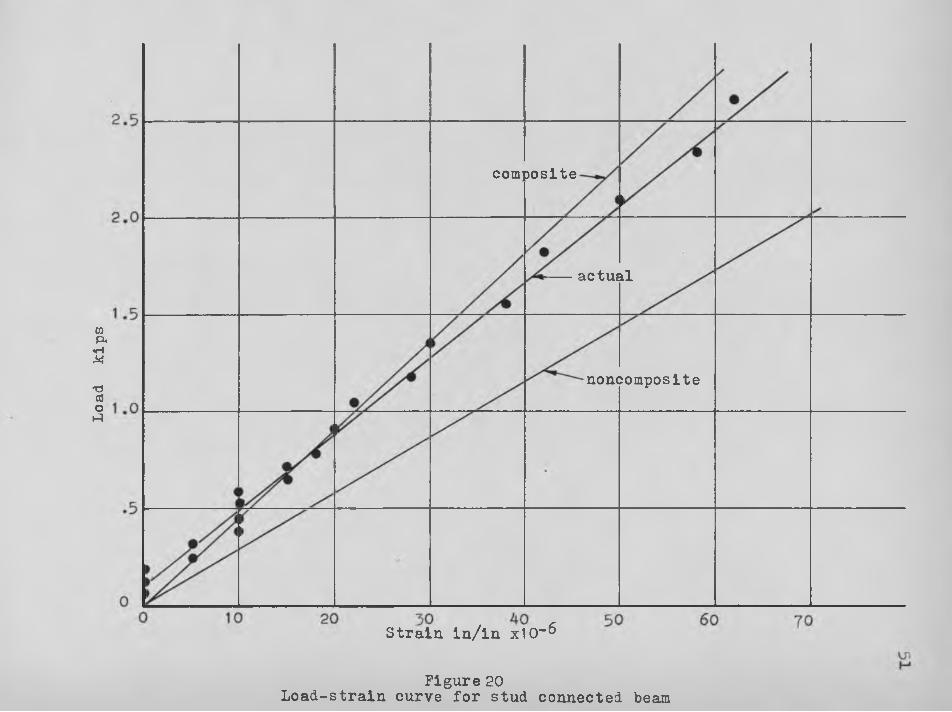
ness of the beam under vibratory loading, although the
results from the static load-deflection curve (Figures 20
and 21) indicate a linear composite system. The nonlinearity
of the forced response results might also be explained by
the decrease in the stiffness resulting from the vibratory
action of the concrete. More specifically, the cracks in the slabs were located in the maximum moment region and
therefore, it is assumed that the strains Induced due to
bending were taken up by these cracks. This caused the
steel beam to act independently of the concrete slab. However, at the low stress values, the constraining variables
which were not yet overcome by the vibration had contributing roles which caused the initial higher resonant frequencies. As these-variables were overcome, the beam began
to act mor® independently of the concrete. The initial support friction and the slippage friction in the stud con
nected beam are thought to be major contributing factors in
the initial softening effect. Ho further investigation was
performed on this phase although further studies in this area
would be desireable. It appears that the prototype beams
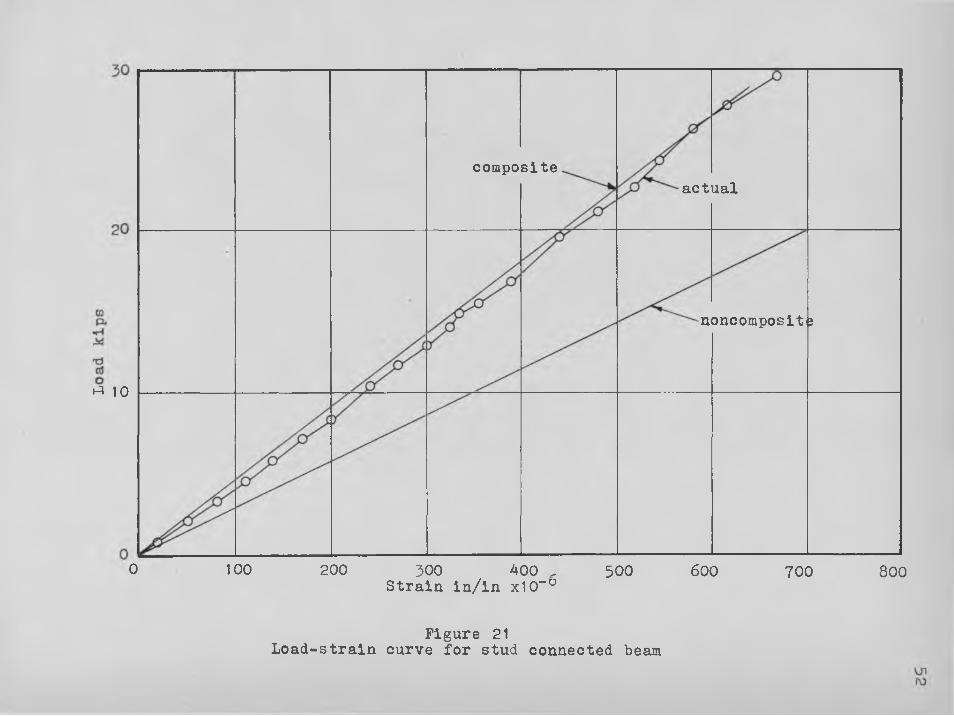
39
are not truly composite but only partly composite and at some,
values noncomposite»
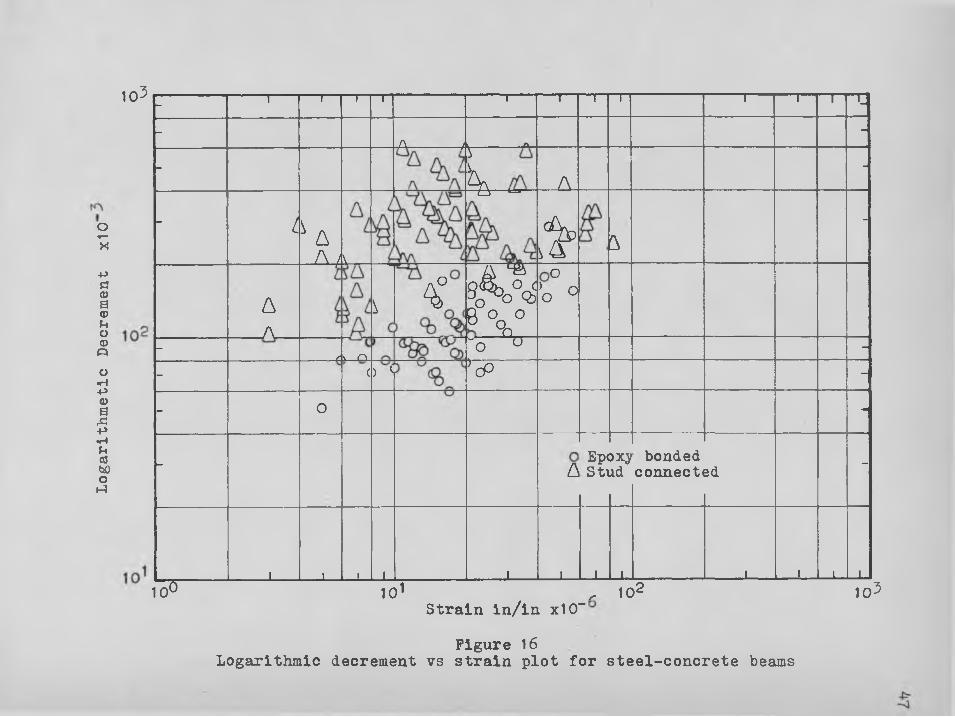
Comparing the two prototype beams9 the studded beam
showed a much greater damping, as shown .in Figure 16, It
was observed by another investigator (3 ), who investigated a composite steel-concrete bridge, that slippage between the
steel and concrete was one of the main factors involved in
contributing to high damping forces, This type of slippage
probably.occurred in the stud beam as a result of the extensive past loading history of the beam and the possibility of considerable microcracking between the two materials,.
some of which could be seen. The epoxy bonded beam, on the
other hand, had lesser movement between the two materials;due
to the apparently sound bonding by the epoxy. The experi
ment performed in this study indicates; that the damping due
to slippage is more predominate than that due to the stiff
ness of the material or the structural system, for the ampli
tudes studied.
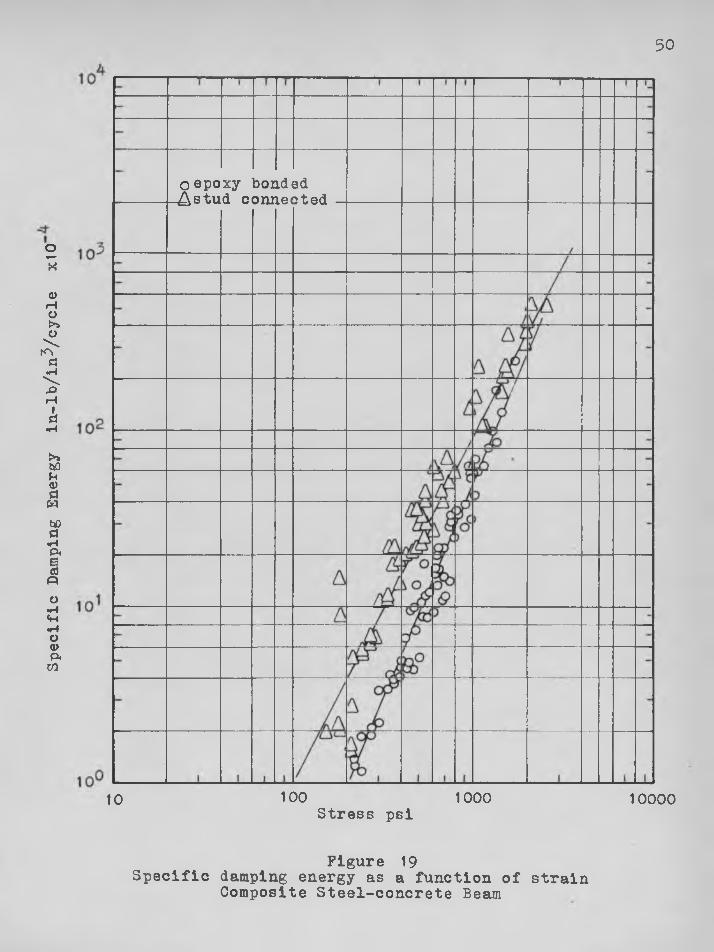
The experimental results shown in Figure 19 indicate
that the specific damping energy is approximately a function of the square of the stress amplitude. This is indicated by
the slope of the curves in Figure 19, which 2.0 and 2.5 for the stud and epoxy bonded beams respectively. The slope of
the curves as determined on the log-log plot of Figure 19 is
the exponent (n) relating the stress to the specific damping
energy. Therefore, an analysis using an equivalent viscous
40
damping would give good results for the low stress range.
The supporting conditions, which were assumed to be simple supports» were not meticulously investigated„ It is
felt the contribution of support damping to the damping of the systems was very minor due to the small rotations and
restrictions of the ends of the beamss for the low stress
region investigated.
Loga
rith
meti
c De
crem
ent
xl0
O aluminum/\ aluminum with bonded epoxy
A /o__p o
10° 101 s 102 103Strain in/in xIO”
Figure 10Logarithmic decrement vs strain plot for the model aluminum beam
140
120
100
80
60
40
20
0
Figure 11Forced response curve for aluminum model beam
Spec
ific
Dam
ping
Ene
rgy
in-l
b/in
Vcyc
le x
lCT
43
O Alum!num ---AAluminum-epoxy
10 100 1000 10000Stress psi
Figure 12Specific damping energy as a function of strain
Model aluminum beam
Loga
rith
meti
c De
crem
ent
xIO
A Steel-epoxy
__ 10Strain In/ln xIO
Figure 13Logarithmic decrement vs strain plot for model steel beam
140
120
100
80
60
40
20
0
45
14 16 18 20 22Frequency cps
Figure 14Forced response curve for steel model beam
Specific D
amping Energy
in-lb/inVcycle
xIO
46
Steel ---Steel-epoxy
10000Stress psiFigure 15
Specific damping energy as a function of strainModel Steel Beam
Loga
rith
meti
c De
crem
ent
xl0
103 - 1 1 l 1 1 1 1 1 ---- 1--- 1 1 L-
A /L A-
- t4 \ A -
- L A A/V
AA 1—
> A-
o
<
\ <A %
90V o i
8 V
0~o!
____
Q__
- _c\ n "o u -
- <) s JcP -
- O -
- A Ep<Sti
DXj/id
bondedconnects3d -
1 i i 1 | 1 1 1 1 i i l10^ mi r 102 ICp
Strain In/ln xIO”
Figure 16Logarithmic decrement vs strain plot for steel-concrete beams
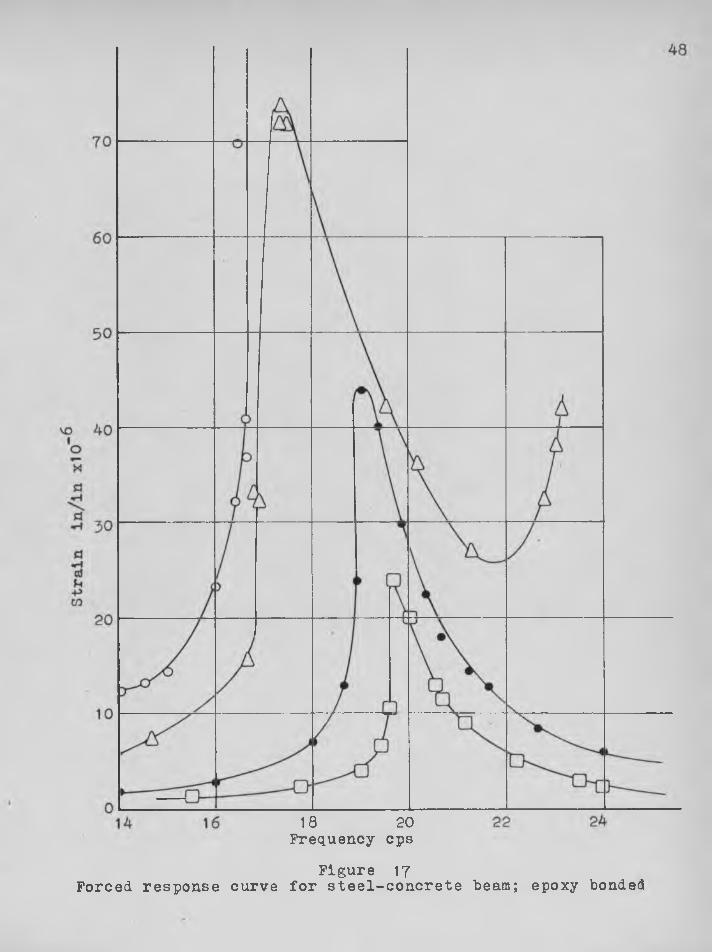
18 20 Frequency cps
Figure 17Forced response curve for steel-concrete beam; epoxy bonded
49
70
60
Frequency cps Figure 18
Forced response curve for steel-concrete beam; stud connected
Specific Damping Energy
in-lb/InVcycle
xIO
50
oepoxy bonded ^stud connected
10 100 1000 10000Stress psl
Figure 19Specific damping energy as a function of strain
Composite Steel-concrete Beam
Load
ki
ps
composite
actual
noncomposite
Strain in/in xIO"^
Figure 20Load-strain curve for stud connected beam
compositeactual
noncompositi?
A 10
0 100 200 300 400 , 500 600 700 800Strain in/in x 10”°
Figure 21Load-strain curve for stud connected beam
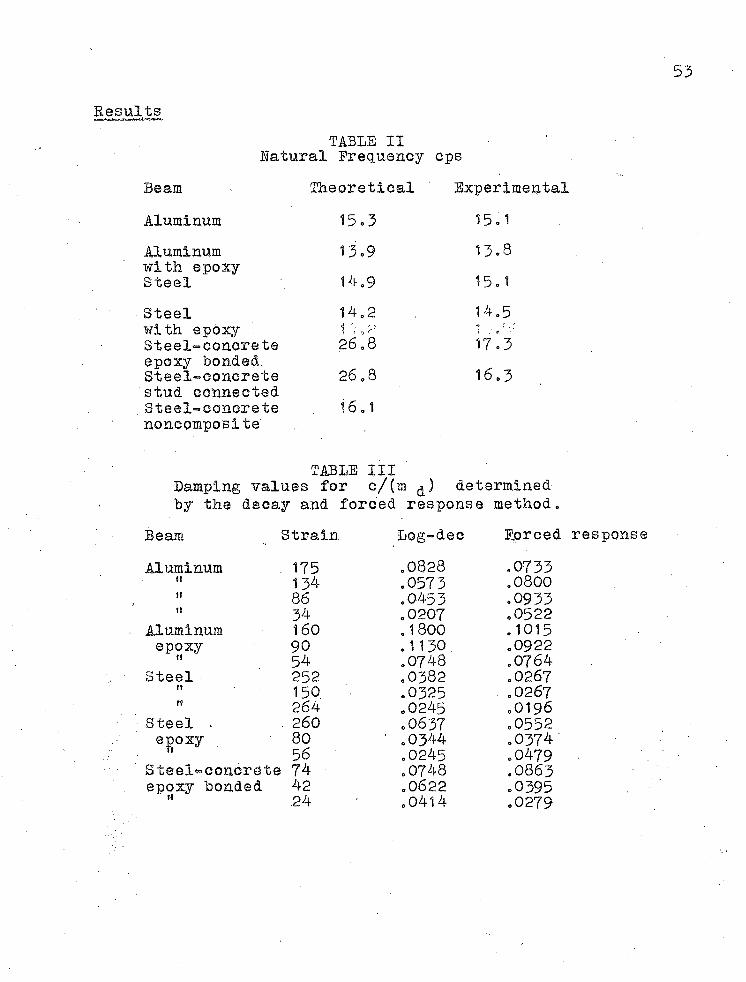
ResultsTABLE II
Natural Frequency opsBeam * Theoretical ' ExperimentalAluminum 15.3 15.1Aluminum 13.9 13.8with epoxy Steel 14.9 15.1
Steel 14.2 14.5with epoxy 1 1Steel-concrete 26.8 17.3epoxy bonded Steel-concrete 26.8 16.3stud connected Steel-concrete 16.1noncomposite
TABLE III 'Damping values for c/(m determined-by the decay and forced response method„
Beam Strain Log-dec Forced
Aluminum . 175 .0828 .0733f t 134 .0573 .0800f t 86 .0453 .0933I f 34 .0207 .0522
Aluminum 160 .1800 .1015epoxy 90 .1130 .0922
M 54 .0748 .0764Steel 252 .0382 .0267
I t 150 .0325 .0267f t 264 .0245 .0196
Steel . . 260 .0637 .0552e^oxy 80 ' .0344 .0374'
56 .0245 .0479S teel*c oner ete: 74 .0748 .0863epoxy bonded 42 .0622 .0395
f t .24 .0414 .0279
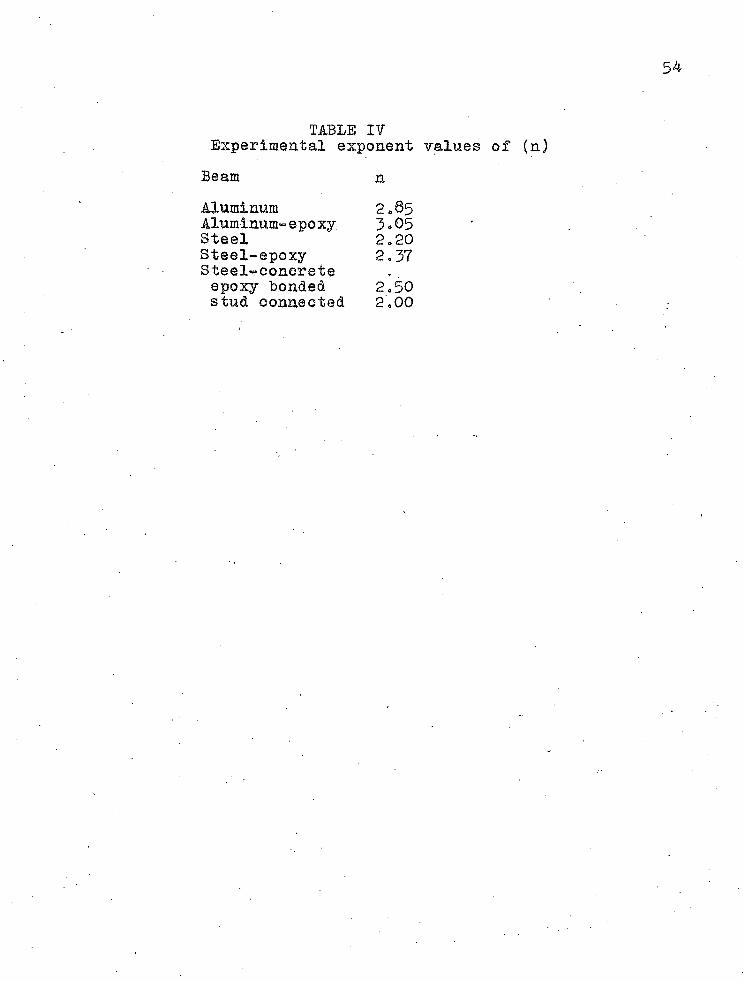
TABLE IVExperimental exponent values of (n)
Beam nAluminum 2.05Aluminum-epoxy 5.05Steel 2.20Steel-epoxy 2.37Steel-conoreteepoxy bonded 2.50stud connected 2.00
55
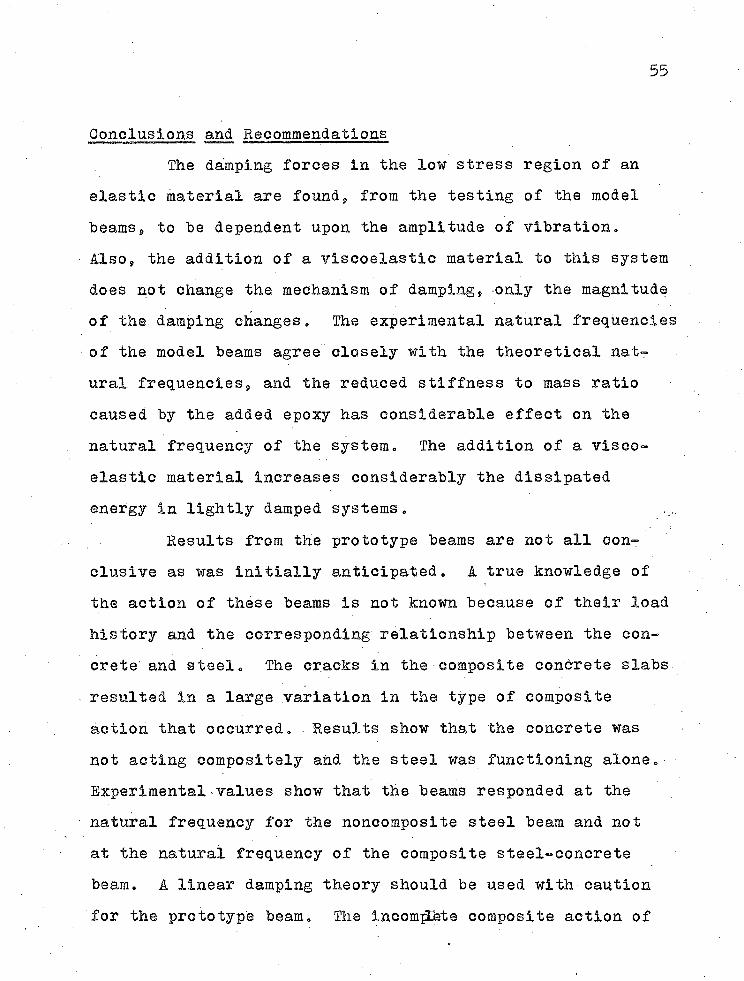
Conclusions and RecommendationsThe damping forces in the low stress region of an
elastic material are found9 from the testing of the model beamsj, to be dependent upon the amplitude of vibration.Also, the addition of a viscoelastic material to this system does not change the mechanism of damping, only the magnitude of the damping changes» The experimental natural frequencies of the model beams agree closely with the theoretical natural frequencies, and the reduced stiffness to mass ratio caused by the added epoxy has considerable effect on the natural frequency of the system. The addition of a viscoelastic material increases considerably the dissipated energy in lightly damped systems.
Results from the prototype beams are not all conclusive as was initially anticipated. A true knowledge of the action of these beams is not known because of their load history and the corresponding relationship between the concrete and steel. The cracks in the composite concrete slabs resulted in a large variation in the type of composite action that occurred. Results show that the concrete was not acting oompositely and the steel was functioning alone. Experimental *values show that the beams responded at the natural frequency for the noncomposite steel beam and not at the natural frequency of the composite steel-concrete beam. A linear damping theory should be used with caution for the prototype beam. The Incomplete composite action of
t
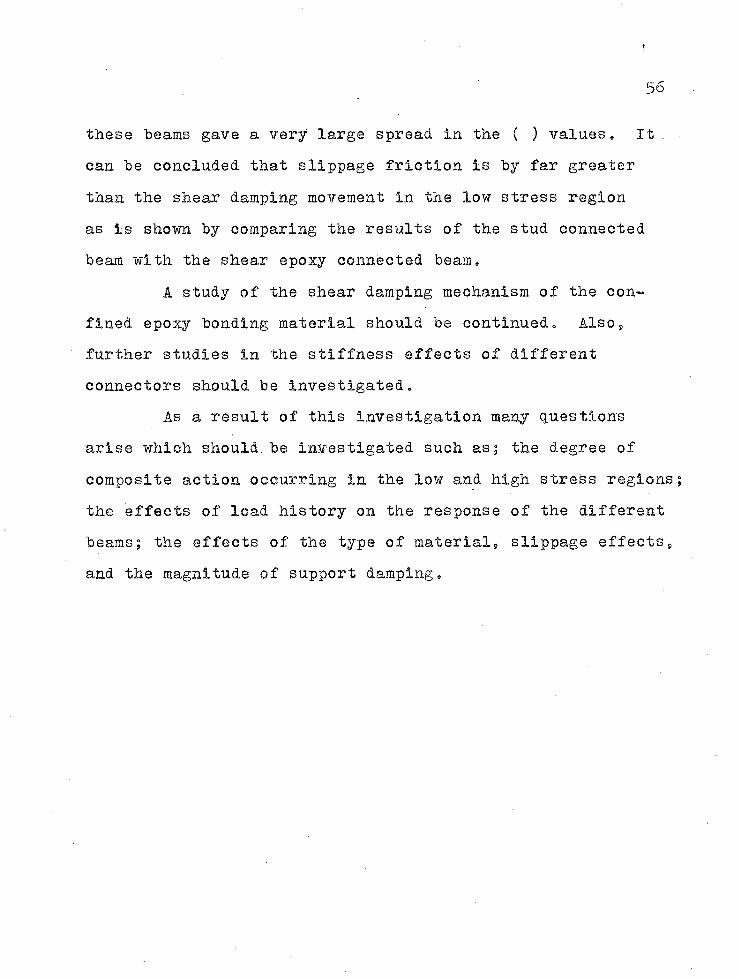
these beams gave a very large spread In the ( ) values. It .
can be concluded that slippage friction is by far greater
than the shear damping movement in the low stress region
as is shown by comparing the results of the stud connected
beam with the shear epoxy connected beam.
A study of the shear damping mechanism of the con
fined epoxy bonding material should be continued. Also9
further studies in the stiffness effects of different
connectors should be investigated.As a result of this investigation many questions
arise which should, be investigated such as; the degree of
composite action occurring in the low and high stress regions;
the effects of load history on the response of the different
beams; the effects of the type of material, slippage effects,
and the magnitude of support damping.
56
57
REFERENCES
1« Bishop, R «, E. D ., 18The Treatment of Damping Forces In Vibration Damping18, Journal of Royal Aeronautical Science, Vol 59s p758^742i, November 1955,
2» Plan, T. H, H., Structural Damping, chapter 5, editedby Crandall, S „ H., "Random Vibration", Technology Press Wiley, 1958, .
3'o? Dederman, A. H,, "Dynamic Test of Two Cantilever TypeDeck Steel Girder Bridges", Nebraska Department of Roads- Bridge:.vDeslgn Section, Lincoln Nebraska, 1961 ,
4, Hulsbos, C, 1,, and Linger, D, A,, "Dynamic Tests of a Three-Span Continuous I-Beam Highway Bridge", Highway Research Board Bulletin 279, Bridge Design Studies and. Piling Test, p28=29, I960,
5= Kimball,. A, L,, "Vibration Prevention In Engineering", John Wiley, New York, pi 16, 1932,
6. Krlegh, J, D,, and Endsbrock, E, G„, "The Use. of Epoxy Resins in Reinforced Concrete", Static Final Progress Report, January 1963; Dynamic Final Progress Report,August 1963, Arizona Transportation and Traffic Institute, The University of Arizona.
7. Lazan, B-. J ., "Damping Properties of Materials and Material Composites", Applied Mechanics Review, Vol 2 No 5, p8l-87, February™” 1962,
8. Lazan, B„ J., Energy Dissipation Mechanisms in Structures with Particular Reference to Material Damping, section I, "Structural Damping", ASME, 1959, Reference 12,
9. Plunkett, P., Measurement of Damping, section V, ^Structural Damping", ASME, 1959, Reference 12.
10. Robertson, J. M., and Yorgiadis, A, J ., "Internal Friction of Engineering Materials", Journal of Applied Mechanics, Vol 13, 1946.
11. Ross, D., Ungar, E. E., and Kerwin Jr., E. M., Damping of Plate Flexual Vibrations by Means of Viscoelastic Laminae, section III, "Structural Damping", ASME, 1959, Reference 12.
58
12. Ruzicka, «T„ E .» "Structural Damping"» Shock and Vibration Committee of The Applied Mechanics Division of ASMS* 1959.
13. Timoshenko, S., "Vibration Problems in Engineering", ; D. Van Nostrand Company, Inc., 3rd edition, 1955.
14. Tong, K, N., "Theory of Mechanical Vibration", John Wiley & Son, Inc., p82-89, I960.
15. Zener, C., "Elasticity and Anelasticity", University of Chicago Press, 1948.

APPENDIX
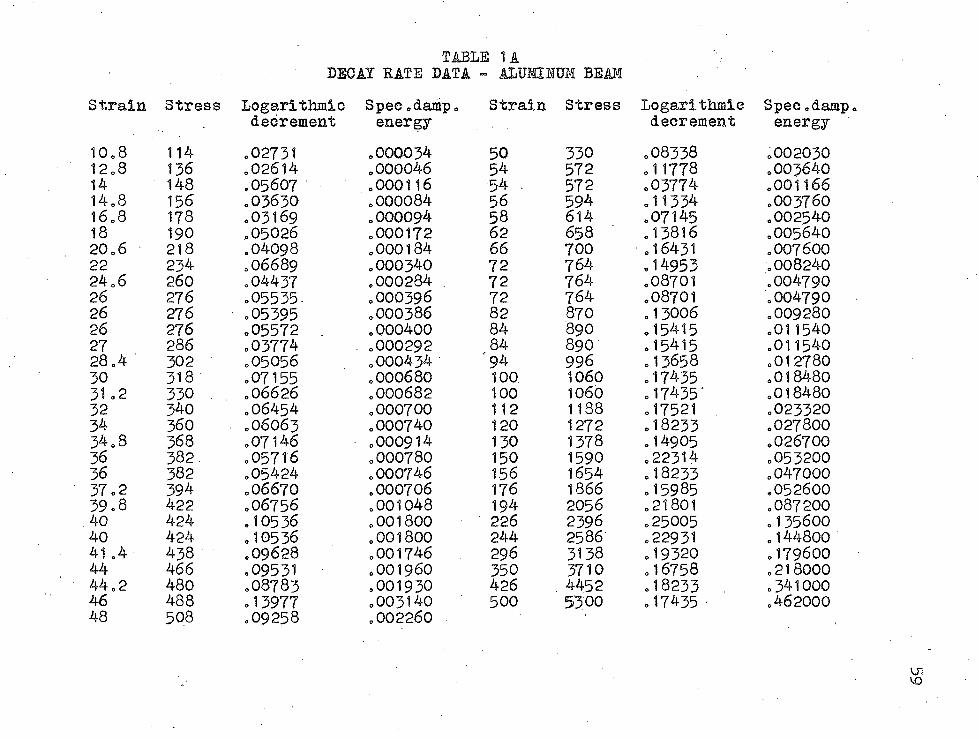
DECAY HATE DATA
Strain Stn
10.8 11412.8 13614 14814.8 15616.8 17818 19020.6 21822 23424.6 26026 27626 27626 27627 28628.4 30230 31831 -2 33032 34034 36034.8 36836 38236 38237.2 39439.8 42240 42440 42441 .4 43844 46644.2 48046 48848 508
Logarithmicdecrement
o02731,02614,05607,03630,03169,05026,04098,06689,04437.05535-o05395.05572.03774.05056.07155.06626.06454 .06063 .07146 .05716 .05424 .06670 .06756 .10536 .10536 .09628 .09531 .08783 . 13977 .09258
Spec.damp, energy
.000034
.000046
.000116
.000084
.000094
.000172
.000184
.000340
.000284 .
.000396
.000386
.000400
.000292
.000434
.000680
.000682
.000700
.000740
.000914
.000780
.000746
.000706 ,001048 .001800 .001800 .001746 .001960 .001930 .003140 .002260
1 AALUMXIUM BEAM
Strain Stress Logarithmicdecrement
Spec.damp energy
50 330 .08338 .00203054 572 .11778 .00364054 . 572 .03774 .00116656 594 .11334 .00376058 614 .07145 .00254062 658 .13816 .00564066 700 .16431 .00760072 764 .14953 ,00824072 764 .08701 .00479072 764 .08701 .00479082 870 .13006 .00928084 890 .15415 .01154084 890 .15415 .01154094 996 .13658 .012780100. 1060 .17435 .018480100 1060 .17435 .018480112 1188 .17521 .023320120 1272 .18233 .027800130 1378 .14905 .026700150 1590 .22314 .053200156 1654 .18233 .047000176 1866 .15985 .052600194 2056 .21801 .087200226 2396 .25005 .135600244 2586 .22931 .144800296 3138 .19320 .179600350 3710 .16758 .218000426 . 4452 .18233 .341000500 5300 .17435 ■ .462000
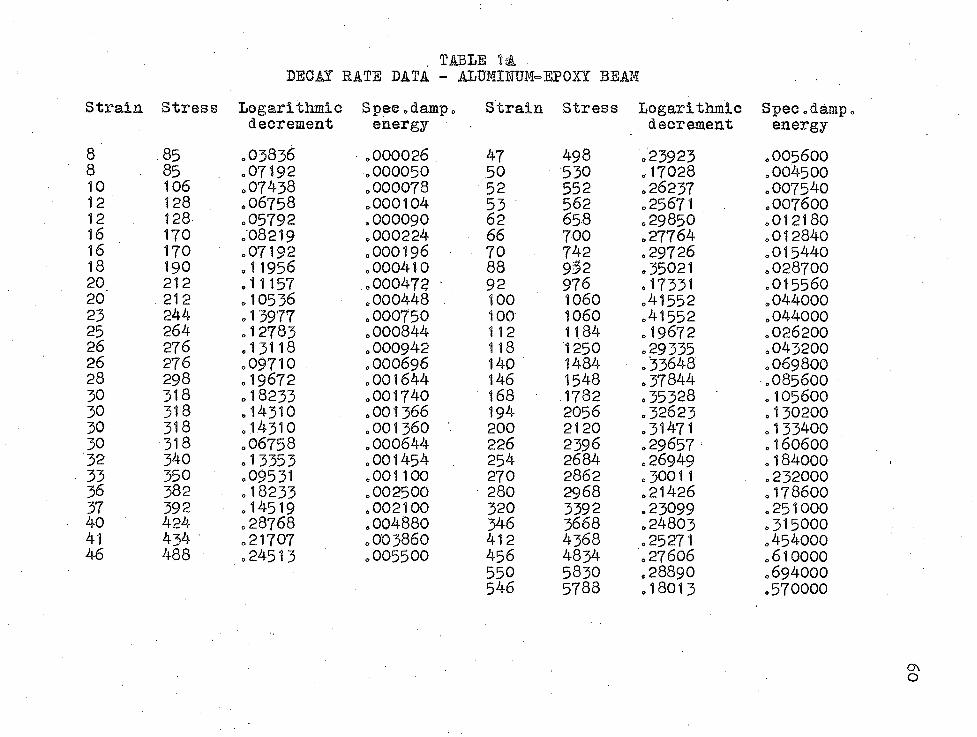
. TABLE 14DECAY RATE DATA - ALU1IZUM-
Strain Stress Logarithmicdecrement
Spec.damp= energy
Strain
8 85 „03836 .000026 478 85 *07192 =000050 5010 106 =07438 =000078 5212 128 =06758 =000104 5312 128 =05792 = 000090 6216 170 =08219 =000224 6616 170 =07192 =000196 7018 190 =11956 =000410 8820 212 =11157 =000472 9220 212 =10536 =000448 10023 244 = 13977 =000750 10025 264 =12783 =000844 11226 276 =13118 =000942 11826 276 =09710 .OOO696 14028 298 =19672 =001644 14630 318 =18233 .001740 16830 318 .14310 =001366 19430 318 =14310 =001360 ' 20030 318 =06758 =000644 22632 340 =13353 =001454 25433 350 =09531 .001100 27036 382 =18233 =002500 28037 392 =14519 =002100 32040 424 =28768 .004880 34641 434 =21707 =003860 41246 488 =24513 .005500 456
550546
BEAM
Stress Logarithmic . decrement
Spec.damp energy
498 =23923 =005600530 .17028 =004500552 .26237 =007540562 =25671 =007600658 =29850 =012180700 =27764 =012840742 =29726 =0154409.S2 =35021 =028700976 =17331 =0155601060 =41552 =0440001060 =41552 =0440001184 =19672 =0262001250 =29335 =0432001484 =33648 =0698001548 =37844 =0856001782 .35328 • =1056002056 =32623 .1302002120 =31471 =133400 .2396 =29657 =1606002684 =26949 =1840002862 =30011 = 2320002968 =21426 =1786003392 =23099 =2510003668 =24803 =3150004368 =25271 .4540004834 ,27606 =6100005830 =28890 =6940005788 =18013 .570000
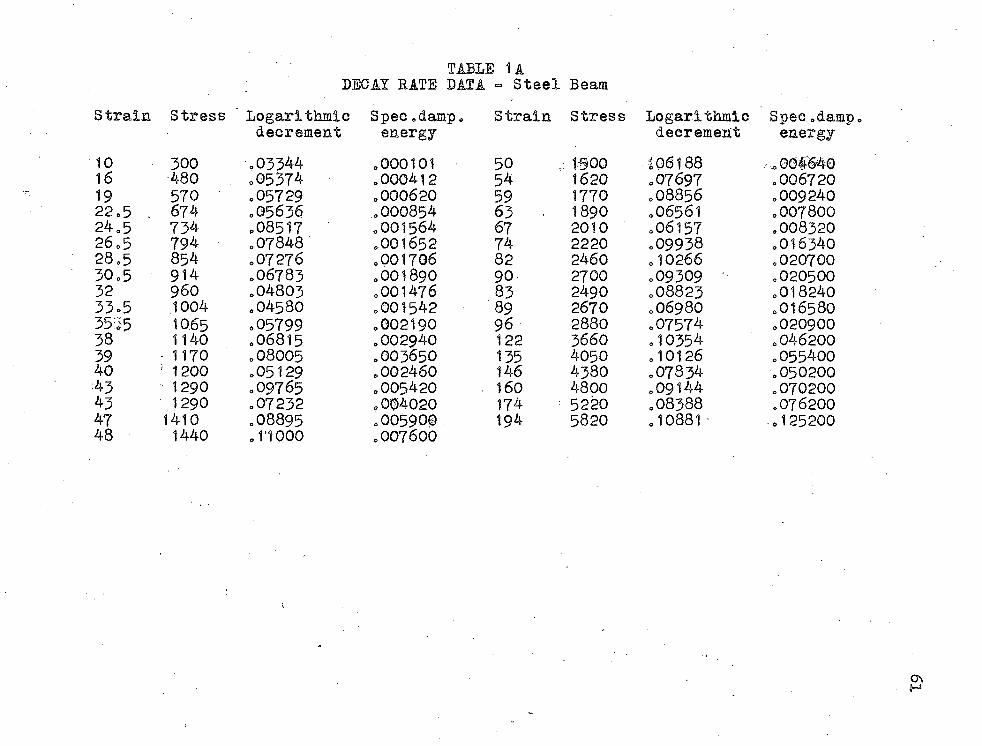
TABLE 1ADECAY RATE DATA - Steel Beam
Strain Stress Logarithmic Spec.damp. Strain Stress Logarithmic Spec.dampdecrement energy decrement energy
10 300 .03344 .000101 50 . 1900 106188 .00464016 480 .05374 .000412 54 1620 .07697 .00672019 570 .05729 .000620 59 1770 .08856 .00924022.5 . 674 .05636 .000854 63 1890 .06561 .00780024.5 734 .08517 .001564 67 2010 .06157 .00832026.5 794 .07848 .001652 74 2220 .09938 .01634028.5 854 .07276 .001706 82 2460 .10266 .02070030.5 914 .06783 .001890 90 2700 .09309 .02050032 960 .04803 .001476 83 2490 .08823 .01824033.5 1004 .04580 .001542 89 2670 .O698O .01658035S5 1065 005799 .002190 96 2880 .07574 .02090038 1140 .06815 .002940 122 3660 .10354 .04620039 1170 .08005 .003650 135 4050 .10126 .05540040 ' 1200 .05129 .002460 146 4380 .07834 .05020043 1290 009765 .005420 160 4800 .09144 .07020043 1290 .07232 .004020 174 5220 .08388 .07620047 1410 .08895 .OO59OS 194 5820 .10881 - .12520048 1440 .11000 .007600
St]
557799111113131516161719202022242424252627293032323434
3636
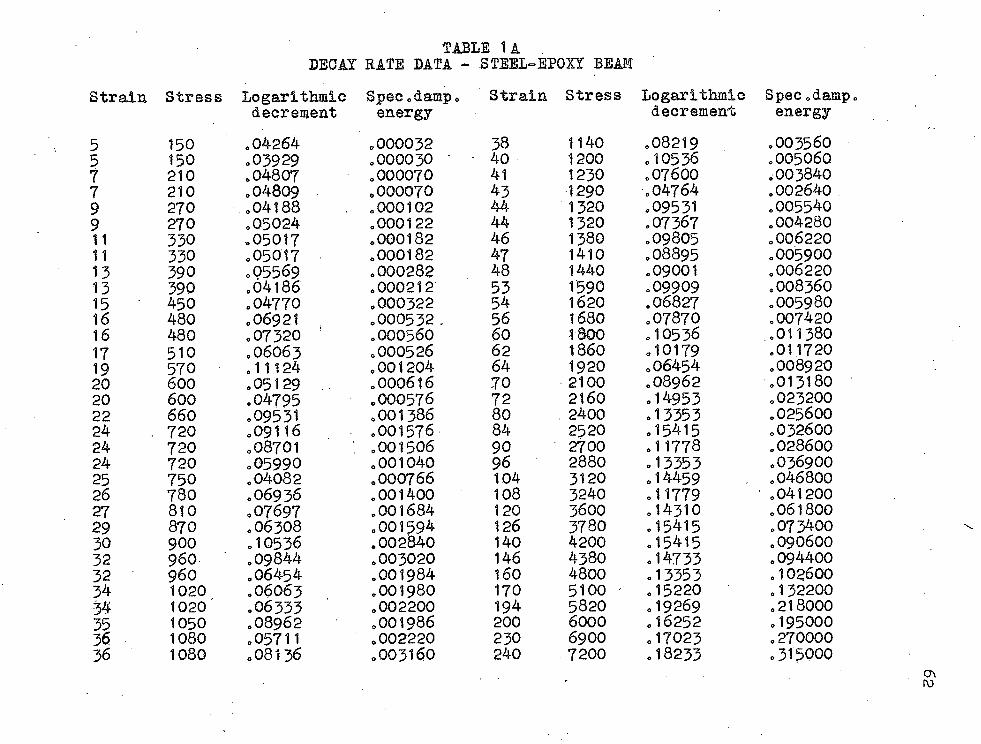
TABLE 1 A .DECAY RATE DATA - STEEL-EPOXY BEAM
Stress Logarithmic Spec.damp. Strain Stress Logarithmic Spec.dampdecrement energy decrement energy
150 .04264 .000032 38 1140 .08219 .003560150 .03929 .000030 40 1200 .10536 .005060210 .04807 .000070 41 1230 .07600 .003840210 .04809 .000070 43 1290 .04764 .002640270 .04188 .000102 44 1320 .09531 .005540270 .05024 .000122 44 1320 .07367 .004280330 .05017 .000182 46 1380 .09805 .006220330 .05017 .000182 47 1410 .08895 .005900390 .05569 .000282 48 1440 .09001 .006220390 .04186 .000212 53 1590 .09909 .008360450 .04770 .000322 54 1620 .06827 .005980480 .06921 .000532 .. 56 1680 .07870 .007420480 .07320 .000560 60 iSOO .10536 .011380510 .06063 .000526 62 1860 .10179 .011720570 .11124 .001204 64 1920 .06454 .008920600 .05129 .000616 70 2100 .08962 .013180600 .04795 .000576 72 2160 .14953 .023200660 .09531 .001386 80 . 2400 .13353 .025600720 .09116 .001576 84 2520 .15415 .032600720 .08701 .001506 90 2700 .11778 .028600720 .05990 .001040 96 2880 .13353 .036900750 .04082 .000766 104 3120 .14459 .046800780 .06936 .001400 108 3240 .11779 .041200810 .07697 .001684 120 3600 .14310 .061800870 .06308 .001594 126 3780 .15415 .073400900 .10536 .002540 140 4200 .15415 .090600960 .09844 .003020 146 4380 .14733 .094400960 .06454 .001984 160 4800 .13353 .1026001020 .06063 .001980 170 5100 • .15220 .1322001020 .06333 .002200 194 5820 .19269 .2180001050 .08962 .001986 200 6000 .16252 .1950001080 .05711 .002220 230 6900 .17023 .2700001080 .08136 .003160 240 7200 .18233 .315000
o\ro
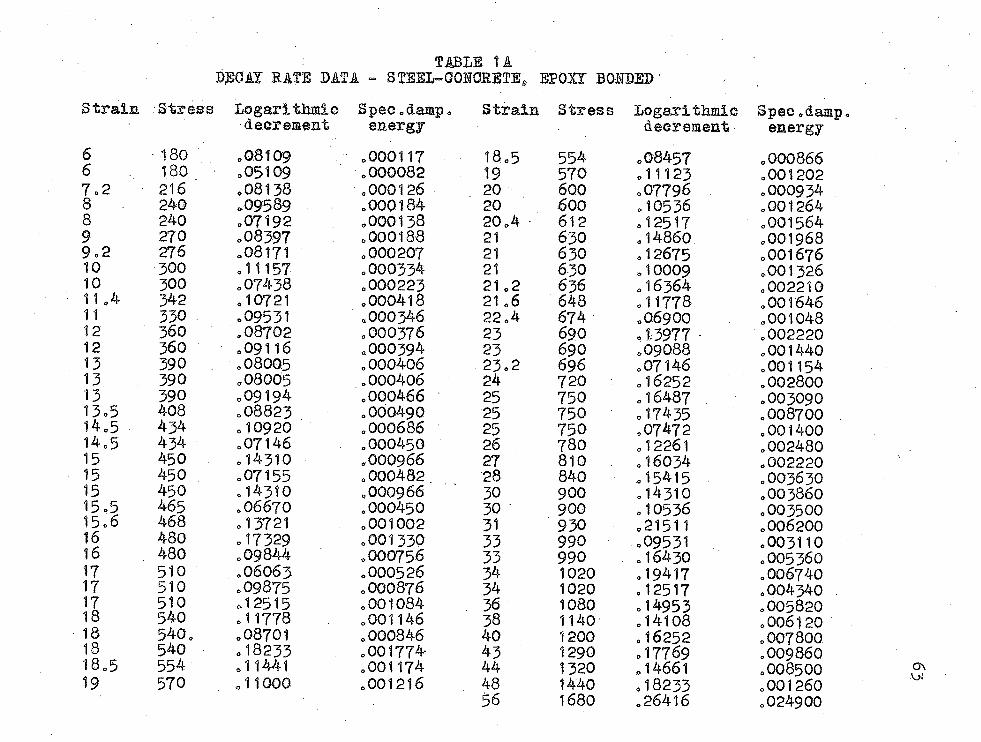
f JSIil tADECAY HAYE DATA - STEEL~COHCRETEg EPOXY BONDED'
Strain Stress Logarithmie Spec.damp. Strain Stress Logarithmic Spec.dampdecrement energy decrement energy
6 180 ,08109 .000117 18.5 554 ,08457 .0008666 180 .05109 .000082 19 570 .11123 .0012027,2 216 ,08138 .000126 20 600 .07796 .0009348 240 .09589 .000184 20 600 .10536 .0012648 240 .07192 .000138 20.4 - 612 .12517 .0015649 270 .08397 .000188 21 630 ,14860 .0019689,2 276 .08171 .000207 21 630 .12675 .00167610 300 .11157 .000334 21 6-30 .10009 .00132610 300 .07438 .000223 21.2 636 .16364 .00221011,4 342 .10721 .000418 21 .6 648 .11778 .00164611 330 .09531 ,000346 22.4 674 .06900 .00104812 360 .08702 ,000376 23 690 ,13977 .00222012 360 .09116 .000394 23 690 .09088 .00144013 390 .08005 .000406 23.2 696 .07146 .00115413 390 .08005 .000406 24 720 .16252 .00280013 390 ,09194 .000466 25 750 .16487 .00309013,5 408 .08823 .000490 25 750 .17435 .00870014,5 434 .10920 .000686 25 750 .07472 .00140014,5 434 ,07146 ,000450 26 780 .12261 .00248015 450 .14310 ,000966 27 810 .16034 .00222015 450 .07155 .000482 28 840 .15415 .00363015 450 .14310 ,000966 30 900 .14310 .00386015,5 465 .06670 .000450 30 900 .10536 .00350015,6 468 . 13721 .001002 31 930 ,21511 .00620016 480 .17329 .001330 33 990 .09531 .00311016 480 .09844 ,000756 33 990 .16430 .00536017 510 .06063 .000526 34 1020 .19417 .00674017 510 .09875 ,000876 34 1020 .12517 .00434017 510 .12515 .001084 . 36 1080 .14953 ,00582018 540 .11778 .001146 38 1140 .14108 .00612018 540, .08701 .000846 40 1200 .16252 ,00780018 540 .18233 .001774 43 1290 .17769 .00986018,5 554 .11441 .001174 44 1320 .14661 .00850019 570 .11000 .001216 48 1440 .18233 .00126056 1680 .26416 .024900
V3 VO
00 CD
Co -0 -O
-4 -O
-O CA
On Ch O
xui V
j Vj
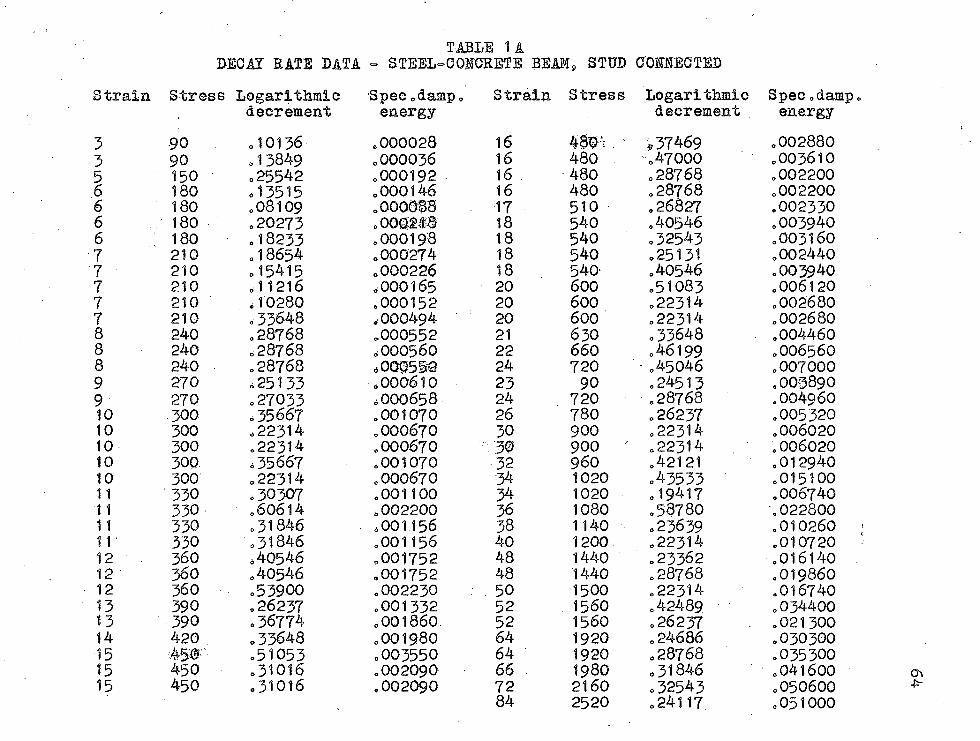
DECAY RATE DATA - STEEL-TABLE "CONCRETE
Strain
10 10 1 0 -
10 10 11 11 11 11 12 12 12 13131415 15 15
Stress Logarithmic Spec,damp. Straindecrement energy
90 o10136 ,000028 1690 . 13849 ,000036 16150 - =25542 ,000192 16180 =13515 ,000146 16180 ,08109 ,000088 17180 ,20273 ,000# # 18180 ,18233 ,000198 18210 ,18654 ,000274 18210 =15415 ,000226 18210 ,11216 ,000165 20210 ,10280 .000152 20210 ,33648 ,000494 20240 ,28768 ,000552 21240 ,28768 ,000560 22240 ,28768 ,000532 24270 «; 25133 ,000610 23270 ,27033 ,000658 24300 ,35667 .001070 26300 ,22314 ,000670 30300 ,22314 ,000670 ".'30300 ,35667 ,001070 •32300 ,22314 .000670 34330 ,30307 .001100 34330 ,60614 .002200 36330 ,31846 .001156 38330 ,31846 .001156 40360 ,40546 ,001752 48360 ,40546 .001752 48360 ,53900 .002230 : . 50390 ,26237 ,001332 52390 .36774 ,001860. 52420 ,33648 ,001980 64##"' ,51053 ,003550 64450 ,31016 .OO2O9O 66 .450 ,31016 .002090 72
84
9 STUD COraBOTED
Stress Logarithmic Spec.dampdecrement energy
48W: . ' *37469 .002880480 .47000 .003610480 .28768 .002200480 .28768 .002200510 .26827 .002330540 .40546 .003940540 ,32543 .003160540 .25131 .002440540 .40546 .003940600 .51083 .006120600 .22314 .002680600 .22314 .002680630 .33648 .004460660 .46199 .006560720 •.45046 .00700090 .24513 .009890
720 .28768 .004960780 .26237 .005320900 .22314 .006020900 ' .22314 .006020960 .42121 .0129401020 .43533 .0151001020 .19417 .0067401080 .58780 .0228001140 =23639 .0102601200 .22314 .0107201440 .23362 .0161401440 .28768 .0198601500 .22314 .0167401560 .42489 .0344001560 .26237 .0213001920 .24686 .0303001920 ,28768 .0353001980 .31846 .0416002160 =32543 .0506002520 .24117 .051000
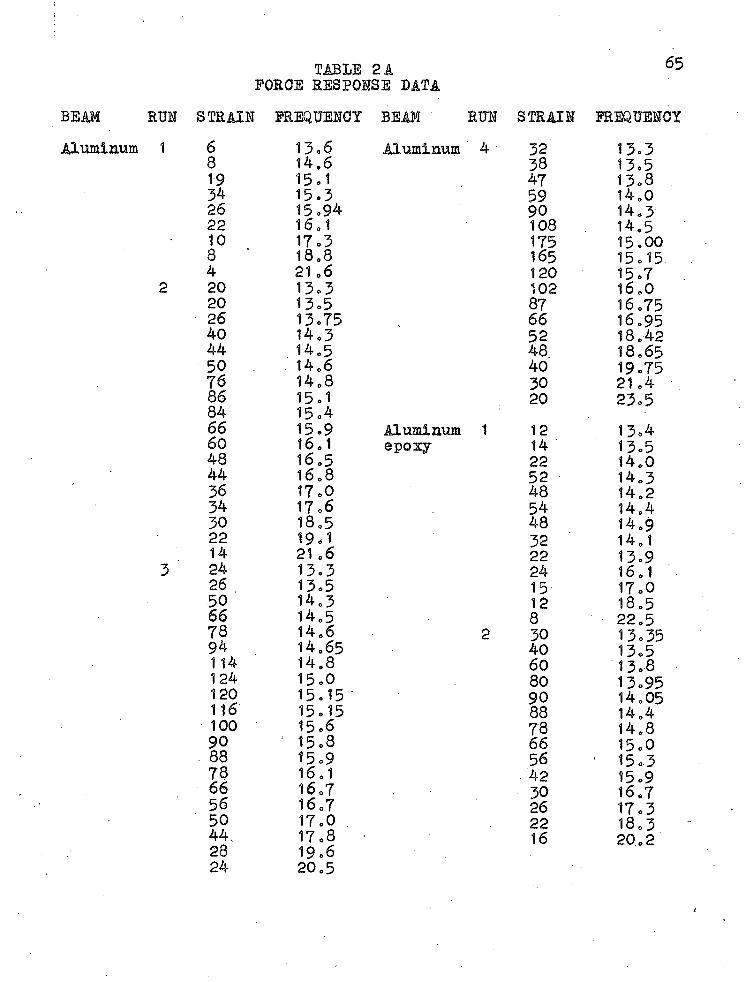
TABLE 2 AFORCE RESPOESE DATA
65
BEAM RUE STRAII FREQUENCY BEAM RUN STRAIN FREQUENCYAluminum 1 6 13,6 Aluminum 4 32 13.3
8 14.6 38 13.519 15,1 47 13.834 15,3 59 14.026 15,94 90 14.322 16.1 108 14.510 17,3 175 15.008 * 18.8 165 15.154 21.6 120 15.7
2 20 13,3 102 16.020 13,5 87 16.7526 13,75 66 16.9540 14.3 52 18.4244 14.5 48 18.6550 14.6 40 19.7576 14.8 30 21.486 15,1 20 23.584 15,466 15.9 Aluminum 1 12 13.460 16.1 epoxy 14 13.548 16.5 22 14.044 16.8 52 14.336 17.0 48 14.234 17.6 54 14.430 18.5 48 14.922 19,1 32 14.114 21.6 22 13.9
3 24 13.3 24 16.126 13.5 15 17.050 14.3 12 18.566 14.5 8 22.578 14.6 2 30 13.3594 14.65 40 13=5114 14.8 60 13.8124 15.0 80 13.95120 15.15 ' 90 14.05116 15.15 88 14.4100 15.6 78 14.890 ' 15.8 66 15.088 15.9 56 ' 15.379 16.1 • 42 15.966 16.7 30 16.756 16.7 26 17.350 17.0 22 18.344, 17=8 16 20.228 19.624 20.5
66
Aluminumepoxy.
BEAM
Steel
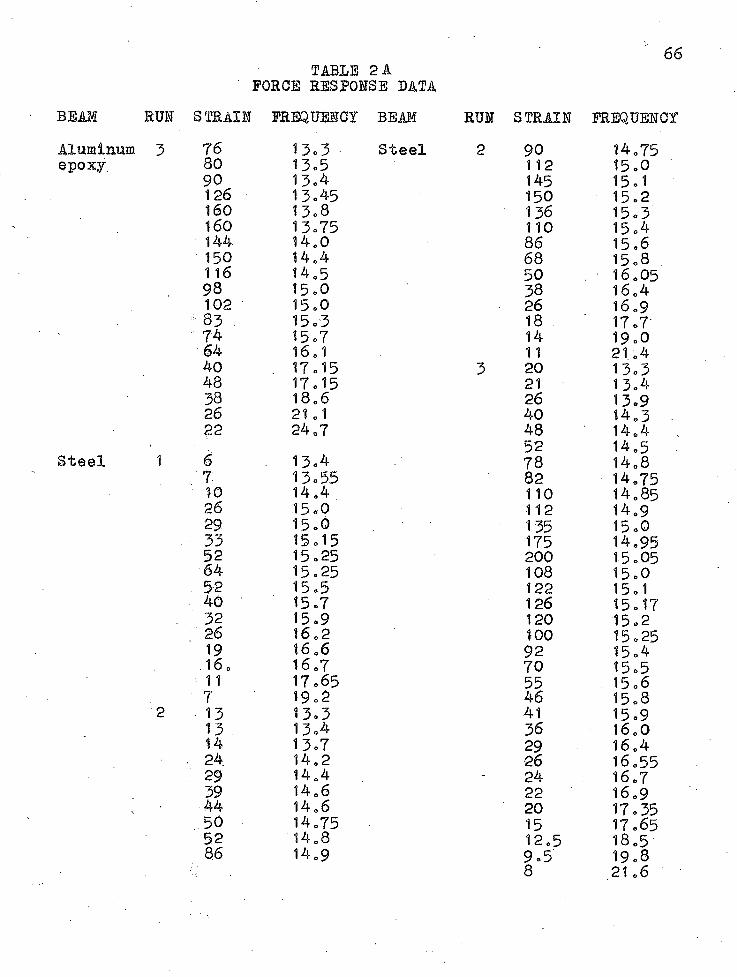
TABLE 2 AFORCE RESPONSE DATA
RUN STRAIN FREQUENCY BEAM RUN STRAIN FREQUENCY
80 90 126 160 160 144 150 116 98 102
4 83 74 64 40 4838 26 22
1 6 . T 10 26 29
■ 33 52 64
. 52 40 32 26 19 16. 11 7
2 13II24
: 2939 44 50 52 86
13-3 Steel13-513-413-4513.813-7514.014.414.5 15-0 15-015.3 15-716.1 17.15 17-1518.6 21-124.713-413-5514.4 15-0 15.0 15-15 15-25 15.25 15-5 15-7 15-9 16.2 16.616.7 17.65 19-213.3 13-4 13-7 14.214.414.614.6 14.7514.814.9
90 14.75112 15.0145 15-1150 15.2136 15.3110 15-486 15-668 15-850 16.0538 16.426 16.918 17.714 19.011 21.420 13.321 13.426 13.940 14.348 14.452 14.578 14.882 14.75110 14.85112 14.9135 15.0175 14-95200 15.05108 15-0122 15-1126 15.17120 15.2100 15-2592 15-470 15.555 15.646 15-841 15-936 16.029 16.426 16.5524 16.722 16.920 17.3515 17.6512.5 18.59.5 19-88 21.6
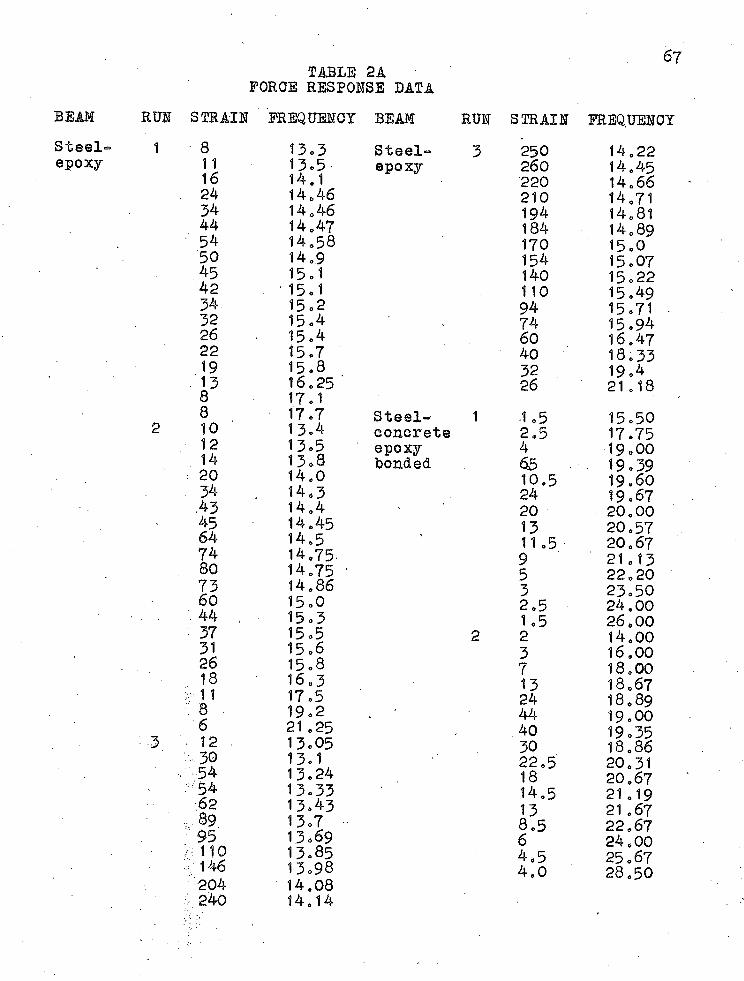
TABLE 21FORGE RESPONSE DATA
67
Steel=epoxy
BEAM RUN STRAIN FREQUENCY1
2
: 3
8 13 = 311 13 = 516 14.1
. 24 14.4634 14.4644 14.4754 14.5850 14.945 15 = 142 •15 = 134 15 = 232 15=426 15=422 15=7
. 1 9 15.813 16.258 17 = 18 17=710 13 = 412 13=514 13 = 8
: 20 14.034 14.3.43 14.445 14.4564 14.574 14.7580 14.7573 14.8660 15=044 , 15 = 337 15=531 15=626 15.818 16.3
> 11 17=5: 8 . 19 = 26 21 .2512 13.0530 13=154 13.2454 13.33,62 13 = 43
,89 13=795 13=69
/ 110 13 = 85146 13=98204 14.08
■ 240 1 4 . 1 4
BEAM RUN STRAIN FREQUENCYSteel” 3 250 14.22epoxy 260 14.45
220 14.66210 14.71194 14.81184 14.89170 15=0154 15 = 07140 15 = 22110 15=4994 15=71 -74 15.9460 16.4740 18.3332 19.426 21.18
Steel” 1 1 =5 15 = 50concrete 2.5 17=75epoxy 4 19=00bonded 65 19 = 39
10.5 19 = 6024 19 = 6720 20.0013 20 = 5711=5 20.679 21.135 22.203 23 = 502 = 5 24.001 =5 26.00
2 2 14.003 16.007 18.0013 18.6724 18.8944 19 = 00.40 19=3530 18.8622.5 20.3118 20.6714.5 21.1913 21 .678.5 22.676 24.004.5 25=674.0 28.50
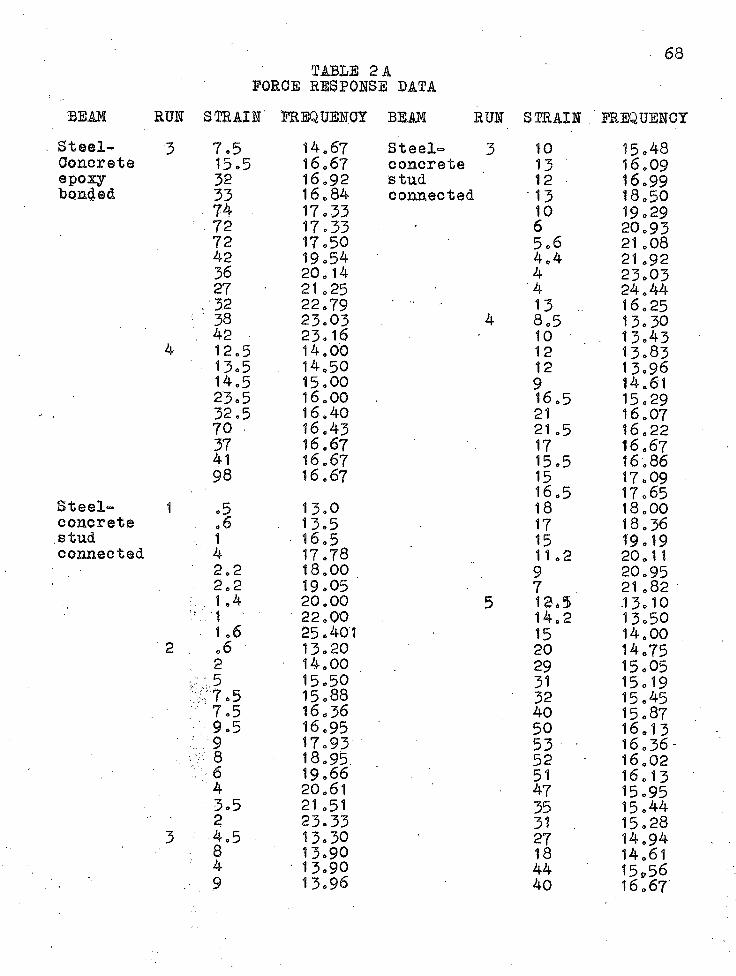
TABLE 2 AFORGE RESPONSE DATA
68
BEAM RUN STRAIN FREQUENCY BEAM RUN STRAIN FREQUENCYSteel- ■3 7.5 14.67 Steel- 3 10 15.48Concrete 15.5 16.67 concrete 13 16.09epoxy 32 16.92 s tud 12 16.99bonded 33 16.84 connected 13 18.50
74 17.33 10 19.2972 17.33 ' 6 20.9372 17.50 5.6 21 .0842 19.54 4.4 21 .9236 20.14 4 23.0327 21 .25 4 24.44
.32 22.79 13 . 16.2538 23.03 4 8.5 13.30
. 42 23.16 10 13.434 12.5 14.00 12 13.8313.5 14.50 12 13.9614.5 15.00 9 14.6123.5 16.00 16.5 15.2932.5 16.40 21 16.0770 16.43 21 .5 16.2237 16.67 17 16.6741 16.67 15.5 16.8698 16.67 15 17.09
16.5 17.65Steel- 1 .5 13.0 18 18.00concrete .6 13.5 17 18.36stud 1 16.5 15 19.19connected 4 17.78 11.2 20.11
2.2 18.00 9 20.952.2 19.05 7 21.82. 1.4 20.00 5 12.5 13.101 ' 22.00 14.2 13.501.6 25.401 15 14.00
2 .6 13.20 20 14.752 14.00 29 15.05k ..;5 15.50 31 15.19v 7.5 15.88 32 15.457.5 16.36 40 15.879.5 16.95 50 16.13
: 9 17.93 53 • 16.36-8 18.95. 52 16.026 19.66 51 16.134 20.61 47 15.953.5 21.51 35 15.442 23.33 31 15,28
3 4.5 13.30 27 14.948 13.90 18 14.614 '13.90 44 15,569 13.96 40 16.67
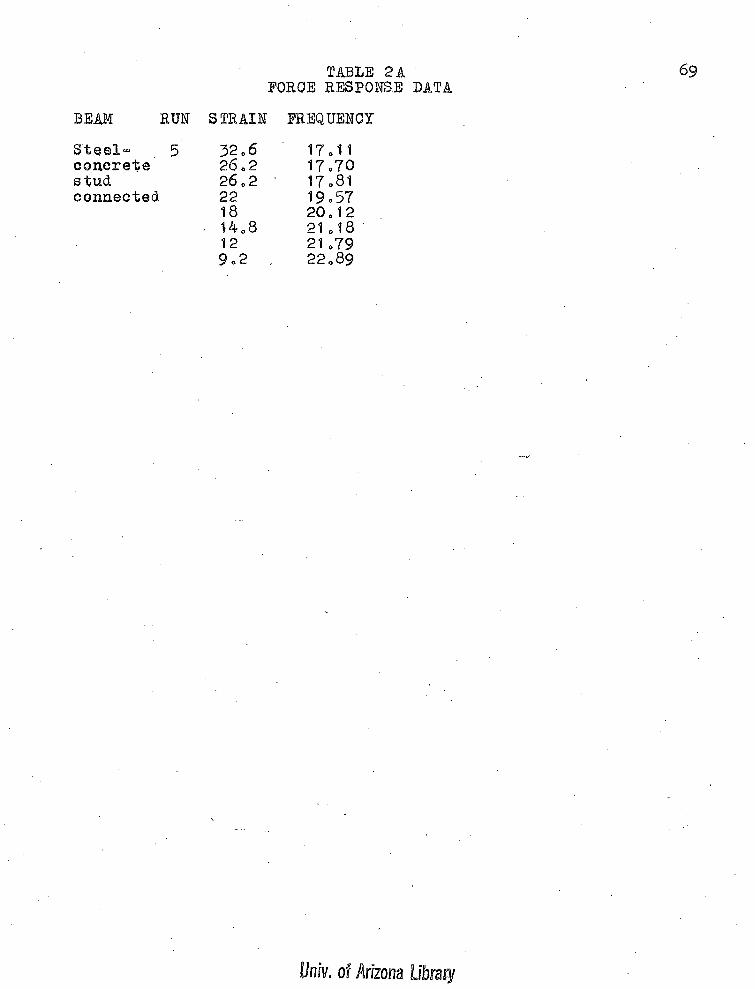
TABLE 2AFORCE RESPONSE DATA
BEAM RUN STRAIN FREQUENCY
Steel” 5 32 = 6 17 = 11concrete 26 = 2 17=70stud 26 = 2 ' 17=81connected 22 19-57
18 20.12■ 14.8 21.18
12 21 =799.2 , 22.89
Univ. of Arizona Library
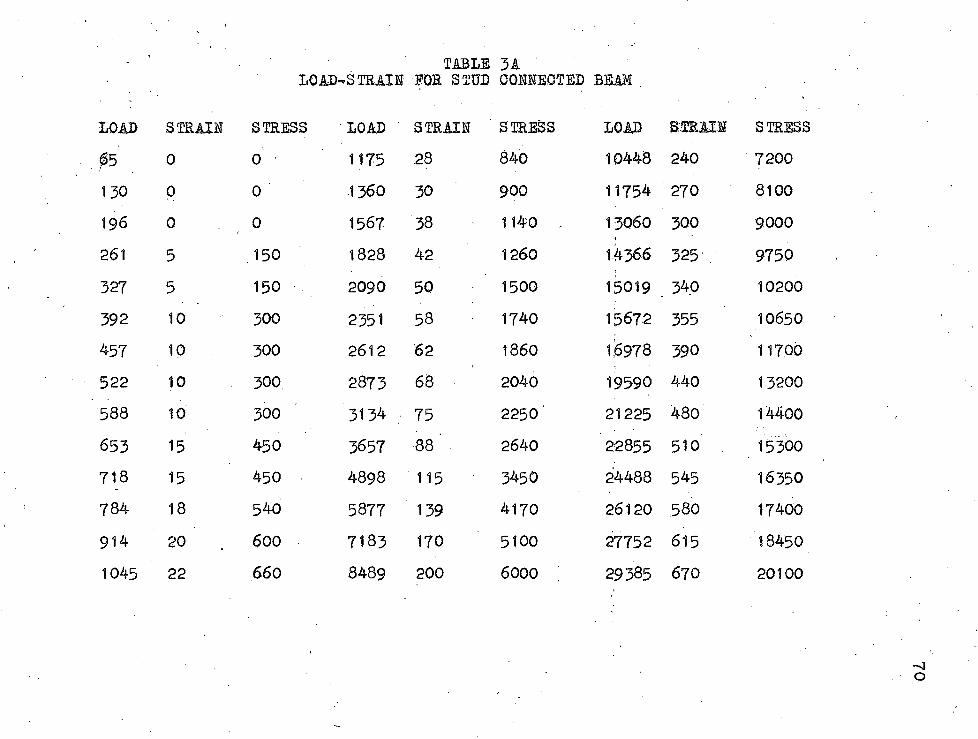
TABLE 31LOAB-SmAII POE STUD OOHNE.OTED BEAM
LOAD STRAIN STRESS LOAD STRAIN ’ STRESS LOAD STRAIN
05 0 0 1175 28 840 10448 240
130 0 0 1360 30 900 11754 270
196 0 0 1567 38 1140 . 13060 300
261 5 150 1828 42 1260 14366 325 .
327 5 150 2090 50 1500 15019 340
392 10 300 2351 58 1740 15672 355
457 10 300 2612 62 1860 16978 390
522 10 300 2873 68 2040 19590 440
588 10 300 3134 75 2250 21225 480
653 15 450 3657 88 " 2640 22855 510
718 15 450 4898 115 3450 24488 545784 18 540 5877 139 4170 26120 .580
914 20 600 7183 170 5100 27752 615
1045 22 660 8489 200 6000 ; 29385 670
STRESS
7200 8100
9000
9750 10200
10650
11700
13200
14400
15300
16350
17400
18450
20100