Southern Africa Labour and Development Research nit · Thomas Bossuroy is a researcher at SALDRU,...
25
Working Paper Series Number 69 S outhern Africa L abour and D evelopment R esearch U nit by Thomas Bossuroy Ethnic Solidarity and the Individual Determinants of Ethnic Identification
-
Upload
nguyenphuc -
Category
Documents
-
view
212 -
download
0
Transcript of Southern Africa Labour and Development Research nit · Thomas Bossuroy is a researcher at SALDRU,...
Working Paper SeriesNumber 69
Southern Africa Labour and Development Research Unit
byThomas Bossuroy
Ethnic Solidarity and the Individual Determinantsof Ethnic Identification

About the Author(s) and Acknowledgments
Thomas Bossuroy is a researcher at SALDRU, University of Cape Town, South Africa. Most of the research was done as a Ph.D. candidate at the Paris School of Economics, DIAL, Paris.
I wish to thank Denis Cogneau, Martin Giraudeau, Ted Miguel, François Roubaud and Joel Selwayfor their help and comments on various drafts. Financial support from the Agence Française deDéveloppement is gratefully acknowledged.
This SALDRU Working Paper is also available as ERSA Working Paper 242.Contact the author: [email protected]
Recommended citation
Bossuroy, T. (2011). Ethnic Solidarity and the Individual Determinantsof Ethnic Identifi cation. A Southern Africa Labour and Development Research Unit Working Paper Number 69. Cape Town: SALDRU, University of Cape Town
ISBN: 978-1-920517-10-6
© Southern Africa Labour and Development Research Unit, UCT, 2011
Working Papers can be downloaded in Adobe Acrobat format from www.saldru.uct.ac.za.Printed copies of Working Papers are available for R15.00 each plus vat and postage charges.
Orders may be directed to:The Administrative Offi cer, SALDRU, University of Cape Town, Private Bag, Rondebosch, 7701,Tel: (021) 650 5696, Fax: (021) 650 5697, Email: [email protected]

Ethnic Solidarity and the Individual Determinantsof Ethnic Identification
Thomas Bossuroy1
Abstract
This paper examines the individual determinants of ethnic identification usinglarge sample surveys (about 30,000 respondents) representative of seven capitalsof West-African countries. A small model that relates ethnic identification to aninvestment in ethnic capital suggests that individuals initially deprived of socialor human capital resort to ethnicity to get socially inserted, and do even moreso if their ethnic group itself is well inserted. Empirical results are consistentwith this simple theory. First, education lowers ethnic salience. Second, ethnicidentification is higher for uneducated unemployed or informal workers who seeka new or better job, and is further raised by the share of the individual’s ethnicgroup integrated on the job market. Third, ethnic identification is higher amongmigrants, and raised by the share of the migrant’s ethnic group that is employed.Group solidarity makes ethnic identity more salient for individuals deprived ofother means for upward mobility.
Keywords: Ethnicity, Identity, Social capital, Networks, Africa.JEL codes: A13, A14, D74, O17
1SALDRU, University of Cape Town, South Africa. Most of the research was done as a Ph.D.candidate at the Paris School of Economics, DIAL, Paris.
I wish to thank Denis Cogneau, Martin Giraudeau, Ted Miguel, François Roubaud and Joel Selwayfor their help and comments on various drafts. Financial support from the Agence Française deDéveloppement is gratefully acknowledged.
This SALDRU Working Paper is also available as ERSA Working Paper 242.Contact the author: [email protected]
1

The salience of ethnicity in heterogenous societies has been shown to vary a great dealacross time and space (Posner 2004a) (Chandra 2005). In the search for the reasons forthis variation, the impact of political competition has drawn most of the attention sofar1. For example, Eifert, Miguel, and Posner (2010) show in a recent paper how ethnicidentification raises around election times, to the detriment of class and occupationidentities. This approach focuses on the role of elites which may manipulate or exploitthe feelings of ethnic loyalty and rivalry to achieve their goals, and builds on a varietyof studies dedicated to the relationships between ethnicity and politics (Brass 1976)(Salamone 1985). In this top-down setting, the elite’s quest for power appears as thedriving force that fosters the salience and mobilization of ethnic belongings. The focusis put on the collective determinants of ethnic salience.
However, little has been written on the individual, grassroots incentives to relate toone’s ethnic group, so that within-group individual variation in ethnic identificationmay well be a missing link in our understanding of the determinants of ethnic salience.Reverting the perspective is consistent with a definition of identity that considers it asa fluid, multi-dimensional and context-specific notion, and therefore opens way to vari-ations across individuals within the same ethnic group. Fearon (1999) defines identityas the specific way an individual positions himself in the multiple social stratifications,which may change along with the individual’s interests at a certain point or in a cer-tain context (Fearon 2003). There might therefore be important variations in ethnicidentification across individuals, just as social and economic situations also vary. Thisunderstanding of identity underpins the present paper.
What kind of interests would then push individuals to emphasize their ethnic be-longing? The persistence of ethnic identities in a changing world has led scholars toinvestigate what benefits ethnic groups provide to their members (Glazer and Moyni-han 1963), as ethnic groups have proved to be functional not only for the elite or tothe various contenders for power, but also for any group member in certain contexts.In a seminal paper, Bates (1974) suggests that ethnic groups persist "because of theircapacity to extract goods and services from the modern sector and thereby satisfy thedemands of their members for the components of modernity". The combination of thisassertion and the definition of identity mentioned above suggests that ethnic identi-fication might reflect the demand of individuals for ethnic-based goods and services,and not only manipulations by the political elite.
Identifying the channels through which ethnic groups may provide such amenities is keyto isolate the microfoundations of ethnic identification at the individual level. The lit-erature on social networks and social capital provides many useful insights here. Socialproximity - due to common ethnicity or to any other common characteristic - has beenshown to bring benefits to individuals in some specific social and economic contexts(Arrow 1972): solutions to agency problems in the enforceability of trade contracts(Greif 1993), formation of mutual insurance networks (Fafchamps 1992), financial de-cisions (Karlan 2007) or integration on the job market (Granovetter 1974). Ethnicity
1See Norris and Mattes (2003), Miguel (2004), Posner (2004b), Miguel and Gugerty (2005), Posner(2006)
2

as a set of descent-based attributes (Chandra 2006), is efficient in building such so-cial networks. Common ethnicity can be used as a "social focal point" (Habyarimanaet al. 2006) that allows individuals to solve coordination problems, even if commonmembership does not carry pre-existing social rules or common tastes (Habyarimanaet al. 2007). Ethnic membership appears as a resource in social capital that providessignificant social and economic returns, and therefore pushes individuals to identifywith their ethnic group.
In this paper I first present a simple model of investment in social capital2 (Glaeser,Laibson, and Sacerdote 2002) and argue that ethnic identification reflects an individualdemand for this particular form of capital. I refer to the notion of social capital asdefined by Bourdieu (1986) as a measure of the individual’s amount of relationshipsor size of networks. Individual stocks of social capital then aggregate (Brehm andRahn 1997) to form the set of norms, attitudes and trust that characterize a commu-nity or society (Putnam 1995). The model suggests that the demand for ethnicity ishigher when individuals are initially deprived of social capital, and therefore have highmarginal returns to their investment. It is also higher for individuals whose ethnicgroup may effectively supply those ethnic-based amenities needed. This simple modelpredicts that individuals with a low education and limited local networks (such asrecent migrants) have a higher probability of identifying with their ethnic group. Italso predicts that the share of the ethnic group integrated on the job market raises thereturns individuals get from their group membership, and will drive up the individual’sidentification.
I then test the predictions of this model on an original survey dataset that includes morethan 30,000 respondents representative of seven major cities in West Africa. Consistentwith the model, I show strong and robust evidence that being poorly educated, left outof the formal job market, and a migrant from rural areas increases ethnic identification.I also find that the level of integration of an individual’s ethnic group on the job marketdrives up her level of ethnic identification, which again concurs with the hypothesisthat ethnic identification reflects a demand for networks and social capital.
The article makes three important contributions. First, it directly examines the de-terminants of ethnic salience at the individual level, without using proximal variablesthat are only assumed to be related to ethnic salience. A nascent literature uses Afro-barometer data to do so (see notably Eifert, Miguel, and Posner (2010)), and it isprimarily important to add a different data source to this body of research. Second,this article focuses on within-group variations in ethnic salience at the individual level,a dimension left aside in previous empirical studies. Here I focus on day-to-day ethnicidentification at the grassroots level, which complements the elite-driven mechanismsby forming the demand side of ethnic salience. Third, I take advantage of the size ofthe sample to build robust estimates of ethnic group socio-economic characteristics atthe local level, instead of nation-wide census data of dubious quality and uncertainrelevance at the individual level. For the first time in this literature, I use interactionmodels to incorporate ethnic group socio-economic characteristics in my analysis of
2For a comprehensive survey on this notion, see Coleman (1990), Putnam (1995) and Sobel (2002).
3
individual determinants, which allows a fine assessment of the relationship betweenindividual and ethnic group characteristics.
The paper is organized as follows. I first lay out this small theoretical framework andderive a set of predictions (section 1). After having presented the data in section 2,I examine the individual characteristics that raise the importance of ethnic identifi-cation (section 3). The impact of low education, migration and unemployment standout. Taking advantage of the presence of several respondents in a same household,I introduce household fixed effects and show that those results hold when householdidiosyncracies are canceled out. In section 4, I then turn to the effect of the positionof the ethnic group on the job market, which might determine how valuable it is toclaim one’s attachment to it. When individuals are willing to experience occupationalmobility, they identify to their ethnic group if its insertion on the job market may helpthem reach a better job. I discuss this set of results, their link to sociological literatureand possible alternative interpretations in section 5. Section 6 concludes.
1 A small model of investment in ethnic capital
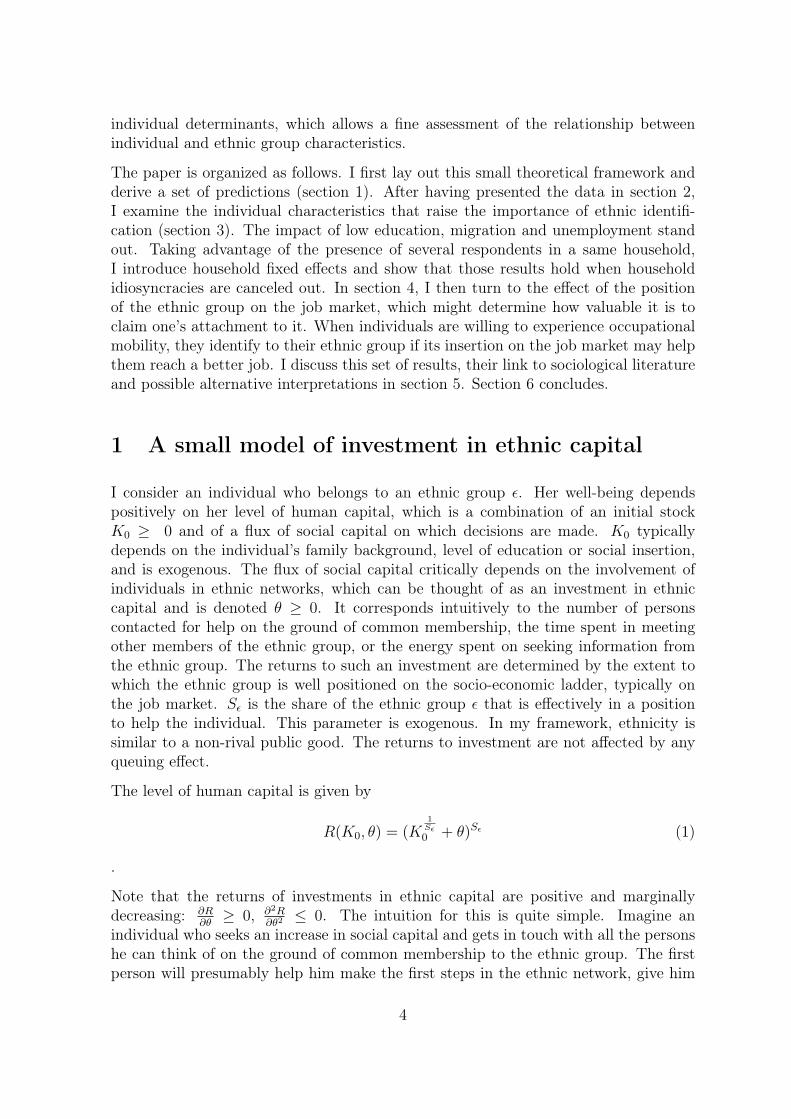
I consider an individual who belongs to an ethnic group ϵ. Her well-being dependspositively on her level of human capital, which is a combination of an initial stockK0 ≥ 0 and of a flux of social capital on which decisions are made. K0 typicallydepends on the individual’s family background, level of education or social insertion,and is exogenous. The flux of social capital critically depends on the involvement ofindividuals in ethnic networks, which can be thought of as an investment in ethniccapital and is denoted θ ≥ 0. It corresponds intuitively to the number of personscontacted for help on the ground of common membership, the time spent in meetingother members of the ethnic group, or the energy spent on seeking information fromthe ethnic group. The returns to such an investment are determined by the extent towhich the ethnic group is well positioned on the socio-economic ladder, typically onthe job market. Sϵ is the share of the ethnic group ϵ that is effectively in a positionto help the individual. This parameter is exogenous. In my framework, ethnicity issimilar to a non-rival public good. The returns to investment are not affected by anyqueuing effect.
The level of human capital is given by
R(K0, θ) = (K1Sϵ0 + θ)Sϵ (1)
.
Note that the returns of investments in ethnic capital are positive and marginallydecreasing: ∂R
∂θ≥ 0, ∂2R
∂θ2≤ 0. The intuition for this is quite simple. Imagine an
individual who seeks an increase in social capital and gets in touch with all the personshe can think of on the ground of common membership to the ethnic group. The firstperson will presumably help him make the first steps in the ethnic network, give him
4

the basic information he has to know about the job market for instance, and may openmany doors. If the individual continues to invest in ethnic capital and increases θ,the next person contacted may help but the bulk of the information would have beenalready transmitted. The tenth person might provide little returns, even if it happensthat she is the one who provides the marginal surplus that helps the individual gobeyond the threshold required for, say, getting a job in the formal sector. It is thussensible to assume that returns are marginally decreasing.
Without any investment in ethnic capital (θ = 0), a person can rely on an amountof human capital corresponding to the initial stock accumulated K0 > 0, which mightinclude literacy, diplomas, people already part of the network, integration to neighbor-hood or community life. Conversely, an individual who has never been to school anddoesn’t have any pre-existing social relationships can only rely on the returns to hisinvestment in ethnic capital. K0 and θ are therefore substitutes in a marginally de-creasing production function. The higher K0, the lower the returns to a given amountof θ: investment in ethnic capital only helps to reach out to the people who are notalready part of the network initially accumulated.
Figure 1: Returns of θ for a positive K0
Resorting to ethnic investment, however, has costs: it is necessarily time and energy-consuming, so there is an opportunity cost attached to it. It also creates an obligationto reciprocate. Being involved in social networks and taking advantage of them alsoimplies that the individual might later be asked to also give some of his time, informa-tion, contacts etc. The cost C(θ) of investment θ corresponds intuitively to the sum ofa cost of opportunity and of a series of future reimbursements. The cost of opportunityis proportional to the investment, and I assume the series of reimbursements convergentto a finite limit - an infinite limit would imply an infinite obligation to reimburse andthus deter any use of ethnic networks.
C(θ) = cθ (2)
5

For simplicity, I assume that the cost function is linear, contrary to the returns function:when the individual establishes a contact with any relationship or relative, he opensa form of drawing right for this person, no matter if he or she is the first or tenthperson contacted. The time and energy spent in such an increase in ethnic capital haveno strong reason to increase or decrease, and the liability created is the same for theindividual, whatever the low level of returns provided.
The individual’s program is the following:
maxU(θ) = R(θ,K0)− C(θ) = (K1Sϵ0 + θ)Sϵ − cθ
The first-order condition determines the optimal level of investment in ethnic capitalθ⋆:
θ⋆ =
(Sϵ
c)
11−Sϵ −K
1Sϵ0 if K0 ≤ (Sϵ
c)
Sϵ1−Sϵ
0 if K0 > (Sϵ
c)
Sϵ1−Sϵ
(3)
It may easily be verified that θ⋆ is a negative function of K0 and a positive function of Sϵ.Beyond a certain threshold of initial social capital (Sϵ
c)
Sϵ1−Sϵ , investment in ethnic capital
would only provide negative returns because costs outweigh returns 3. Individuals witha high initial stock of capital do not invest in their ethnic relationships, but rather relyon the high level of integration they already reached and avoid the costs attached toan investment in ethnic capital.
The predictions of this small framework are twofold. First, the negative effect of K0
implies that educated individuals would tend to identify less with their ethnic group,as they don’t need this investment to have access to good jobs or other opportunities.Conversely, people who are initially deprived of social capital, because they are less ed-ucated or left out of the job market, might exhibit higher levels of ethnic identification.This effect might also play out for individuals who have left their local networks and arein need of accumulating social capital in their new place of living. I should therefore seea higher propensity to ethnic identification among migrants. Further, as the accumu-lation of social capital is a life-long process, youngsters who are just getting started intheir work career may invest more in ethnic capital than more mature individuals whohave already established their networks. There may also be a gender effect: if I assumethat men tend to have more relationships to their community than women who aremore confined to their household or immediate neighborhood, then men should show alower level of ethnic identification. Finally, social capital is very much determined byintergenerational transmissions. An important reason for initial deprivation of socialcapital is that the father himself has little social capital. Since my empirical setting is
3The cost related to the duty to reciprocate is very similar to the argument raised by Luke andMunshi (2006), who explain that high-ability individuals are less likely to get married because theydo not really need marriage to get employed but would nevertheless bear the cost of high remittancesto be sent to the extended family.
6

urban, having a father farmer would indicate an initial deprivation of connections inthe urban world and therefore push up the level of ethnic identification.
Second, the positive impact of Sϵ means that the share of the ethnic group that is in aposition to help the individual drives up the level of ethnic identification. The relevantcharacteristics of the group might well depend on the position of the individual himself.While the share of one’s group integrated on the job market may be an asset irrespectiveof one’s particular position, an informal worker may be more specifically interested inthe share of his group in the formal sector, a formal worker may be interested in theshare of this group in the public sector, etc.
2 Data and Methodology
In this paper I use a set of seven "1-2-3" surveys that were carried out by DIAL,AFRISTAT and the National Institutes of Statistics in the main cities of seven West-African countries: Cotonou (Benin), Ouagadougou (Burkina Faso), Abidjan (Côted’Ivoire), Bamako (Mali), Niamey (Niger), Dakar (Senegal) and Lome (Togo). Thesesurveys are identical and therefore strictly comparable. They were carried on in theearly 2000s on large samples representative of the urban population.
The surveys all include the following question: "which group (or community) are youthe most proud to belong to?". Two answers are possible: the ethnic group or thenation. The survey in Dakar is the only one which includes religion as a third possibleanswer. This may not be mixed up with ethnicity, all the more as 92% of the sample inDakar declares being Muslim. I thus considered that religious identification may moreaccurately be aggregated to national identification. This leads to quite homogeneousrates of ethnic identification in the seven main cities (Figure 2). In this paper I referto ethnic identification, or ethnic salience, as the likelihood that individuals mentiontheir ethnic group as the group or community they are proud to belong to.
The question confines the respondent to a choice between two possibilities (ethnic groupor nation). This bars individuals from claiming pride in class, occupation, gender,religion etc. Though restrictive, this question interrogates the interactions betweenethnicity, nation-building and democracy, a critical research field in political science(Charney 2003). Ever since the independence and the creation of heterogenous, oftenartificial nation States, a looming interrogation pertains to the conditions for ethnicgroups in Africa to merge and dissolve into a national political field where nationalinterest would subsume ethnic identities (Miles and Rochefort 1991). The dual choiceoffered to survey respondents may therefore shed light on a burning question. In theirstudy, Eifert, Miguel, and Posner (2010) face the exact opposite problem as their surveyquestion offers several possible identification groups, but not the nation. My paper maybe seen as a useful complement to that extent as well. It is reassuring to see that thelevels of absolute ethnic identification (Figure 2) are quite similar across surveys (31%across 10 countries in the Afrobarometer data, 24% here). This suggests that ethnicidentification is little dependent of alternative choices. The great advantages of this
7

Which group are you the most proud to belong to?
0
10
20
30
40
50
60
70
80
90
Benin Burkina
Faso
Côte
d'Ivoire
Mali Niger Senegal Togo
Nation Ethnic group
%
Figure 2: Frequency of ethnic identification in the main cities of seven countries
data are well described in Eifert, Miguel, and Posner (2010), as well as their limitations.The survey methodology and purpose being similar in this case, I refer to their remarks.I would add that in both sets of surveys, the question leaves the respondent free tomentally refer to any ethnic group or sub-group of which he considers to be a member,which avoids the pitfall of imposing ethnic categories often at odds with the reality ofethnic structures and perceptions.
I then include a range of variables that describe the individual’s situation in terms ofeducation, occupation and migration status, along with classical demographical infor-mation. To study the alternative between national identification and ethnic identifi-cation, it makes sense to restrict the sample to adults - individuals older than 18 -who have the nationality of the country considered. My final sample includes 30,042individuals older than 18. Descriptive statistics are provided in Table 1.
3 Individual social position and ethnic identification
The survey data enables me to test several key predictions of my simple model. Iregress the binary variable "to be more proud of one’s ethnic group", a measure ofethnic identification, on the set of individual characteristics presented above. I includecountry fixed effects to control for national specificities, but my results hold withoutincluding them. My method is similar to the one used by Eifert, Miguel, and Posner(2010). I use logit estimations. Results are displayed in Table 2.
8

Burkina CôteBenin Faso d’Ivoire Mali Niger Senegal Togo Total
Demographical backgroundFather farmer (%) 36.2 52.2 47.8 37.2 47.7 28.2 40.7 40.7Female (%) 51.6 45.1 49.3 48.8 50.8 55.6 46.3 50.8Age 34.5 35.2 31.9 35.2 35.0 35.4 35.5 34.0Size of the household 5.8 7.1 6.8 7.9 8.0 9.9 4.7 7.5MigrationBorn in the same place (%) 50.4 43.6 32.6 48.1 43.0 60.9 39.0 47.63Migrant from an urban area (%) 29.4 43.8 58.7 35.0 31.5 28.5 46.4 35.81Migrant from a rural area (%) 20.2 12.6 9.1 16.9 25.5 10.7 14.6 16.56EducationNever attended school (%) 21.5 42.1 21.5 48.0 43.4 35.2 17.5 30.5At least attended
primary school (%) 30.2 22.8 25.1 15.3 19.9 33.4 32.2 26.1At least attended
secondary school (%) 36.6 28.1 39.4 30.1 27.9 25.3 43.4 33.4At least attended
post-secondary school (%) 11.6 6.9 14.0 6.6 8.7 6.2 6.8 10.0OccupationInactive excl. students (%) 11.9 12.2 9.7 17.7 22.9 22.3 8.8 15.1Student (%) 11.2 6.2 10.4 8.2 7.9 6.4 4.8 8.7Unemployed (%) 5.8 13.4 15.6 9.9 16.0 15.9 9.7 13.4Formal private sector (%) 7.9 7.4 14.4 8.2 6.6 8.8 8.3 10.3Informal private sector (%) 56.0 49.6 43.8 48.1 36.1 41.7 60.9 45.6Civil servant (%) 7.1 9.6 6.1 7.5 10.1 4.6 7.3 6.6Observations 6,028 1,642 3,752 4,399 6,050 6,668 1,503 30,042
Table 1: Country-wise description of the survey sample
My small model of investment in ethnic capital leads me first to examine the effects ofthe individual amount of social capital (K0) on the level of ethnic identification. Themain determinants of this initial stock of social capital are the level of education, themigration status, the father’s level of social capital, and the position on the job market.I also examine the impact of demographic variables such as gender and age.
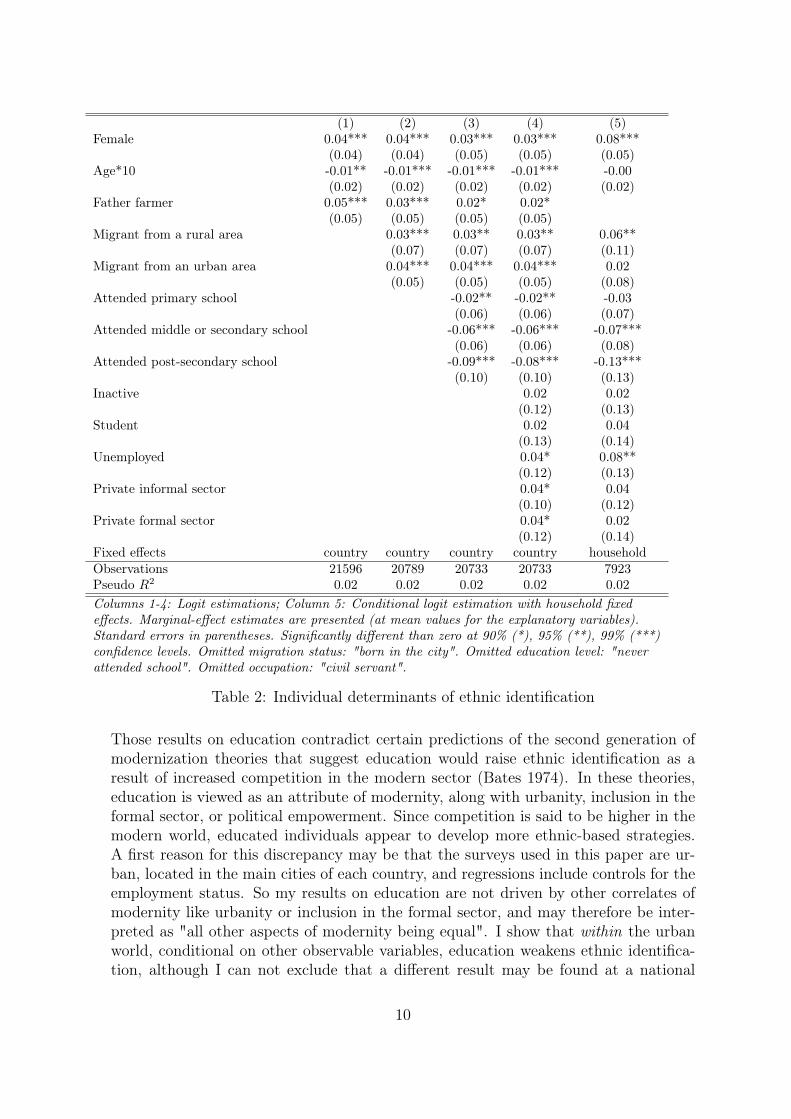
Education stands out as a very robust and significant deterrent of ethnic identification,with the highest magnitude: whatever the specification of the model, being educatedhas a strong negative effect on the propensity to refer to the ethnic group. All educationmodalities included in the regression have significant negative impacts as compared tothe omitted variable "having never attended school" (which concerns between 17.5% ofthe population in Lome, Togo, and 48.0% in Bamako, Mali). This finding is robust toshifts in the definition of education levels. Including the continuous variable "numberof school years" instead of education classes yields the same result. Furthermore, theimpact increases with the level attained: absolute values of marginal effects increasewith the level of education attained. When all other parameters are controlled for(column 4), having attended primary school lowers the probability of referring to theethnic group by 2 percentage points, having attended secondary level lowers it by 6percentage points and post-secondary education (a level reached by less than 10% ofthe sample) by more than 8 percentage points.
9
(1) (2) (3) (4) (5)Female 0.04*** 0.04*** 0.03*** 0.03*** 0.08***
(0.04) (0.04) (0.05) (0.05) (0.05)Age*10 -0.01** -0.01*** -0.01*** -0.01*** -0.00
(0.02) (0.02) (0.02) (0.02) (0.02)Father farmer 0.05*** 0.03*** 0.02* 0.02*
(0.05) (0.05) (0.05) (0.05)Migrant from a rural area 0.03*** 0.03** 0.03** 0.06**
(0.07) (0.07) (0.07) (0.11)Migrant from an urban area 0.04*** 0.04*** 0.04*** 0.02
(0.05) (0.05) (0.05) (0.08)Attended primary school -0.02** -0.02** -0.03
(0.06) (0.06) (0.07)Attended middle or secondary school -0.06*** -0.06*** -0.07***
(0.06) (0.06) (0.08)Attended post-secondary school -0.09*** -0.08*** -0.13***
(0.10) (0.10) (0.13)Inactive 0.02 0.02
(0.12) (0.13)Student 0.02 0.04
(0.13) (0.14)Unemployed 0.04* 0.08**
(0.12) (0.13)Private informal sector 0.04* 0.04
(0.10) (0.12)Private formal sector 0.04* 0.02
(0.12) (0.14)Fixed effects country country country country householdObservations 21596 20789 20733 20733 7923Pseudo R2 0.02 0.02 0.02 0.02 0.02Columns 1-4: Logit estimations; Column 5: Conditional logit estimation with household fixedeffects. Marginal-effect estimates are presented (at mean values for the explanatory variables).Standard errors in parentheses. Significantly different than zero at 90% (*), 95% (**), 99% (***)confidence levels. Omitted migration status: "born in the city". Omitted education level: "neverattended school". Omitted occupation: "civil servant".
Table 2: Individual determinants of ethnic identification
Those results on education contradict certain predictions of the second generation ofmodernization theories that suggest education would raise ethnic identification as aresult of increased competition in the modern sector (Bates 1974). In these theories,education is viewed as an attribute of modernity, along with urbanity, inclusion in theformal sector, or political empowerment. Since competition is said to be higher in themodern world, educated individuals appear to develop more ethnic-based strategies.A first reason for this discrepancy may be that the surveys used in this paper are ur-ban, located in the main cities of each country, and regressions include controls for theemployment status. So my results on education are not driven by other correlates ofmodernity like urbanity or inclusion in the formal sector, and may therefore be inter-preted as "all other aspects of modernity being equal". I show that within the urbanworld, conditional on other observable variables, education weakens ethnic identifica-tion, although I can not exclude that a different result may be found at a national
10

level. A second reason may be that modernization theories underestimate the levelof competition at the grassroots level, and the fact that in social competition, ethnicstrategies may be substitutes to qualification and diplomas, rather than complements.My results concur to the idea that competition raises ethnic identification, but suggestthat competition is fiercer in other segments of the population.
Another interpretation of the results on education is that there is a straightforwardimpact of education on values and identities, through the provision of knowledge andopenness that enable people to relate to their nation. Studies, especially higher educa-tion, are also a time where interactions with people of different backgrounds are morefrequent, which may decrease the sense of ethnicity. Education would directly decreasethe subjective relevance of ethnicity, not its instrumental use. My empirical strategydoes not allow me to separate out this effect from the fact that being educated makes itless necessary to rely on ethnic solidarity to reach one’s objectives, typically of findinga good job. But the instrumental interpretation finds support in many earlier studiesand in my other results.
Given the extent of intergenerational transmission of social capital (Bourdieu andPasseron 1979), a second key determinant of the initial amount of social capital isthe family background. The surveys allow us to incorporate this dimension as theyinclude a question on the father’s occupation when the respondent was 15 years old.Having a father farmer at the age of 15 arguably indicates a low level of inheritedsocial capital in the urban world. Results show indeed that having a father farmerincreases ethnic salience by 5 percentage points when this variable is introduced alongwith demographical indicators only (column 1), even though the magnitude and sig-nificance decrease when educational variables are added to the regression (columns 3and 4). There is therefore both a direct effect of familial legacy of social capital, andan indirect effect of intergenerational rigidity in schooling opportunities, as having afather farmer impacts negatively on educational attainment in Africa (Bossuroy andCogneau 2008).
The impact of migration status is well aligned with those results. Three categoriesmay be constructed from the results of the survey: people born in the main city,people born in another urban area (excluding the main city) and people born in arural area. Table 1 shows that natives represent about a half of the population ofthe capitals, while urban migrants represent between 30 and 50% of the rest. Being amigrant, regardless of origin, appears as a strong determinant for salience of ethnicity.A first explanation may be that for cultural reasons, people born in the main cityhave a different set of values and feel prouder of their nation, maybe as an effect ofliving in open, cosmopolitan cities as opposed to isolated hamlets. But in the baselineregressions with country fixed effects (columns 2 to 4), being a migrant from an urbanarea shows a similar impact as being a migrant from a rural area. Ethnic identificationmight thus reflect the use of ethnic ties to get inserted in a new community, which isnecessary for migrants who left their established local networks irrespective of wherethey come from.
Including the individual’s occupation status (column 4) reveals that the lower the level
11

of integration on the job market, the higher the level of ethnic identification. Withthe most stable and protected occupational status - civil servant - taken as a reference,every modality appears to determine positively and significantly the level of ethnicidentification. One may argue that I only capture the fact that civil servants havea certain ethos that makes them more prone to refer to the nation for which theywork on a daily basis. But it is striking that being out of the job market (either asstudent or with any other kind of inactive status) does not have any significant impacton ethnic identification when compared to being a civil servant. Inactivity is specificin that it is a situation where low competition prevails, since individuals are not (orno more) competing in the job market. Competition does hold among students, butbeing successful in the studies is not the same as being integrated on the job market:in principle, interpersonal connections and social networks are less necessary. So itmay be that the level of precariousness that individuals experience on the job marketdetermines their degree of ethnic identification, because of the will to experience anupward occupational mobility and the efficiency of strategies based on ethnic networks.The insertion of the ethnic group itself should therefore be examined, which I do insection 4. Interestingly, introducing a revenue variable does not help to explain thesalience of ethnicity (results not shown), a finding that is consistent with the notionthat the occupational status is the driving force.
The strategic dimension of ethnic identification for occupational mobility is tough toidentify, since the effect is endogenous by nature: being in a precarious situation maylead people to strategically mobilize their ethnic membership, which in turn is sup-posed to improve their situation. However, the possible bias would cause the effectsto be underestimated and not overestimated: since ethnic identification reduces theprobability of, say, unemployment, the impact of unemployment on the propensityto refer to one’s ethnic group should be even more important than what I observe.The job market status thus appears to have an influence, which might be related tothe strategic use of ethnic ties for upward mobility and will be investigated further insection 4.
The impact of demographic variables is consistent with the predictions of my model.Females appear to identify more to their ethnic group. As I also include other co-variates in the regression, this result is not driven by the fact that being a woman isassociated with some specific characteristics on education, migration, integration onthe job market, etc. As suggested above, this may be due to the fact that women areoften less active in the social life of the extended community and are less naturallyin touch with "useful" ethnic mates than men. Ethnic identification decreases signifi-cantly with age, though by a small magnitude (1 percentage point per decade). Olderpeople show a lower propensity to ethnic identification, although they are often thoughtto be more attached to traditional values, while younger people are seen as vectors ofmodernity. This might reflect the need for youngsters to build their networks and findtheir way in the social hierarchy, whereas older people have accumulated social capitalfor a longer period of time and need less support from ethnic networks. There resultson age are robust to changes in specification like introducing age in a quadratic func-tion, introducing a discrete variable of age classes or dropping the education variables
12

that could interact with the effect of age, in a context where schooling rapidly increasesover generations in Africa.
Values and identities are very much influenced by other household members. A regres-sion run on the sub-sample of households where fathers and sons are both respondentsshows that the father’s ethnic identification is strongly correlated with the son’s (theestimated impact is about 30 percentage points - results not shown). To control for thisbackground family effect, I use a conditional logistic regression and introduce householdfixed effects (column 5). This estimation strategy skims off what drives the individual’sdeviation from the household average. It is therefore restricted to households wherethere is intra-household heterogeneity in the variable of interest, hence the smallernumber of observations. Results show that the critical drivers are migration from arural area, high levels of education and unemployment. The impact of being a womanobviously stays unaffected by controlling for household fixed effects.
My results on individual characteristics are quite consistent with the predictions ofthe model of investment in ethnic capital. Being deprived of other dimensions ofhuman capital (low education, migration) drive ethnic identification, as well as havinga precarious job situation. The insertion of the ethnic group on the job market, a keyparameter for individuals to try and take advantage of their group membership, is yetto be examined.
4 Ethnic group position on the job market and ethnicidentification
Occupational position determines the level of ethnic identification because individualsmay take advantage of their ethnic belonging to make their way on the job market.People who do not have a sufficient amount of human capital or social capital mayplay the ethnic card to find a new job or have a promotion. When asked how theyfound their job, 38.5% of employed respondents answer that they found it "throughpersonal relationships (friends, family members)", as opposed to job advertisements,public placement services, direct contact with employers or competitive entrance exams.This number is as high as 67.1% of unemployed respondents when asked how they arelooking for a job. Social networks clearly matter a great deal for job search.
The will to find or change job may be observed in the survey data. In a section onoccupational perspectives, the respondent declares whether she intends to find a job,or find a new job in the same firm - having a promotion - or find a new job in adifferent firm, or to keep her position (including unemployed or inactive). In the firstthree cases, the individual is asked in how many years she thinks she will obtain thisnew position. I define people "eager to change job" as those who want to change theirposition and intend to obtain it within a year. The other ones are said "non eager"either because they are not looking for mobility or because it is a long-term, somewhatabstract, desire. The distribution of individuals eager to change job across differentsub-groups is presented in Table 3.
13

All sample 30.7 Female 32.2 Unemployed 65.9Male 29.4 Informal 24.7
Formal 27 .4Civil servant 15.3
Non-educated 27.6 Father FatherPrimary 30.5 non-educated 29.3 farmer 29.0Middle / sec 33.5 Father FatherPost-sec 31.7 educated 33.6 non-farmer 32.4Coverage: active people
Table 3: Eagerness to find/change job across demographic and occupational categories(%)
The share of people eager to find or change their job - around 30% of active people- is quite homogenous across educational, occupational or gender sub-groups, exceptfor the sub-group of unemployed who of course are massively willing to change theirsituation. Not surprisingly, civil servants also stand out with a lower will to changetheir position. Aside from those two exceptions, eagerness to move cross-cuts categoriesand does not seem to reflect any of those other observable characteristics.
The model predicts that individuals with little initial social capital would use ethnicties to change or find a job. I test this possibility by introducing interaction termsin the regression (Table 4). Results show that being unemployed or working in theinformal sector significantly raises the probability that an individual identifies withhis ethnic group provided that he is not educated and that he is willing to find a jobrapidly or to obtain a promotion. For those who don’t long for occupational mobility,being unemployed or an informal worker does not push them to identify with theirgroup. Educated individuals might have other ways to get a (better) job when theyare eager to, so that a precarious occupational status does not push to identify alongethnic lines. In sum, a poor insertion on the job market fosters ethnic identification forthose people who want to improve their situation and use this ethnic strategy becauseof a lack of human capital.
Uneducated Yes Yes NoEager to change job Yes No YesUnemployed 0.54** 0.07 0.02
(0.02) (0.35) (0.80)Private informal sector 0.52** 0.06 0.06
(0.02) (0.25) (0.17)Private formal sector 0.48* 0.10 0.03
(0.06) (0.17) (0.60)Individual-level covariates yesLogit estimations with interaction terms. Marginal effects are presented.P > χ2 in parentheses. Coverage: active people.
Table 4: Individual job market status and ethnic identification
14

The model also predicts that the insertion of the ethnic group itself on the job marketmatters a lot for the individual. People will all the more ask for help in their job searchas their co-ethnics actually are in position to do something for them. I examine theeffect of certain characteristics of the ethnic groups on the propensity of their membersto identify with them. For doing this, I use the ethnic group classification used in thesurveys and compute ethnic group characteristics. This is made possible by the largesample size of the surveys and their representativeness. To ensure robustness of theseindicators, I only include in the analysis ethnic groups represented by more than 50persons in the survey. Table 5 presents the 42 ethnic groups retained across the sevencountries.
Benin Burkina Faso Côte d’Ivoire MaliFon 61.9 Mossi 80.8 Akan 45.3 Bambara 35.1Adja 20.3 Other Mandings 4.4 North Mande 19.2 Malinke 18.1Yoruba 10.8 Bissa 4.1 Kru 18.9 Fula 17.0Other 3.3 Gurunsi* 3.0 Gur 9.7 Sarakole 11.4Dendi 1.5 Other* 1.9 South Mande 6.9 Senufo 4.2Yoa/Lopka 1.1 Fula* 1.8 Dogon 4.0Bariba* 0.6 Dagari/Lobi* 1.3 Songhai 3.6Betamaribe* 0.3 Gurmanche* 1.2 Bobo 3.1Fula* 0.3 Bobo* 1.1 Other 1.9
Senufo* 0.5 Arab 1.3Tuareg* 0.3
Niger Senegal TogoZerma 52.0 Wolof 41.28 Adja/Ewe 74.0Hausa 32.0 Fula 18.87 Kabye/Tem 15.8Fula 7.4 Serer 13.06 Para/Gurma/Akan 5.0Tuareg 5.0 Lebou 7.63 Ana/Ife* 2.7Other 1.6 Jola 5.19 Akposso/Akebou* 1.9Kanuri 1.4 Other 4.8 Other* 0.7Gurma* 0.5 Mandinka 3.86Tubu* 0.1 Sarakole 2.88Arab* 0.1 Mandyak/Balanta 2.43
Table 5: Ethnic groups and their size (percentage of country samples)*: ethnic group represented by fewer than 50 individuals in the sample, subsequently dropped from
the analysis
The parameter of interest for an individual is the share of his ethnic group that is in agood position on the job market relatively to him and could therefore help him. Therelevant group characteristic might vary from one individual to another. For example,if identification is strategic, the unemployed could all the more identify with their groupas the employed share of this group is high, since their primary objective is to find ajob. And they may be less influenced by the share of ethnic group that is employedin the public sector. But while finding a job in the public sector appears as a second-order aspiration for the unemployed, it might be of first order for informal workers.Conversely, the share of employed people would be less important for them since theyare already employed.
In line with the predictions of the model, I also showed in section 3 that migrantshave a specific relationship to ethnic identification. I therefore separate migrants andpeople who were born in the city. If groups of migrants actually develop a specific
15

solidarity, the migrant’s strategic identification might depend on whether his ethnicgroup is represented by an important share of migrants in the city. The larger it is,the more likely the individual would be to play the ethnic card.
In order to test these hypotheses, I run regressions including the relevant shares of theethnic group (one by one for they are embedded) in my baseline regression along withinteraction terms involving the migration status, the will to find or change job, andthe occupational status. Results are displayed in Table 6.
Share of Share of Share ofthe ethnic group the ethnic group the ethnic group
employed in the civil service migrant and employedNative eager to change job
Unemployed 0.65** 0.49 -0.00(0.01) (0.64) (0.98)
Informal worker 0.51** 1.29* 0.21(0.01) (0.08) (0.19)
Formal worker -0.16 4.55*** 0.27(0.77) (0.00) (0.32)
Migrant eager to change jobUnemployed 0.84*** -2.34** 0.53**
(0.00) (0.03) (0.02)Informal worker 0.45** -0.33 0.43***
(0.01) (0.60) (0.00)Formal worker 0.94** -2.26 0.56
(0.05) (0.23) (0.12)
Individual-level covariates yesObservations 18698Logit estimations with interaction terms. Marginal effects are presented.Lower panel: P > χ2 in parentheses.Coverage: active people.
Table 6: Ethnic identification and group’s insertion on the job market
The share of co-ethnics employed is a powerful incentive to identify along ethnic linesfor people eager to find or change their job (first column). This pattern is cleareramong unemployed people. The share of employed co-ethnics has a strong, statisticallysignificant effect on the ethnic identification of unemployed people if they declare beingactive in looking for a job. This holds both among migrants and natives. Among nativepeople eager to change or find a job, the share of co-ethnics working in the civil service(middle column) has a strong effect on the ethnic identification of employed workers,either informal or formal. But it has no effect on the unemployed, for whom the decisivevariable is the share of employed people. For all people non eager to find or changetheir job (migrant or native), the share of co-ethnics in the civil service does not haveany impact (not shown). The share of co-ethnics who are employed migrants has astrong positive effect on the people who themselves are migrant, either unemployedor working in the informal sector, and who are looking for a (better) job. Individuals
16

craving occupational mobility are pushed to identify with their ethnic group by theprecariousness of their job, and they do even more so as an important share of co-ethnics is positioned on the rung of the ladder just above them, and may help climbit.
The methodology used here accounts for the novelty of those results. In their paper,Eifert, Miguel, and Posner (2010) attempt to measure the impact of individual charac-teristics on ethnic identification, by examining the impact of being young, male, or apolitical activist. The fact that they do not find significant results might be due to thecrudeness of the categories retained, which do not accurately capture the mechanismsat stake in ethnic identification (unemployment, poor education, migration). My re-sults also emphasize the need to take group characteristics into account. Large surveysamples make it possible to compute group characteristics that are locally accurate andcontemporary to the survey, which ensures their relevance for the individuals surveyed.It is then essential to analyze the interactions between individual and group character-istics, as the process of instrumental identification essentially brings both dimensionstogether. Failing this, aggregate impacts of individual or group characteristics mayeven out and be insignificant.
5 Discussion
Although this study is the first to establish a link between ethnic identification andsocial insertion, the intuition behind it is far from new. It builds on sociological studiesthat emphasize the instrumental role of interpersonal ties for various aspects of socialand economic lives of individuals. For instance, since the seminal work by Granovetter(1974), the importance of extended individual relationships (the "weak ties") has beenshown critical for job search. Kinship networks are a typical example of such weak ties,and have been shown to be part of individual strategies to integrate into the job market(Luke and Munshi 2006). My results show that his framework fully applies to the roleof ethnicity for job search in African urban contexts, the "weak ties" of co-ethnicitybeing strategically mobilized to reach a more protected position.
The role of ethnic solidarity among migrants has also been extensively studied sincethe American urban sociology of the 1920s. The Chicago School of Sociology typicallystudied how ethnic groups would help migrants to integrate themselves in Americancities, be it Jews (Wirth 1927), Italians (Whyte 1943) or others. Recently, rigorousempirical studies have highlighted the role of ethnic networks to help Mexican workersintegrate into the job market in the US (Munshi 2003). Moving to the city entails a shiftin the reference group and a disruption in social connections: individuals leave theirrelationships and a familiar environment, and have to reconstruct a network in orderto meet the challenges of urban life and income generation. In an urban multi-ethnicenvironment, ethnicity becomes a distinctive element that helps uprooted individualsrebuild the social capital necessary for successful social interactions (Habyarimana et al.2006).
17

The interpretation of the results relies on the fact that ethnic identification reflects aninstrumental use of ethnic belonging, in line with recent literature on ethnicity. Analternative, culturalist interpretation may claim that individuals feel proud of theirethnic group when the latter is more successful than themselves. This may explainwhy jobless, uneducated individuals are more prone to ethnic identification, and whythe share of employed co-ethnics drives it up as well. However, a number of resultsare inconsistent with this interpretation. First, in this interpretation we would expectinactive individuals, most of whom are housewives, to present high ethnic identifica-tion too. They do not. Second, the share of public servants in an ethnic group shouldbe a matter a pride irrespective of the individual status. We saw that it is true forformal workers only, with the unemployed being pushed rather to identify with theirethnic group by the share of employed. Results on the migrants are also very difficultto interpret with a culturalist view, while being consistent with the instrumental un-derstanding of ethnic identification. To further rule out this alternative interpretation,I ran regressions with other indicators of success for the ethnic group, like the share ofeducated or literate people. They do not show any impact on the individual level ofethnic identification (not shown).
The results I present here complement those on political drivers of ethnic identification,without contradiction. Indeed, if I run similar regressions as Eifert, Miguel, and Posner(2010) on my (much smaller) set of surveys, I find a similar relationship between thetiming of elections and the level of ethnic identification, even if the sample size makesthe results very rough. Eifert, Miguel, and Posner (2010) offer two possible mechanismsfor their theory, both of which are very much compatible with my results. First,politicians may "play the ethnic card" around election times to mobilize ethnic votebanks. My study suggests that this strategy might be particularly successful with thoseof their co-ethnics who are economically and socially struggling, and therefore likelyto be involved in ethnic networks. A second interpretation is that voters themselvesanticipate ethnic-based patronage and therefore think along ethnic lines around electiontimes. Consistently, I suggest here that this identification mechanism is even likelierfor those who depend largely on patronage and hands-out to survive, because they aredestitute and have limited capacity to get socially inserted.
6 Conclusion
The results of this paper suggest a new understanding of the relationship betweendevelopment and group identities. Individuals left behind in the dynamic transitionmay drive ethnic salience up, as ethnic groups take a particular significance as a naturalbond between individuals who benefit from the spread of education, urbanity and jobprotection, and individuals who yearn for those. The salience would be peak whena large share of a given ethnic group is deprived of the benefits of development anddepends on intra-group solidarity from their better-off co-ethnics to have access to someof those benefits.
18

The history of conflicts in Congo or Ivory Coast illustrate the process by which a weakeconomic system unable to open perspectives to individuals, engenders ethnic mobi-lization and nurtures conflict. In both countries (as in most of Africa), the 1980s haveseen a long economic stagnation that translated into a contraction of public spend-ing and a raise in unemployment. The coverage and quality of education deteriorateddramatically after severe cuts in education programs, and diplomas depreciated on thejob market (Proteau 2002). Education was no longer a valuable resource for individ-ual progress. Large sections of urban youth were left unemployed in the big citiesand engaged in informal, network-based activities to earn some basic livelihood. Incities, solidarity associations, most of them with an ethnic base, were created to pro-vide the citizens with such benefits as credit, saving, information, transport to homevillages, etc. (Willame 1998). Networks were also used for extracting rent from cocoaor minerals, in patronage networks. With export farming being less profitable dueto fluctuations in international prices, rural-urban migrations intensified and migrantpopulations gathered in ethnically homogeneous neighborhoods (Antoine and Coulibaly1989). The resurgence of ethnic salience fostered inter-group resentment in a context ofeconomic difficulties, which led to radical antagonisms and got further manipulated byelites. The urban unemployed youth in particular could be very effectively mobilizedby political leaders, the "Jeunes Patriotes" in Ivory Coast (Banégas 2007) or militia inCongo (Bazenguissa-Ganga 1999) being notorious examples.
Identities therefore appear to be shaped by the inclusiveness of a society. The lackof openness of the job market and access to education are critical to understandingwhy individuals cling to their ethnicity to improve their situation. Much has been saidabout politics being a determinant of the salience of ethnic cleavages. We suggest thatthe interaction may as well be analyzed the other way round. To a large extent, ethnicidentities might be shaped by social and economic contexts and, in turn, determinecritical political variables such as participation (Siegel 2009), the patterns of patronage(Kasara 2007), inter-group conflicts (Gibson and Gouws 2000) or cooperation (Transue2007) and voting motivations (Wantchekon 2003). The capacity of the State to provideits citizens with a fluid job market or widespread education partly determines thecitizen’s attitude to the nation (see Hayward (2003) in the American urban context).In this respect, the openness of a society, as measured by open access to educationand protected jobs, appears not only as an expected product but as a condition for theconstruction of a nation. Active policies in that area therefore not only serve well-beingand equity, but also promote conscious citizenship and inclusive democracy.
19

ReferencesAntoine, Philippe, and Sidiki Coulibaly. 1989. L’insertion urbaine des migrants en
Afrique. Editions de l’ORSTOM, Paris.
Arrow, Kenneth J. 1972. “Gifts and Exchanges.” Philosophy and Public Affairs1:4:343–362.
Banégas, Richard. 2007. “Côte d’Ivoire: "les jeunes se lèvent en hommes". Anticolo-nialisme et ultranationalisme chez les Jeunes Patriotes d’Abidjan.” Les Etudes duCERI, vol. 137.
Bates, Robert. 1974. “Ethnic Competition and Modernization in ContemporaryAfrica.” Comparative Political Studies 6:4:457–482.
Bazenguissa-Ganga, Rémy. 1999. “The Spread of Political Violence in Congo-Brazzaville.” African Affairs 98:37–54.
Bossuroy, Thomas, and Denis Cogneau. 2008. “Social Mobility and Colonial Legacyin Five African Countries.” DIAL Working Paper 2008-10.
Bourdieu, Pierre. 1986. Chapter The Forms of Capital of Handbook of Theory andResearch in the Sociology of Education, edited by John G. Richardson. GreenwaldPress, Greenwald Press.
Bourdieu, Pierre, and Jean-Claude Passeron. 1979. The Inheritors: French Studentsand their Relation to Culture. University of Chicago Press.
Brass, Paul R. 1976. “Ethnicity and Nationality Formation.” Ethnicity 3:225–241.
Brehm, John, and Wendy Rahn. 1997. “Individual-Level Evidence for the Causes andConsequences of Social Capital.” American Journal of Political Science 41(3):999–1023.
Chandra, Kanchan. 2005. Chapter A Constructivist Dataset on Ethnicity and Insti-tutions of Identity as a Variable, edited by R. Abdelal, Y. Herrera, A.I. Johnston,and R. McDermott.
. 2006. “What is Ethnic Identity and Does it Matter?” Annual Review ofPolitical Science 9:397–424.
Charney, Evan. 2003. “Identity and Liberal Nationalism.” American Political ScienceReview 97(2):295–310.
Coleman, James S. 1990. Foundations of Social Theory. Harvard University Press.
Eifert, Benn, Edward Miguel, and Daniel N. Posner. 2010. “Political Competition andEthnic Identification in Africa.” American Journal of Political Science 54(2):494–510.
Fafchamps, Marcel. 1992. “Solidarity Networks in Preindustrial Societies: RationalPeasants with a Moral Economy.” Economic Development and Cultural Change41 (1): 147–74.
Fearon, James D. 1999. “What is Identity (as we now use the word)?” Working Paper,Stanford University.
20

. 2003. “Ethnic and Cultural Diversity by Country.” Journal of EconomicGrowth 8(2):195–222.
Gibson, James L., and Amanda Gouws. 2000. “Social Identities and Political Intol-erance: Linkages within the South African Mass Public.” American Journal ofPolitical Science 44(2):278–292.
Glaeser, Edward L., David Laibson, and Bruce Sacerdote. 2002. “An EconomicApproach to Social Capital.” Economic Journal 112 (483): 437–458 (November).
Glazer, Nathan, and Daniel P. Moynihan. 1963. Beyond the Melting-Pot. Edited byHarvard University Press and MIT Press. Cambridge.
Granovetter, Mark S. 1974. Getting a Job. A Study of Contacts and Careers. Uni-versity Press.
Greif, Avner. 1993. “Contract Enforceability and Economic Institutions in EarlyTrade: the Maghribi Traders’ Coalition.” American Economic Review 83(3):525–48.
Habyarimana, James, Macarthan Humphreys, Daniel N. Posner, and Jeremy Wein-stein. 2006. “Social Focal Points.” Working Paper.
. 2007. “Why Does Ethnic Diversity Undermine Public Goods Provision?”American Political Science Review, vol. 101(4).
Hayward, Clarissa R. 2003. “The Difference States Make: Democracy, Identity, andthe American City.” American Political Science Review 97(4):501–514.
Karlan, Dean. 2007. “Social Connections and Group Banking.” Economic Journal117:52–84.
Kasara, Kimuli. 2007. “Tax Me If You Can: Ethnic Geography, Democracy, and theTaxation of Agriculture in Africa.” American Political Science Review 101(1):159–172.
Luke, Nancy, and Kaivan Munshi. 2006. “New Roles for Marriage in Urban Africa:Kinship Networks and the Labor Market in Kenya.” Review of Economics andStatistics 88(2):264–282.
Miguel, Edward. 2004. “Tribe or Nation? Nation Building and Public Goods in Kenyaversus Tanzania.” World Politics 56:327–62.
Miguel, Edward, and Mary K. Gugerty. 2005. “Ethnic Diversity, Social Sanctions andPublic Goods in Kenya.” Journal of Public Economics 89(11-12):2325–2368.
Miles, William F. S., and David A. Rochefort. 1991. “Nationalism Versus EthnicIdentity in Sub-Saharan Africa.” American Political Science Review 85(2):393–403.
Munshi, Kaivan. 2003. “Networks in the Modern Economy: Mexican Migrants in theU. S. Labor Market.” Quarterly Journal of Economics, pp. 549–599.
Norris, Pippa, and Robert Mattes. 2003. “Does Ethnicity Determine Support for theIncumbent Party?” KSG Working Paper Series, vol. RWP03-009.
21
Posner, Daniel N. 2004a. “Measuring Ethnic Fractionalization in Africa.” AmericanJournal of Political Science 48:849–863.
. 2004b. “The Political Salience of Cultural Difference: Why Chewas andTumbukas Are Allies in Zambia and Adversaries in Malawi.” American PoliticalScience Review 98:529–545.
. 2006. Institutions and Ethnic Politics in Africa. Cambridge University Press.
Proteau, Laurence. 2002. Passions scolaires en Côte d’Ivoire. Ecole, Etat et société.Karthala, Paris.
Putnam, Robert D. 1995. “Bowling Alone: America’s Declining Social Capital.”Journal of Democracy 6:1:65–78.
Salamone, Frank A. 1985. “Colonialism and the Emergence of Fulani Identity.”Journal of Asian and African Studies 20:193–202.
Siegel, David A. 2009. “Social Networks and Collective Action.” American Journalof Political Science 53(1):122–138.
Sobel, Joel. 2002. “Can We Trust Social Capital?” Journal of Economic Literature40 (1): 139–154.
Transue, John E. 2007. “Identity Salience, Identity Acceptance, and Racial Policyattitudes: American National Identity as a Uniting Force.” American Journal ofPolitical Science 51(1):78–91.
Wantchekon, Leonard. 2003. “Clientelism and Voting Behavior.” World Politics55:399–422.
Whyte, William F. 1943. Street Corner Society: The Social Structure of an ItalianSlum. University of Chicago Press (reed. 1993).
Willame, Jean-Claude. 1998. “Congo. Le sens d’une trajectoire.” La Revue Nouvelle,vol. 11.
Wirth, Louis. 1927. “The Ghetto.” American Journal of Sociology 33(1):57–71.
22
The Southern Africa Labour and Development Research Unit (SALDRU) conducts research directed at improving the well-being of South Africa’s poor. It was established in 1975. Over the next two decades the unit’s research played a central role in documenting the human costs of apartheid. Key projects from this period included the Farm Labour Conference (1976), the Economics of Health Care Conference (1978), and the Second Carnegie Enquiry into Poverty and Development in South Africa (1983-86). At the urging of the African National Congress, from 1992-1994 SALDRU and the World Bank coordinated the Project for Statistics on Living Standards and Development (PSLSD). This project provide baseline data for the implementation of post-apartheid socio-economic policies through South Africa’s fi rst non-racial national sample survey. In the post-apartheid period, SALDRU has continued to gather data and conduct research directed at informing and assessing anti-poverty policy. In line with its historical contribution, SALDRU’s researchers continue to conduct research detailing changing patterns of well-being in South Africa and assessing the impact of government policy on the poor. Current research work falls into the following research themes: post-apartheid poverty; employment and migration dynamics; family support structures in an era of rapid social change; public works and public infrastructure programmes, fi nancial strategies of the poor; common property resources and the poor. Key survey projects include the Langeberg Integrated Family Survey (1999), the Khayelitsha/Mitchell’s Plain Survey (2000), the ongoing Cape Area Panel Study (2001-) and the Financial Diaries Project.
www.saldru.uct.ac.za
Level 3, School of Economics Building, Middle Campus, University of Cape Town
Private Bag, Rondebosch 7701, Cape Town, South Africa
Tel: +27 (0)21 650 5696
Fax: +27 (0) 21 650 5797
Web: www.saldru.uct.ac.za
southern africa labour and development research unit