SOUTH AFRICAN CARBONATED SOFT DRINKS INDUSTRY … · REPORT OVERVIEW 5 The South African Carbonated...
22
SOUTH AFRICAN CARBONATED SOFT DRINKS INDUSTRY LANDSCAPE REPORT COMPILED: JANUARY 2019
Transcript of SOUTH AFRICAN CARBONATED SOFT DRINKS INDUSTRY … · REPORT OVERVIEW 5 The South African Carbonated...
SOUTH AFRICAN
CARBONATED SOFT DRINKS
INDUSTRY LANDSCAPE REPORT
COMPILED: JANUARY 2019

We offer B2B market research solutions to help you to
successfully improve or expand your business, enter new
markets, launch new products or better understand your
internal or external environment.
At Insight Survey, we believe in the advantage marketing research gives business
leaders to fully understand their industry, facilitate business development strategy,
highlight company performance, and nurture industry growth.
Insight Survey is a South African B2B market researchcompany with more than 10 years experience, focusing onbusiness-to-business (B2B) market research to ensuresmarter, more-profitable business decisions are made withreduced investment risk.
COMPANY OVERVIEW
At Insight Survey, we believe in the advantage marketing research gives business
leaders to fully understand their industry, facilitate business development strategy,
highlight company performance, and nurture industry growth.
▪ Our bespoke Competitive Business
Intelligence Research can help give the edge
in a global marketplace, empowering your
business to overcome industry challenges
quickly and effectively, and enabling you to
realise your potential and achieve your
vision.
▪ From strategic overviews of your business’s
competitive environment through to specific
competitor profiles, our customised
Competitive Intelligence Research is
designed to meet your unique needs.
WHY?
▪ Competitor pricing research
▪ Store visits and store checks
▪ Competitor interviews
▪ Customer interviews
▪ Company website analysis
▪ Governmental held records
SOLUTIONS
INDUSTRY AND COMPETITIVE INTELLIGENCE OVERVIEW

FOOD AND BEVERAGES INDUSTRY REPORT CLIENTS
Our Food and Beverages Industry Landscape reports have been purchased by global and South African companies:
4

REPORT OVERVIEW
5
The South African Carbonated Soft Drinks Industry Landscape Report (140 pages) provides a dynamic synthesis of industry
research, examining the local and global Carbonated Soft Drinks Industry from a uniquely holistic perspective, with detailed insights into
the entire value chain – from manufacturing to retailing, market size trends, industry trends, industry drivers & challenges, competitor and
pricing analysis.
For the Global Carbonated Soft Drinks Industry Section:
What are the current market dynamics (market environment, production, key regional markets) of the Global Carbonated Soft
Drinks industry?
What are the Global Carbonated Soft Drinks industry trends, drivers, and challenges?
For the South African Carbonated Soft Drinks Industry Section:
What are the current market dynamics (market size, market value, market volumes: 2012-2018 Actual, 2019-2023 Forecasts) of
the SA Carbonated Soft Drinks industry?
Who are the key manufacturing players in the SA Carbonated Soft Drinks industry?
What are the South African industry trends, drivers, and challenges?
For the South African Retail and Pricing Analysis Section:
Who are the key retail players (retail outlets and convenience stores) in the Carbonated Soft Drinks industry?
What are the prices of frequently purchased Carbonated Soft Drinks brands across SA retail outlets?
SOME KEY QUESTIONS THE REPORT WILL HELP YOU TO ANSWER:
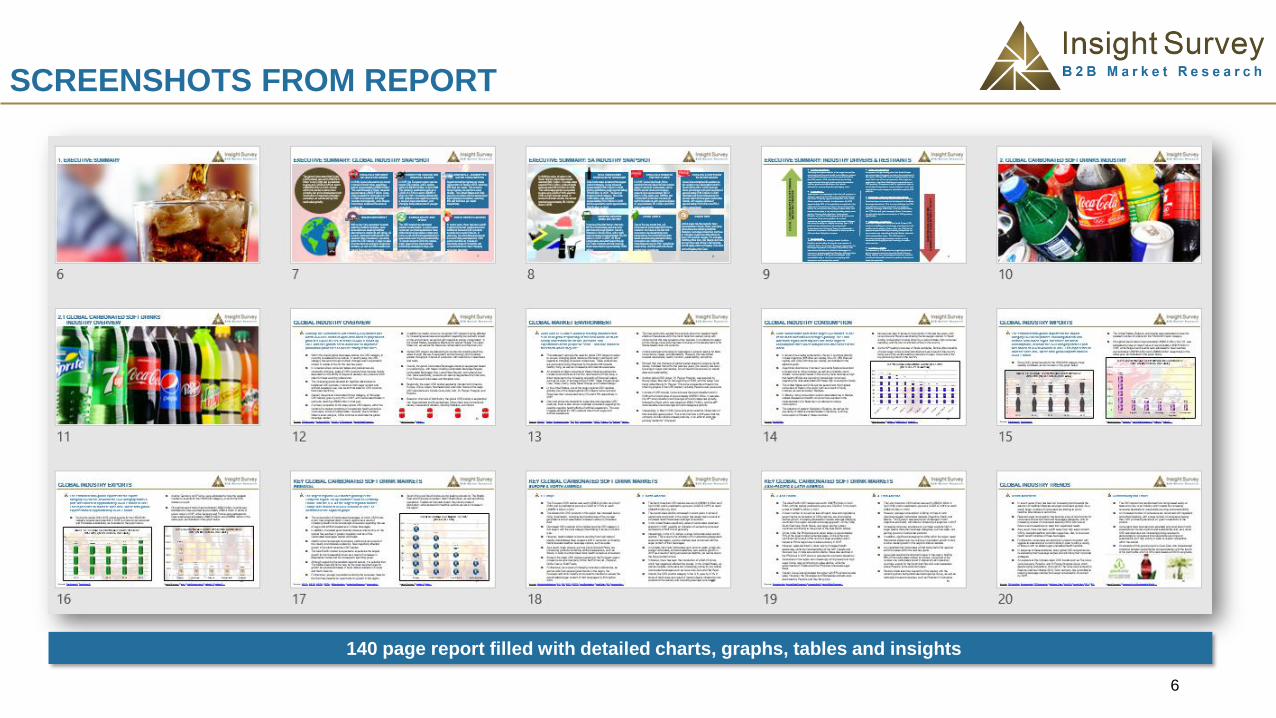
SCREENSHOTS FROM REPORT
6
140 page report filled with detailed charts, graphs, tables and insights

❑ South Africa and Saudi Arabia are the leading markets for The Middle
East and Africa due to modern retail infrastructure, as well as botting
operations. Traditional channels remain the primary mode of
distribution, while demand for healthier options are set to increase in
the region.
7
Source: MDF1; MDF2; MDF3; MDF4; MillionInsights; MordorIntelligence; Euromonitor Image Source: Pixabay; Today
132.9
110.1
75.9
38
0
20
40
60
80
100
120
140
Europe North America Asia-Pacific Latin America
TOP 4 REGIONAL CSD MARKETS: 2017(IN US$ BILLION)
The largest regional CSD market globally is the
European region, led by countries such as Germany,
France, and the U.K. As the largest regional market,
Europe was valued at US$132.9 billion in 2017, as
illustrated in the adjacent graph.
❑ The consumption of Carbonated beverages, of which CSD forms
a part, has remained static in many regions as a result of
increasing health concerns amongst consumers regarding the use
of sugar and artificial sweeteners in these beverages.
❑ In addition, increased governmental pressure and scrutiny on the
market has resulted in greater regulation and tax of the
Carbonated beverages market worldwide.
❑ Health concerns amongst consumers, particularly as a result of
the obesity and diabetes epidemics, have negatively affected
growth in the North American CSD market.
❑ The Asia-Pacific market is expected to experience the largest
growth for the foreseeable future as a result of increases in
disposable income and the consequent spending power.
❑ Although remaining the smallest regional market, it is possible that
The Middle East and Africa may be the most important area for
growth as volumes decrease in more mature markets in Europe
and North America.
❑ Furthermore, younger populations entering the consumer class for
the first time presents an opportunity for growth in this region.
SAMPLE FROM REPORT:KEY GLOBAL CARBONATED SOFT DRINK MARKETS

SAMPLE FROM REPORT:SA INDUSTRY TRENDS
8
Exotic Flavours
❑ The use of exotic flavours in CSD products is one the current
trends that will continue to be relevant in the future. Soft drinks will
be enriched with exotic flavours like passion fruit and other
unexpected ingredients, such as seaweed or chillies.
❑ Furthermore, the packaging designs of these products will more
than likely feature lush tropic greens and the bright colours of
tropical flora and fauna.
❑ There are some industry players in South Africa that have
introduced CSD products with exotic flavours. PURA Soda, for
example, offers both lemon and elderflower and cucumber and
lime flavoured sodas. Another example is Woolworths that sells a
sparkling ruby grapefruit flavoured drink and a pear and
elderflower sparkling drink under its private label.
Clean Labels
❑ One of the key trends that is expected to influence the beverage
industry, and specifically Carbonated Soft Drinks, in the future is
the fact that consumers are demanding total transparency from
brands and clean labels are becoming standard for many
products.
❑ The term Clean label refers to a consumer driven movement,
which is demanding a return to real food. In other words, food
products that consists of only natural, familiar and simple
ingredients, and do not contain any artificial ingredients or
synthetic chemicals.
❑ The movement towards clean labels means that many beverage
companies will have to reconsider their production chains, as well
as the way they communicate with consumers and create
awareness for the key issues within their industry.
❑ There are some CSD products available in the South African
industry that are marketed as natural with less ingredients. PURA
Soda, for example, has a CSD product range which they claim
has only five ingredients and a small amount of pure cane sugar.
They also suggest that the natural flavours of their products come
from natural sources and that no colourants are added to their
products.
❑ Consumers are becoming more aware of environmental issues
and expecting companies to act responsibly. Many are insisting
that manufacturers ought to source their ingredients locally and
responsibly, and that products should contain less ingredients.
Source: Drinkstuff; GoClean; Bizcommunity; Pura; Drinkstuff2; Pura2; Woolworths; Woolworths2 Image Source: Pineapple; Pura
65.5
16.0
14.5
2.31.3
0.4
CHANNEL DISTRIBUTION FOR CARBONATES PRODUCTS: 2018
Modern Grocery Retailers
On-trade
Traditional Grocery Retailers
Mixed Retailers
Non-Grocery Specialists
Non-Store Retailing
Channel Distribution (2012 and 2018)
By Outlet Type
Revenue Share (%)
(2012 and 2018)
Revenue Share
(in ZAR million)
(2012 and 2018)
Store-Based Retailing 81.4% 83.6% 3,111.4 4,283.0
Grocery Retailers 77.9% 80.0% 2,977.6 4,097.1
Modern Grocery Retailers 65.5% 65.5% 2,505.6 3,353.2
Convenience Stores 12.7% 12.8% 483.6 657.5
Discounters 3.0% 3.0% 116.2 151.9
Forecourt Retailers 5.4% 5.7% 206.9 292.2
Hypermarkets 3.2% 3.2% 120.9 162.6
Supermarkets 41.3% 40.8% 1,578.0 2,089.0
Traditional Grocery Retailers 12.3% 14.5% 472.0 744.0
Food/drink/tobacco specialists 1.5% 1.7% 58.1 88.2
Independent Small Grocers 7.5% 9.5% 286.1 484.1
Other Grocery Retailers 3.3% 3.4% 127.8 171.7
Mixed Retailers 2.2% 2.3% 84.8 118.3
Non-Grocery Specialists 1.3% 1.3% 49.0 67.6
Non-Store Retailing 0.4% 0.4% 13.5 19.8
Vending 0.1% 0.1% 4.1 4.3
Internet Retailing 0.2% 0.3% 9.4 15.5
On-trade 18.2% 16.0% 697.6 818.5
SAMPLE FROM REPORT:CARBONATED SOFT DRINKS DISTRIBUTION CHANNELS
9
Source: Euromonitor Image Source: PAVBCA; The Noun Project; OnlineWebFonts; KissPNG
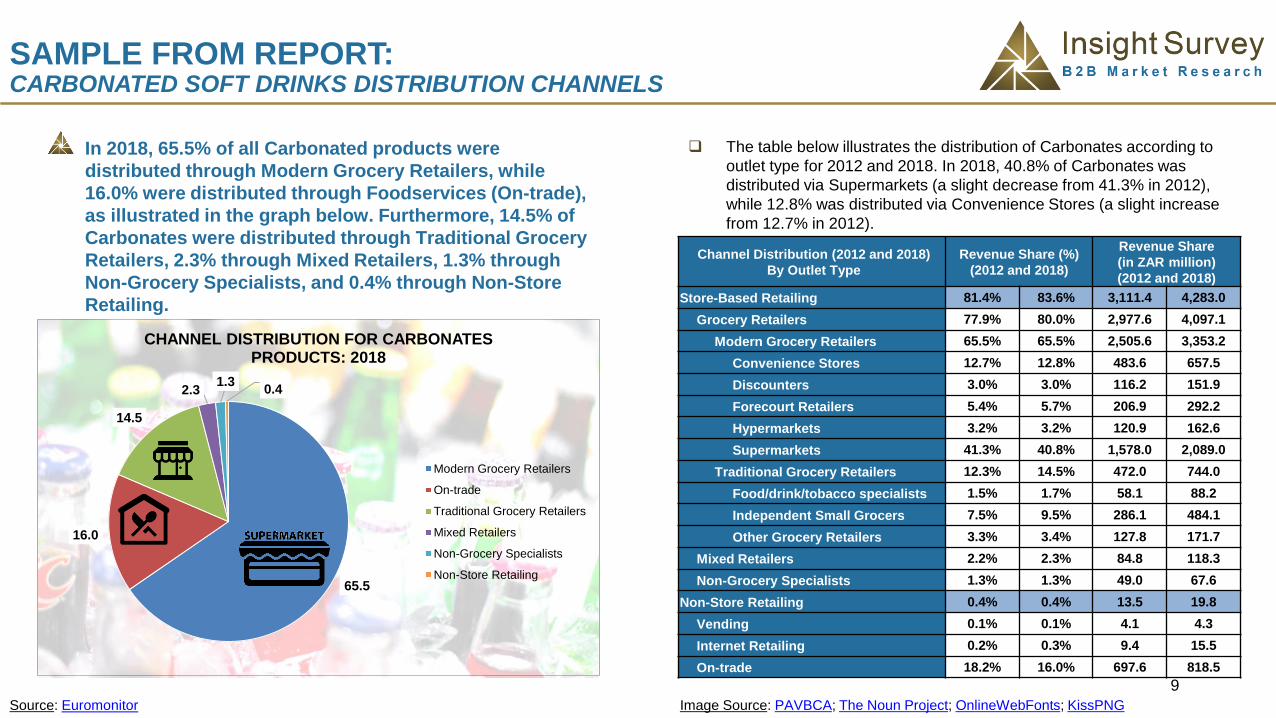
In 2018, 65.5% of all Carbonated products were
distributed through Modern Grocery Retailers, while
16.0% were distributed through Foodservices (On-trade),
as illustrated in the graph below. Furthermore, 14.5% of
Carbonates were distributed through Traditional Grocery
Retailers, 2.3% through Mixed Retailers, 1.3% through
Non-Grocery Specialists, and 0.4% through Non-Store
Retailing.
❑ The table below illustrates the distribution of Carbonates according to
outlet type for 2012 and 2018. In 2018, 40.8% of Carbonates was
distributed via Supermarkets (a slight decrease from 41.3% in 2012),
while 12.8% was distributed via Convenience Stores (a slight increase
from 12.7% in 2012).

• Frugo Apple Juice Sparkling
• Kingsley
• Kingsley Cream Soda
• Kingsley Dry Lemon
• Kingsley Ginger Ale
• Kingsley Ginger Beer
• Kingsley Iron Brew
• Kingsley Cola (Cola Caffeine Free, Cola Zero)
• Kingsley Kool (Original, Zero)
• Kingsley Lemonade
• Kingsley Tonic Water
KINGSLEY BEVERAGES CARBONATED SOFT DRINKS BRANDS/PRODUCTS:
10
Established in 2007, Kingsley Beverages produces,
markets, and distributes a variety of beverage brands
and products throughout South Africa.
❑ The focus of the business is to provide consumers with an
affordable option of upscale soft drink brands, as well as
alternative beverages.
❑ Kingsley Beverages’ mission is to continually provide their
customers with premium quality and great tasting beverages that
are made using natural ingredients, where possible.
❑ The group has regional headquarters in Dubai, Johannesburg,
and London. In South Africa, the group has four manufacturing
sites which are located in Johannesburg, Mogale City, Springs,
and Roodepoort.
❑ In addition, their products are distributed through a wide network
comprising of Africa, the Middle East, and Europe.
❑ In 2016, Kingsley Beverages announced that the company would
be investing £36 million in a bottling facility in the United Kingdom.
Production at the facility was set to commence in 2017.
❑ Their brands portfolio is divided into Kingsley soft drinks, sports &
energy drinks, Kingsley mixers, fruit drinks, ice tea, and water. A
variety of carbonated beverages are available within the Kingsley
fruit drinks, soft drinks, and mixers categories.
❑ Additionally, in 2016, Kingsley Beverages also became the official
sponsor for the football tournament, La Liga.
Source: Kingsley1; Kingsley2; FDB; TM; Kingsley-UK; Sport; Kingsley3; Kingsley4; Frugo Image Source: BSDA; Kingsley1; Kingsley2
SAMPLE FROM REPORT:KINGSLEY BEVERAGES: OVERVIEW

11
Bashew’s:
❑ Established in 1899, Bashew’s is a Cape Town original
Carbonated Soft Drink, which is available in several flavours.
❑ Bashew’s flavours include pineapple, cream soda, iron brew,
raspberry, cocopine, orange, ginger beer, and Harry’s cola. The
beverages are available in either a 330ml can or glass bottle.
Country Club:
❑ Country Club is a range of sparkling beverages created to be a
fashionable alcohol-free alternative for social occasions including
daily refreshment, sundowners, and cocktail hours.
❑ The range is available in three distinctive flavours namely, rock
shandy, lime & soda, and passion fruit & lemonade. These
beverages are available in 200ml cans.
Fitch & Leedes:
❑ Fitch & Leedes is a range of sparkling beverages that can be
enjoyed on its own or incorporated as a mixer in cocktails and
other alcoholic beverages.
❑ Their flavours include bitter lemon, Indian tonic, lemonade, ginger
ale, craft cola, pink tonic and a recently released blue tonic. The
Indian tonic and pink tonic are also available as a lite variant that
is sugar free. These are all available in either a 200ml can or
glass bottle.
Source: Bashew's; Bashew's 2; Bashew's 3; Bashew's 4; Fl; Country Club; F&L1; F&L2; PnP; Makro Image Source: Wordpress; African Premium Brands; ChillDirect; ESFUAE
SAMPLE FROM REPORT:CHILL BEVERAGES: CARBONATED SOFT DRINK BRANDS

12This pricing analysis was conducted at retail stores and supermarkets during w/c 1 October 2018.
BRAND AND SIZE
Fever-Tree Tonic
Water200ml X 4 N/A N/A N/A N/A R59.99 N/A N/A R68.58
Fitch & Leedes
Indian Tonic200ml X 6 R49.99 N/A N/A R45.00 R52.99 N/A R49.99 N/A
Frankie’s 500ml R14.99 N/A N/A R13.45R89.99
(500ml X 6)R13.99 N/A N/A
Fruitavit Super
Juice330ml N/A R11.99 R12.19 R10.79
R72.99
(330ml X 6)N/A N/A N/A
Grapetiser330ml R12.99 R12.99 R14.19 R10.06 R12.99 R12.99 R12.99 N/A
1.25L R17.99 R21.99 R25.99 R21.08 R24.99 R17.99 R25.99 N/A
Iron Brew
440ml R10.49 R10.99 N/A R8.33 N/A R10.49 R10.00 N/A
2L R14.99 N/A R15.99 R17.90 R16.99R11.99
(Special)R13.99 N/A
Jive500ml R7.99 N/A N/A R5.00 N/A R7.99 R7.50 N/A
2L R12.99 N/A R11.99 R12.50 R13.99 R12.99 R12.99 N/A
Just Juice 330ml X 6 R59.99R11.99
(per can)
R12.99
(per can)R52.95 R72.99 R59.99
R10.00
(per can)N/A
SAMPLE FROM REPORT:CARBONATED SOFT DRINKS PRICING ANALYSIS

2. Global Carbonated Soft Drinks Industry (14 pages):
2.1 Global Carbonated Soft Drinks Industry Overview (14 pages)
2.1 Global Industry Overview
2.2 Global Market Environment
2.3 Global Industry Consumption: TOP 10 SODA CONSUMING COUNTRIES: 2017 (IN LITRES PER CAPITA) (Graph)
2.4 Global Industry Imports: VALUE OF GLOBAL HS220210 CATEGORY IMPORTS: 2013-2017 (IN BILLION US DOLLARS); TOP 5 HS220210 CATEGORY IMPORTING
COUNTRIES: 2017 (IN MILLION US DOLLARS) (Graphs)
2.5 Global Industry Exports: VALUE OF GLOBAL H220210 CATEGORY EXPORTS: 2013-2017 (IN BILLION US DOLLARS); TOP 5 HS220210 CATEGORY EXPORTING
COUNTRIES: 2017 (IN MILLION US DOLLARS) (Graphs)
2.6 Key Global Carbonated Soft Drinks Markets: Regional: TOP 4 REGIONAL CSD MARKETS: 2017 (IN US$ BILLION) (Graph)
2.7 Key Global Carbonated Soft Drinks Markets: Europe & North America
2.8 Key Global Carbonated Soft Drinks Markets: Asia-Pacific & Latin America
2.9 Global Industry Trends
2.10 Global Industry Drivers
2.11 Global Industry Challenges
1. Executive Summary (3 pages):
1.1 Global Industry Snapshot
1.2 South African Industry Snapshot
1.3 Industry Drivers & Restraints
TABLE OF CONTENTS
13

3. South African Carbonated Soft Drinks Industry (88 pages):
3.1 South African Carbonated Soft Drinks Industry Overview (26 pages)
3.1.1 South African Industry Overview
3.1.2 South African Market Environment
3.1.3 South African Imports and Exports
3.1.4 South African Industry Market: South African Carbonates Market Definitions
3.1.5 South African Industry Market: South African Carbonates Distribution Channel Definitions
3.1.6 South African Industry Market Size: Carbonates Market (2012-2018): VALUE OF SA CARBONATES MARKET: 2012-2018 (IN ZAR BILLION); SA CARBONATES
MARKET CAGR AND TOTAL GROWTH (IN PERCENTAGE) (Graph and Table)
3.1.7 South African Industry Market Size: Carbonates (2012-2018: By Category): VALUE OF SA CARBONATES MARKET BY CATEGORY: 2012-2018 (IN ZAR BILLION)
(Graph)
3.1.8 South African Industry Market Size: Cola Carbonates (2012-2018: By Category): VALUE OF SA COLA CARBONATES MARKET BY CATEGORY: 2012-2018 (IN ZAR
BILLION) (Graph)
3.1.9 South African Industry Market Size: Non-Cola Carbonates (2012-2018: By Category): VALUE OF SA NON-COLA CARBONATES MARKET BY CATEGORY: 2012-2018
(IN ZAR BILLION) (Graph)
3.1.10 South African Industry Market Size: Carbonates Market (Forecast: 2019*-2023*): VALUE OF SA CARBONATES MARKET: 2018 & 2023* (IN ZAR BILLION); SA
CARBONATES MARKET VALUE FORECAST BY CATEGORY (IN ZAR MILLION) (Graph and Table)
3.1.11 South African Industry Market Size: Carbonates Market Volumes (2012-2023*): RETAIL VOLUME OF SA CARBONATES MARKET 2012-2023* (Table)
3.1.12 South African Market Environment: Top Carbonates Companies: TOP CARBONATES COMPANIES IN SOUTH AFRICA: 2018 (REVENUE SHARE IN ZAR MILLION); TOP
CARBONATES COMPANIES: 2012 VS 2018 (REVENUE SHARE IN PERCENTAGE AND ZAR MILLION) (Graph and Table)
3.1.13 South African Market Environment: Top Carbonates Companies (Per Category): TOP CARBONATES COMPANIES (PER CATEGORY) IN 2018 (MARKET SHARE IN
PERCENTAGE AND ZAR MILLION) (Table)
3.1.14 South African Market Environment: Top 10 Carbonates Brands: TOP 10 CARBONATES BRANDS IN SOUTH AFRICA: 2018 (REVENUE SHARE IN ZAR MILLION); TOP 10
CARBONATES BRANDS: 2012 VS 2018 (REVENUE SHARE IN PERCENTAGE AND ZAR MILLION) (Graph and Table)
TABLE OF CONTENTS
14

3. South African Carbonated Soft Drinks Industry Continued (88 pages):
3.1 South African Carbonated Soft Drinks Industry Overview Continued (26 pages)
3.1.15 South African Market Environment: Top Carbonates Brands (Per Category): TOP CARBONATES BRANDS (PER CATEGORY) IN 2018 (REVENUE SHARE IN
PERCENTAGE AND ZAR MILLION) (Table)
3.1.16 South African Market Environment: Carbonates Distribution Channels: CHANNEL DISTRIBUTION FOR CARBONATES PRODUCTS: 2018; CHANNEL DISTRIBUTION
(2012 AND 2018) BY OUTLET TYPE (REVENUE SHARE IN PERCENTAGE AND ZAR MILLION) (Graph and Table)
3.1.17 South African Industry Trends
3.1.18 South African Industry Drivers
3.1.19 South African Industry Challenges
3.2 South African Carbonated Soft Drinks Manufacturing (50 pages)
3.2.1 South African Carbonated Soft Drinks Manufacturing Overview (50 pages)
3.2.1.1 Chill Beverages: Overview
3.2.1.2 Chill Beverages: Carbonated Soft Drink Brands
3.2.1.3 Chill Beverages: Marketing: Bashew’s
3.2.1.4 Chill Beverages: Marketing: Fitch & Leedes
3.2.1.5 Clover: Overview
3.2.1.6 Clover: Financial Performance: KEY RESULTS FROM THE REVIEWED CONDENSED CONSOLIDATED SEGMENTAL INFORMATION (IN ZAR MILLIONS); CONSUMER
BRANDS REVENUE BY SEGMENT FROM THE CONDENSED CONSOLIDATED STATEMENT (IN ZAR MILLIONS); REVENUE FOR CLOVER’S DIVISIONS: 2018 (IN ZAR BILLION)
(Tables and Graph)
3.2.1.7 Clover: Carbonated Soft Drink Brands & Marketing
TABLE OF CONTENTS
15
3. South African Carbonated Soft Drinks Industry Continued (88 pages):
3.2 South African Carbonated Soft Drinks Manufacturing (50 pages)
3.2.1 South African Carbonated Soft Drinks Manufacturing Overview Continued (50 pages)
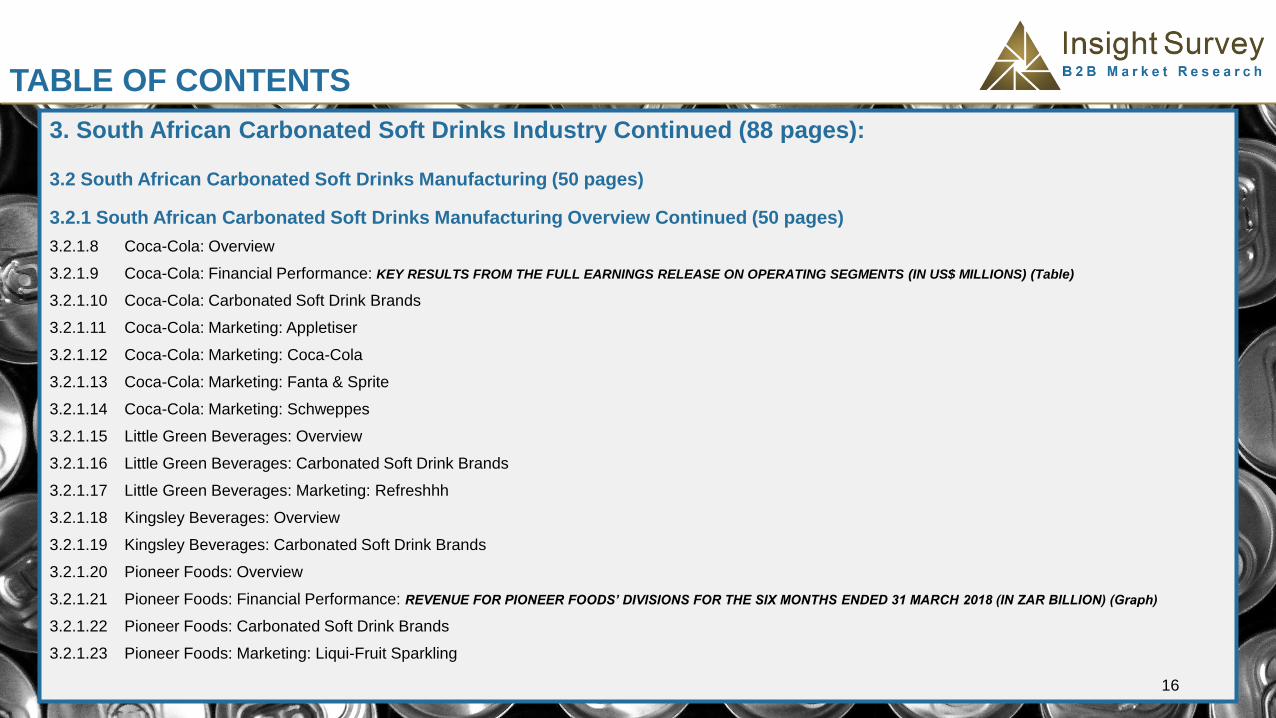
3.2.1.8 Coca-Cola: Overview
3.2.1.9 Coca-Cola: Financial Performance: KEY RESULTS FROM THE FULL EARNINGS RELEASE ON OPERATING SEGMENTS (IN US$ MILLIONS) (Table)
3.2.1.10 Coca-Cola: Carbonated Soft Drink Brands
3.2.1.11 Coca-Cola: Marketing: Appletiser
3.2.1.12 Coca-Cola: Marketing: Coca-Cola
3.2.1.13 Coca-Cola: Marketing: Fanta & Sprite
3.2.1.14 Coca-Cola: Marketing: Schweppes
3.2.1.15 Little Green Beverages: Overview
3.2.1.16 Little Green Beverages: Carbonated Soft Drink Brands
3.2.1.17 Little Green Beverages: Marketing: Refreshhh
3.2.1.18 Kingsley Beverages: Overview
3.2.1.19 Kingsley Beverages: Carbonated Soft Drink Brands
3.2.1.20 Pioneer Foods: Overview
3.2.1.21 Pioneer Foods: Financial Performance: REVENUE FOR PIONEER FOODS’ DIVISIONS FOR THE SIX MONTHS ENDED 31 MARCH 2018 (IN ZAR BILLION) (Graph)
3.2.1.22 Pioneer Foods: Carbonated Soft Drink Brands
3.2.1.23 Pioneer Foods: Marketing: Liqui-Fruit Sparkling
TABLE OF CONTENTS
16

3. South African Carbonated Soft Drinks Industry Continued (88 pages):
3.2 South African Carbonated Soft Drinks Manufacturing Continued (50 pages)
3.2.1 South African Carbonated Soft Drinks Manufacturing Overview Continued (50 pages)
3.2.1.24 Soda King: Overview
3.2.1.25 Soda King: Carbonated Soft Drink Brands
3.2.1.26 SoftBev: Overview
3.2.1.27 SoftBev: Carbonated Soft Drink Brands
3.2.1.28 SoftBev: Marketing: Coo-ee
3.2.1.29 SoftBev: Marketing: Jive & Mountain Dew
3.2.1.31 SoftBev: Marketing: Pepsi
3.2.1.32 Tiger Brands: Overview
3.2.1.33 Tiger Brands: Financial Performance: KEY RESULTS FROM THE INTERIM CONDENSED CONSOLIDATED SEGMENTAL INFORMATION (IN ZAR MILLIONS); CONSUMER
BRANDS REVENUE BY SEGMENT FROM THE INTERIM CONDENSED CONSOLIDATED STATEMENT (IN ZAR MILLIONS); REVENUE FOR TIGER BRANDS’ CONSUMER
BRANDS – FOOD DIVISION FOR THE SIX MONTHS ENDED 31 MARCH 2018 (IN ZAR BILLION) (Tables and Graph)
3.2.1.34 Tiger Brands: Carbonated Soft Drink Brands
3.2.1.35 Tiger Brands: Marketing: Rose’s
3.2.1.36 Twizza: Overview & Carbonated Soft Drink Brands
3.2.1.37 Twizza: Marketing: Twizza
3.2.1.38 Carbonated Soft Drink Manufacturers/Distributors: Other
TABLE OF CONTENTS
17

3. South African Carbonated Soft Drinks Industry Continued (88 pages):
3.2.2 South African Carbonated Soft Drinks: Private Labels (12 pages)
3.2.2.1 Food Lover’s Market: Overview
3.2.2.2 Food Lover’s Market: Carbonated Soft Drink Brands & Marketing
3.2.2.3 Pick n Pay: Overview
3.2.2.4 Pick n Pay: Financial Performance: KEY RESULTS FOR PICK N PAY IN SOUTH AFRICA FROM THE ANNUAL FINANCIAL STATEMENTS (IN ZAR MILLIONS); REVENUE
FOR PICK N PAY SOUTH AFRICA FOR THE YEAR ENDED 25 FEBRUARY 2018 (IN ZAR BILLION) (Table and Graph)
3.2.2.5 Pick n Pay: Carbonated Soft Drinks Brand & Marketing
3.2.2.6 Woolworths: Overview
3.2.2.7 Woolworths: Financial Performance: KEY RESULTS FROM THE INTEGRATED ANNUAL REPORT (IN ZAR MILLIONS); WOOLWORTHS FOOD INCOME STATEMENT (IN
ZAR MILLIONS); TURNOVER AND CONCESSIONAL SALES FOR WOOLWORTHS FOOD FOR THE YEAR ENDED 24 JUNE 2018 (IN ZAR MILLION) (Tables and Graph)
3.2.2.8 Woolworths: Carbonated Soft Drinks Brand
3.2.2.9 Woolworths: Marketing: Sparkling Flavoured Drink
TABLE OF CONTENTS
18

4. South African Carbonated Soft Drinks Retail Analysis (17 pages):
4.1 South African Carbonated Soft Drinks Retail Overview (5 pages)
4.1.1 South African Retail Overview
4.1.2 Checkers: Overview
4.1.3 Massmart: Overview
4.1.4 Shoprite: Overview
4.1.5 Spar: Overview
4.2 South African Convenience Stores Overview (6 pages)
4.2.1 Bonjour, La Boutique & Thrupps (Total): Overview
4.2.2 BP Express & Pick n Pay Express (BP): Overview
4.2.3 FreshStop (Caltex): Overview
4.2.4 QuickShop & Woolworths Food (Engen): Overview
4.2.5 Sasol Delight (Sasol): Overview
4.2.6 Shell Select & Spar Express (Shell): Overview
TABLE OF CONTENTS
19

TABLE OF CONTENTS
20
4. South African Carbonated Soft Drinks Retail Analysis (17 pages):
4.3 South African Carbonated Soft Drinks Pricing Analysis (6 pages)
4.3.1 Cola Carbonates Pricing Analysis – Coca-Cola; Cola-Cola Life; Coca-Cola Light; Coca-Cola Zero Sugar; Coo-ee Cola, Pepsi, Pepsi Light, Pepsi Max,
Private Label, Refreshhh Cola, Tab, Twizza – Comparative pricing at Checkers, Food Lover’s Market, Game, Makro, Pick n Pay, Shoprite, Spar, Woolworths
4.3.1 Non-Cola Carbonates Pricing Analysis – 7-Up; 7-Up Sugar Free; Appletiser; Barker & Quin; Bashew’s; Coo-ee; Country Club; Double Dutch Premium Mixer;
Fanta; Fever-Tree Tonic Water; Fitch & Leedes Indian Tonic; Frankie’s; Fruitavit Super Juice; Grapetiser; Iron Brew; Jive; Just Juice; Liqui Fruit CranberRy
Juice; Mirinda; Monis Sparkling Fruit Juice; Mountain Dew; Private Label; PURA Soda; Refreshhh Lemonade; Rose’s Lime & Lemonade; Sanpellegrino
Aranciata Rossa; Schweppes Lemonade; Spar-letta; Sprite; Sprite Zero; Stoney Extra Kwetsa; Twist; Twizza – Comparative pricing at Checkers, Food Lover’s
Market, Game, Makro, Pick n Pay, Shoprite, Spar, Woolworths
ORDER FORM
21
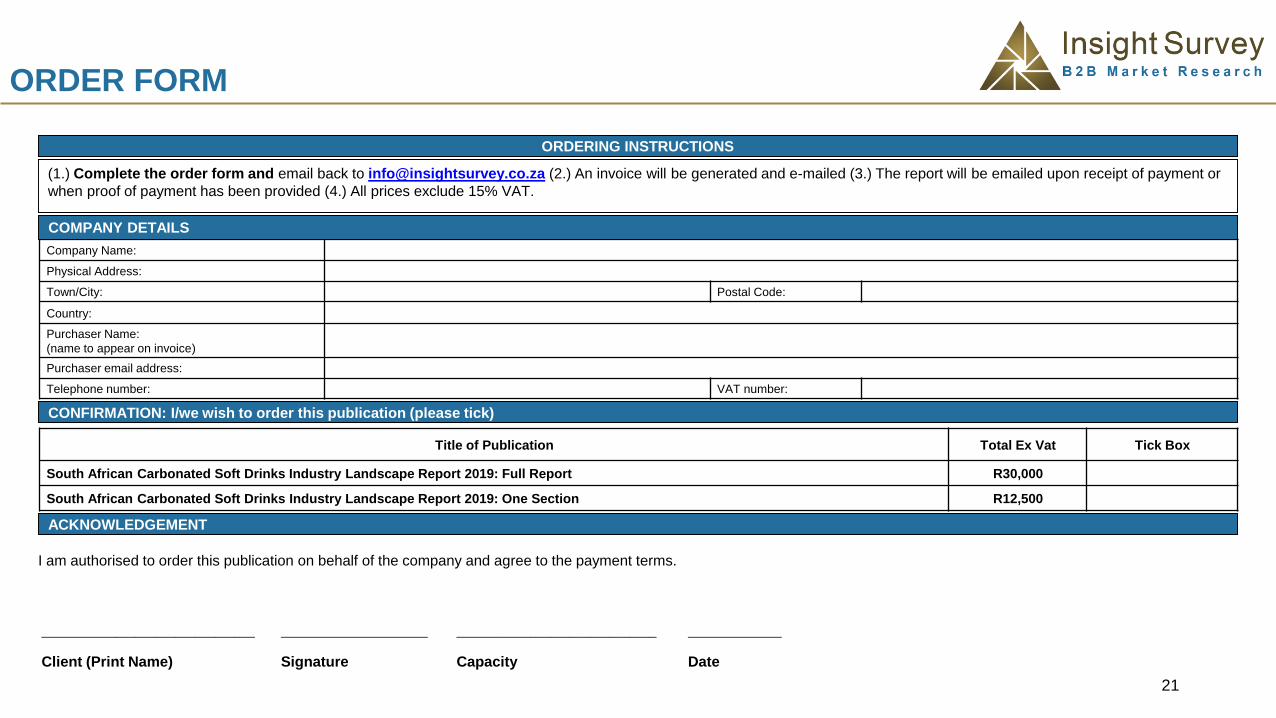
ORDERING INSTRUCTIONS
Company Name:
Physical Address:
Town/City: Postal Code:
Country:
Purchaser Name:
(name to appear on invoice)
Purchaser email address:
Telephone number: VAT number:
CONFIRMATION: I/we wish to order this publication (please tick)
Title of Publication Total Ex Vat Tick Box
South African Carbonated Soft Drinks Industry Landscape Report 2019: Full Report R30,000
South African Carbonated Soft Drinks Industry Landscape Report 2019: One Section R12,500
ACKNOWLEDGEMENT
I am authorised to order this publication on behalf of the company and agree to the payment terms.
________________________________
Client (Print Name)
______________________
Signature
______________________________
Capacity
______________
Date
(1.) Complete the order form and email back to [email protected] (2.) An invoice will be generated and e-mailed (3.) The report will be emailed upon receipt of payment or
when proof of payment has been provided (4.) All prices exclude 15% VAT.
COMPANY DETAILS
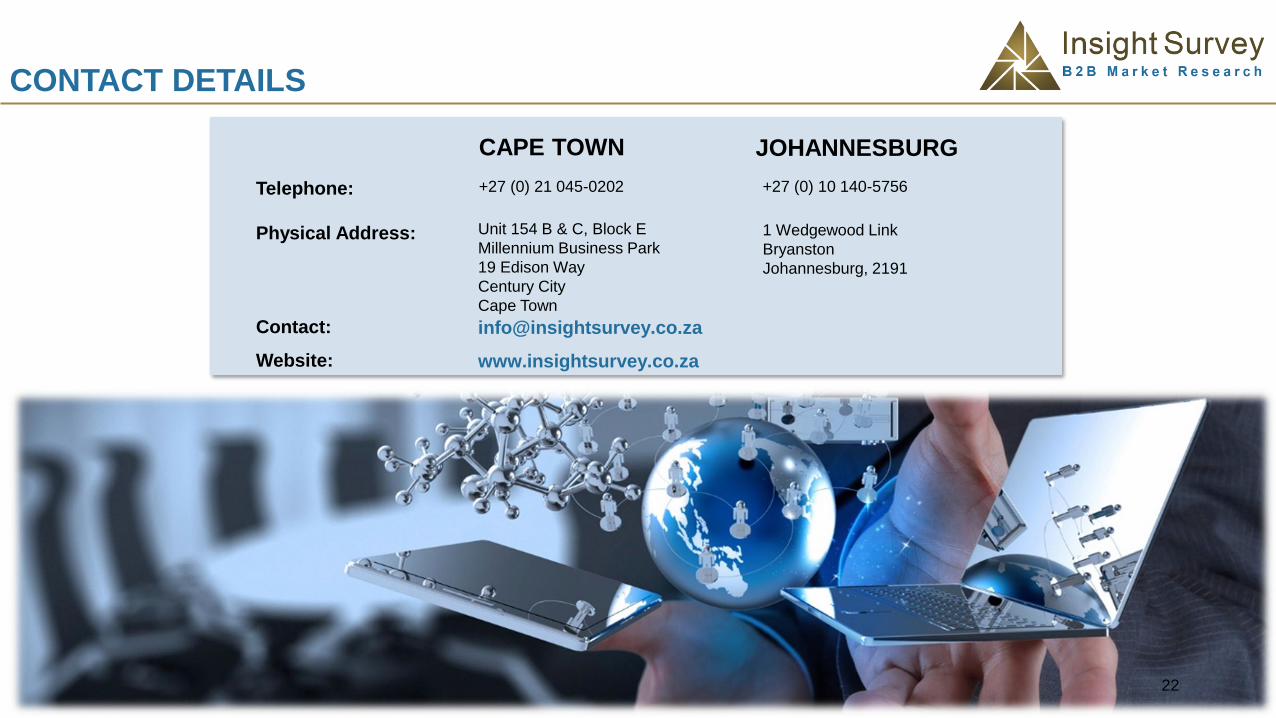
CONTACT DETAILS
Telephone:
Physical Address:
CAPE TOWN JOHANNESBURG
+27 (0) 10 140-5756+27 (0) 21 045-0202
Unit 154 B & C, Block E
Millennium Business Park
19 Edison Way
Century City
Cape Town
1 Wedgewood Link
Bryanston
Johannesburg, 2191
Contact:
Website:
www.insightsurvey.co.za
22