Simplifying Sweetness: The Difference Between Buzz and Behavior Around Carbonated Soft Drinks
10
SIMPLIFYING SWEETNESS THE DIFFERENCE BETWEEN BUZZ AND BEHAVIOR AROUND CARBONATED SOFT DRINKS.
-
Upload
corn-refiners-association -
Category
Food
-
view
241 -
download
0
Transcript of Simplifying Sweetness: The Difference Between Buzz and Behavior Around Carbonated Soft Drinks

SIMPLIFYING SWEETNESSTHE DIFFERENCE BETWEEN BUZZ AND BEHAVIOR
AROUND CARBONATED SOFT DRINKS.
THERE’S A LOT OF BUZZ AROUND SWEETENERS AND SODA ...
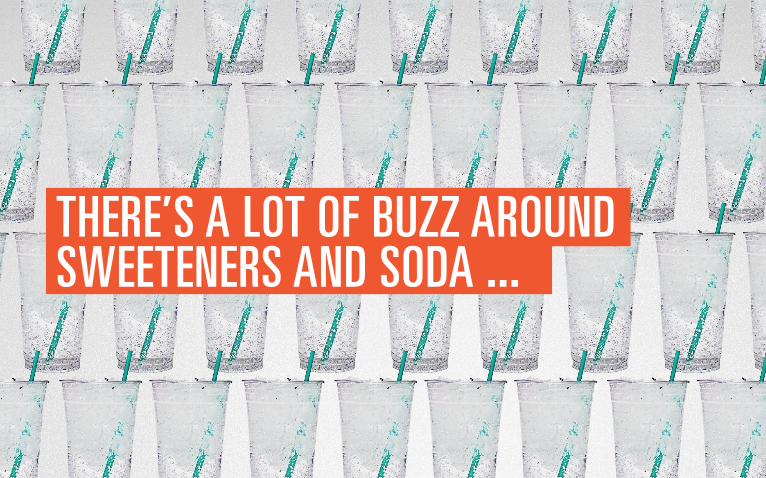
AND THE BUZZ MAY DRIVE SOME CONSUMERS TO
SAY THEY’RE AVOIDING SPECIFIC SWEETENERS
This data is derived from the 2015 Sweetener360, a custom research study commissioned by the Corn Refiners Association and completed in part by Nielsen and Mintel Consulting.
WHAT CONSUMERS SAY THEY AVOID
AIDED UNAIDED
WALTERNO HEALTH WORRIES
Sugars 24.1% 6.2%
HFCS 9.6% 0.5%
AIDED UNAIDED
SANDRATASTE OVER HEALTH
Sugars 22.8% 5.7%
HFCS 14.3% 0.3%
AIDED UNAIDED
JOANDIABETICS & DIETERS
Sugars 74.2% 39.9%
HFCS 65.6% 3.5%
AIDED UNAIDED
TERESATOO MANY PRIORITIES
Sugars 54.7% 29.9%
HFCS 27.6% 2.4%
AIDED UNAIDED
STACEYALL NATURAL
Sugars 72.8% 43.4%
HFCS 77.8% 9.2%
AIDED UNAIDED
JULIAHEALTHY BALANCE SEEKER
Sugars 47.2% 24.5%
HFCS 86.2% 17.3%

BUT DOES THE BUZZ TRANSLATE INTO BEHAVIOR?
LET’S TAKE A LOOK ...

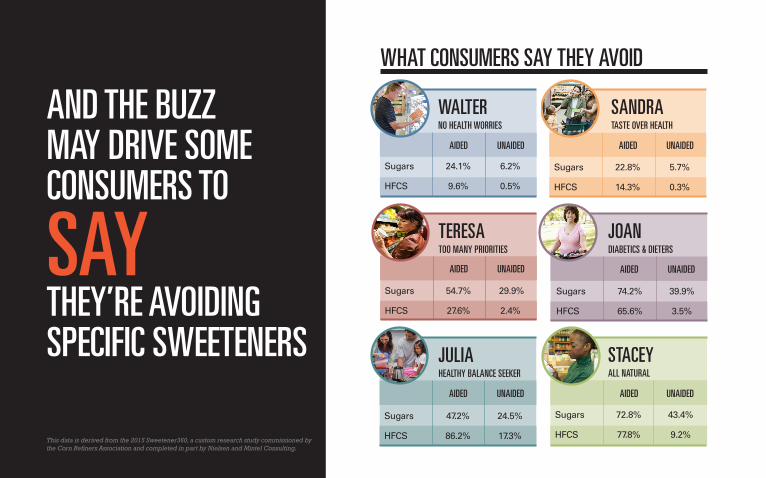
EACH CONSUMER SEGMENT IS A SIGNIFICANT BUYER OF SODA FORMULATED WITH ALL TYPES OF SWEETENERS.
CARBONATED SOFT DRINK SALES BY SWEETENER TYPE25%
20%
15%
10%
5%
0%
% of U.S. Spending
% of Carbonated Soft Drink Category Sales
% of “HFCS” Carbonated Soft Drink Sales
% of Carbonated Soft Drink Sales
% of “Low-/No-Sugar” Carbonated Soft Drink Sales WALTER TERESA SANDRA JOAN JULIA STACEY
16% U.S. HH
13% U.S. HH
9% U.S. HH
18% U.S. HH
19% U.S. HH
15% U.S. HH
CARBONATED SOFT DRINK SALES BY SWEETENER TYPE25%
20%
15%
10%
5%
0%
15% U.S. HH Stacey, the most health-conscious consumer segment, is more likely to buy soda
formulated with high fructose corn syrup (13%) than low-/no-calorie sweeteners.
WALTER TERESA SANDRA JOAN JULIA STACEY
16% U.S. HH
13% U.S. HH
9% U.S. HH
18% U.S. HH
19% U.S. HH
15% U.S. HH
% of U.S. Spending
% of Carbonated Soft Drink Category Sales
% of “HFCS” Carbonated Soft Drink Sales
% of Carbonated Soft Drink Sales
% of “Low-/No-Sugar” Carbonated Soft Drink Sales

CARBONATED SOFT DRINK SALES BY SWEETENER TYPE25%
20%
15%
10%
5%
0%
13% U.S. HH
9% U.S. HH Walter and Sandra are the two segments that buy more than their fair share of soda.
They also buy soda formulated with HFCS over any other sweetener.
WALTER TERESA SANDRA JOAN JULIA STACEY
16% U.S. HH
13% U.S. HH
9% U.S. HH
18% U.S. HH
19% U.S. HH
15% U.S. HH
% of U.S. Spending
% of Carbonated Soft Drink Category Sales
% of “HFCS” Carbonated Soft Drink Sales
% of Carbonated Soft Drink Sales
% of “Low-/No-Sugar” Carbonated Soft Drink Sales

CARBONATED SOFT DRINK SALES BY SWEETENER TYPE25%
20%
15%
10%
5%
0%
Teresa (15%), Sandra (18%) and Julia (15%) buy the most HFCS-sweetened soda.19% U.S. HH
16% U.S. HH
13% U.S. HH
WALTER TERESA SANDRA JOAN JULIA STACEY
16% U.S. HH
13% U.S. HH
9% U.S. HH
18% U.S. HH
19% U.S. HH
15% U.S. HH
% of U.S. Spending
% of Carbonated Soft Drink Category Sales
% of “HFCS” Carbonated Soft Drink Sales
% of Carbonated Soft Drink Sales
% of “Low-/No-Sugar” Carbonated Soft Drink Sales

CARBONATED SOFT DRINK SALES BY SWEETENER TYPE25%
20%
15%
10%
5%
0%
Combined, Julia and Stacey buy more than a quarter (28%) of all HFCS-sweetened soda.
15% U.S. HH
19% U.S. HH
WALTER TERESA SANDRA JOAN JULIA STACEY
16% U.S. HH
13% U.S. HH
9% U.S. HH
18% U.S. HH
19% U.S. HH
15% U.S. HH
% of U.S. Spending
% of Carbonated Soft Drink Category Sales
% of “HFCS” Carbonated Soft Drink Sales
% of Carbonated Soft Drink Sales
% of “Low-/No-Sugar” Carbonated Soft Drink Sales

WANT SEGMENTATION INSIGHTS ON YOUR BRAND? GET A CUSTOM RESEARCH PRESENTATION.
SIGN UP NOW >