Sources of Industrial Growth and Structural Change of Industrial Growth and Structural Change ......
196
SWP614 Sources of Industrial Growth and Structural Change The Case of Turkey Merih Celasun WORLD BANK STAFF WORKING PAPERS Numbgei 614-__ Public Disclosure Authorized Public Disclosure Authorized Public Disclosure Authorized Public Disclosure Authorized
-
Upload
phamkhuong -
Category
Documents
-
view
220 -
download
1
Transcript of Sources of Industrial Growth and Structural Change of Industrial Growth and Structural Change ......
SWP614
Sources of Industrial Growthand Structural Change
The Case of Turkey
Merih Celasun
WORLD BANK STAFF WORKING PAPERSNumbgei 614-__
Pub
lic D
iscl
osur
e A
utho
rized
Pub
lic D
iscl
osur
e A
utho
rized
Pub
lic D
iscl
osur
e A
utho
rized
Pub
lic D
iscl
osur
e A
utho
rized

w4/s-WORLD BANK STAFF WMRKING PAPERS 0<5 7
Number 614 7
Sources of- Industrial Growthand Structural Change
The Case of Turkey
Merih Celasun
INTERNAnONAL MONETARY FUNDJOINT LIBPARY
MAR 2 {l 1984
INTERNATIONAL BANK FOR1EMONSTRUCTION AND DEVLOPENT
WASHINGTOX, D.C. 20431
The World BankWashington, D.C., U.S.A.
Copyright © 1983The Intemational Bank for Reconstructionand Development / THE WWORLD BANK1818 H Street, N.W.Washington, D.C. 20433, U.S.A.
First printing September 1983All rights reservedManufactured in the United States of America
This is a working document published informally by the World Bank. Topresent the results of research with the least possible delay, the typescript hasnot been prepared in accordance with the procedures appropriate to formalprinted texts, and the World Bank accepts no responsibility for errors. Thepublication is supplied at a token charge to defray part of the cost ofmanufacture and distribution.
The views and interpretations in this document are those of the author(s) andshould not be attributed to the World Bank, to its affiliated organizations, or toany individual acting on their behalf. Any maps used have been preparedsolely for the convenience of the readers; the denominations used and theboundaries shown do not imply, on the part of the World Bank and its affiliates,any judgment on the legal status of any territory or any endorsement oracceptance of such boundaries.
The full range of World Bank publications is described in the Catalog of WorldBank Publications; the continuing research program of the Bank is outlined inWorld Bank Research Program: Abstracts of Current Studies. Both booklets areupdated annually; the most recent edition of each is available without chargefrom the Publications Distribution Unit of the Bank in Washington or from theEuropean Office of the Bank, 66, avenue d'Iena, 75116 Paris, France.
Merih Celasun is a professor at the Middle East Technical University inAnkara and a consultant to the Development Research Department of the WorldBank.
Library of Congress Cataloging in Publication Data
Celasun, Merih.Sources of Industrial growth and structural change.
(World Bank staff working paper ; no. 614)Bibliography: p.1. Turkey--Industries. 2. Turkey--Economic policy.
I. Title. II. Series.HC492.C44 1983 338.09561 83-16981ISBN 0-8213-0283-2
Abstract
This study provides an empirical analysis of the sources of Turkey'sgrowth and structural change since the 1950's, and considers the prospects forits transition from and inward-looking development strategy to trade-orientedgrowth in the 1980s. The paper discusses the major planning issues forimproved adjustment to current domestic and international economic problems,with special attention to the role of Turkey's public and private sectors inthe industrialization process. As part of a project on industrialization inselected semi-industrial countries, the study also compares Turkey'sexperience with those of other countries.
Acknowledgements
The author wishes to thank Hollis B. Chenery, Larry Westphal, BelaBalassa and Sherman Robinson for their encouragement and constant interest.The development of the present work in successive stages owes much to thegenerous data provided by Yusuf Hamurdan, Erdogan Ozotun and Cetin Akbay andcomments on the methodology given by Yuji Kubo, Moises Syrquin and KemalDervis are gratefully acknowledged. The author is indebted to KathleenJordan, Tevfik Yaprak nd Selcuk Caner for very competent computerprogramming. Ayse Tan and Kim Tran deserve special thanks for typingsuccessive drafts. The author is also grateful to Anne Vorce, who edited thefinal text for publication, and improved the presentation.

iii
Summary
This paper analyzes the sources of Turkey's growth and structural
change since the 1950s, with an emphasis on the limits of an inward-looking
development strategy for Turkey's industrialization and its adjustment to
current economic conditions. The analysis suggests that Turkey needs to alter
its trade orientation and the paper describes the major issues that must be
faced for a successful transition to a trade-oriented development strategy in
the 1980s.
For economic, historic, institutional and policy reasons, Turkey's
postwar growth strategy has generally been inward-looking. In comparison to
other semi-industrial countries of a similar size, Turkey has had a very low
share of trade in GDP until recently. As this study emphasizes, internal
factors and domestic demand have been the main sources of Turkish growth and
structural change. The limited role of trade in Turkey's industrialization
has been due primarily to the relatively large size of its domestic markets,
its natural resotlrce diversity, political conditions, and the structure of
incentives. Unlike other semi-industrial countries that had successfully
switched from an import substitution to an export-oriented strategy, Turkey
thus prolonged the inward-oriented phase of its manufacturing growth. As a
result, a highly protected industrial structure that relied heavily on the
import of intermediate goods became a costly feature of Turkish
industrialization. However, with the external economic shocks of the 1970s,
it became clear that Turkey's narrow trade focus could not be sustained.
These new developments in the world economic scene added to already serious
iv
adjustment problems resulting from increased import intensity and stagnant
export growth.
This paper also analyzes the sources of changes in factor uses and
relative prices and the implications of these results for policy planners.
Despite the growth of the manufacturing sector, Turkey's structural transition
has not been accompanied by sufficient increases in employment, and employment
problems will continue to be a major item on the policy agenda. Increased
trade-oriented growth, with a gradual decline in the levels of protection for
domestic market-oriented industries, will generate important shifts in
sectoral prices, real wages and profits.
Finally, for planners, the study indicates several problems that
could be remedied through policy measures. The lack of integrative mechanisms
and common rules of market behavior in Turkey's dualistic mixed economy system
has led to pervasive distortions in the structure of savings, costs and
prices. In addition, the reliance on non-price measures and selective
policies rather than general policy instruments to achieve economy-wide
objectives has created difficulties for the consistency and efficiency of
savings generation and resource allocation, and has led to recurrent balance
of payments problems. The concluding part of the paper reviews the major
directions of policy changes required for a more viable growth process in the
l980s.
v
TABLE OF CONTENTS
Page
INTRODUCTION ..................... 1
1. HISTORICAL BACKGROUND: 1923-80............... 4
A. Economic Development Before 19509... 0......-......... 4B. Economic Development in 195O-73..oo......... ........ 7C. Economic Development After 1973 ............... *.....o11
2. PATTERNS OF DEVELOPMENT, 1953-78: An Overview.....o....14
3. SOURCES OF INDUSTRIALIZATION, 1953-73 .................... 21
A. Scope of the Analysis. ........ 21B. Basic Data ........ 24C. Policy Characteristics and Trade
Orientation of the Subperiods .............. o...o.28D. Sources of Growth and Structural Change:
An Economy-Wide Analysis ............. . ... .31
E. Sources of Growth and Structural Changein Gross Output: An Analysis byMajor Sectors ............. 38
F. Sources of Growth Patterns inManufacturing Industries..oo..o..oo.. o ............ 48
G. Sources of Import Growth by Commodity.....#* ....... 52H. Decomposition of Value Added ....................... oo56I. Sources of Turkish Industrialization in
the Light of Experience Elsewhere:An Overview.oooo.~.oo.o* .. o.o.- 58
4. SOURCES OF CHANGES IN FACTOR USESAND RELATIVE PRICES .............. ...... ..... . .... . ... o 64
A. Historical Patterns of Employment andProductivity Growth.*....,...*** .. . . ... .. .o.64
B. Sources of Changes in Employment..o..o.....oo.e..o 70C. Sources of Changes in Investment
Requirementsoooo -oo.. .. s...0.. 76D. Sources of Changes in Relative
Sectoral Prices..ooo .. e .. 80E. Domestic Price Distortions, Labor Reallocation
and Value Added Growth Rates 87
vi
Page
5. STRUCTURAL CHANGE IN THE MANUFACTURING SECTOR ............... 96
A. Actual and Predicted Patterns inManufacturing Output....................................... 96
B. Patterns of Public and PrivateShares in Turkish Manufacturingo.......... ... ........ .101
6. TOWARD TRADE-ORIENTED GROWTH AND STRUCTURAL CHANGEIN THE 188...........................,1
A. Trade Effects on Turkish Industrialization.............,llB. Prospects for Transition....... . . ...... .. .. ..... .. . ... .,,117C. Future Research. .. . .. e e. .. . . .. . .. *.. . ,,125
REFERENCES 122
APPENDIX 1. MODELS FOR SOIURCES OF GROWTH DECOMPOSITION ....... ..... 132
A. Methodology in Brief. . . . . .. .. o .o oo.o . o.,,132Be Notationo ooooooooooesossooooooo..138C. Sources of Growth Decomposition of
Production (Gross Output)ooooo..o...ooo......o..... .139D. Sources of Growth Decomposition of
Value Added oosoooooooo..o.o.o .o..145E. Sources of Growth Decomposition
of Importso.ooo.o..ooooo..ooo..oo..oo.oo..o.oo... a,146
F. Sources of Growth Decompositionof Primary Factors. ... . oo.o. oo o..o oo .. o...,147
G. Sources of Changes in Relative SectorPriceso osooooooooooooooesooo...149
APPENDIX 2. DEFLATION OF THE TURKISH I-0 TABLES ..... ,.oo.........151
Ao Generalosoo oooosooooooosoooooo...151B. Deflation Procedure. . . . . .. ooo.o. oo oe. oo.o o151C. Construction of Trade Price Indiceso...ooo. 1.o... o.ol54
D. Construction of Price Indices forProduction and Supply..o... .. . . . o o. oo o..ooo.157
vii
LIST OF TABLESPage
Chapter 1
1.1 Major Economic Indicators, 1923-73... .................. .... 99.9..5
Chapter 2
2.1 Resource Accumulation and Allocational Processes, 1953-78 ...... 16
2.2 Demographic and Income Distributional Processes, 1953-78 ....... 17
Chapter 3
3.1 Value Added Estimates in the Deflated Input-Output (I-O) andNational Accounts (NY) Data Systems, 1963 and 1973 ............. 26
3.2 Variation in Aggregate Trade Ratios Over Time, 1953-78.........30
3.3 Growth in Sector Output, 1953-73...............................32
3.4 Trade by Major Sectors, 1953-73................................33
3.5 Sources of Growth and Structural Change in Gross Output,1953-73: A Summary of Aggregate Results (Alternate Measures)...35
3.6 Sources of Growth in Value Added, 1963-73: A Summary ofAggregate Results (Total Measures) ............................ 39
3.7 Sources of Gross Output Growth in Major Sectors, 1953-73:Share Method, First Difference * o ** * o ..............................o..............40
3.8 Sources of Gross Output Deviations from BalancedGrowth, 1953-73: Major Sectors............ ....................... 45
3.9 Sources of Gross Output Growth in Manufacturing, 1953-73:Share Total Method, First Difference...........................50
3.10 Sources of Import Growth by Commodity, 1953-73: A Summaryof Aggregate Results (Share Method, First Difference) ...... 53
3.11 Sources of Import Growth by Commodity, 1953-73: Disag-gregated Results (Share Total Method, First Difference)........ 54
3.12 Sources of Value Added Growth in Major Sectors, 1963-73:Share Total Method..........................
3.13 A Summary of Measures for Sources of Growth in Manufacturing,1953-73: Share Total Method, First Difference................. 60
3.14 Sources of Manufacturing Gross Output Deviation fromBalanced Growth: An Inter-Country Comparison (Based onShare Total Method, Deviation). e .9.61
viii
Page
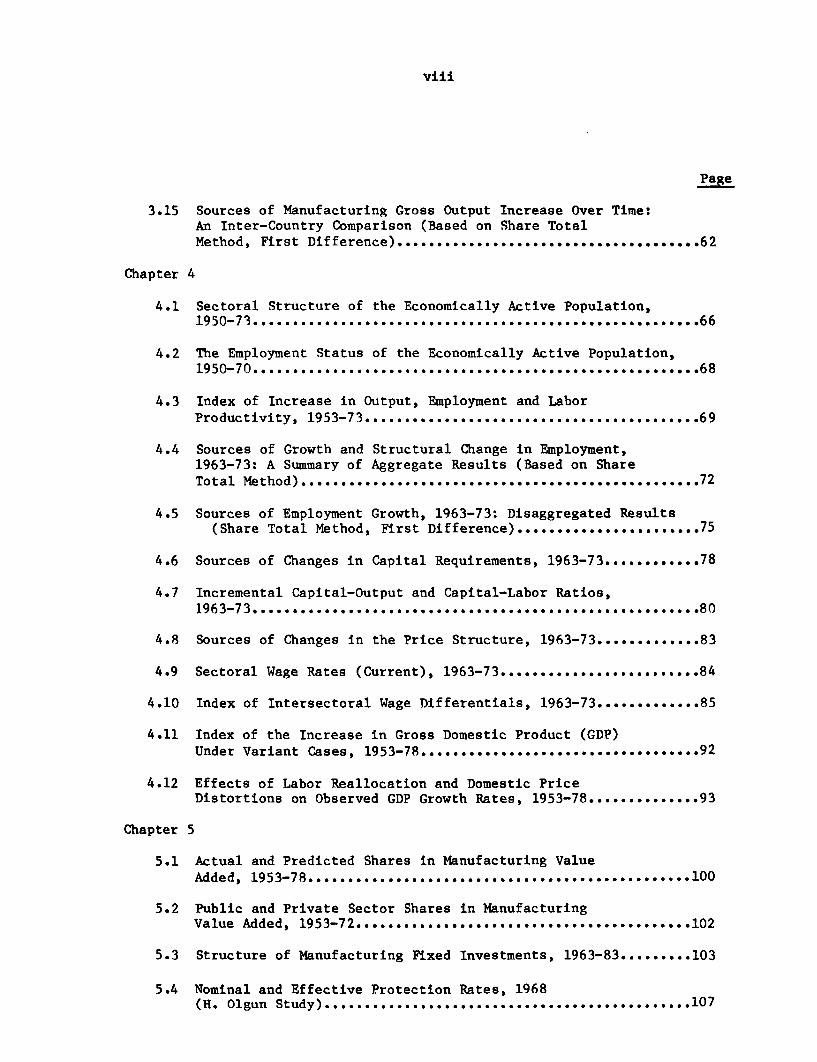
3.15 Sources of Manufacturing Gross Output Increase Over Time:An Inter-Country Comparison (Based on Share TotalMethod, First Difference). .... ... . .. . . ... . . . . . . . . . . .* . ** * ** * 62
Chapter 4
4.1 Sectoral Structure of the Economically Active Population,1950-71o ... o...so... o e....so... o......................... 6
4.2 The Employment Status of the Economically Active Population,1950-70o ... o..*.... o....so... *e.o... oooo........................68
4.3 Index of Increase in Output, Employment and LaborProductivity, 1953-73 .... .................. ...... .69
4.4 Sources of Growth and Structural Change in Employment,1963-73: A Summary of Aggregate Results (Based on ShareTotal Method) ............
4.5 Sources of Employment Growth, 1963-73: Disaggregated Results(Share Total Method, First Difference)........................75
4.6 Sources of Changes in Capital Requirements, 1963-73............78
4.7 Incremental Capital-Output and Capital-Labor Ratios,
4.8 Sources of Changes in the Price Structure, 1963-73.. .ooos.o.83
4.9 Sectoral Wage Rates (Current), 1963-73...84
4.10 Index of Intersectoral Wage Differentials, 1963-73. ..... o. .85
4.11 Index of the Increase in Gross Domestic Product (GDP)Under Variant Cases, 1953-78 . 92
4.12 Effects of Labor Reallocation and Domestic PriceDistortions on Observed GDP Growth Rates, 1953-78 ...... ooo...93
Chapter 5
5.1 Actual and Predicted Shares in Manufacturing ValueAdded, 1953-78 .......
5.2 Public and Private Sector Shares in ManufacturingValue Added, 1953-72.........e................... . ..... 102
5.3 Structure of Manufacturing Fixed Investments, 1963-83 .... ... 103
5.4 Nominal and Effective Protection Rates, 1968(R. Olgun Study) ........................ 107
ix
Page
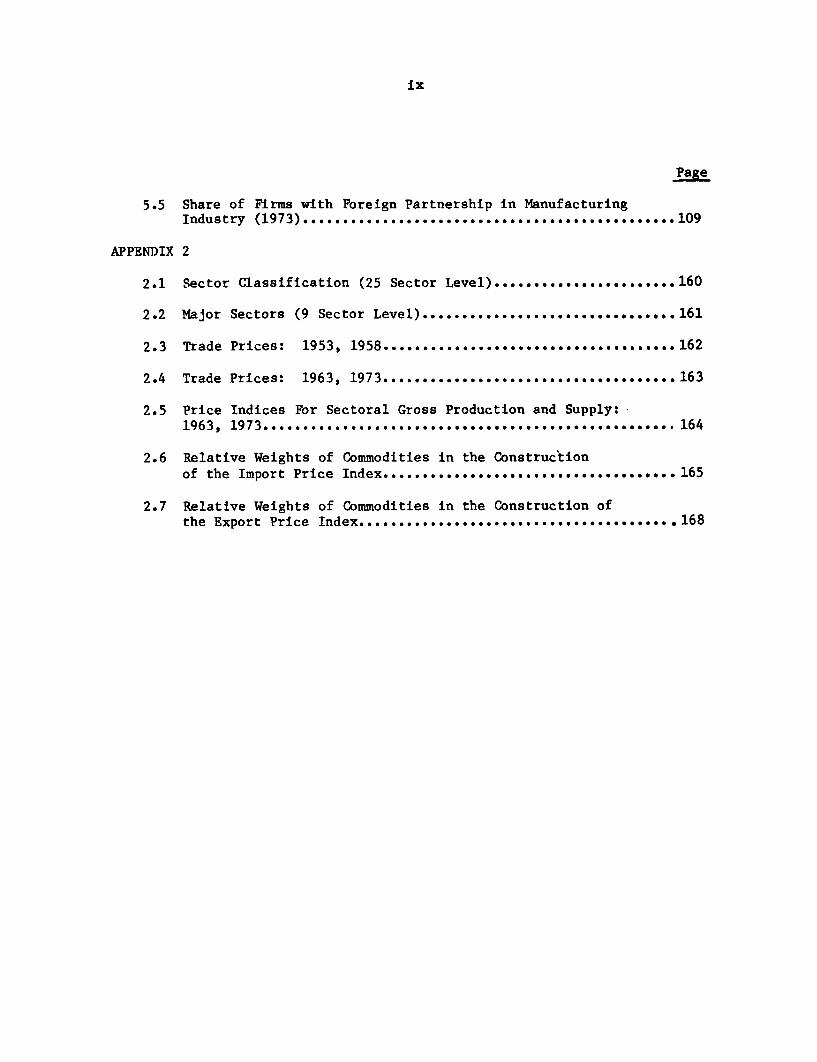
5.5 Share of Firms with Foreign Partnership in ManufacturingIndustry (1973)...............................................109
APPENDIX 2
2.1 Sector Classification (25 Sector Level)........................160
2.2 Major Sectors (9 Sector Level) ................................161
2.3 Trade Prices: 1953, 1958....* ...................... ..... 162
2.4 Trade Prices: 1963, 1973 ....... *so . .oo. 163
2.5 Price Indices For Sectoral Gross Production and Supply:1963, 1973oo. ... .o.o..oo... o ... oo................................... 164
2.6 Relative Weights of Commodities in the Constructionof the Import Price Index ... ................................. 165
2.7 Relative Weights of Commodities in the Construction ofthe Export Price Index. .o....................................... .168

SOURCES OF INDUSTRIAL GROWTHAND STRUCTURAL CHANGE:
The Case of Turkey
Merih Celasun
INTRODUCTION
Turkey's delayed adjustment to the external economic shocks of the
mid-1970s has resulted in costly growth losses, hyperinflation and political
instability. At the heart of the adjustment difficulties were certain
structural trends that minimized the role of trade in the development
process. Institutional features and policy also played important roles. This
study examines the various factors that have shaped Turkey's economy since
1950, with an emphasis on the implications of an inward-looking trade
strategy. A major objective of the historical analysis is to delineate the
scope of the major planning issues involved in the transition toward trade-
oriented growth in the 1980s.
This paper is part of a comparative study of industrialization in
selected semi-industrial countries 1/ The broad objectives of these
coordinated research efforts are to determine the common features of
industrialization, and to explain country differences in terms of specific
policies and resource endowments. Technical economic analysis is an important
part of the project. Varied input-output methods, which are used to analyze
the changing combinations of factors in growth under different conditions,
have been applied to each country.
The analysis of Turkey primarily concerns the estimation of the
1/ Chenery (1979, Chapter 3) presents an overview of the typical patterns andsources of industrialization at various stages of the development process.Kubo and Robinson (1979) give the initial results of the comparativeanalysis of the sources of industrial growth in eight countries (includingTurkey). The seven others are Japan, Norway, Korea, Taiwan, Mexico,Colombia and Israel.
- 2 -
sources of growth and structural change in production and imports in 1953-73
(Chapter 3). The sources of change in value added, factor use and relative
product prices from 1963-73 have also been studied because more detailed
information is available for that period (Chapter 4). The overall structural
assessment has been extended to 1978 based on the average country patterns
estimated by Chenery and Syrquin (1975) and Chenery and Taylor (1968).
Accordingly, Chapter 5 examines the transformation of the manufacturing sector
in more detail and discusses the roles of the public and private sectors in
the growth of individual manufacturing industries.
Development policy has played a significant role in Turkish growth
and structural change. During 1953-73, the style and framework of development
policy changed. The first decade was an era of uncoordinated development,
which was characterized by frequent shifts in the government's ad hoc economic
policies. In contrast, from 1963-73 formal economy-wide planning techniques
and institutions were adopted and a stronger emphasis on non-inflationary
growth and industrialization was apparent. The trade and balance of payments
regime had essentially a semi-closed character during 1953-70, but became more
open in the early 1970s. The relatively larger role of export expansion as a
source of growth from 1968-73 reflected both the effects of switching to a
semi-open trade regime and the impact of the world commodity boom in 1971-
73. The final section (Chapter 6) provides a brief review of the basic
institutional and policy factors that have been instrumental in Turkey's
inward-looking industrialization strategy. It also discusses Turkey's recent
(1980-81) policy changes and the prospects for a trade-oriented transition in
the 1980s. Suggestions for future planning and research are offered as well.
Extensive empirical work on the construction of price indices for
production, imports and exports that have shown considerable intersectoral and
intrasectoral variation has been an integral part of the project. The data
base largely consists of sectoral output and trade data for 1953 and 1958 and
official input output tables for 1963, 1968 and 1973. The sector information
has been adjusted for consistency and reclassified at the 25 sector level 1/
A useful by-product of this study is a set of deflated input-output tables,
which closely conform to the official national accounts published by Turkey's
State Institute of Statistics (SIS). The analytical methods of the sources of
growth analysis are reviewed in Appendix 1. The deflation procedures used,
sectoral price indices constructed and sector classification adopted in data
processing are presented in Appendix 2.
1/ For brevity in presentation, the computer printouts (for decompositionmeasures) at the 25 sector level of aggregation are summarized in the textin tables prepared at the 9 sector level of aggregation.
- 4 -
1. HISTORICAL BACKGROUND: 1923-1980
Although the sources of growth analysis covers 1953-73, further
historical background on Turkey's economic growth is needed to indicate trends
over a longer perspective. Chapter 1 presents a survey of the major phases of
development marked by important institutional and/or policy changes since the
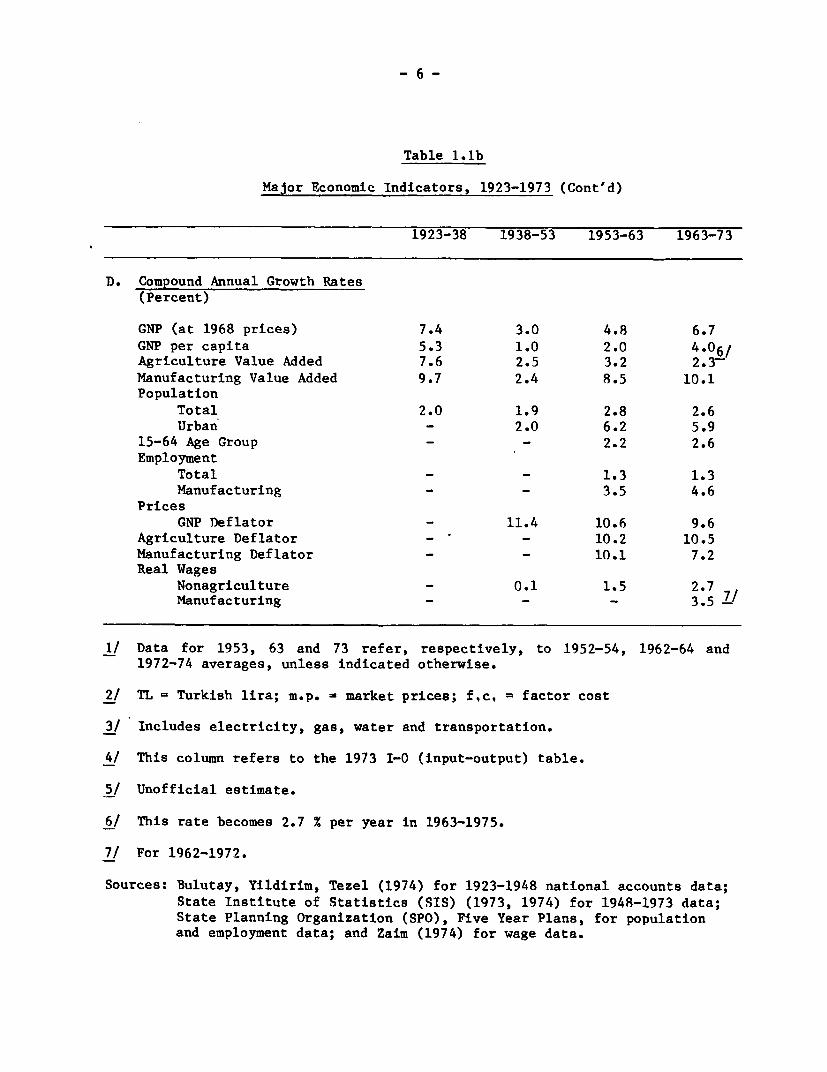
early days of the Republic. The major economic indicators assembled in Tables
l.la and 1.lb describe the historical evolution of the economy according to
its principal structural features from 1923-73. 1/
A. Economic Development Before 1950
The Turkish Republic was established in 1923 upon the end of the War
of Independence that erupted after the Ottoman Empire was dissolved. As shown
in Table 1.lb, economic growth was very rapid between 1923 and 1938 before it
was interrupted by World War II. (The annual increase of per capita GNP was
5.3 percent.) The first fifteen years of the new republican period was
characterized by profound social reforms. However, these reforms were
accompanied by only moderate changes in economic organization and productive
structure.
1/ Some of the structural characteristics are recalculated in Chapter 2 forconsistent comparisons with the cross-country norms, which are expressedin terms of percentage shares in GDP at factor cost.
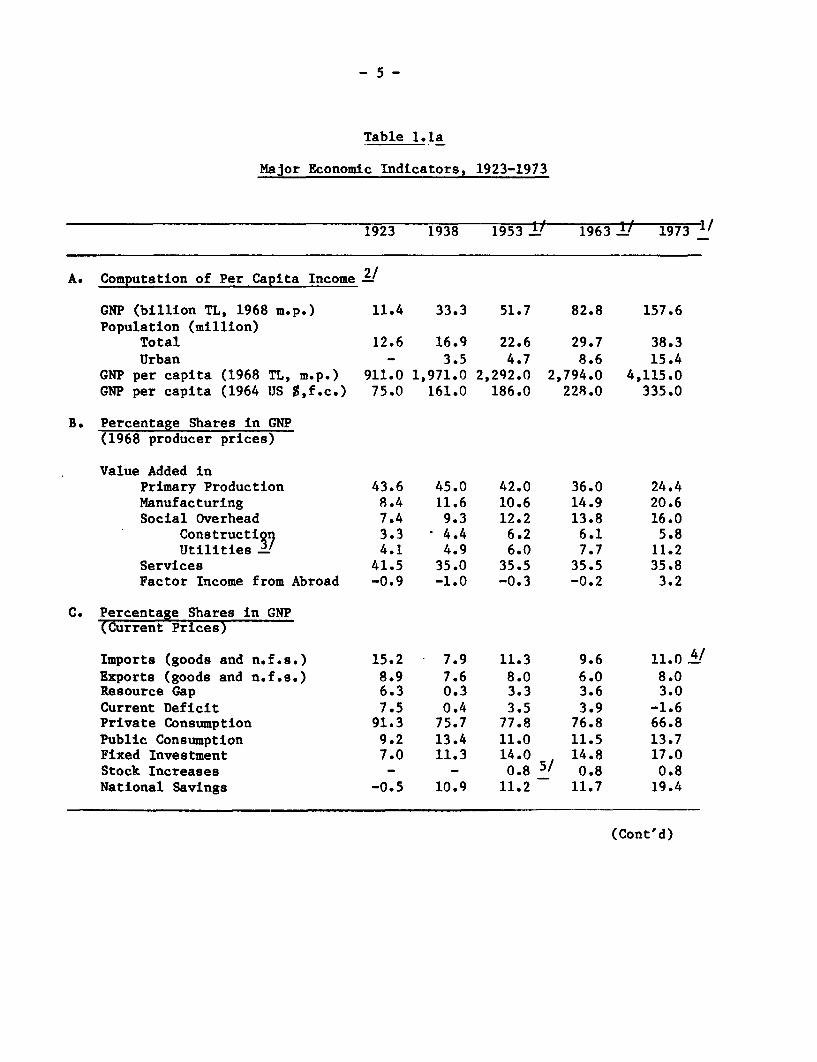
Table 1.la
Major Economic Indicators, 1923-1973
1923 1938 1953 1963±/ 1973
A. Computation of Per Capita Income 2/
GNP (billion TL, 1968 m.p.) 11.4 33.3 51.7 82.8 157.6Population (million)
Total 12.6 16.9 22.6 29.7 38.3Urban - 3.5 4.7 8.6 15.4
GNP per capita (1968 TL, m.p.) 911.0 1,971.0 2,292.0 2,794.0 4,115.0GNP per capita (1964 US $,f.c.) 75.0 161.0 186.0 228.0 335.0
B. Percentage Shares in GNP(1968 producer prices)
Value Added inPrimary Production 43.6 45.0 42.0 36.0 24.4Manufacturing 8.4 11.6 10.6 14.9 20.6Social Overhead 7.4 9.3 12.2 13.8 16.0
Constructi2l) 3.3 4.4 6.2 6.1 5.8Utilities __ 4.1 4.9 6.0 7.7 11.2
Services 41.5 35.0 35.5 35.5 35.8Factor Income from Abroad -0.9 -1.0 -0.3 -0.2 3.2
C. Percentage Shares in GNP(Current Prices)
Imports (goods and n.f.s.) 15.2 7.9 11.3 9.6 11.0 4/Exports (goods and n.f.s.) 8.9 7.6 8.0 6.0 8.0Resource Gap 6.3 0.3 3.3 3.6 3.0Current Deficit 7.5 0.4 3.5 3.9 -1.6Private Consumption 91.3 75.7 77.8 76.8 66.8Public Consumption 9.2 13.4 11.0 11.5 13.7Fixed Investment 7.0 11.3 14.0 14.8 17.0Stock Increases - - 0.8 5/ 0.8 0.8National Savings -0.5 10.9 11.2 11.7 19.4
(Cont'd)
-6-
Table 1.lb
Major Economic Indicators, 1923-1973 (Cont'd)
1923-38 1938-53 1953-63 1963-73
D. Compound Annual Growth Rates(Percent)
GNP (at 1968 prices) 7.4 3.0 4.8 6.7
GNP per capita 5.3 1.0 2.0 4.06/Agriculture Value Added 7.6 2.5 3.2 2.3-Manufacturing Value Added 9.7 2.4 8.5 10.1Population
Total 2.0 1.9 2.8 2.6Urban - 2.0 6.2 5.9
15-64 Age Group - - 2.2 2.6Employment
Total - 1.3 1.3Manufacturing - - 3.5 4.6
PricesGNP Deflator - 11.4 10.6 9.6
Agriculture Deflator - - 10.2 10.5Manufacturing Deflator - - 10.1 7.2Real Wages
Nonagriculture - 0.1 1.5 2.7Manufacturing - - - 3.5 -
1/ Data for 1953, 63 and 73 refer, respectively, to 1952-54, 1962-64 and1972-74 averages, unless indicated otherwise.
2/ TL = Turkish lira; m.p. - market prices; f,c, - factor cost
3/ Includes electricity, gas, water and transportation.
4/ This column refers to the 1973 I-0 (input-output) table.
5/ Unofficial estimate.
6/ This rate becomes 2.7 % per year in 1963-1975.
7/ For 1962-1972.
Sources: Bulutay, Yildirim, Tezel (1974) for 1923-1948 national accounts data;State Institute of Statistics (SIS) (1973, 1974) for 1948-1973 data;State Planning Organization (SPO), Five Year Plans, for populationand employment data; and Zaim (1974) for wage data.
A major shift in economic policy took place in the early 1930s
partly in response to the Depression. A renewed emphasis was placed on the
creation and expansion of government-owned enterprises in industrial
sectors. Because of the vigorous initiatives of public enterprises in
commodity-producing sectors, the share of the non-service sectors in GDP
increased from 60 percent in the mid-1920s to 67 percent in 1938. 1/ However,
growth and price stability were interrupted by World War II. As a result,
average annual GNP growth fell to -2.9 and 1.2 percent in 1938-43 and 1938-48,
respectively. Following a major exchange rate adjustment in 1946, government
policies gradually shifted back toward a free enterprise orientation.2/ A
more decisive shift in that direction occurred after the political changes
resulting from the 1950 election.3 / Because of shifting political attitudes
and priorities, a draft five-year plan was not formally adopted in 1947-52.4/
B. Economic Development in 1950-1973
Aided by a steep rise in agricultural output (due to favorable
weather conditions and extension of farmland) and primary exports, the economy
expanded rapidly at an average annual rate of 7.9 percent from 1948-53.
However, after the crop failure of 1954, Turkey entered a phase of severe
balance of payments problems and stagnant growth. As a result of continual
difficulties in increasing agricultural output, controlling domestic inflation
1/ For a full discussion of national accounts data for this period seeBulutay et al (1974). Non-service sectors include "A" and "M+" sectorsaccording to Kuznets' classifications (1969).
2/ The exchange rate was adjusted in August 1946 from 1.28 TL to 2.80 TL perUS dollar.
3/ The Democratic Party, winner of the 1950 election over the RepublicanParty, which governed the country in 1923-50, remained in power until themilitary intervention of May, 1960.
4/ See Tekeli and Ilkin (1974) for a discussion of the 1947 Vaner Plan.
- 8 -
and revitalizing the trade sector, annual growth averaged around 4.0 percent
during 1953-58. This led to the introduction of a devaluation and stabili-
zation policy package in August 1958.1/
From 1958-63, major factors accompanying Turkey's average growth of
5.0 percent annually were a military intervention (1960); the gradual
transition to price stability; the design of a more systematic incentive
structure; and the institutionalization of formal development planning. The
economic difficulties faced in the late 1950s were further aggravated by rapid
population growth (2.8 percent a year) and an upsurge in rural-urban migration
at nearly 6.5 percent a year (see Table l.lb). 2/
There were important differences in the instruments and style of
development policy between the two consecutive ten-year periods from 1953-
73. The 1963-73 period was characterized by the implementation of two five-
year plans, whereas the earlier period was a time of ad hoc shifts in the
government's policies, as well as frequent fluctuations in output and trade
conditions. Turkey's development planning in the 1960s, which emphasized
economy-wide as well as balanced growth, was part of the country's response to
the imbalances experienced and limited resource mobilization achieved in the
1950s.
Turkey's economic performance improved in the second ten-year
period. Despite sluggish growth in agricultural production, annual GNP growth
for 1963-73 averaged around 6.7 percent, as compared with 4.8 percent in
1/ The exchange rate was adjusted de facto from 2.8 to 9.0 TL per US dollarfor numerous transactions.
2/ For a review of the policy experience of 1953-63, see Okyar (1979).
- 9 -
1953-63S The average share of fixed investment in GNP (at market prices)
increased from about 14.0 percent in 1953-62 to 16.1 percent in 1963-72.
During the First and Second Plans (1963-67 and 1968-72), emphasis was placed
on improving domestic savings performance. This led to marginal savings
ratios of 32 and 26 percent, respectively. In turn, the observed ratios of
current account deficit to GNP (at market prices) were quite low, and they
averaged around 1.8 and 0.6 percent, respectively, under the two consecutive
five-year plans. Public savings were about 45-50 percent of total domestic
savings. The proportionally larger share of public fixed investment in the
total (around 52-53 percent) reflected the significant role assigned to the
public sector in major development programs.2/
However, the adoption of formal planning did not significantly
change the restrictive trade policies which discriminated against exports, and
relied heavily on import rationing measures.!/ To the contrary, annual import
programs featuring quantitative restrictions became an important policy device
under the successive five-year plans. The structure of protection resulting
from the trade regime allowed high-cost and import-dependent private
manufacturing plants to be established and maintained.
Turkeyos decision to join the European Economic Community (EEC) was
an important policy development in 1963-73. In September 1963, Turkey and the
EEC signed the Association Agreement, which stipulated that two stages
(preparatory and transitional) would occur before full membership. The
1/ The observed value added growth rates in 1953-73 are somewhat overstatedby domestic price distortions, as shown in Chapter 4.
2/ See Celasun (1980 a).
3/ A path-breaking research effort by Krueger (1974) provides a comprehensiveanalysis of the trade and payments policies of Turkey during the 1950-71period with a clear focus on trade-growth relationships.
- 10 -
preparatory stage was completed by the end of the 1960s, and the Additional
Protocol was signed in November 1970. The latter protocol, which became
effective in January 1973, specified the ground rules for the transitional
stage of establishing a customs union with the EEC before the full membership
stage.
At the beginning of the transitional stage, the EEC removed tariff
barriers for Turkish manufactured exports, except for certain products, such
as cotton yarns and numerous processed food items in which Turkey has a
considerable comparative advantage. For agricultural exports, the EEC
provided selective trade facilities, which were eroded shortly thereafter by
the EEC's subsequent agreements with other countries.l/ In turn, Turkey
agreed to remove gradually tariff and non-tariff barriers for EEC manufactured
imports according to two timetables (over 12 and 22 year periods, as
differentiated by products), and eventually to realign her tariff structure
with the EEC's external tariff structure. Until foreign exchange restrictions
appeared in 1978, tariff reductions were carried out as scheduled in the
Additional Protocol. Free movement for Turkish workers, one of the next
hurdles, is likely to be limited due to growing unemployment in the EEC.
The cyclical position of the economy in the early 1970s affects the
analysis because 1973 marks the end of the period studied. GNP growth in
1971-73 received a substantial boost from a huge increase in workers'
1/ FPI (1978) presents the proceedings of a symposium on Turkey-EECrelations, including discussion on the effects of the new EEC policiestowards other countries. See Hic (1972) for an informative review of theTurkey-EEC relations in the earlier stages.
- 11 -
remittances following the devaluation of August 1970.1/ The remittances, in
turn, reflected the rapid expansion of the Western European economies in 1970-
73. Net factor income from abroad reached an all-time high, 4.6 percent of
GNP, in 1973. This sharp rise in the export of factor services was also
accompanied by a significant increase in agriculture-based exports, largely as
the result of expanding world demand and favorable shifts in relative
prices. The improved foreign exchange position of the country also led to the
rapid growth of imports of basic intermediate goods, investment goods and
parts for consumer durables.
C. Economic Development After 1973
Despite the oil crisis and related external shocks, Turkey attempted
to preserve its growth momentum under the Third Plan (1973-77) through rapid
reserve decumulation and massive external borrowing. Instead of relying upon
internal adjustment to promote balance of payments improvement, the various
coalition governments pursued expansionary policies, while allowing a decline
in marginal savings ratios, and negative import substitution in the energy and
manufacturing sectors.!/ The average rate of GNP growth was about 6.5 percent
a year (despite a 4 percent growth in 1977), and the investment/GNP ratio
increased from 18 percent in 1973 to 23.5 percent in 1977. The marginal
1/ In August 1970, the exchange rate was adjusted from 9 TL to 15 TL per U.S.dollar for a wide range of transactions, excluding certain agriculturalexports.
2/ In Balassa (1979 and 1981), Turkey's adjustment policies (after 1973) arereviewed in the light of the experience of other industrializing eco-nomics. Celasun (1980 a) provides an appraisal of the real and monetaryaspects, while Dervis and Robinson (1978) analyze the erosion of the realforeign exchange rate in the 1973-77 period. In World Bank (1980), thesalient features of the 1978 and 1979 Stabilization Programs are dis-cussed.
- 12 -
savings ratio for the five-year period averaged around 12 percent, while the
current account deficit as a proportion of GNP rose sharply and reached
unsustainable proportions in 1976 and 1977 (around 5.7 and 8.0 percent,
respectively). The heavy borrowing soon led to a high external debt ($14
billion by the end of 1978, including $7.5 billion in short-term debt).
In addition to the adverse impact of the sharp rise in imported oil
prices, the implementation of the Third Plan involved major difficulties in
coping with the increasing import intensity of intermediate inputs in the
production structure. By the early 1970s, the Turkish economy had developed
to the intermediate stage of import substitution, which had the following
characteristics: (1) the exhaustion of easy import substitution possibilities
in the early industries; (2) the pronounced shifts in the structure of
intermediate inputs towards more technology-intensive and capital-intensive
materials; and (3) the need for increased selectivity in the choice of trade-
improving investment programs. 1/ Despite the large increase in levels of
fixed investment, net import substitution was negative and hurt the balance of
payments in 1973-77. Turkey's export market shares also decreased noticeably
in this period 2/
Because it could not sustain heavy external borrowing as the main
adjustment mechanism, the Turkish economy finally faced a severe crisis in
1978-80. The juncture of structural, cyclical and political difficulties of
unprecedented proportions worsened matters. The measures contained in two
stabilization programs in 1978 and 1979 proved to be inadequate in reducing
1/ For a more detailed analysis, see Chapters 3 and 5.
2/ See Balassa (1981, Tables LA and 1B).
- 13 -
distortions of resource allocation and curbing domestic inflation.1/ Annual
growth declined from 4.0 percent in 1977 to 0.4 percent in 1979, while
inflation rose from 49 percent in 1978 to 81 percent in 1979.2/
The government introduced a bold and comprehensive policy package in
January 1980 to correct the rapidly worsening economic situation, and to
redirect growth toward exports with a greater reliance on market forces. The
package included substantial increases in the prices of public enterprises;
elimination of price controls for a wide range of industrial products; a major
currency devaluation; improved incentives for exports; better conditions for
foreign private capital; and a flexible policy for further exchange rate
adjustments. The monetary side of the package was strengthened in July 1980
when most of the interest rates in the banking system were freed. Turkey's
military government, which assumed power in September 1980, supported the new
policy framework, and moved to consolidate its components under more stable
institutional arrangements. Following the massive cost-push and deflationary
impacts of these measures during 1980, the Turkish economy showed an
improvement in 1981, with particularly encouraging results in export
expansion, public finance and control over monetary expansion.
1/ See World Bank (1980, Chapter 1), and Chapter 6.
2/ As measured by the Wholesale Price Index.
- 14 -
2. PATTERNS OF DEVELOPMENT, 1953-78:
An Overview
This study of Turkish development is based on previous work
concerning patterns of development. The stages of structural transformation
generally experienced by a developing country have been investigated by
Chenery and Taylor (1968) and Chenery and Syrquin (1975). These
investigations attempt to determine average or normal patterns of development
for all countries, as opposed to factors in development for a specific
country. They provide a quantitative basis to examine how Turkish development
conforms to or diverges from the norms predicted for a country of its size (as
measured by population), income level and, in some comparisons, net resource
inflow.
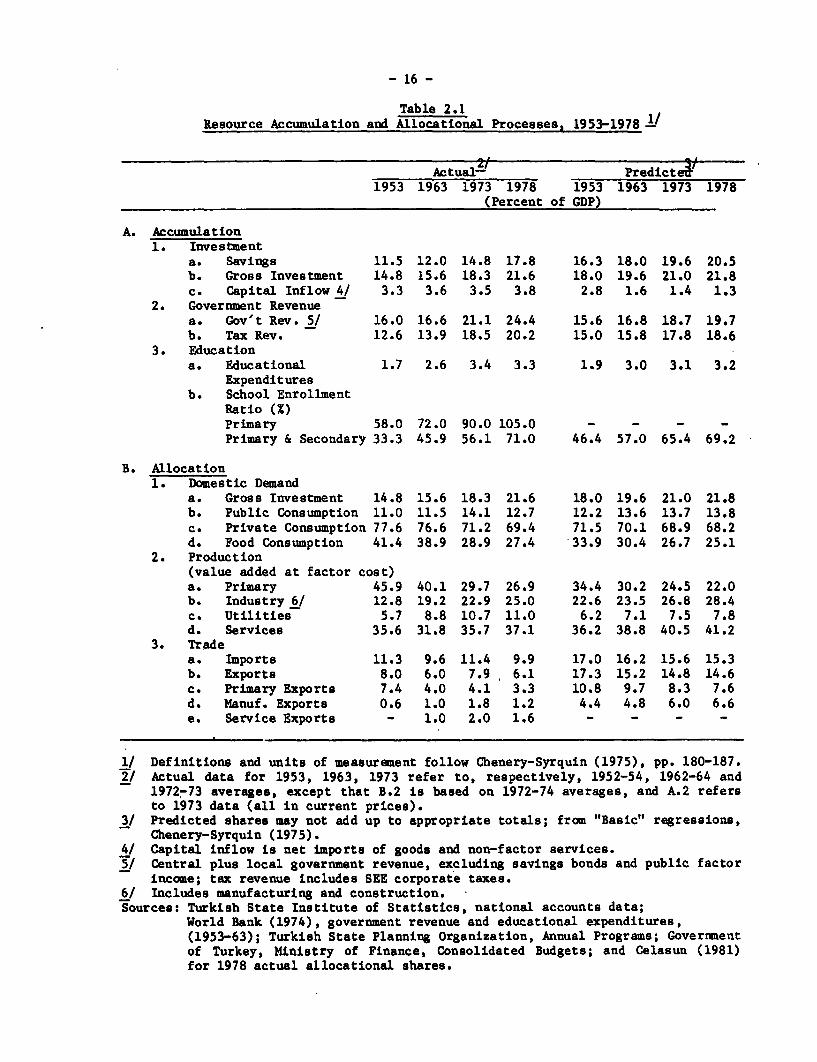
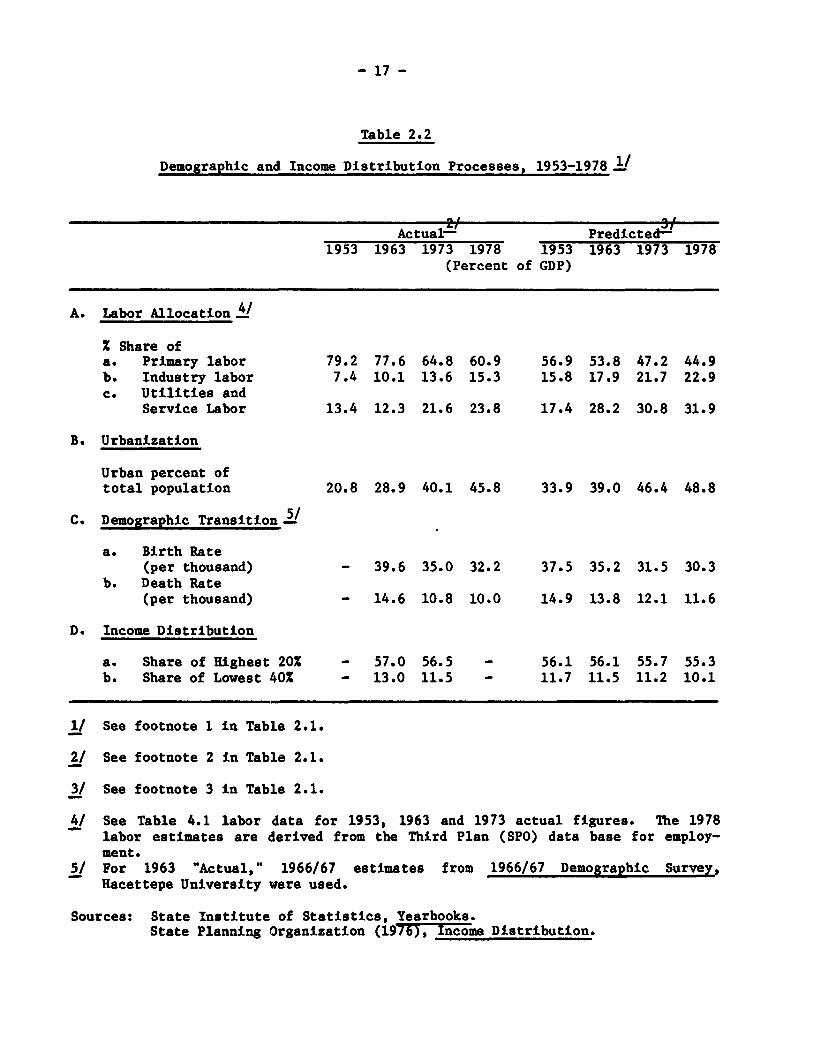
Chenery and Syrquin suggested that there are ten development
processes in structural transformation. Six stages are related to resource
accumulation and allocation, and four to demographic and income distributional
aspects. For this study, their actual and predicted values have been
determined for the benchmark years 1953, 1963, 1973 and 1978. The results are
summarized in Tables 2.1 and 2.2 A/ Cyclical influences have not been
eliminated in 1978, during which severe shortages of intermediate goods
imports and disruptions in industrial production occurred. In the
determination of the predicted values from the basic regressions of Chenery-
1/ The author is thankful to Selcuk Caner and Tevfik Yaprak for their ablehelp in the computation of the cross-country norms in Chapters 2 and 5.An earlier version of the results of this analysis is discussed briefly inCelasun (1978).
- 15 -
Syrquin, the following data have been used for the explanatory variables "per
capita income" and 'population":"/
1953 1963 1973 1978
Per capita GNP (factor cost) 186 228 335 403(1964 U.S.$)
Population (millions) 22.6 29.7 38.3 43.2
Source: SIS national income series and population data.
According to the cross-country regressions, Turkey's overall
development transition should have been half-completed by 1973, when per
capita income was above $300. This is based on the findings that some
development processes occur in earlier stages of overall transition, while
others are delayed until later stages, with the stages measured by per capita
income ranging from $100 (least developed) to $1000 (most developed), in 1964
prices. 2/ For example, on the average, the transition is half-completed at
about $300 for all ten processes, whereas the midpoint for investment,
savings, school enrollment ratio, food consumption, primary production, total
exports and imports and urbanization is around $200, and at much higher levels
for others.
1/ In order to reduce the upward bias caused by overvalued exchange rates,per capita income levels for the benchmark years are estimated bydeflating national income series to constant 1964 prices, and using thenominal 1964 exchange rate of 9.00 TL per US dollar for conversions. Thelatter rate was a relatively realistic value at the time. The populationfigures used in the calculations exclude workers employed abroad.
2/ See Chenery and Syrquin (1975, Figures 1 to 6).
- 16 -
Table 2.1Resource Accumulation and Allocational Processes, 1953-1978 1,
Actual- Predicte;1953 1963 1973 1978 1953 1963 1973 1978
(Percent of GDP)
A. Accumulation1. Investment
a. Savings 11.5 12.0 14.8 17.8 16.3 18.0 19.6 20.5b. Gross Investment 14.8 15.6 18.3 21.6 18.0 19.6 21.0 21.8c. Capital Inflow 4/ 3.3 3.6 3.5 3.8 2.8 1.6 1.4 1.3
2. Government Revenuea. Gov't Rev. 5/ 16.0 16.6 21.1 24.4 15.6 16.8 18.7 19.7b. Tax Rev. 12.6 13.9 18.5 20.2 15.0 15.8 17.8 18.6
3. Educationa. Educational 1.7 2.6 3.4 3.3 1.9 3.0 3.1 3.2
Expendituresb. School Enrollment
Ratio (%)Primary 58.0 72.0 90.0 105.0 - - - -Primary & Secondary 33.3 45.9 56.1 71.0 46.4 57.0 65.4 69.2
B. Allocation1. Domestic Demand
a. Gross Investment 14.8 15.6 18.3 21.6 18.0 19.6 21.0 21.8b. Public Consumption 11.0 11.5 14.1 12.7 12.2 13.6 13.7 13.8c. Private Consumption 77.6 76.6 71.2 69.4 71.5 70.1 68.9 68.2d. Food Consumption 41.4 38.9 28.9 27.4 33.9 30.4 26.7 25.1
2. Production(value added at factor cost)a. Primary 45.9 40.1 29.7 26.9 34.4 30.2 24.5 22.0b. Industry 6/ 12.8 19.2 22.9 25.0 22.6 23.5 26.8 28.4c. Utilities 5.7 8.8 10.7 11.0 6.2 7.1 7.5 7.8d. Services 35.6 31.8 35.7 37.1 36.2 38.8 40.5 41.2
3. Tradea. Imports 11.3 9.6 11.4 9.9 17.0 16.2 15.6 15.3b. Exports 8.0 6.0 7.9 6.1 17.3 15.2 14.8 14.6c. Primary Exports 7.4 4.0 4.1 3.3 10.8 9.7 8.3 7.6d. Manuf. Exports 0.6 1.0 1.8 1.2 4.4 4.8 6.0 6.6e. Service Exports - 1.0 2.0 1.6 - - - -
1/ Definitions and units of measurement follow Chenery-Syrquin (1975), pp. 180-187.2/ Actual data for 1953, 1963, 1973 refer to, respectively, 1952-54, 1962-64 and
1972-73 averages, except that B.2 is based on 1972-74 averages, and A.2 refersto 1973 data (all in current prices).
3/ Predicted shares may not add up to appropriate totals; from "Basic" regressions,Chenery-Syrquin (1975).
4/ Capital inflow is net imports of goods and non-factor services.5/ Central plus local government revenue, excluding savings bonds and public factor
income; tax revenue includes SEE corporate taxes.6/ Includes manufacturing and construction.Sources: Turkish State Institute of Statistics, national accounts data;
World Bank (1974), government revenue and educational expenditures,(1953-63); Turkish State Planning Organization, Annual Programs; Governmentof Turkey, Ministry of Finance, Consolidated Budgets; and Celasun (1981)for 1978 actual allocational shares.
- 17 -
Table 2.2
Demographic and Income Distribution Processes, 1953-1978 1/
Actual- Predicted&1953 1963 1973 1978 1953 1963 1973 1978
(Percent of GDP)
A. Labor Allocation 4/
X Share ofa. Primary labor 79.2 77.6 64.8 60.9 56.9 53.8 47.2 44.9b. Industry labor 7.4 10.1 13.6 15.3 15.8 17.9 21.7 22.9c. Utilities and
Service Labor 13.4 12.3 21.6 23.8 17.4 28.2 30.8 31.9
B. Urbanization
Urban percent oftotal population 20.8 28.9 40.1 45.8 33.9 39.0 46.4 48.8
C. Demographic Transition5/
a. Birth Rate(per thousand) - 39.6 35.0 32.2 37.5 35.2 31.5 30.3
b. Death Rate(per thousand) - 14.6 10.8 10.0 14.9 13.8 12.1 11.6
D. Income Distribution
a. Share of Highest 20X - 57.0 56.5 - 56.1 56.1 55.7 55.3b. Share of Lowest 40% - 13.0 11.5 - 11.7 11.5 11.2 10.1
1/ See footnote 1 in Table 2.1.
2/ See footnote 2 in Table 2.1.
3/ See footnote 3 in Table 2.1.
4/ See Table 4.1 labor data for 1953, 1963 and 1973 actual figures. The 1978labor estimates are derived from the Third Plan (SPO) data base for employ-ment.
5/ For 1963 "Actual," 1966/67 estimates from 1966/67 Demographic Survey,Hacettepe University were used.
Sources: State Institute of Statistics, Yearbooks.State Planning Organization (1976), Income Distribution.
- 18 -
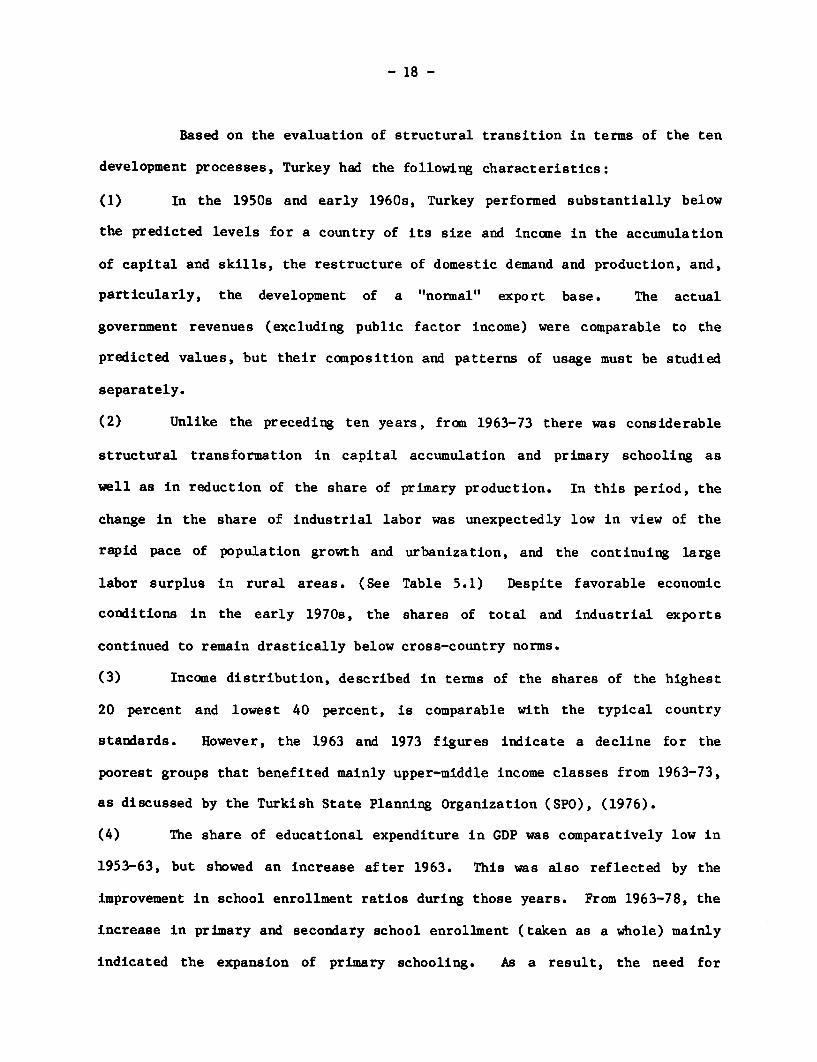
Based on the evaluation of structural transition in terms of the ten
development processes, Turkey had the following characteristics:
(1) In the 1950s and early 1960s, Turkey performed substantially below
the predicted levels for a country of its size and income in the accumulation
of capital and skills, the restructure of domestic demand and production, and,
particularly, the development of a "normal" export base. The actual
government revenues (excluding public factor income) were comparable to the
predicted values, but their composition and patterns of usage must be studied
separately.
(2) Unlike the preceding ten years, from 1963-73 there was considerable
structural transformation in capital accumulation and primary schooling as
well as in reduction of the share of primary production. In this period, the
change in the share of industrial labor was unexpectedly low in view of the
rapid pace of population growth and urbanization, and the continuing large
labor surplus in rural areas. (See Table 5.1) Despite favorable economic
conditions in the early 1970s, the shares of total and industrial exports
continued to remain drastically below cross-country norms.
(3) Income distribution, described in terms of the shares of the highest
20 percent and lowest 40 percent, is comparable with the typical country
standards. However, the 1963 and 1973 figures indicate a decline for the
poorest groups that benefited mainly upper-middle income classes from 1963-73,
as discussed by the Turkish State Planning Organization (SPO), (1976).
(4) The share of educational expenditure in GDP was comparatively low in
1953-63, but showed an increase after 1963. This was also reflected by the
improvement in school enrollment ratios during those years. From 1963-78, the
increase in primary and secondary school enrollment (taken as a whole) mainly
indicated the expansion of primary schooling. As a result, the need for
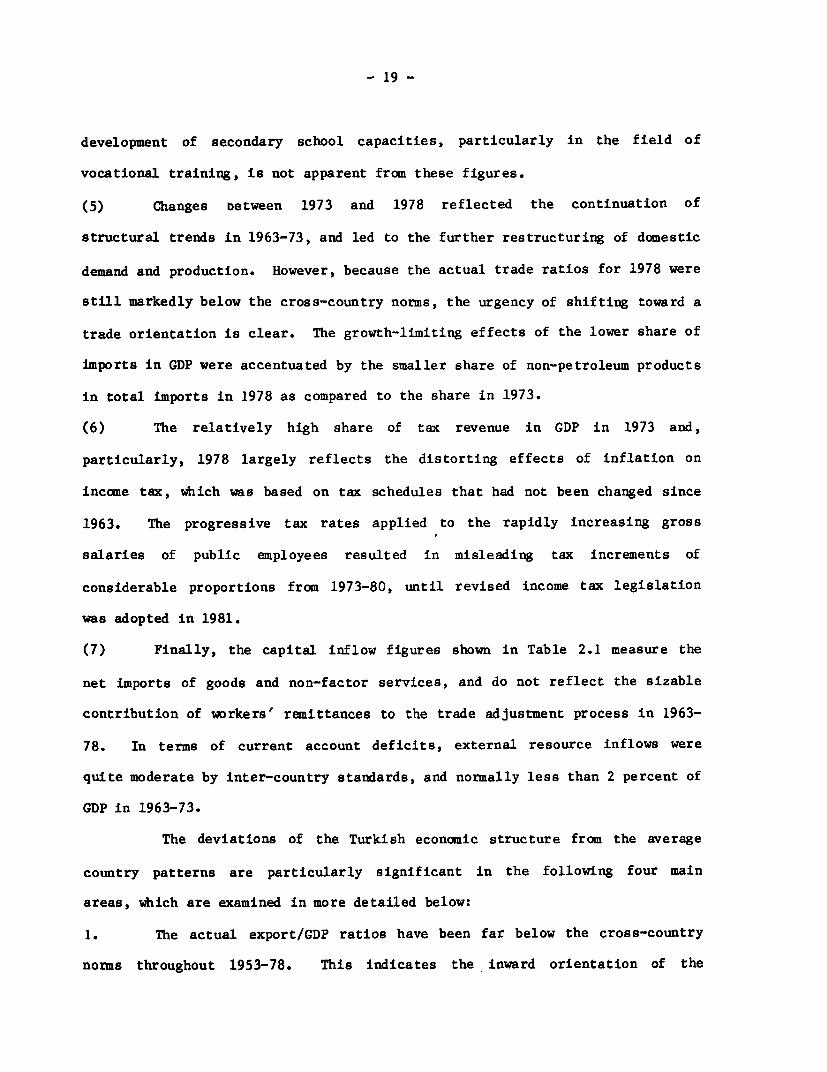
- 19 -
development of secondary school capacities, particularly in the field of
vocational training, is not apparent from these figures.
(5) Changes between 1973 and 1978 reflected the continuation of
structural trends in 1963-73, and led to the further restructuring of domestic
demand and production. However, because the actual trade ratios for 1978 were
still markedly below the cross-country norms, the urgency of shifting toward a
trade orientation is clear. The growth-limiting effects of the lower share of
imports in GDP were accentuated by the smaller share of non-petroleum products
in total imports in 1978 as compared to the share in 1973.
(6) The relatively high share of tax revenue in GDP in 1973 and,
particularly, 1978 largely reflects the distorting effects of inflation on
income tax, which was based on tax schedules that had not been changed since
1963. The progressive tax rates applied to the rapidly increasing gross
salaries of public employees resulted in misleading tax increments of
considerable proportions from 1973-80, until revised income tax legislation
was adopted in 1981.
(7) Finally, the capital inflow figures shown in Table 2.1 measure the
net imports of goods and non-factor services, and do not reflect the sizable
contribution of workers' remittances to the trade adjustment process in 1963-
78. In terms of current account deficits, external resource inflows were
quite moderate by inter-country standards, and normally less than 2 percent of
GDP in 1963-73.
The deviations of the Turkish economic structure from the average
country patterns are particularly significant in the following four main
areas, which are examined in more detailed below:
1. The actual export/GDP ratios have been far below the cross-country
norms throughout 1953-78. This indicates the inward orientation of the
- 20 -
development strategy.
2. The actual import/GDP ratios have been higher than those for exports,
but still markedly below the predicted values. This suggests the relatively
narrow scope for import substitution at the economy-wide level.
3. Although the Turkish industrialization process was considerably
delayed until 1963, the subsequent catching-up effort has been significant in
terms of the rising share of industry in total value added.
4. The share of industry in total employment has remained below cross-
country standards. This indicates the need for more labor-absorbing patterns
of industrial growth in the future.
- 21 -
3. SOURCES OF INDUSTRIALIZATION, 1953-73
A. Scope of the Analysis
As comparison of Turkey's development with the cross-country norms
discussed in Chapter 2 indicated, a considerable amount of restructuring in
domestic production occurred during 1953-73 despite the continued lag with
"normal" trade patterns. Chapter 3 examines the sources of different
expansion of sectors, which led to a rapid increase of the share of industry
in total production.
The changes in sectoral production (or gross output) have been
explained in terms of the following four factors:
1. Domestic final demand expansion
2. Export expansion
3. Import substitution
4. Technological change or changes in input-output coefficients.
The analysis has been conducted in empirically-based input-output
(I-0) frameworks incorporating these factors. The relative importance (or, in
mathematical terms, weights) of these sources of growth have been determined
for different sectoral aggregations at various times in order to compare
sectors and/or time periods as policy orientation shifts. The computational
process of distinguishing and estimating the relative weights of these factors
is known as decomposition analysis.
The estimates for the sources of gross output growth also provide a
basis to explain changes in sectoral value added and factor use in terms of
the same causal factors plus changes in value added and factor coefficients,
respectively. With minor modifications, the analytical framework is also used
to estimate the sources of import growth to shed additional light on the
- 22 -
process of import substitution experienced in the economy. In this section,
the estimates for the sources of gross output and import growth are derived
for the various subperiods of 1953-73. The sources of changes in value added
are examined for 1963-68 and 1968-73 only, because complete I-0 tables are
unavailable for the earlier periods, for which the interindustry data have
been compiled on a partial basis. The sources of change in factor use are
analyzed in Chapter 4.
The type of sources of growth analysis used here is different from
the production function approach, which relates output expansion to changes in
factor inputs and productivities-11 In this study, the process of sectoral
growth is primarily considered from the demand side based on the consistent
accounting identities of input-output relations. There are two methods that
can be used to analyze growth from this perspective. The first approach is
known as the constant composition method (referred to hereinafter as the
"composition method"). Following the tradition of the celebrated analysis of
Chenery, Shishido and Watanabe (CSW, 1962) for Japan, it attempts to explain
the nonproportional expansion of sectoral output in terms of the non-
proportional growth of causal factors observed in individual sectors.
Nonproportional growth is measured by deviations from the balanced (or norm)
growth path, in which all elements expand proportionally at the growth rate of
aggregate demand or aggregate value added.
The second approach is designated the constant share method
(referred to hereinafter as the "share method"). It differs from the
composition method in the treatment of import substitution as a cause of
expansion. The share method, which was elaborated by Syrquin (1976), defines
1/ In Chapter 4, the roles of labor reallocation and productivity changes inthe aggregate growth process are briefly considered.
- 23 -
the constant (initial year) share of imports in domestic demand as the norm in
individual sectors, and defines import substitution in terms of changes in the
import (or, symmetrically, domestic supply) shares rather than changes in the
commodity composition of imports. In contrast, the composition method
measures import substitution in terms of deviations of sectoral import
expansion from the expected growth path, or from the constant (initial year)
composition of sectoral imports. The share method also allows two sets of
decomposition measures which explain different phenomena under
consideration. Changes in the relevant factors are defined in terms of first
differences (or increments) and/or deviations from propositional growth.
While the deviation measures clarify the causes of structural change (seen in
compositional shifts), the first difference measures are used in examining
growth processes and policy effects in individual sectors.
For both methods, changes in intermediate input requirements have
been studied to differentiate the direct and indirect demand effects on
growth. The decomposition analysis has been divided into two variations,
known as the direct and total methods.1J The total measures combine the
direct and indirect (known as backward-linkage) effects of changes in domestic
final demand, exports and import substitution, and identify changes in I-0
coefficients (which represent technological change) as a separate source of
growth.l/ In turn, the direct measures include all intermediate uses of the
products of a particular sector under the domestic demand contribution to the
growth process.
1/ These terms also apply to variations of any approach in the sources ofgrowth literature.
2/ In the abeence of separate import matrices for all benchmark years, thepresent analysis quantifies the effects of changes in total (rather thandomestic) I-0 coefficients as a source of growth.
- 24 -
The choice of initial or terminal year coefficients (and
correspondingly terminal or initial year volume weights) in the decomposition
equations is important. This issue has been treated as an index number
problem by separately estimating the Laspeyres and Paasche indices on the
basis of structural coefficients being taken as the relevant weights. 1/ The
arithmetic means of these two indices are used here (unless otherwise
indicated) to reduce possible bias in the estimation process. For time
intervals consisting of at least two subperiods, the averages of the Laspeyres
and Paasche measures for successive subperiods are simply summed to obtain the
"chained" measures for sources of growth. Appendix 1 provides a method-
ological review of the sources of growth models of the types employed in the
present study, and gives the algebraic formulations of the decomposition
equations under the variant methods.
B. Basic Data
The data base consists of interindustry data analyzed for five
benchmark years spaced at five-year intervals from 1953-73. The three I-0
tables compiled by the official agencies for the years 1963, 1968 and 1973
have been adjusted for differences in sector coverage, reorganized in 25x25
sector matrices, and deflated to constant 1968 domestic prices.2/ Before the
1/ In the cases where the initial year I-0 matrix is not available (e.g., fortime periods starting with 1953 in the Turkish case), a modified form ofLaspeyres index is used, as noted in Appendix 1.
2/ The SPO made an earlier attempt to prepare a 15 sector table for 1959,which is not comparable with the later tables because of the differencesin sector classification and price conventions. See Korum (1963) for adetailed review of the 1959 table. Another unpublished table by the SP0for 1967 has not been used in the present study. The 1963 table wascompiled by the SP0, while the 1968 and 1973 tables were published by theState Institute of Statistics. See Appendix 2 for a detailed account ofthe deflation work needed to prepare a consistent set of data for thisstudy.
- 25 -
data was deflated, the 1963 I-0 table required substantial adjustments in the
imputed values of some of the component parts of agricultural and livestock
outputs (such as straw, pasture and animal services), and in the
classification of utilities, public services, crude oil and oil refining
sectors. The treatment of cotton ginning also had to be modified in the 1973
I-0 table to ensure compatability with the export commodity classification of
the earlier tables.
The data for the benchmark years 1953 and 1958 represent 1952-54 and
1957-59 averages to minimize the distorting effects of cyclical factors in the
analysis. In the absence of complete I-0 matrices for these two benchmark
years, the gross output, domestic final and intermediate demand, and trade
data were estimated at the 25 sector level of aggregation to establish the
minimum levels for estimating the sources of output and import growth for
periods starting with 1953 or 1958.21 In the latter stages of the research,
the year 1958 was dropped from the analysis. It appeared to be an
inappropriate benchmark year because of unusually severe import shortages and
economic disruptions.
The figures totalled from the deflated I-0 data of this study are
comparable to the estimates of the official national income (NY) accounts
published by the State Institute of Statistics (SIS) in current as well as in
constant 1968 prices. As shown in Table 3.1, the constant price value added
1/ For the years 1953 (1952-54 average) and 1958 (1957-59 average), thecommodity trade data from the United Nations Yearbook of InternationalTrade Statistics was processed according to the trade classifications ofthe 1963 and 1968 I-0 tables, and then deflated to constant prices bydeflators given in Annex II. The net output figures of Ecevit and Ozotun(1974) and various SIS sources were converted into gross output estimateson the basis of available production data. For estimation of the elementsof domestic demand, the data analysis drew upon partial official dataavailable on fixed investment and various estimates based on incomeelasticities for private consumption.
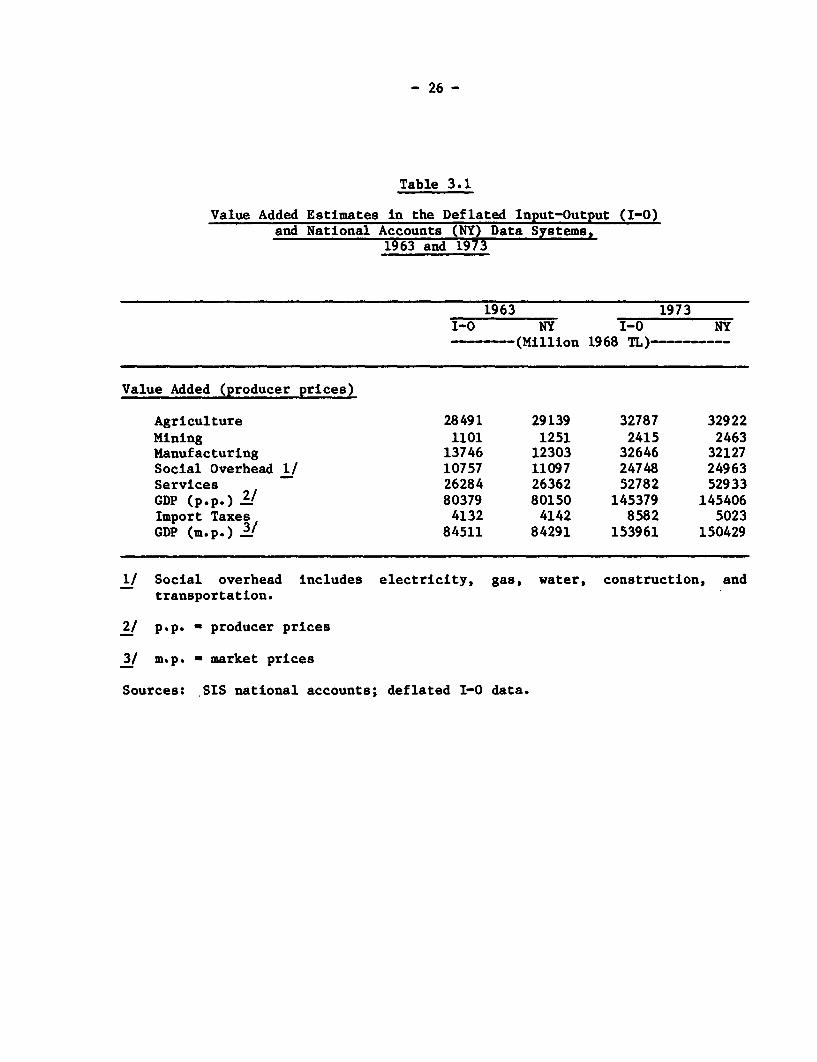
- 26 -
Table 3.1
Value Added Estimates in the Deflated Input-Output (I-O)and National Accounts (NY) Data Systems,
1963 and 1973
1963 1973I-0 NY I-0 NY----- (Million 1968 TL)-----
Value Added (producer prices)
Agriculture 28491 29139 32787 32922Mining 1101 1251 2415 2463Manufacturing 13746 12303 32646 32127Social Overhead 1/ 10757 11097 24748 24963Services 26284 26362 52782 52933GDP (p.p.) 2/ 80379 80150 145379 145406Import Taxes 4132 4142 8582 5023GDP (m.p.) 3/ 84511 84291 153961 150429
1/ Social overhead includes electricity, gas, water, construction, andtransportation.
2/ p.p. - producer prices
3/ m.p. - market prices
Sources: SIS national accounts; deflated I-0 data.
- 27 -
estimates for the major sectors in the I-0 and NY data systems are nearly
the same for the 1963 and 1973 benchmark years.l/
To ensure comparability with other country studies, all sources of
growth computations here were carried out at the 25 sector level 2 To
simplify the analysis, the results have been further combined into 9 major
sectors, except where discussions are presented in more detail.3/
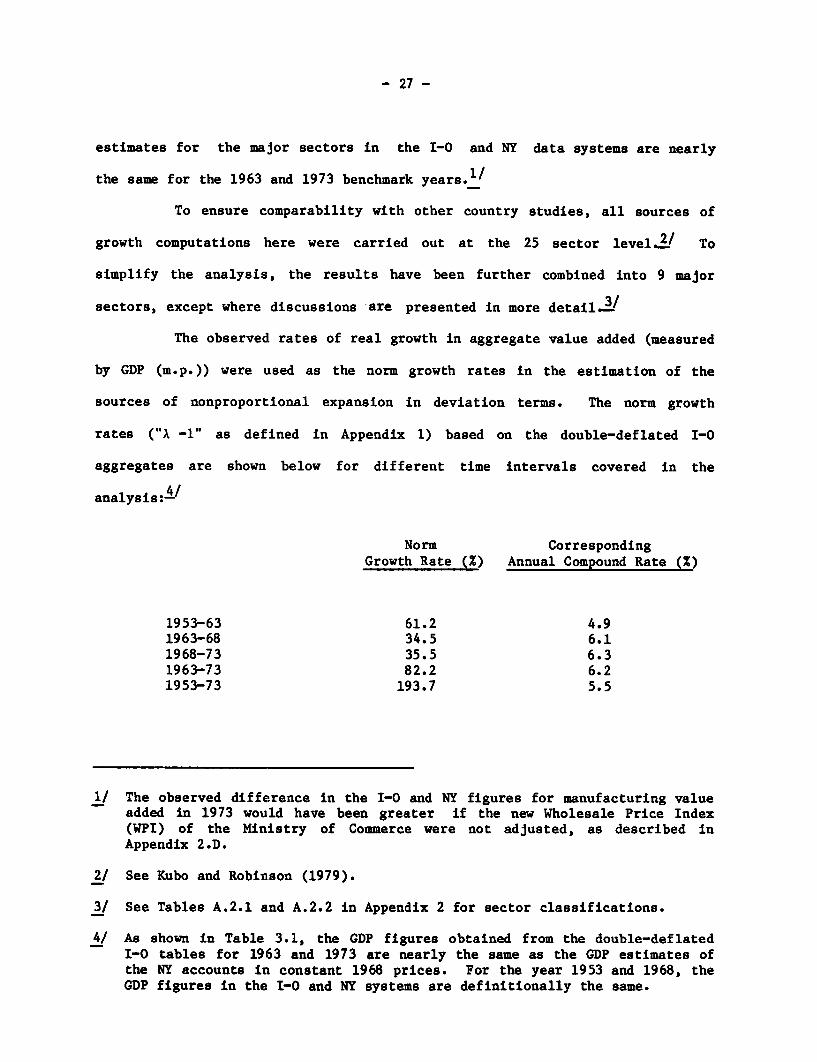
The observed rates of real growth in aggregate value added (measured
by GDP (m.p.)) were used as the norm growth rates in the estimation of the
sources of nonproportional expansion in deviation terms. The norm growth
rates ("A -1" as defined in Appendix 1) based on the double-deflated I-0
aggregates are shown below for different time intervals covered in the
analysis:gl
Norm CorrespondingGrowth Rate (%) Annual Compound Rate (%)
1953-63 61.2 4.91963-68 34.5 6.11968-73 35.5 6.31963-73 82.2 6.21953-73 193.7 5.5
1/ The observed difference in the I-0 and NY figures for manufacturing valueadded in 1973 would have been greater if the new Wholesale Price Index(WPI) of the Ministry of Commerce were not adjusted, as described inAppendix 2.D.
2/ See Kubo and Robinson (1979).
3/ See Tables A.2.1 and A.2.2 in Appendix 2 for sector classifications.
4/ As shown in Table 3.1, the GDP figures obtained from the double-deflatedI-0 tables for 1963 and 1973 are nearly the same as the GDP estimates ofthe NY accounts in constant 1968 prices. For the year 1953 and 1968, theGDP figures in the I-0 and NY systems are definitionally the same.
- 28 -
C. Policy Characteristics and Trade Orientation of the Subperiods /
Formal development planning began in the early 1960s. Following a
brief favorable trade cycle in 1948-53, the Turkish economy experienced severe
external and internal imbalances in 1954-58. As a result, a drastic
stabilization program including a massive devaluation was adopted in 1958.
Aided by sizable foreign assistance, growth gradually resumed, and price
stability was restored in 1959-62..L/ The First (1963-67) and Second (1968-72)
Five-Year Plans, implemented the following decade, placed a greater emphasis
on resource mobilization and coordination of the growth process.
Nonetheless, the restrictive trade regime and related incentives did
not fundamentally change until more externally-oriented policy attitudes
appeared in the late 1960s and early 1970s. The sizable devaluation and
reduced quantitative restrictions in 1970 permitted Turkey to take more
advantage of the favorable international trade environment in 1970-73, and
stimulated the inflow of workers remittances, which came mainly from OECD-
Europe. However, following the first oil price shock in 1973-74, real
incentives and other corrective measures to improve the balance of payments
were not maintained. As a result, Turkey experienced huge losses in foreign
exchange reserves and a sharp rise in external indebtedness. These problems
finally led to another deep crisis in 1978-80.
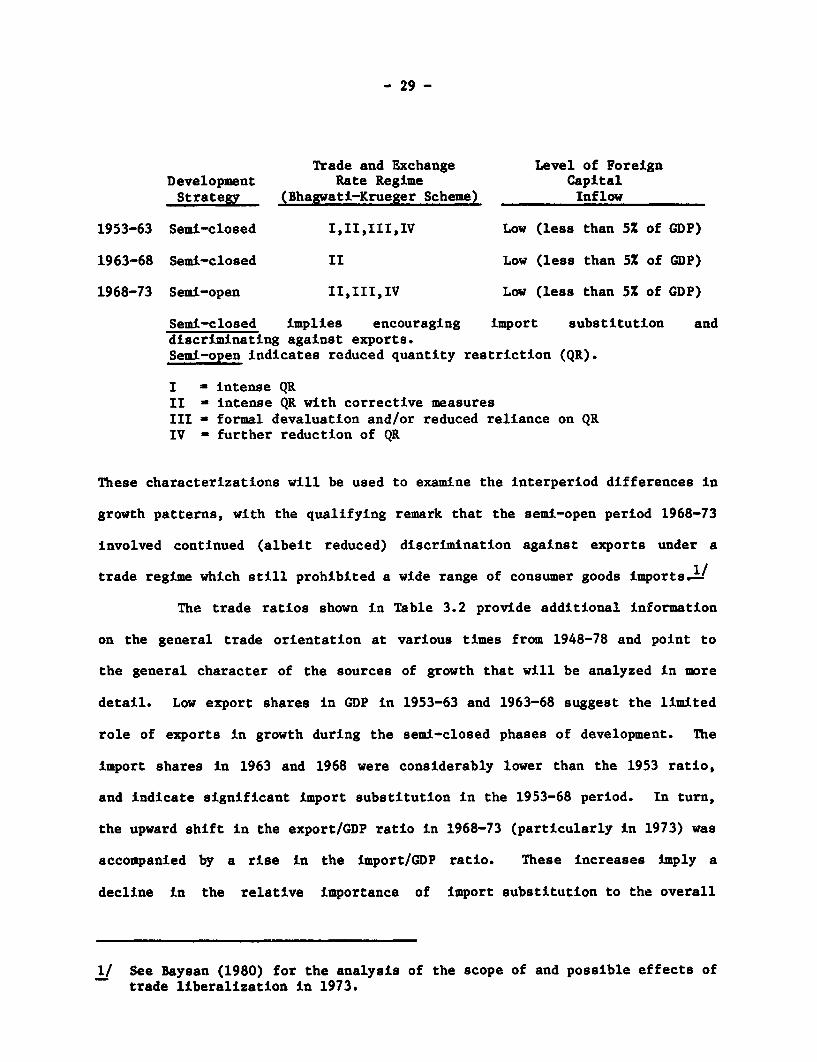
The following policy characteristics for Turkey during 1953-73 are
described by Kubo and Robinson (1979), based on the scheme of classification
developed by Bhagwati (1978) and Krueger (1978) for trade and exchange rate
regimes in developing countries:
1/ 1953-63, 1963-68, 1968-73. 1958 is excluded as aberrant.
2/ See Krueger (1974) and Okyar (1979) for detailed accounts of Turkey'seconomic policy experience in 1953-63.
- 29 -
Trade and Exchange Level of ForeignDevelopment Rate Regime CapitalStrategy (Bhagwati-Krueger Scheme) Inflow
1953-63 Semi-closed I,II,III,IV Low (less than 51 of GDP)
1963-68 Semi-closed II Low (less than 51 of GDP)
1968-73 Semi-open II,III,IV Low (less than 51 of GDP)
Semi-closed implies encouraging import substitution anddiscriminating against exports.Semi-open indicates reduced quantity restriction (QR).
I - intense QRII - intense QR with corrective measuresIII - formal devaluation and/or reduced reliance on QRIV - further reduction of QR
These characterizations will be used to examine the interperiod differences in
growth patterns, with the qualifying remark that the semi-open period 1968-73
involved continued (albeit reduced) discrimination against exports under a
trade regime which still prohibited a wide range of consumer goods imports.L/
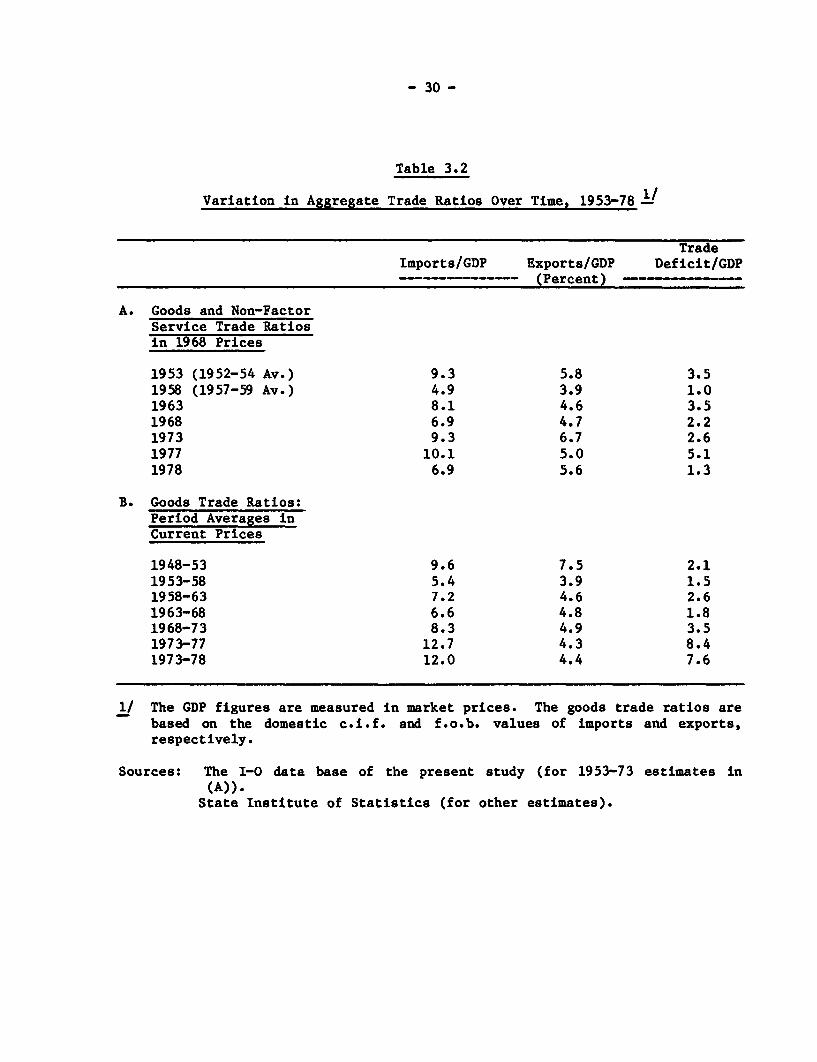
The trade ratios shown in Table 3.2 provide additional information
on the general trade orientation at various times from 1948-78 and point to
the general character of the sources of growth that will be analyzed in more
detail. Low export shares in GDP in 1953-63 and 1963-68 suggest the limited
role of exports in growth during the semi-closed phases of development. The
import shares in 1963 and 1968 were considerably lower than the 1953 ratio,
and indicate significant import substitution in the 1953-68 period. In turn,
the upward shift in the export/GDP ratio in 1968-73 (particularly in 1973) was
accompanied by a rise in the import/GDP ratio. These increases imply a
decline in the relative importance of import substitution to the overall
1/ See Baysan (1980) for the analysis of the scope of and possible effects oftrade liberalization in 1973.
- 30 -
Table 3.2
Variation in Aggregate Trade Ratios Over Time, 1953-78 l/
TradeImports/GDP Exports/GDP Deficit/GDP
(Percent)
A. Goods and Non-FactorService Trade Ratiosin 1968 Prices
1953 (1952-54 Av.) 9.3 5.8 3.51958 (1957-59 Av.) 4.9 3.9 1.01963 8.1 4.6 3.51968 6.9 4.7 2.21973 9.3 6.7 2.61977 10.1 5.0 5.11978 6.9 5.6 1.3
B. Goods Trade Ratios:Period Averages inCurrent Prices
1948-53 9.6 7.5 2.11953-58 5.4 3.9 1.51958-63 7.2 4.6 2.61963-68 6.6 4.8 1.81968-73 8.3 4.9 3.51973-77 12.7 4.3 8.41973-78 12.0 4.4 7.6
1/ The GDP figures are measured in market prices. The goods trade ratios arebased on the domestic c.i.f. and f.o.b. values of imports and exports,respectively.
Sources: The I-0 data base of the present study (for 1953-73 estimates in(A)).
State Institute of Statistics (for other estimates).
- 31 -
growth process. However, as the figures in Table 3.2 broadly suggest, the
trend in declining import substitution continued in 1973-77, but it was not
accompanied by export-oriented restructuring in domestic production.!I
Consequently, the sharp fall in the imports/GDP ratio in 1978 signalled the
emergence of a massive external imbalance in the economy.
Tables 3.3 and 3.4 present a set of complementary data. Output and
trade growth are broken down by major sectors in the two successive ten-year
periods of 1953-63 and 1963-73. As these tables show, economic growth was
more rapid in 1963-73. In addition, it was accompanied by a considerable
change in the sectoral mix of output. The share of the primary sectors in GDP
(m.p.) declined from 41.5 percent in 1963 to 22.7 percent in 1973, while the
share of manufacturing increased from 11.5 percent to 21.2 percent. Although
the high rates of protection in Turkey undoubtedly cause industrial shares to
be overestimated, shifts toward manufacturing and other non-agricultural
sectors clearly indicate a transitional process toward industrialization.._/
The sources of growth analysis represents an empirical attempt to measure the
relative importance of several factors which affected and shaped such a
process.
D. Sources of Growth and Structural Change: An Economy-Wide Analysis
Internal factors were prominent sources of industrialization in
Turkey's recent economic history. The decomposition measures for the sources
of growth and structural change in gross output (production) and value added
are first aggregated and examined at the national economy level. The
aggregate first difference measures are calculated from the algebraic sums of
1/ See Balassa (1979) and Celasun (1980 a) for appraisals of macroeconomicdevelopments in 1973-78.
2/ See Olgun (1975) for an analysis of the structure of protection in Turkishmanufacturing based on the 1968 data. The main results are summarized inTable 5.4.
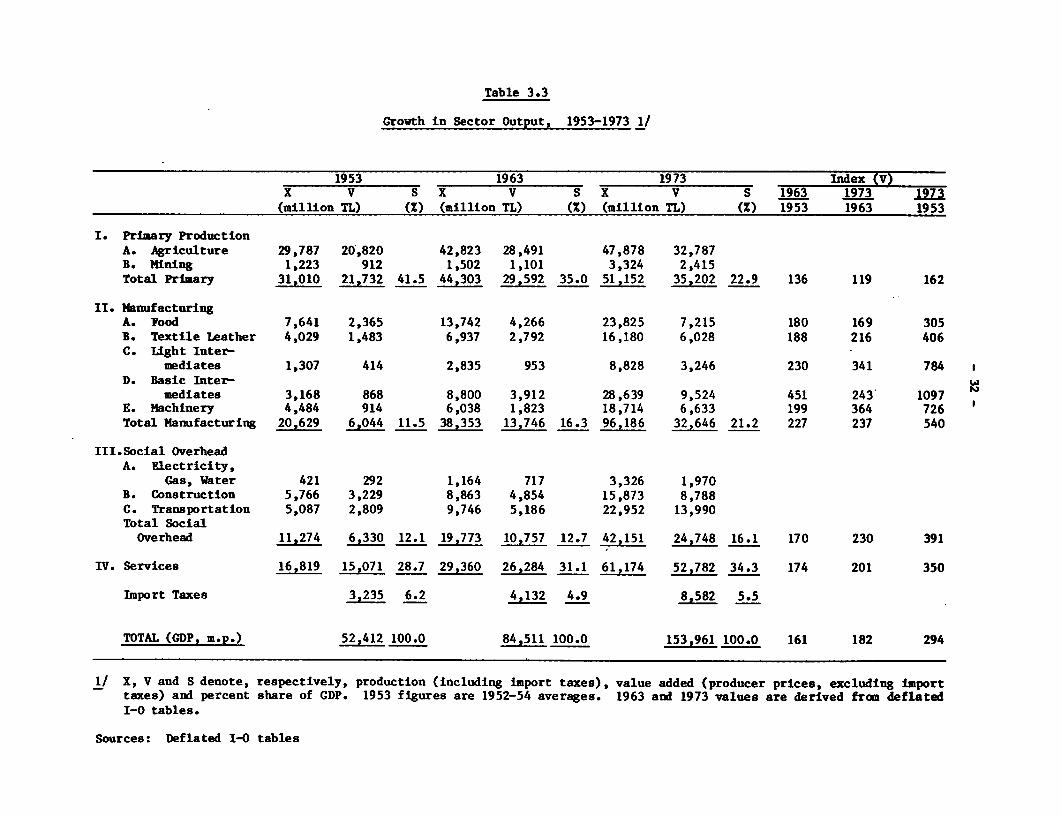
Table 3.3
Growth in Sector Output, 1953-1973 1/
1953 1963 1973 Index (V)x V S X V S X V S 1963 1973 17
(million TL) (%) (million TL) (Z) (million TL) (%) 1953 1963 1953
I. Primary ProductionA. Agriculture 29,787 20,820 42,823 28,491 47,878 32,787B. Mining 1,223 912 1,502 1,101 3,324 2,415Total Primary 31,010 21,732 41.5 44,303 29,592 35.0 51,152 35,202 22.9 136 119 162
II. ManufacturingA. Food 7,641 2,365 13,742 4,266 23,825 7,215 180 169 305B. Textile Leather 4,029 1,483 6,937 2,792 16,180 6,028 188 216 406C. Light Inter-
mediates 1,307 414 2,835 953 8,828 3,246 230 341 784D. Basic Inter-
mediates 3,168 868 8,800 3,912 28,639 9,524 451 243 1097E. Machinery 4,484 914 6,038 1,823 18,714 6,633 199 364 726Total Manufacturing 20,629 6,044 11.5 38,353 13,746 16.3 96,186 32,646 21.2 227 237 540
III.Social OverheadA. Electricity,
Gas, Water 421 292 1,164 717 3,326 1,970B. Construction 5,766 3,229 8,863 4,854 15,873 8,788C. Transportation 5,087 2,809 9,746 5,186 22,952 13,990Total SocialOverhead 11,274 6,330 12.1 19,773 10,757 12.7 42,151 24,748 16.1 170 230 391
IV. Services 16,819 15,071 28.7 29,360 26,284 31.1 61,174 52,782 34.3 174 201 350
Import Taxes 3,235 6.2 4,132 4.9 8,582 5.5
TOTAL (GDP, m.p.) 52,412 100.0 84,511 100.0 153,961 100.0 161 182 294
1/ X, V and S denote, respectively, production (including import taxes), value added (producer prices, excluding importtaxes) and percent share of GDP. 1953 figures are 1952-54 averages. 1963 and 1973 values are derived from deflatedI-0 tables.
Sources: Deflated I-0 tables
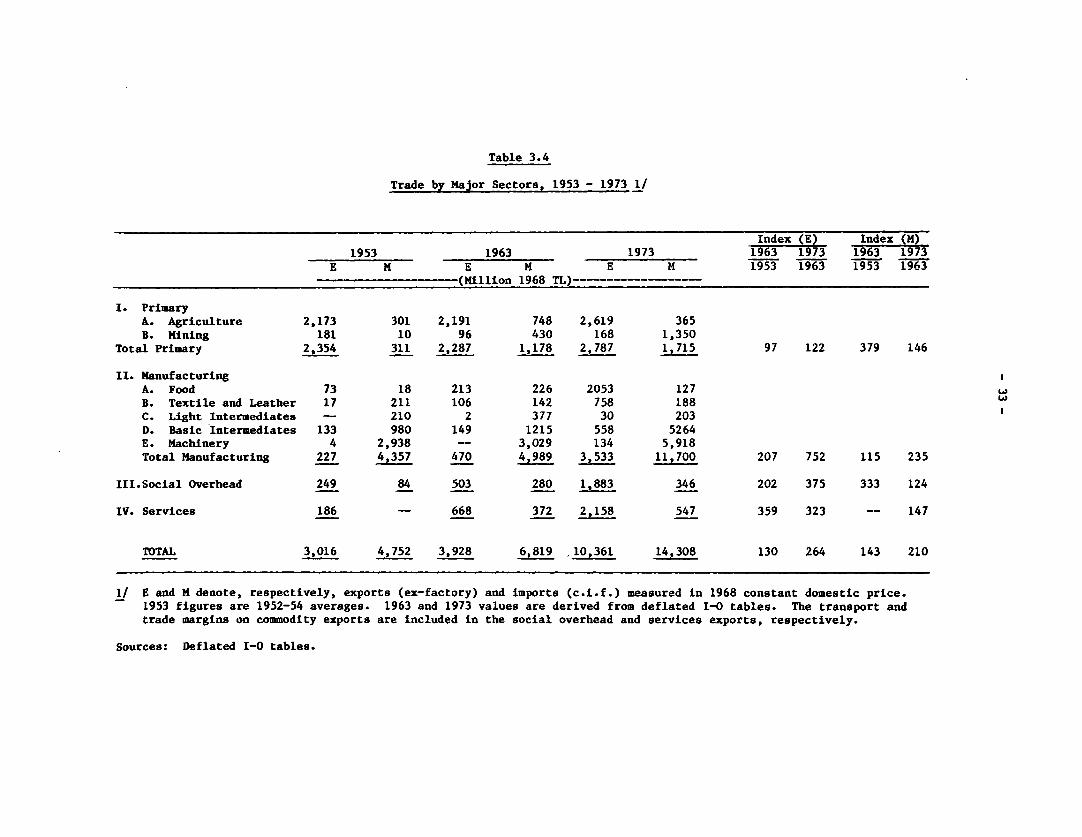
Table 3.4
Trade by Major Sectors, 1953 - 1973 1/
Index (E) Index (M)1953 1963 1973 1963 1973 1963 1973E M E M E M 1953 1963 1953 1963------------ (Million 1968 TL) ------------------
I. PrimaryA. Agriculture 2,173 301 2,191 748 2,619 365B. Mining 181 10 96 430 168 1,350Total Primary 2,354 311 2,287 1,178 2,787 1,715 97 122 379 146
II. ManufacturingA. Food 73 18 213 226 2053 127B. Textile and Leather 17 211 106 142 758 188C. Light Intermediates - 210 2 377 30 203D. Basic Intermediates 133 980 149 1215 558 5264E. Machinery 4 2,938 - 3,029 134 5,918Total Manufacturing 227 4,357 470 4,989 3,533 11,700 207 752 115 235
III.Social Overhead 249 84 503 280 1,883 346 202 375 333 124IV. Services 186 - 668 372 2,158 547 359 323 -- 147
TOTAL 3,016 4,752 3,928 6,819 10,361 14,308 130 264 143 210
1/ E and M denote, respectively, exports (ex-factory) and imports (c.i.f.) measured in 1968 constant domestic price.1953 figures are 1952-54 averages. 1963 and 1973 values are derived from deflated I-0 tables. The transport andtrade margins on commodity exports are included in the social overhead and services exports, respectively.
Sources: Deflated I-O tables.
- 34 -
sectoral changes, whereas the economy-wide deviation measures are based on the
absolute totals of sectoral deviations, disregarding their algebraic signs.
The measures derived from the decomposition of gross output are shown in
percentage terms in Table 3.5 (a and b) for all the methods used in the
analysis.
Table 3.5 shows that the relative importance of the relevant factors
significantly varies according to which decomposition measure is used. This
indicates which factors contributed more to growth (as represented by the
first difference measures) or to structural change (as represented by the
deviation measures). Under the first difference measure, the increase in
domestic final demand accounted for 87.3 percent of the increase in total
gross output in 1953-73. Yet, according to the deviation measure,
nonproportional growth of this factor explained 49.4 percent of the structural
change in production. Technological change is also a significant factor in
nonproportional expansion (structural change), in addition to its minor role
in total growth.
Table 3.5 also indicates the significance of trade in growth and
structural change. From 1953-73 the combined trade effects (of export
expansion and import substitution) accounted for 9.5 percent of growth (first
difference total measure), and 15.5 percent of the structural change in the
overall economy (deviation total measure). Import substitution was more
important in structural change than aggregate growth (6.3 versus 2.4 percent).
Yet the differences in the growth and structural effects of export expansion
are less pronounced in nearly all subperiods. This reflects relative
stability in the commodity composition of exports during the period.
Furthermore, a comparison of the total measures with the direct
measures indicates the predominant role of domestic final demand expansion in
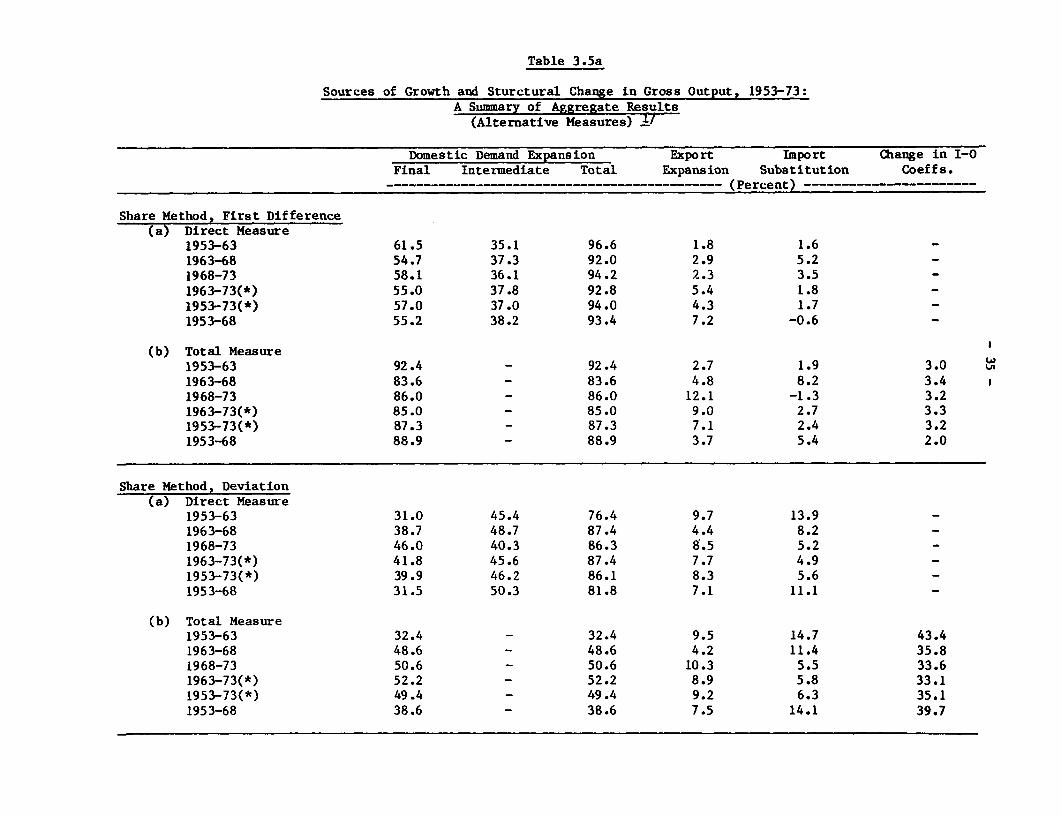
Table 3.5a
Sources of Growth and Sturctural Change in Gross Output, 1953-73:A Summary of Aggregate Results
(Alternative Measures) Yf
Domestic Demand Expansion Export Import Change in I-0Final Intermediate Total Expansion Substitution Coeffs.
…----------…----------------------------- (Percent) -----------------…
Share Method, First Difference(a) Direct Measure
1953-63 61.5 35.1 96.6 1.8 1.6 -1963-68 54.7 37.3 92.0 2.9 5.2 -1968-73 58.1 36.1 94.2 2.3 3.5 -1963-73(*) 55.0 37.8 92.8 5.4 1.8 -1953-73(*) 57.0 37.0 94.0 4.3 1.7 _1953-68 55.2 38.2 93.4 7.2 -0.6 -
(b) Total Measure1953-63 92.4 - 92.4 2.7 1.9 3.01963-68 83.6 - 83.6 4.8 8.2 3.41968-73 86.0 - 86.0 12.1 -1.3 3.21963-73(*) 85.0 - 85.0 9.0 2.7 3.31953-73(*) 87.3 - 87.3 7.1 2.4 3.21953-68 88.9 - 88.9 3.7 5.4 2.0
Share Method, Deviation(a) Direct Measure
1953-63 31.0 45.4 76.4 9.7 13.9 -1963-68 38.7 48.7 87.4 4.4 8.2 -1968-73 46.0 40.3 86.3 8.5 5.2 -1963-73(*) 41.8 45.6 87.4 7.7 4.9 -1953-73(*) 39.9 46.2 86.1 8.3 5.6 _1953-68 31.5 50.3 81.8 7.1 11.1 -
(b) Total Measure1953-63 32.4 - 32.4 9.5 14.7 43.41963-68 48.6 - 48.6 4.2 11.4 35.81968-73 50.6 - 50.6 10.3 5.5 33.61963-73(*) 52.2 - 52.2 8.9 5.8 33.11953-73(*) 49.4 - 49.4 9.2 6.3 35.11953-68 38.6 - 38.6 7.5 14.1 39.7
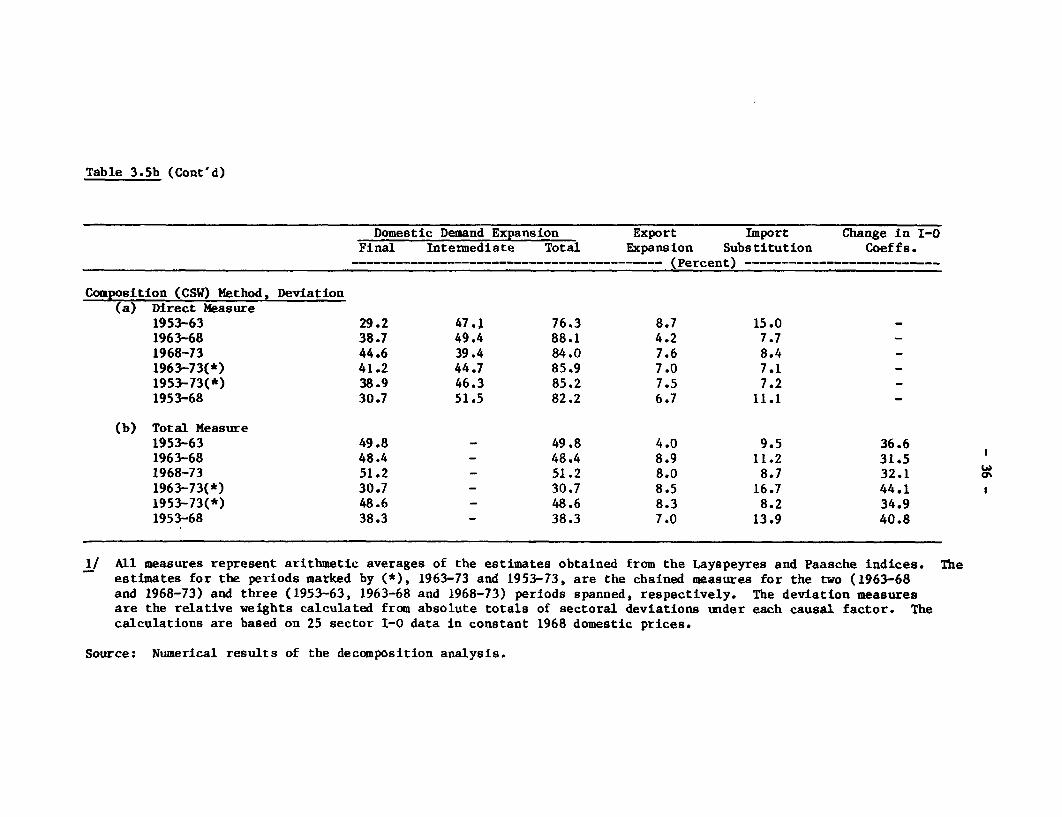
Table 3.5b (Cont'd)
Domestic Demand Expansion Export Import Change in I-0Final Intermediate Total Expansion Substitution Coeffs.
------------------------------------------ (Percent) --------------------------
Composition (CSW) Method, Deviation(a) Direct Measure
1953-63 29.2 47.1 76.3 8.7 15.0 -1963-68 38.7 49.4 88.1 4.2 7.7 -1968-73 44.6 39.4 84.0 7.6 8.4 -1963-73(*) 41.2 44.7 85.9 7.0 7.1 _1953-73(*) 38.9 46.3 85.2 7.5 7.2 _1953-68 30.7 51.5 82.2 6.7 11.1 -
(b) Total Measure1953-63 49.8 - 49.8 4.0 9.5 36.61963-68 48.4 - 48.4 8.9 11.2 31.51968-73 51.2 - 51.2 8.0 8.7 32.11963-73(*) 30.7 - 30.7 8.5 16.7 44.11953-73(*) 48.6 - 48.6 8.3 8.2 34.91953-68 38.3 - 38.3 7.0 13.9 40.8
1/ All measures represent arithmetic averages of the estimates obtained from the Layspeyres and Paasche indices. Theestimates for the periods marked by (*), 1963-73 and 1953-73, are the chained measures for the two (1963-68and 1968-73) and three (1953-63, 1963-68 and 1968-73) periods spanned, respectively. The deviation measuresare the relative weights calculated from absolute totals of sectoral deviations under each causal factor. Thecalculations are based on 25 sector 1-0 data in constant 1968 domestic prices.
Source: Numerical results of the decomposition analysis.
- 37 -
generating intermediate demand increases. This result, known as the backward
linkage effect, explains about 37 percent of the increase in total output from
1953-73. Under deviation analysis, nonproportional growth of intermediate
demand is largely attributed to the effects of technological change rather
than to the nonproportional growth of domestic final demand. Additionally,
the backward linkage effects of trade factors on the general economy appear to
be small, except in 1963-68 and 1968-73 when import substitution and export
expansion, respectively, became more important.
A general view of the economy also demonstrates the varying
proportions of trade effects over time. The relative contributions of import
substitution were higher than those of export expansion during 1953-63 and
1963-68, while a sharp reversal occurred in their relative roles in 1968-73.
These results are broadly in line with the shifts in trade policies previously
noted. According to the measures calculated separately for 1953-68, import
substitution had a significant impact on structural change in production under
the semi-closed development policies of the 1950s and 1960s, but it lost most
of its influence in the early 1970s.
The differences in the treatment of import substitution under these
various approaches is indicated by a comparison of the deviation measures
obtained under the composition and share methods. Under the composition
method, which treats import substitution in relation to total GDP rather than
to sector demand, the relative contribution of import substitution appears to
be affected by variations in the nonproportional growth rates of imports.
This point will be discussed below in regard to the major sectors.
The measures for the decomposition of value added are also combined
at the national economy level, as shown in Table 3.6. These measures support
the findings of the decomposition analysis for gross output discussed above.
- 38 -
Furthermore, the additional factor found in value added analysis (the change
in value added coefficients) made negative contributions to growth, but
strongly influenced structural change in value added during 1963-73. The
measures summarized in Table 3.6 reinforce the overall findings that internal
factors were prominent sources of industrialization in Turkey's recent
economic history.
E. Sources of Growth and Structural Change in Gross Output: An Analysis by
Major Sectors
The results of the decomposition of gross output are reported at the
9 sector level in Tables 3.7 (a and b) and 3.8 for growth and structural
change, respectively. Manufacturing industries have been classified into five
major groups (or sectors) which exhibited varying patterns of growth from
1953-73. In these tables, the decomposition measures are also given
separately for total manufacturing and for manufacturing excluding food and
textiles, mainly to crystallize the nature of trade effects in manufacturing.
Growth of Gross Output: First Difference Measures
For different intervals during 1953-73, Table 3.7 (a and b) gives
the direct and total first difference decomposition measures for major
sectors. The chained measures for 1963-73 are dominated by the estimates for
1968-73, which was characterized by larger increases in gross output in most
sectors. The analysis of the sources of agricultural output growth is
affected by the choice of benchmark years which do not have the same weather
conditions. For example, the excellent harvest of 1963 meant that a large
increase in agricultural output was recorded in 1953-63 but that a limited
increase was noted in 1963-68.
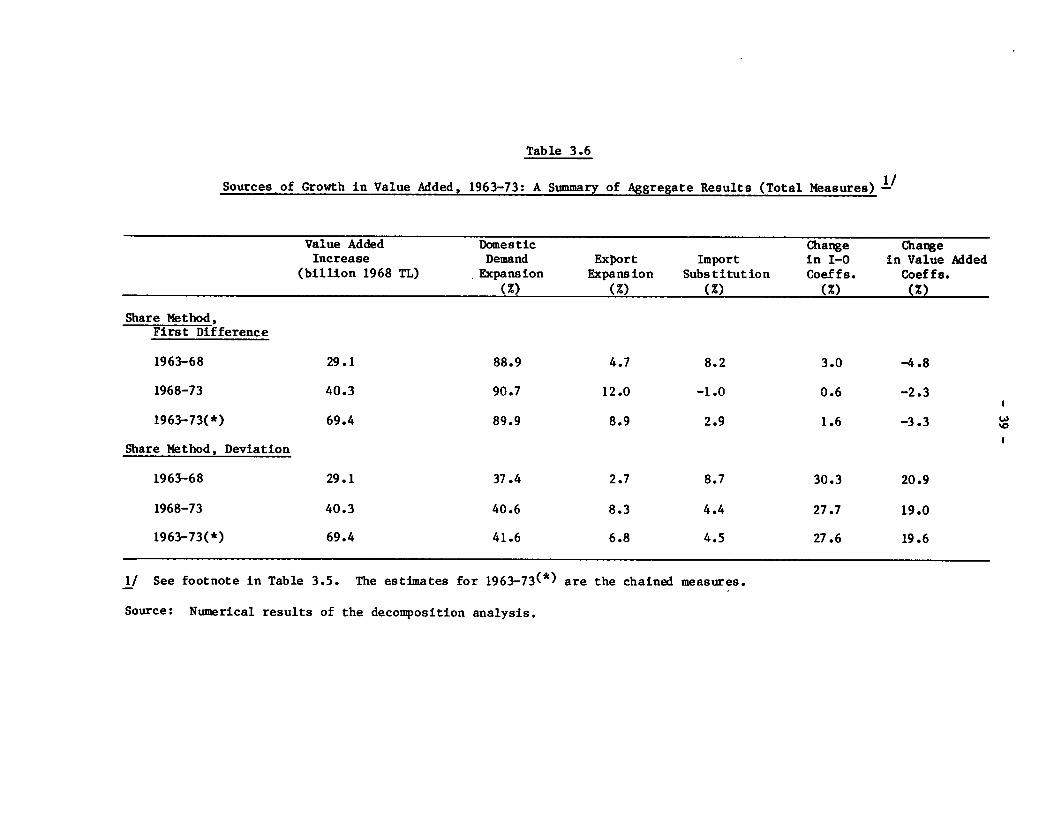
Table 3.6
Sources of Growth in Value Added, 1963-73: A Summary of Aggregate Results (Total Measures) -
Value Added Domestic Change ChangeIncrease Demand Export Import in I-0 in Value Added
(billion 1968 TL) Expansion Expansion Substitution Coeffs. Coeffs.(%) (%) (M) (%) (%)
Share Method,First Difference
1963-68 29.1 88.9 4.7 8.2 3.0 -4.8
1968-73 40.3 90.7 12.0 -1.0 0.6 -2.3
1963-73(*) 69.4 89.9 8.9 2.9 1.6 -3.3 v
Share Method, Deviation
1963-68 29.1 37.4 2.7 8.7 30.3 20.9
1968-73 40.3 40.6 8.3 4.4 27.7 19.0
1963-73(*) 69.4 41.6 6.8 4.5 27.6 19.6
1/ See footnote in Table 3.5. The estimates for 1963-73(*) are the chained measures.
Source: Numerical results of the decomposition analysis.
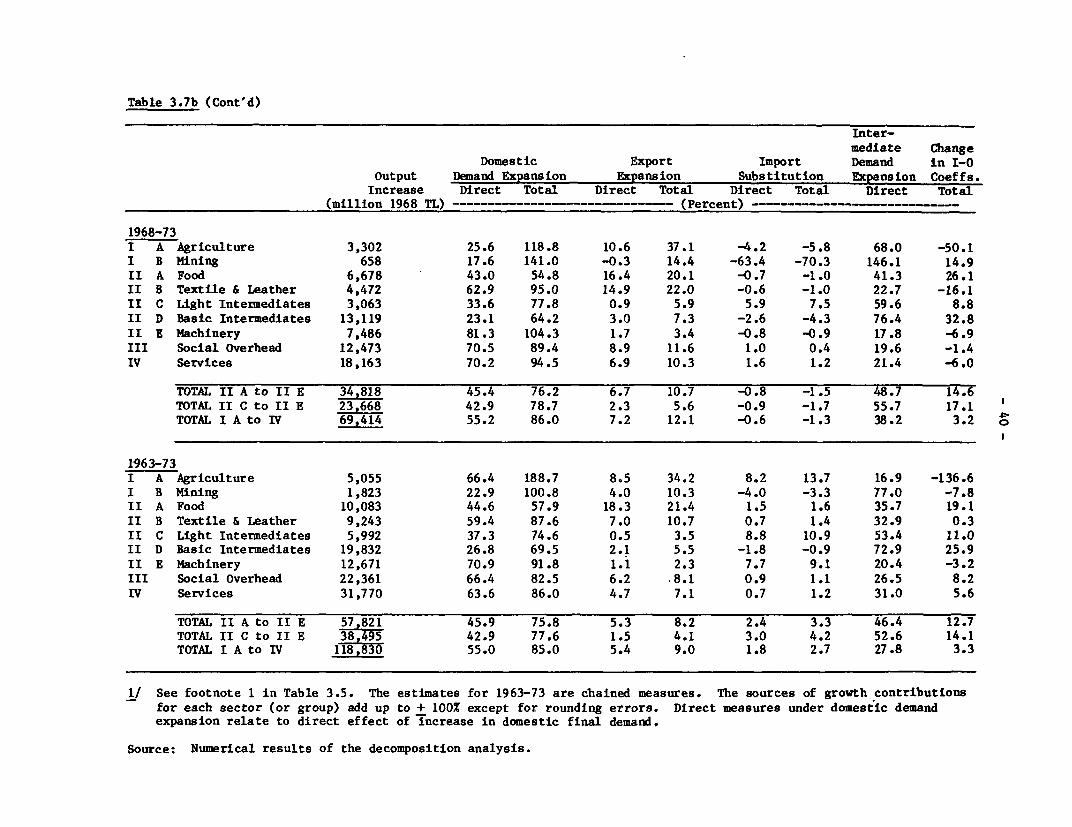
Table 3.7b (Cont'd)
Inter-mediate Change
Domestic Export Import Demand in I-0Output Demand Expansion Expansion Substitution Expansion Coeffs.
Increase Direct Total Direct Total Direct Total Direct Total(million 1968 TL) ------------------------------ (Percent) ----------------- -
1968-73I A Agriculture 3,302 25.6 118.8 10.6 37.1 -4.2 -5.8 68.0 -50.1I B Mining 658 17.6 141.0 -0.3 14.4 -63.4 -70.3 146.1 14.9II A Food 6,678 43.0 54.8 16.4 20.1 -0.7 -1.0 41.3 26.1II B Textile & Leather 4,472 62.9 95.0 14.9 22.0 -0.6 -1.0 22.7 -16.1II C Light Intenmediates 3,063 33.6 77.8 0.9 5.9 5.9 7.5 59.6 8.8II D Basic Intermediates 13,119 23.1 64.2 3.0 7.3 -2.6 -4.3 76.4 32.8II E Machinery 7,486 81.3 104.3 1.7 3.4 -0.8 -0.9 17.8 -6.9III Social Overhead 12,473 70.5 89.4 8.9 11.6 1.0 0.4 19.6 -1.4IV Services 18,163 70.2 94.5 6.9 10.3 1.6 1.2 21.4 -6.0
TOTAL II A to II E 34,818 45.4 76.2 6.7 10.7 -0.8 -1.5 48.7 14.6TOTAL II C to II E 23,668 42.9 78.7 2.3 5.6 -0.9 -1.7 55.7 17.1TOTAL I A to IV 69,414 55.2 86.0 7.2 12.1 -0.6 -1.3 38.2 3.2
1963-73I A Agriculture 5,055 66.4 188.7 8.5 34.2 8.2 13.7 16.9 -136.6I B Mining 1,823 22.9 100.8 4.0 10.3 -4.0 -3.3 77.0 -7.8II A Food 10,083 44.6 57.9 18.3 21.4 1.5 1.6 35.7 19.1II B Textile & Leather 9,243 59.4 87.6 7.0 10.7 0.7 1.4 32.9 0.3II C Light Intermediates 5,992 37.3 74.6 0.5 3.5 8.8 10.9 53.4 11.0II D Basic Intermediates 19,832 26.8 69.5 2.1 5.5 -1.8 -0.9 72.9 25.9II E Machinery 12,671 70.9 91.8 1.1 2.3 7.7 9.1 20.4 -3.2III Social Overhead 22,361 66.4 82.5 6.2 8.1 0.9 1.1 26.5 8.2IV Services 31,770 63.6 86.0 4.7 7.1 0.7 1.2 31.0 5.6
TOTAL II A to II E 57,821 45.9 75.8 5.3 8.2 2.4 3.3 46.4 12.7TOTAL II C to II E 38,495 42.9 77.6 1.5 4.1 3.0 4.2 52.6 14.1TOTAL I A to IV 118,830 55.0 85.0 5.4 9.0 1.8 2.7 27.8 3.3
1/ See footnote 1 in Table 3.5. The estimates for 1963-73 are chained measures. The sources of growth contributionsfor each sector (or group) add up to + 100% except for rounding errors. Direct measures under domestic demandexpansion relate to direct effect of increase in domestic final demand.
Source: Numerical results of the decomposition analysis.
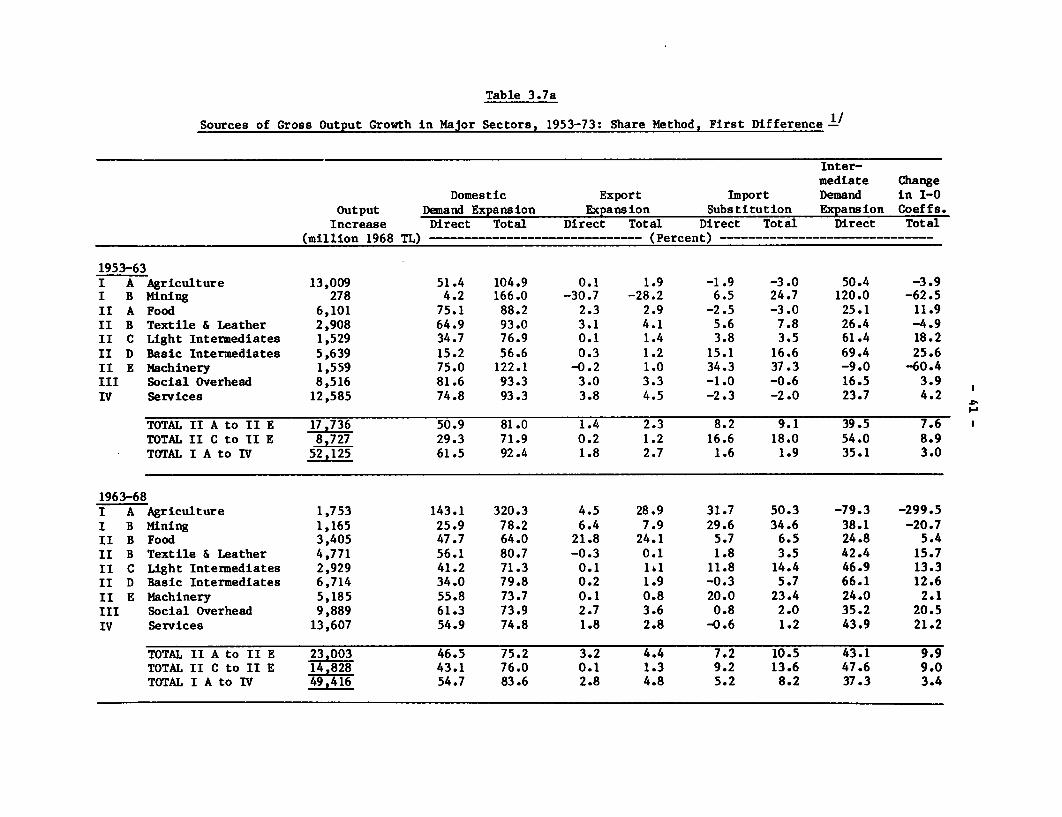
Table 3.7a
Sources of Gross Output Growth in Major Sectors, 1953-73: Share Method, First Differencel/
Inter-mediate Change
Domestic Export Import Demand in I-0
Output Demand Expansion Expansion Substitution Expansion Coeffs.Increase Direct Total Direct Total Direct Total Direct Total
(million 1968 TL) ------- … ---------- (Percent) -----------…-----
1953-63I A Agriculture 13,009 51.4 104.9 0.1 1.9 -1.9 -3.0 50.4 -3.9I B Mining 278 4.2 166.0 -30.7 -28.2 6.5 24.7 120.0 -62.5II A Food 6,101 75.1 88.2 2.3 2.9 -2.5 -3.0 25.1 11.9II B Textile & Leather 2,908 64.9 93.0 3.1 4.1 5.6 7.8 26.4 -4.9II C Light Intermediates 1,529 34.7 76.9 0.1 1.4 3.8 3.5 61.4 18.2II D Basic Intermediates 5,639 15.2 56.6 0.3 1.2 15.1 16.6 69.4 25.6II E Machinery 1,559 75.0 122.1 -0.2 1.0 34.3 37.3 -9.0 -60.4III Social Overhead 8,516 81.6 93.3 3.0 3.3 -1.0 -0.6 16.5 3.9IV Services 12,585 74.8 93.3 3.8 4.5 -2.3 -2.0 23.7 4.2
TOTAL II A to II E 17,736 50.9 81.0 1.4 2.3 8.2 9.1 39.5 7.6TOTAL II C to II E 8,727 29.3 71.9 0.2 1.2 16.6 18.0 54.0 8.9TOTAL I A to IV 52,125 61.5 92.4 1.8 2.7 1.6 1.9 35.1 3.0
1963-68I A Agriculture 1,753 143.1 320.3 4.5 28.9 31.7 50.3 -79.3 -299.5
I B Mining 1,165 25.9 78.2 6.4 7.9 29.6 34.6 38.1 -20.7II B Food 3,405 47.7 64.0 21.8 24.1 5.7 6.5 24.8 5.4II B Textile & Leather 4,771 56.1 80.7 -0.3 0.1 1.8 3.5 42.4 15.7II C Light Intermediates 2,929 41.2 71.3 0.1 1h1 11.8 14.4 46.9 13.3II D Basic Intermediates 6,714 34.0 79.8 0.2 1.9 -0.3 5.7 66.1 12.6II E Machinery 5,185 55.8 73.7 0.1 0.8 20.0 23.4 24.0 2.1III Social Overhead 9,889 61.3 73.9 2.7 3.6 0.8 2.0 35.2 20.5IV Services 13,607 54.9 74.8 1.8 2.8 -0.6 1.2 43.9 21.2
TOTAL II A to II E 23,003 46.5 75.2 3.2 4.4 7.2 10.5 43.1 9.9TOTAL II C to II E 14,828 43.1 76.0 0.1 1.3 9.2 13.6 47.6 9.0TOTAL I A to IV 49,416 54.7 83.6 2.8 4.8 5.2 8.2 37.3 3.4
- 42 -
Despite the distortions caused by weather fluctuations, the
predominant role of domestic demand expansion in agricultural growth
throughout the entire period is obvious. The major difference between the
direct and total measures for domestic demand contribution is a result of the
indirect effects of domestic final demand expansion on the food processing
industries. The implied shifts in the relative shares of agriculture and food
processing in total private consumption reflect the effects of urbanization
and income increases on consumption patterns. The larger contribution of
export expansion to agricultural growth in the last part of the period is also
notable, particularly in the form of intermediate demand generated by food and
textile exports. As observed previously, the net contribution of changes in
input-output coefficients has been negative in agricultural growth, mainly due
to declining proportions of traditional (intra-sectoral) inputs in crop and
livestock production.
The mining industry is a small primary sector in Turkey's productive
structure. Its expansion has been constrained by numerous institutional and
technological factors. In the early 1950s, mineral exports were moderately
important, and their subsequent decline is reflected in the negative
contribution of export expansion to sectoral growth from 1953-63. The
positive effect of import substitution on growth in 1953-63 and 1963-68 ended
in 1968-73 mainly because of increasing imports of crude oil and phosphate
rock in the early 1970s. In the expansion of mining output, intermediate
demand resulting from final demand growth in other sectors (e.g.,
construction) was a dominant factor in all periods. The rise in the direct
contribution of domestic final demand expansion in 1963-73 mainly corresponds
to the increased share of coal in residential heating as non-commercial fuel
sources were gradually replaced.
- 43 -
The expanded role of technological change in the last subperiod
(1968-73) had a significant impact on the mining industry. This development
was the result of the increasing share of raw minerals in intermediate inputs
required by the agricultural and manufacturing sectors. These trends in
mineral use became more prominent in 1973-77, and caused a rapid growth of oil
and non-oil mineral imports when domestic supply adjustments did not occur.
In manufacturing, domestic final demand expansion (with its total
effects) accounted for 81 and 76 percent of the growth in gross output in
1953-63 and 1963-73, respectively. With technological change contributing
about 8 and 13 percent in these two periods, internal factors clearly played
an overwhelming role in the overall expansion of this sector. Export
expansion and import substitution together accounted for only 11 percent of
the manufacturing output growth in the entire 1953-73 period.
The relative contributions of export expansion and import substitu-
tion to manufacturing growth varied significantly over time and by major
sectors. During 1953-63 and 1963-68, total import substitution effects
accounted for 18 and 14 percent of the gross output increases in manufacturing
(excluding food and textiles), but their relative contribution turned negative
(for the same group) in 1968-73. Export expansion was an insignificant
contributor to manufacturing growth in 1953-63, but became important for food
processing in 1963-68. In the subsequent period of 1968-73, export expansion
explained 20 and 22 percent of the production increases in food and textiles,
respectively, while accounting for nearly 11 percent of the aggregate growth
in total manufacturing.
Domestic demand expansion was the predominant source of gross output
growth in the social overhead and services sectors. The positive export
contributions of these major sectors largely reflect changes in transport and
- 44 -
in trade margins on commodity exports, rather than increases in invisible
exports such as tourism and shipping. With import substitution playing
practically no role in their expansion, social overhead and services exhibited
the typical patterns of nontradable sectors in the growth process.-/
Structural Change in Gross Output: Deviation Measures
Table 3.8 indicates the decomposition of nonproportional output
expansions in major sectors for 1953-63 and 1963-73. The reported estimates
are the total measures obtained under the share and composition methods. The
measurement of import substitution in relation to changes in GDP results in
rather exaggerated estimates of its role under the composition method, which
implicitly treats imports as perfect substitutes for domestic goods. In
particular, according to the composition method, import substitution provided
a large negative contribution (-19 percent) to the nonproportional growth of
manufacturing gross output in 1963-73, during which manufactured imports
increased 135 percent, as compared to 82 percent growth in aggregate value
added (see Tables 3.3 and 3.4). In turn, by focusing on the changes in the
shares of imports in total demand in individual sectors, the share method
produces import substitution measures more consistent with the rigidities
actually faced in the substitution of imports by domestic goods. The
following observations at the sector level are, therefore, based on the
deviation measures derived under the total share method.
The sectoral estimates for the sources of nonproportional growth
support the general conclusions reached on the basis of the overall analysis
discussed above. The compositional shifts in domestic final demand accounted
1/ In the 1980s, the direct effects of export expansion are likely to belarger in the social overhead sector due to growing invisible foreignexchange earnings from interregional road transport activities.
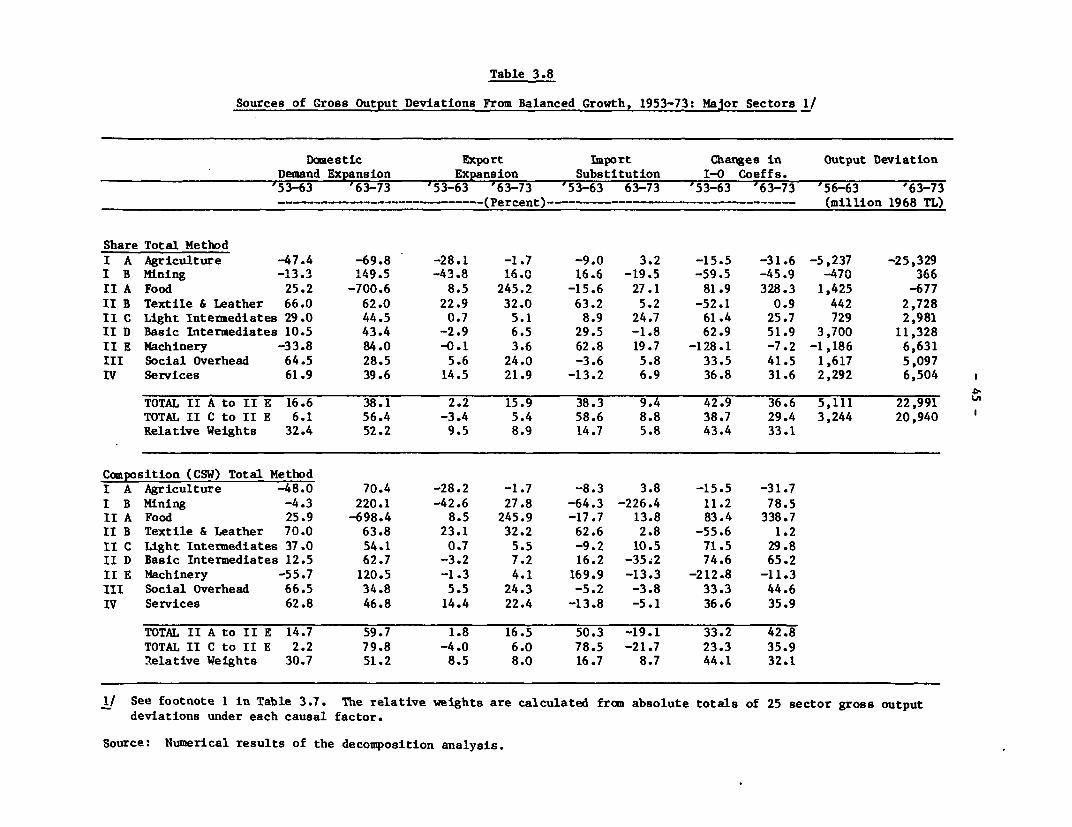
Table 3.8
Sources of Gross Output Deviations From Balanced Growth, 1953-73: Major Sectors 1/
Domestic Export Import Changes in Output DeviationDemand Expansion Expansion Substitution I-0 Coeffs.
'53-63 '63-73 '53-63 '63-73 '53-63 63-73 '53-63 '63-73 '56-63 '63-73___ ___ _-------- - …(Percent) - - - ---------… -…(million 1968 TL)
Share Total MethodI A Agriculture -47.4 -69.8 -28.1 -1.7 -9.0 3.2 -15.5 -31.6 -5,237 -25,329
I B Mining -13.3 149.5 -43.8 16.0 16.6 -19.5 -59.5 -45.9 -470 366
II A Food 25.2 -700.6 8.5 245.2 -15.6 27.1 81.9 328.3 1,425 -677
II B Textile & Leather 66.0 62.0 22.9 32.0 63.2 5.2 -52.1 0.9 442 2,728
II C Light Intermediates 29.0 44.5 0.7 5.1 8.9 24.7 61.4 25.7 729 2,981
II D Basic Intermediates 10.5 43.4 -2.9 6.5 29.5 -1.8 62.9 51.9 3,700 11,328
II E Machinery -33.8 84.0 -0.1 3.6 62.8 19.7 -128.1 -7.2 -1,186 6,631
III Social Overhead 64.5 28.5 5.6 24.0 -3.6 5.8 33.5 41.5 1,617 5,097
IV Services 61.9 39.6 14.5 21.9 -13.2 6.9 36.8 31.6 2,292 6,504
TOTAL II A to II E 16.6 38.1 2.2 15.9 38.3 9.4 42.9 36.6 5,111 22,991 ;
TOTAL II C to II E 6.1 56.4 -3.4 5.4 58.6 8.8 38.7 29.4 3,244 20,940
Relative Weights 32.4 52.2 9.5 8.9 14.7 5.8 43.4 33.1
Composition (CSW) Total MethodI A Agriculture -48.0 70.4 -28.2 -1.7 -8.3 3.8 -15.5 -31.7
I B Mining -4.3 220.1 -42.6 27.8 -64.3 -226.4 11.2 78.5II A Food 25.9 -698.4 8.5 245.9 -17.7 13.8 83.4 338.7
II B Textile & Leather 70.0 63.8 23.1 32.2 62.6 2.8 -55.6 1.2
II C Light Intermediates 37.0 54.1 0.7 5.5 -9.2 10.5 71.5 29.8
II D Basic Intermediates 12.5 62.7 -3.2 7.2 16.2 -35.2 74.6 65.2
II E Machinery -55.7 120.5 -1.3 4.1 169.9 -13.3 -212.8 -11.3
III Social Overhead 66.5 34.8 5.5 24.3 -5.2 -3.8 33.3 44.6
IV Services 62.8 46.8 14.4 22.4 -13.8 -5.1 36.6 35.9
TOTAL II A to II E 14.7 59.7 1.8 16.5 50.3 -19.1 33.2 42.8
TOTAL II C to II E 2.2 79.8 -4.0 6.0 78.5 -21.7 23.3 35.9
Relative Weights 30.7 51.2 8.5 8.0 16.7 8.7 44.1 32.1
1/ See footnote 1 in Table 3.7. The relative weights are calculated from absolute totals of 25 sector gross output
deviations under each causal factor.
Source: Numerical results of the decomposition analysis.
- 46 -
f or 47 and 70 percent of the negative deviations in agricultural gross output
.in 1953-63 and 1963-73, respectively. This factor alone explains 56 percent
of the large positive deviations observed in manufacturing (excluding food and
textiles) during 1963-73. These trends in nonproportional growth were further
strengthened by the effects from technological change, which caused negative
output deviations in agriculture, and generally positive deviations in
manufacturing subsectors. The combined deviation effects of domestic final
demand and technological change were also dominant in the differential growth
of social overhead and services. The latter two sectors experienced important
structural change contributions from export expansion in 1963-73. This mainly
reflected the effects of the export boom of the early 1970s.
The disaggregated estimates in Table 3.8 also indicate that import
substitution was a sizable source of nonproportional growth in manufacturing
in 1953-63. It accounted for 59 percent of the gross output deviations in
manufacturing (excluding food and textiles) in the early period. This trend
continued in 1963-68, but was reversed in 1968-73. The chained measures
attribute about 9 percent of the total manufacturing output deviation to the
import substitution process in 1963-73. In contrast, the nonproportional
growth of exports had a negligible impact on the compositional changes in
manufacturing output in 1953-63, but accounted for nearly 16 percent of the
gross output deviations in total manufacturing in 1963-73, with particularly
pronounced effects in the food and textile groups.
According to the analysis, the nonproportional expansion of domestic
final demand and the changes in input-output coefficients were the two major
sources of structural change in gross output. The changing composition of
domestic final demand with rising national income was not a straight-forward
process in 1953-73, but represented the combined effects of four main
- 47 -
factors: (1) differential growth of investment and consumption expenditures,
which resulted in a faster expansion of demand for investment goods; (2)
increasing proportions of machinery and equipment in fixed investment, which
were due to shifting patterns of investment by sector of destination
(particularly in 1963-73); (3) non-uniform income elasticities of consumer
demand, which produced the typical decline in the share of agriculture and
food, with a corresponding rise in the shares of manufactures and services (at
varying speeds in urban and rural areas); and (4) a faster rise in public
consumption than in private consumption, resulting in the disproportionate
increase of the share of public services in aggregate demand. To underline
the broad shifts in the structure of domestic final demand, the orders of
magnitude of the implied expenditure elasticities of demand for major
categories of goods and services have been compared as follows:_/
1953-63 1963-73 1953-73
Agriculture and Food 0.83 0.30 0.46Textiles and Clothing 1.07 1.04 1.06Other Manufactures 0.93 2.67 2.06Social Overhead 1.12 1.15 1.14Services 1.15 1.11 1.16
In addition, the nature of the effects of technological change
appear to be somewhat different from those observed in countries with limited
supplies of natural resources, like Japan and Korea. In the industrialization
of such countries, the major contribution of technological change has been to
substitute limited local primary inputs with manufactured goods and thus to
1/ These are not the Engel elasticities of private consumer demand, but theimplied expenditure elasticities of total domestic final demand. Theelasticities for agriculture and services would have been higher ifrelative price effects were to be considered (see Chapter 4.E). Thefluctuatingvvalues of stock changes in agriculture also had an effect onthe observed elasticities for agriculture and food.
- 48 -
reduce dependence on primary imports,./
In the Turkish case, changes in input-output coefficients do not
reflect primarily a similar major effort to replace imported primary products
by fabricated goods. Rather, three broad elements are represented:
(1) Changes in the intra-sectoral product flows of the agriculture-
livestock-food complex (e.g., less animal service, more processed feed for
livestock, and higher stages of food processing which require proportionally
less agricultural input);
(2) The introduction of new techniques and intermediate products
into various major sectors (e.g., petroleum products for transport and energy,
and chemicals for agriculture and new materials for construction); and
(3) The widening of the range within which electricity, transport,
trade and services are used as intermediate inputs.
In addition to these three factors, the effects of input
substitution that result in reduced demand for primary products (such as, for
example, increased use of synthetic fibers in the textile sector) have also
been noticeable in certain sectors. Although the sources of growth models
track down the effects of technological change in the process of non-
proportional expansion, they generate no quantitative information on the
relative influences of a variety of factors that cause changes in input-output
coefficients.
F. Sources of Growth Patterns in Manufacturing Industries
For a more detailed examination of the pattern of expansion in
manufacturing, Table 3.9 provides disaggregated estimates for the sources of
gross output growth at the level of individual industries. These estimates
1/ See Chenery and Watanabe (1975).
- 49 -
are in first difference terms, and derived under the share total method for
1953-63 and 1963-73.
As the estimates in Table 3.9 show, domestic final demand expansion
was a predominant source of growth in all individual industries during the
entire period. The growth contribution of this factor was relatively higher
in machinery and textiles, lower in basic intermediates, and close to average
in light intermediate industries. In contrast, technological effects
contributed strongly to basic intermediates, moderately to light Intermediates
and food processing, and negatively to textiles and machinery group during
their expansion.
The observed pattern of import substitution in 1953-63 indicates
that this factor was a significant source of growth. Relative contributions
exceeded 20 percent in the early stages of development of a number of
industries such as non-metallic products (cement, glass, etc.), petroleum
refining, basic metals and machinery products (mainly, non-electrical).
Import substitution also contributed positively (about 8 percent) to the
output growth in textiles and rubber products. From 1963-73, the role of
import substitution as a source of growth was reduced in machinery output (12
percent), and turned negative in basic intermediates taken as a group (-1
percent). Notwithstanding the generally declining trend in import
substitution for manufacturing as a whole, the growth effects of this factor
were moderately improved in paper (11 percent), rubber (18 percent), and
transport equipment (11 percent). In both ten-year period, chemicals had
negative growth contribution from import substitution.
In 1953-63, export expansion was an insignificant source of output
growth in all manufacturing branches (with the minor exception of leather
products). In the latter decade (especially in 1968-73), its substantially
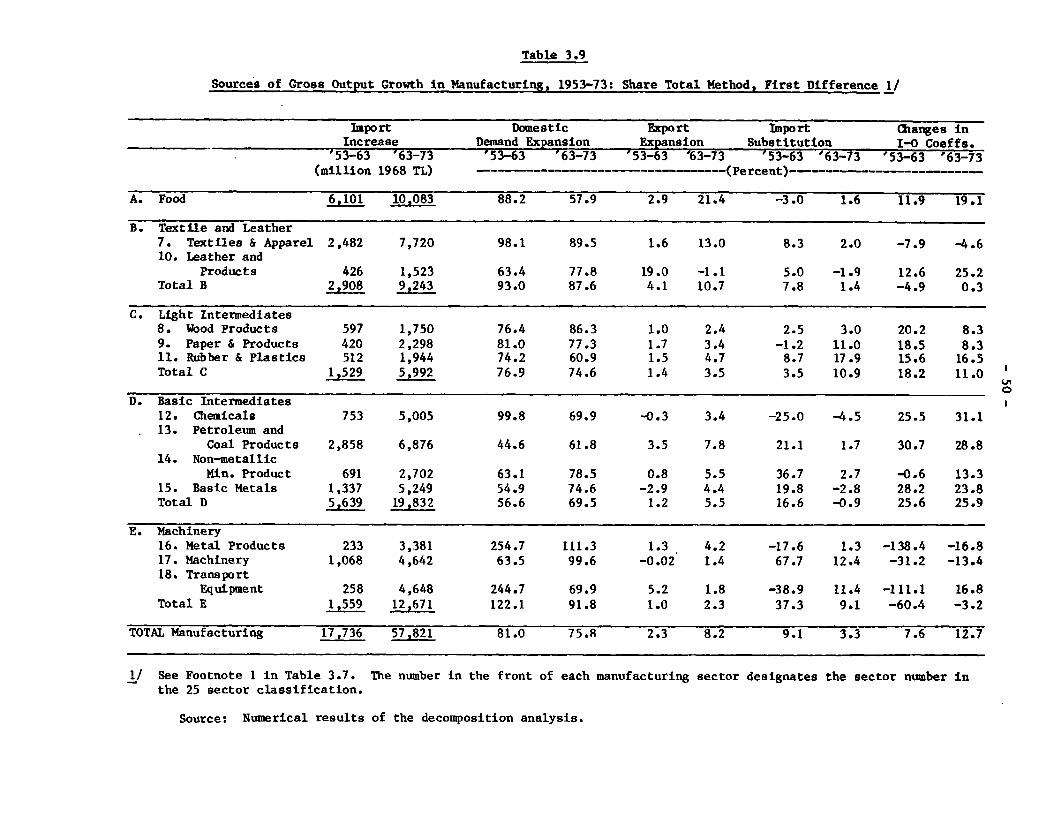
Table 3.9
Sources of Gross Output Growth in Manufacturing, 1953-73: Share Total Method, First Difference 1/
Import Domestic Export Import Changes inIncrease Demand Expansion Expansion Substitution I-0 Coeffs.
'53-63 '63-73 '53-63 '63-73 '53-63 '63-73 '53-63 '63-73 '53-63 '63-73(million 1968 TL) -------------- (Perent)- - --
A. Food 6,101 10.083 88.2 57.9 2.9 21.4 -3.0 1.6 11.9 19.1
B. Textile and Leather7. Textiles & Apparel 2,482 7,720 98.1 89.5 1.6 13.0 8.3 2.0 -7.9 -4.610. Leather and
Products 426 1,523 63.4 77.8 19.0 -1.1 5.0 -1.9 12.6 25.2Total B 2,908 9,243 93.0 87.6 4.1 10.7 7.8 1.4 -4.9 0.3
C. Light Intenmediates8. Wood Products 597 1,750 76.4 86.3 1.0 2.4 2.5 3.0 20.2 8.39. Paper & Products 420 2,298 81.0 77.3 1.7 3.4 -1.2 11.0 18.5 8.311. Rubber & Plastics 512 1,944 74.2 60.9 1.5 4.7 8.7 17.9 15.6 16.5Total C 1,529 5,992 76.9 74.6 1.4 3.5 3.5 10.9 18.2 11.0 Q
D. Basic Intermediates12. Chemicals 753 5,005 99.8 69.9 -0.3 3.4 -25.0 -4.5 25.5 31.113. Petroleum and
Coal Products 2,858 6,876 44.6 61.8 3.5 7.8 21.1 1.7 30.7 28.814. Non-metallic
Min. Product 691 2,702 63.1 78.5 0.8 5.5 36.7 2.7 -0.6 13.315. Basic Metals 1,337 5,249 54.9 74.6 -2.9 4.4 19.8 -2.8 28.2 23.8Total D 5,639 19,832 56.6 69.5 1.2 5.5 16.6 -0.9 25.6 25.9
E. Machinery16. Metal Products 233 3,381 254.7 111.3 1.3 4.2 -17.6 1.3 -138.4 -16.817. Machinery 1,068 4,642 63.5 99.6 -0.02 1.4 67.7 12.4 -31.2 -13.418. Transport
Equipment 258 4,648 244.7 69.9 5.2 1.8 -38.9 11.4 -111.1 16.8Total E 1,559 12,671 122.1 91.8 1.0 2.3 37.3 9.1 -60.4 -3.2
TOTAL Manufacturing 17,736 57.821 81.0 75.8 2.3 8.2 9.1 3.3 7.6 12.7
1/ See Footnote 1 in Table 3.7. The number in the front of each manufacturing sector designates the sector number inthe 25 sector classification.
Source: Numerical results of the decomposition analysis.
- 51 -
enhanced role was observed in the aggregate analysis. The small positive
contributions of export expansion noted in the growth of chemicals, petroleum
refining, basic metals, rubber and paper products during 1963-73 were mainly
due to intermediate demand effects of export growth in agriculture, food and
textiles. In turn, the positive export growth contributions observed in non-
metallics and metal products largely represented the direct effects of export
expansion in these individual subsectors. The industry breakdown of the
growth contributions of exports in the latter period reflects Turkey's
comparative advantage in food, textiles and apparels, non-metallic mineral
products, and selective items in basic metals and metal fabricating branches,
which use semi-skilled labor. 1/
Sectoral analysis of the sources of growth within manufacturing
indicates contrasting patterns of import substitution and technological change
in the basic intermediates and machinery groups. The substantial early
contribution of import substitution to output growth in basic intermediates
declined over time, whereas technological change continued to have a
relatively large role in their expansion, particularly in the case of
chemicals. In turn, machinery and related products had more favorable import
substitutinn effects in their growth process, while experiencing generally
negative contributions from changes in input-output coefficients (except
transport equipment in 1963-73). The sustained growth effects of
technological change in basic intermediates, especially in chemicals,
underscores the continuing process of technological innovations and/or input
substitution in the production structure. The latter process had important
1/ See Krueger (1974). The solutions of an optimizing multi-sectoral modelfor the 1972-80 perLod also provide a similar pattern of comparativeadvantage in Celasun (1974).
- 52 -
implications for the growth of intermediate goods imports throughout the
period, as shown in Table 3.10.
G. Sources of Import Growth by Commodity
Tables 3.10 and 3.11 present estimates for the sources of import
growth by commodity (i.e., by sector of origin) during 1953-73 in aggregated
and disaggregated first difference terms, respectively. These estimates,
which have been derived under the share method, provide a complementary
perspective to the sectoral growth patterns.
The aggregated direct measures listed in Table 3.10 indicate that
intermediate demand expansion alone accounted for 60 percent of the import
growth in 1953-63 and 1963-73. For the entire period 1953-73, 72 percent of
import growth induced by intermediate demand expansion was attributed to
domestic f-nal demand factor; 20 percent to technological change; and about 8
percent to export expansion and import substitution.
In aggregate terms, the relative contributions of export expansion
and import substitution to the growth of total imports were 2.8 and -26.4
percent, respectively, in 1953-73. These figures reveal the exceedingly low
import intensity of Turkey's export-oriented production, as well as the large
extent to which trade adjustment policies relied on import substitution to
achieve balance in the external sector, especially under the semi-closed
development strategy of the 1953-68 period.1 1 In the semi-open period of
1968-73, import substitution contributed positively (6 percent) to the growth
of imports.
The sectora-l breakdown of the total measures for the sources of
1/ In the case of Korea during 1955-73, the comparable measures estimated byKim (1978) for export expansion and import substitution as sources ofimport growth (by commodity) were 32.7 and -0.4 percent, respectively.
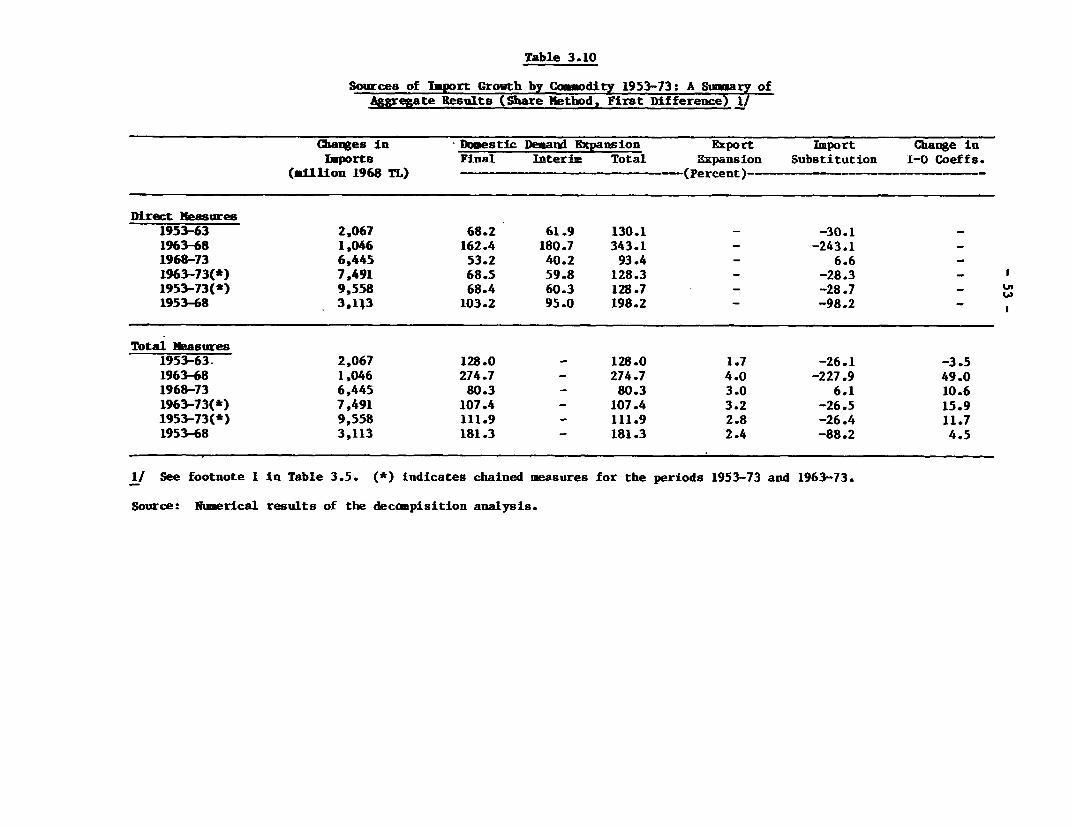
Table 3.10
Sources of Import Growth by Commodity 1953-73: A Summary ofAggregate Results (Share Method, First Difference) 1/
Changes in Domestic Demand Expansion Export Import Change inImports Final ITteria Total Expansion Substitution 1-0 Coeffs.
(million 1968 TL) -(Percent)----
Direcet Ieasures1953-63 2,067 68.2 61.9 130.1 - -30.1 -1963-68 1,046 162.4 180.7 343.1 - -243.1 -1968-73 6,445 53.2 40.2 93.4 - 6.6 -1963-73(*) 7,491 68.5 59.8 128.3 - -28.3 -1953-73(*) 9,558 68.4 60.3 128.7 - -28.7 -1953-68 3,113 103.2 95.0 198.2 - -98.2 -
Total Measures1953-63. 2,067 128.0 - 128.0 1.7 -26.1 -3.51963-68 1,046 274.7 - 274.7 4.0 -227.9 49.01968-73 6,445 80.3 - 80.3 3.0 6.1 10.61963-73(*) 7,491 107.4 - 107.4 3.2 -26.5 15.91953-73(*) 9,558 111.9 - 111.9 2.8 -26.4 11.71953-68 3,113 181.3 - 181.3 2.4 -88.2 4.5
1/ See footnote 1 in Table 3.5. (*) indicates chained measures for the periods 1953-73 and 1963-73.
Source: Numerical results of the decompisition analysis.
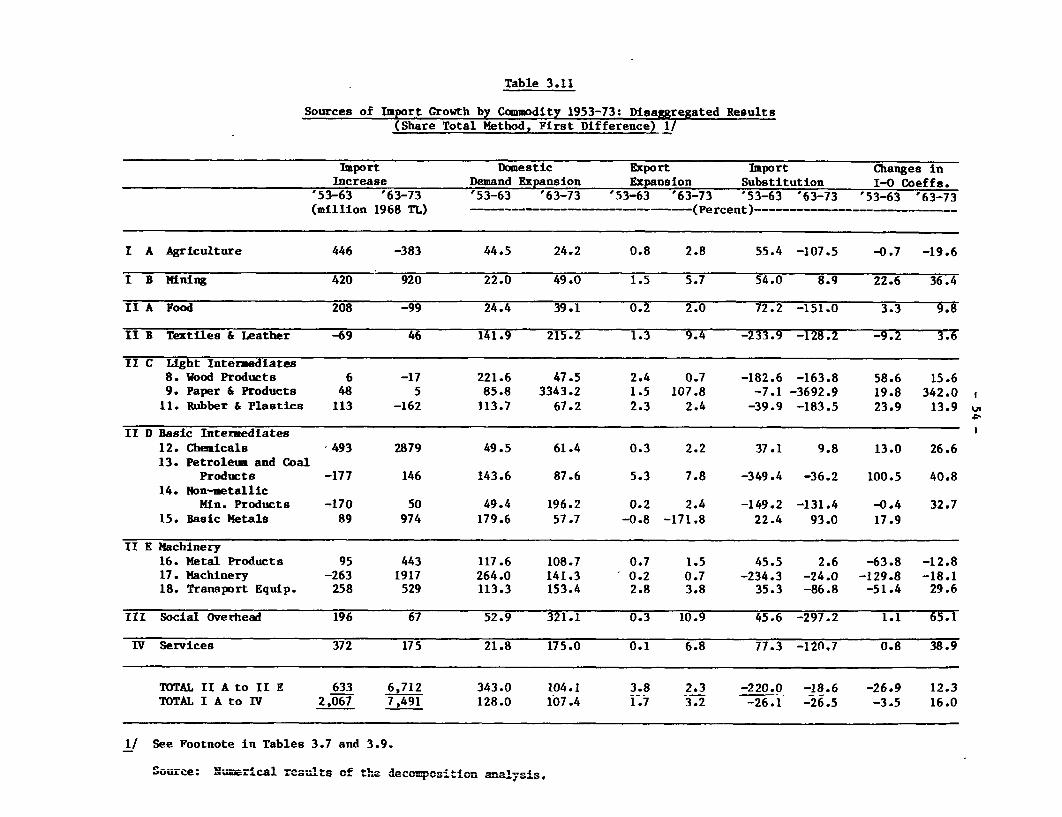
Table 3.11
Sources of Import Growth by Commodity 1953-73: Disaggregated Results(Share Total Method, First Difference) 1/
Import Domestic Export Import Changes inIncrease Demand Expansion Expansion Substitution I-0 Coeffs.
'53-63 '63-73 '53-63 '63-73 '53-63 '63-73 '53-63 '63-73 '53-63 '63-73(million 1968 TL) ----------------- (Percent)------------------ …
I A Agriculture 446 -383 44.5 24.2 0.8 2.8 55.4 -107.5 -0.7 -19.6
I B Mining 420 920 22.0 49.0 1.5 5.7 54.0 8.9 22.6 36.4
II A Food 208 -99 24.4 39.1 0.2 2.0 72.2 -151.0 3.3 9.8
II B Textiles & Leather -69 46 141.9 215.2 1.3 9.4 -233.9 -128.2 -9.2 3.
II C Light Intermediates8. Wood Products 6 -17 221.6 47.5 2.4 0.7 -182.6 -163.8 58.6 15.69. Paper & Products 48 5 85.8 3343.2 1.5 107.8 -7.1 -3692.9 19.8 342.0
11. Rubber & Plastics 113 -162 113.7 67.2 2.3 2.4 -39.9 -183.5 23.9 13.9 tn
II D Basic Intermediates12. Chemicals 493 2879 49.5 61.4 0.3 2.2 37.1 9.8 13.0 26.613. Petroleum and Coal
Products -177 146 143.6 87.6 5.3 7.8 -349.4 -36.2 100.5 40.814. Non-metallic
Min. Products -170 50 49.4 196.2 0.2 2.4 -149.2 -131.4 -0.4 32.715. Basic Metals 89 974 179.6 57.7 -0.8 -171.8 22.4 93.0 17.9
II E Machinery16. Metal Products 95 443 117.6 108.7 0.7 1.5 45.5 2.6 -63.8 -12.817. Machinery -263 1917 264.0 141.3 0.2 0.7 -234.3 -24.0 -129.8 -18.118. Transport Equip. 258 529 113.3 153.4 2.8 3.8 35.3 -86.8 -51.4 29.6
III Social Overhead 196 67 52.9 321.1 0.3 10.9 45.6 -297.2 1.1 65.1
IV Services 372 175 21.8 175.0 0.1 6.8 77.3 -120.7 0.8 38.9
TOTAL II A to II E 633 6,712 343.0 104.1 3.8 2.3 -220.0 -18.6 -26.9 12.3TOTAL I A to IV 2,067 7,491 128.0 107.4 1.7 3.2 -26.1 -26.5 -3.5 16.0
1/ See Footnote in Tables 3.7 and 3.9.
Sou-Lce; Nmari=cal reau-lts of the decornposition analysis.
- 55 -
import growth during 1953-63 and 1963-73 provides further insight into the
reduced role of import substitution in restraining the growth of manufactured
imports in the latter decade. The relative contribution of import substitu-
tion to the increment in total manufactured imports changed from -220 percent
in 1953-63 to -19 percent in 1963-73. In turn, technological change accounted
for -27 and +12 percent of the rise in total manufactured imports in these two
successive ten-year periods. In particular, the rapid increase in the
relative contributions of domestic demand and technological change to the
expansion of mining imports (including crude oil), chemicals imports
(including fertilizers), and basic metals imports (mainly semi-finished steel
products) in 1963-73 reflected the growing import intensity of the changing
product mix and input structures in the economy. In the aftermath of the 1973
oil crisis, these structural trends in mineral and basic intermediates imports
continued, and led to a foreign exchange bottleneck in the late 1970s in the
absence of internal adjustment measures.
The predominant role of domestic demand in import increases, and
general import-replacing nature of technological change is shown by the
decomposition of imports in the machinery and related industries. However, in
the case of the transport equipment industry, which experienced rapid growth
in output toward the end of the period, technological change contributed
positively to import increases from 1963-73, while import substitution effects
were negative, as expected. Expressed in another way, the decline in the
share of competitive imports in the total supply of this industry was
associated with a considerable increase in intra-industry flows, which, in
turn, led to the rapid expansion of semi-finished product imports in 1963-73,
- 56 -
particularly in road transport equipment and passenger car production. l/
H. Decomposition of Value Added
Table 3.12 presents the decomposition measures for value added by
major sectors for 1963-73. 3. These measures have been derived under the
share method in first difference and deviation terms by chaining the results
obtained for the 1963-68 and 1968-73 subperiods.
An additional cause of change in the productive structure, namely
the change in value added coefficients, is examined in the decomposition of
value added. This factor produced negative growth effects in all major
sectors except agriculture and social overhead. Compared to the results of
the decomposition of gross output, the relative contributions of domestic
final demand expansion, technological change and import substitution are
greater as sources of growth of value added, offsetting the growth-reducing
effects of changes in value added parameters.
The relative role of exports in the decomposition of gross output
and value added is essentially the same. The notable difference is only in
food processing. In its nonproportional expansion, export growth accounted
for 102 and 245 percent of the deviations in value added and gross output,
respectively, with corresponding differences in the negative contribution of
domestic final demand. This different pattern indicates the lower stages of
processing carried out for agricultural commodities such as tobacco and dried
fruits before they head for export markets.
The earlier conclusion that import substitution was a more
1/ The transport equipment industry's own input-output coefficient increasedfrom 0.056 in 1963 to 0.230 in 1973 in constant 1968 prices.
2/ The value added figures include indirect taxes on sectoral output andimports according to the definitions given in Appendix 2.B.
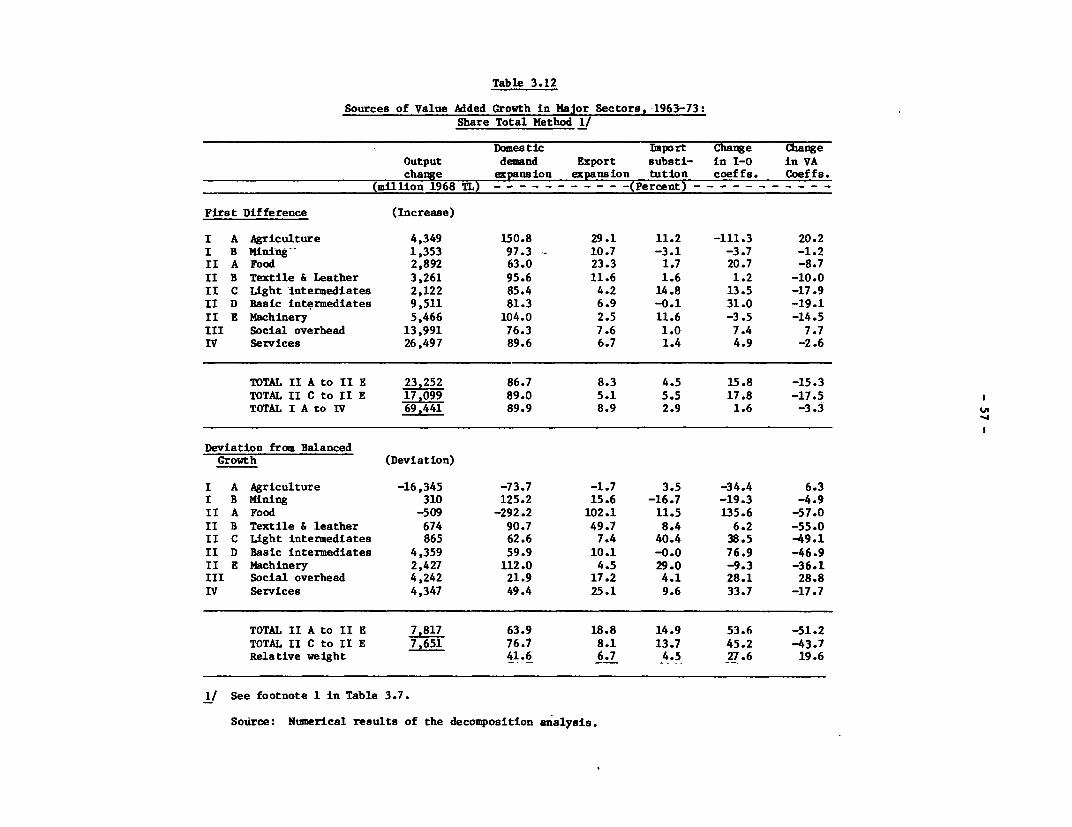
Table 3.12
Sources of Value Added Growth in Major Sectors, 1963-73:Share Total Method 1/
Domestic Tmport Change ChangeOutput demand Export substi- in I-0 in VAchange expansion expansion tution coeffs. Coeffs.
(million 1968 TL) (Percent - - - - - - - - - - -
First Difference (Increase)
I A Agriculture 4,349 150.8 29.1 11.2 -111.3 20.2I B Mining~ 1,353 97.3 10.7 -3.1 -3.7 -1.2II A Food 2,892 63.0 23.3 1.7 20.7 -8.7II B Textile & Leather 3,261 95.6 11.6 1.6 1.2 -10.0II C Light intermediates 2,122 85.4 4.2 14.8 13.5 -17.9II D Basic intermediates 9,511 81.3 6.9 -0.1 31.0 -19.1II E Machinery 5,466 104.0 2.5 11.6 -3.5 -14.5III Social overhead 13,991 76.3 7.6 1.0 7.4 7.7IV Services 26,497 89.6 6.7 1.4 4.9 -2.6
TOTAL II A to II E 23,252 86.7 8.3 4.5 15.8 -15.3TOTAL II C to II E 17,099 89.0 5.1 5.5 17.8 -17.5TOTAL I A to IV 69,441 89.9 8.9 2.9 1.6 -3.3
Deviation from BalancedGrowth (Deviation)
I A Agriculture -16,345 -73.7 -1.7 3.5 -34.4 6.3I B Mining 310 125.2 15.6 -16.7 -19.3 -4.9II A Food -509 -292.2 102.1 11.5 135.6 -57.0II B Textile & leather 674 90.7 49.7 8.4 6.2 -55.0II C Light intermediates 865 62.6 7.4 40.4 38.5 -49.1II D Basic intermediates 4,359 59.9 10.1 -0.0 76.9 -46.9II E Machinery 2,427 112.0 4.5 29.0 -9.3 -36.1III Social overhead 4,242 21.9 17.2 4.1 28.1 28.8IV Services 4,347 49.4 25.1 9.6 33.7 -17.7
TOTAL II A to II E 7,817 63.9 18.8 14.9 53.6 -51.2TOTAL II C to II E 7,651 76.7 8.1 13.7 45.2 -43.7Relative weight 41.6 6.7 4.5 27.6 19.6
1/ See footnote 1 in Table 3.7.
Source: Numerical results of the decomposition analysis.
- 58 -
significant source of structural change than growth in manufacturing is
supported by the results of the decomposition of value added. The sectoral
measures shown in Table 3.12 also illustrate the reverse roles of import
substitution and technological change in the development of machinery and
basic intermediates (especially chemicals), as discussed above in the context
of gross output changes.
I. Sources of Turkish Industrialization in the Light of Experience
Elsewhere: An Overview
The empirical analysis presented in the preceding parts of Chapter 3
provides extensive estimates for the sources of Turkish industrialization,
which was characterized by a significant nonproportional growth of
manufacturing production in 1953-73. The various components of the sources of
growth analysis clearly indicate the predominant effects of domestic final
demand and technological change in Turkey's past industrialization process.
These factors were complemented somewhat by import substitution in 1953-68,
and by export expansion in 1968-73. The increased role of exports in 1968-73
is attributed both to shifts in trade and exchange rate policies and to more
favorable external factors in the early 1970s. Table 3.13 gives a summary of
the first difference measures obtained from the decomposition of gross output,
imports (by commodity) and value added in total manufacturing. Estimates for
the sources of employment expansion for manufacturing are listed to show the
basic similarity of the factors that affected the various aspects of growth in
this sector 1/
To compare the Turkish experience in industrialization with the
seven other countries in this series, two additional tables have been compiled
1/ See Chapter 4 for a more detailed analysis.
- 59 -
(under the share method).1/ Table 3.14 provides estimates for the sources of
nonproportional growth of manufacturing as percentages of the increase in
total gross output in individual economies over comparable sample periods of
ten to twenty years. Turkey experienced the highest relative contributions of
domestic final demand (5.6 percent) and technological change (6.2 percent) to
the manufacturing gross output deviation from balanced growth among the eight
countries studied. The narrow role of export expansion was observed not only
in Turkey, but also in Colombia and Mexico, which experienced substantially
larger effects of import substitution as well. Export expansion as a source
of differential growth of manufacturing was most pronounced in Korea and
Taiwan, where the growth rates of manufacturing output were also the highest
among the eight countries.
In turn, Table 3.15 gives the measures for the sources of
manufacturing gross output increases in terms of percentages of the increment
in this sector's gross output at various times. These estimates support the
results listed in Table 3.14. Moreover, the pronounced shifts observed in the
sources of growth patterns over time in Japan, Korea, Taiwan and Israel
suggest that the switching from import substitution to export orientation in
the course of industrial development was successful. Compared to Korea,
Taiwan and Israel, the inward-oriented phase of manufacturing growth was too
prolonged in Turkey. One result was a highly protected industrial structure,
which relied heavily on the imports of intermediate goods.
Turkey's industrialization pattern in 1953-73 substantially supports
the theory of "balanced growth," which attempts to explain the structural
1/ See Kubo and Robinson (1979) for a more comprehensive comparative analysisof the sources of growth in these eight countries.
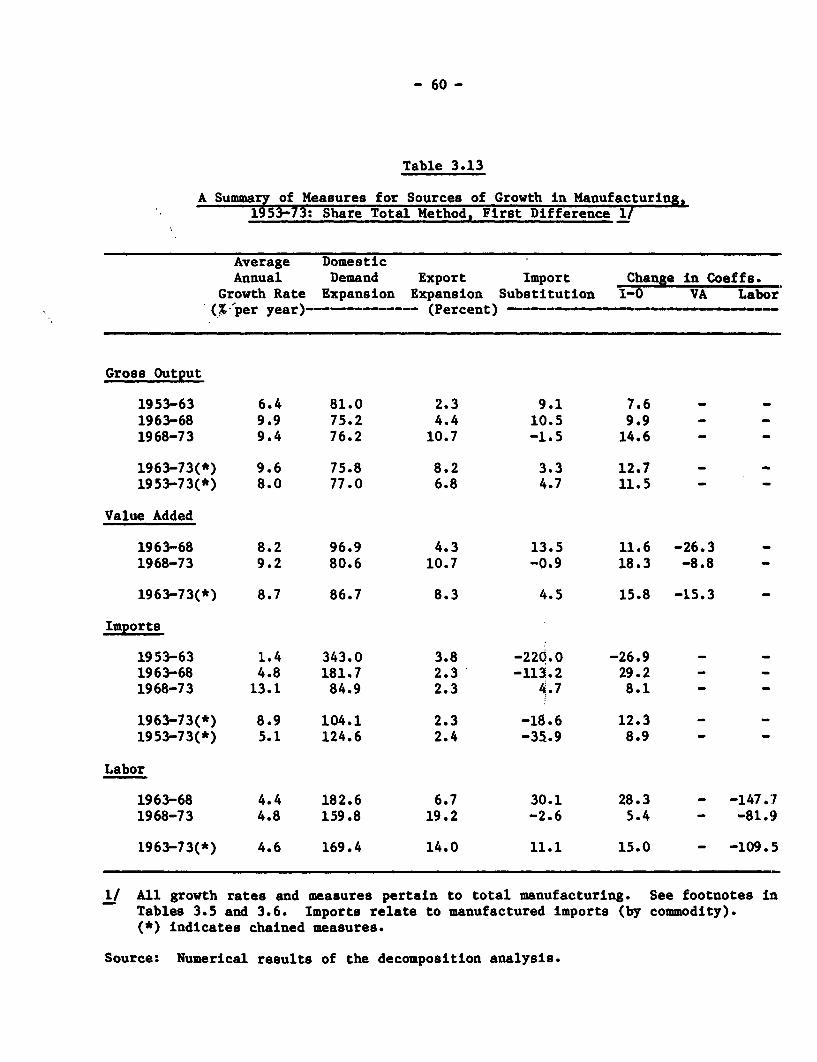
- 60 -
Table 3.13
A Summary of Measures for Sources of Growth in Manufacturing,1953-73: Share Total Method, First Difference 1/
Average DomesticAnnual Demand Export Import Change in Coeffs.
Growth Rate Expansion Expansion Substitution I-0 VA Labor(X per year)- ---- --- (Percent)
Gross Output
1953-63 6.4 81.0 2.3 9.1 7.6 - -
1963-68 9.9 75.2 4.4 10.5 9.9 - -
1968-73 9.4 76.2 10.7 -1.5 14.6 - -
1963-73(*) 9.6 75.8 8.2 3.3 12.7 - -
1953-73(*) 8.0 77.0 6.8 4.7 11.5 - -
Value Added
1963-68 8.2 96.9 4.3 13.5 11.6 -26.3 -
1968-73 9.2 80.6 10.7 -0.9 18.3 -8.8 -
1963-73(*) 8.7 86.7 8.3 4.5 15.8 -15.3 -
Imports
1953-63 1.4 343.0 3.8 -220.0 -26.9 - -
1963-68 4.8 181.7 2.3 -113.2 29.2 - -
1968-73 13.1 84.9 2.3 4.7 8.1 - -
1963-73(*) 8.9 104.1 2.3 -18.6 12.3 - -
1953-73(*) 5.1 124.6 2.4 -35.9 8.9 - -
Labor
1963-68 4.4 182.6 6.7 30.1 28.3 - -147.71968-73 4.8 159.8 19.2 -2.6 5.4 - -81.9
1963-73(*) 4.6 169.4 14.0 11.1 15.0 - -109.5
1/ All growth rates and measures pertain to total manufacturing. See footnotes inTables 3.5 and 3.6. Imports relate to manufactured imports (by commodity).(*) indicates chained measures.
Source: Numerical results of the decomposition analysis.

- 61 -
Table 3.14
Sources of Manufacturing Gross Output Deviationfrom Balanced Growth: An Inter-Country Comparison
(Based on Share Total Method, Deviation)1/
Average Domestic ImportMan. Output Output Demand Export Substi- Change inGrowth Rate Deviation Expansion Expansion tution I-0 Coeffs.(X per year) ---------- -(Percent)----------
Colombia (1953-70) 8.1 16.1 1.4 1.4 7.8 5.6Israel (1958-68) 12.3 6.8 -2.7 7.5 -0.6 2.5Japan (1955-70) 13.3 12.6 5.0 2.8 -1.2 5.9Korea (1955-73) 15.8 27.4 4.7 21.1 1.4 0.2Mexico (1950-75) 7.7 10.1 3.5 -0.2 4.3 2.5Norway (1953-69) 5.2 7.8 -1.6 12.6 -9.2 6.0Taiwan (1956-71) 16.2 28.2 0.7 20.1 3.5 3.9Turkey (1953-73) 8.0 16.4 5.6 2.2 2.4 6.2
1/ Manufacturing gross output deviations and the sources measures areexpressed as percentages of the increment in aggregate gross output overall sectors in with columns 3-6 adding up to column 2.
Source (for countries other than Turkey): Kubo and Robinson (1979).
change in output mainly in terms of the compositional shifts in domestic
demand over time. The Turkish case closely corresponds to the "semi-closed"
large country prototype defined by Chenery in his empirical investigation of
the industrialization process in terms of typical patterns. 1/ However, the
limited export effects observed in the Turkish industrialization experience
cannot be explained solely in terms of low price and income elasticities of
demand for exports, as suggested by the proponents of the balanced growth
theory, but are caused mainly by the large size of the domestic markets,
diversity of natural resources, initial political conditions, and structure of
1/ See Chenery (1979, Chapter 3) for a recapitulation of the theory of"balanced growth," and an extensive analysis of typical patterns inindustrial growth and structural change.
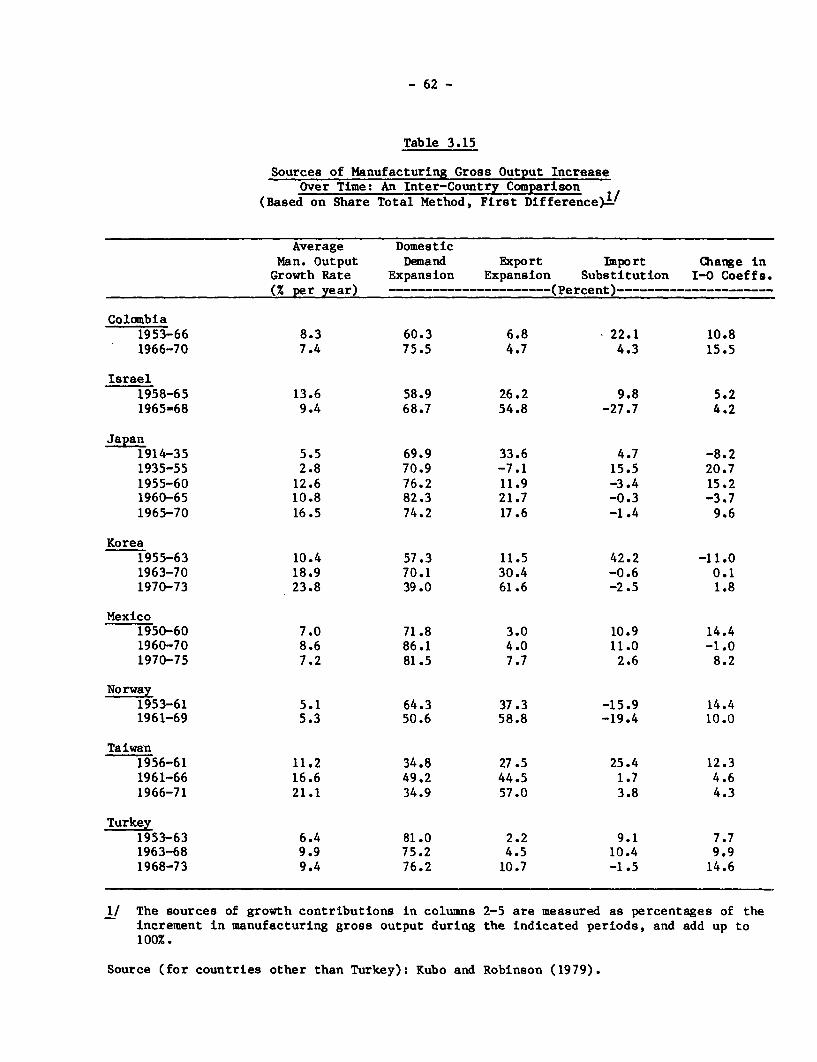
- 62 -
Table 3.15
Sources of Manufacturing Gross Output IncreaseOver Time: An Inter-Country Comparison 1
(Based on Share Total Method, First Difference)_
Average DomesticMan. Output Demand Export Import Change in
Growth Rate Expansion Expansion Substitution 1-0 Coeffs.(% per year) ----------------------(Percent)---------------------
Colombia1953-66 8.3 60.3 6.8 - 22.1 10.81966-70 7.4 75.5 4.7 4.3 15.5
Israel1958-65 13.6 58.9 26.2 9.8 5.21965-68 9.4 68.7 54.8 -27.7 4.2
Japan1914-35 5.5 69.9 33.6 4.7 -8.21935-55 2.8 70.9 -7.1 15.5 20.71955-60 12.6 76.2 11.9 -3.4 15.21960-65 10.8 82.3 21.7 -0.3 -3.71965-70 16.5 74.2 17.6 -1.4 9.6
Korea1955-63 10.4 57.3 11.5 42.2 -11.01963-70 18.9 70.1 30.4 -0.6 0.11970-73 23.8 39.0 61.6 -2.5 1.8
Mexico1950-60 7.0 71.8 3.0 10.9 14.41960-70 8.6 86.1 4.0 11.0 -1.01970-75 7.2 81.5 7.7 2.6 8.2
Norway1953-61 5.1 64.3 37.3 -15.9 14.41961-69 5.3 50.6 58.8 -19.4 10.0
Taiwan1956-61 11.2 34.8 27.5 25.4 12.31961-66 16.6 49.2 44.5 1.7 4.61966-71 21.1 34.9 57.0 3.8 4.3
Turkey1953-63 6.4 81.0 2.2 9.1 7.71963-68 9.9 75.2 4.5 10.4 9.91968-73 9.4 76.2 10.7 -1.5 14.6
1/ The sources of growth contributions in columns 2-5 are measured as percentages of theincrement in manufacturing gross output during the indicated periods, and add up to100%.
Source (for countries other than Turkey): Kubo and Robinson (1979).
- 63 -
incentives, as discussed briefly in Chapter 6.
Finally, the comparatively moderate contribution of import
substitution to industrial growth was primarily due to the relatively small
proportions of imports in total domestic demand initially (as clearly
indicated in the analysis of the cross-country norms in Chapter 2). While the
effects of import substitution on the process of growth and structural change
in production were only moderate, its role as a trade adjustment mechanism was
substantial, according to the decomposition of import growth, particularly in
1953-63 and 1963-68. (For example, see the sources of growth of manufactured
imports in Table 3.13). The effects of export expansion and import
substitution on the patterns of factor allocation are examined in Chapter 4.
- 64 -
4. SOURCES OF CHANGES in FACTOR USES AND
RELATIVE PRICES
Despite the relatively rapid growth of the manufacturing sector,
Turkey's structural transition was not accompanied by sufficient increases in
employment. Employment opportunities in Western Europe for Turkish workers in
the 1960s and early 1970s eased Turkey's unemployment problems at the time,
but also encouraged complacency toward employment-related policy issues.
Furthermore, compositional shifts in domestic demand and output resulted in
larger investment in relatively capital-intensive sectors.
This section reappraises the patterns of primary factor use in view
of the sources of growth analysis discussed in Chapter 3.L' In addition to
the decomposition of factor use, Chapter 4 considers the sources of sectoral
price changes and the effect of domestic price distortions on value added
growth rates. The results of these complementary analyses suggest areas for
further multi-sectoral research on the role of relative prices in income
determination and resource allocation.
A. Historical Patterns of Employment and Productivity Growth
Tables 4.1 to 4.3 present data for a brief analysis of the
historical trends of labor supply and demand and productivity changes. The
labor and productivity figures assembled in these tables were derived from
various sources of data on the economically active population. The labor
supply and demand totals given in Table 4.1 are largely based on the official
1/ Because of the paucity of data for the earlier periods, the sources ofchanges in factor use (i.e., employment and investment requirements) havebeen estimated only for 1963-73.
- 65 -
Third Plan (1973-77) estimates for the earlier periods.1/
The patterns of population, labor supply and employment during 1950-
73 are shown in Table 4.1. The consequences of rapid population growth are
evident in the increasling values of dependency ratios, and in the growing
volumes of surplus labor, despite the massive migration of Turkish workers to
the labor-importing countries of Western Europe.2/ Rapid rates of
urbanization have added to these difficulties by creating increasingly serious
unemployment problems in the urban areas. The lack of employment
opportunities, increased education, and reduced female participation in the
rural areas have been instrumental in the steady decline of overall
participation ratios, which is indicated in Table 4.1-3/
The limited contribution made by the manufacturing sector to the
solution of unemployment problems in the urban areas is another notable
feature of the observed labor supply and demand patterns. This is
particularly striking in 1963-73, during which the service sectors contributed
56 per cent of the rise in total nonagricultural employment (excluding
unspecified categories), while the incremental contributions of the
manufacturing and social overhead sectors were around 25 and 18 per cent,
1/ The official Fourth Plan (1979-83) gives somewhat revised estimates forthe labor supply and demand totals in the earlier periods. In the revisedtime series, the total labor supply and agricultural employment figuresare adjusted upwards. The historical data on employment in major non-agricultural sectors are nearly the same in the Third and Fourth Plandocuments. See SPO (1973, Table 63) and SPO (1979, Table 20).
2/ For a detailed analysis of labor surplus in agriculture, see Hamurdan(1970). The author's estimate for the 1973 cumulative foreign demand forTurkish labor is within the range of the estimates of TUSIAD (1976) andTSKB (1977), which are 646,000 and 785,000, respectively.
3/ See Yalcintas (1970), World Bank (1974) and World Bank (1980) for criticalevaluations of the manpower and employment perspectives set out in theofficial development: plans. The determinants of the rates of urbanunemployment are examined by Celasun (1970).
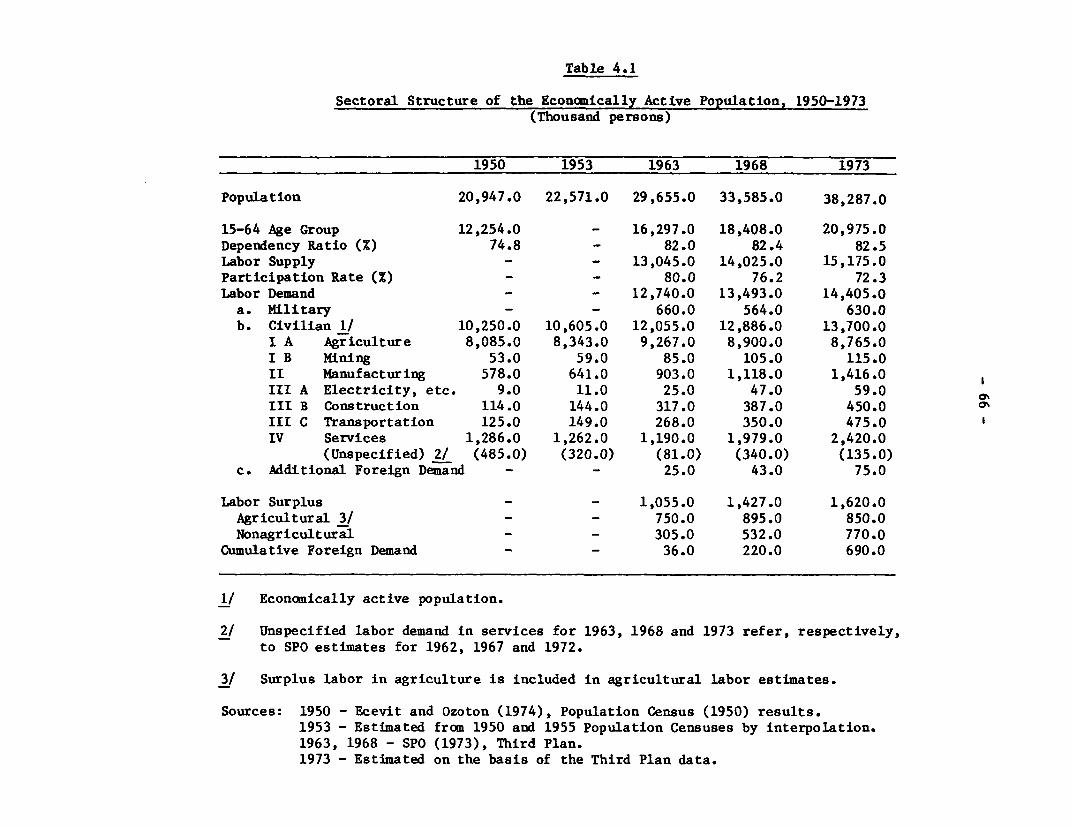
Table 4.1
Sectoral Structure of the Economically Active Population, 1950-1973(Thousand persons)
1950 1953 1963 1968 1973
Population 20,947.0 22,571.0 29,655.0 33,585.0 38,287.0
15-64 Age Group 12,254.0 - 16,297.0 18,408.0 20,975.0Dependency Ratio (%) 74.8 - 82.0 82.4 82.5Labor Supply - - 13,045.0 14,025.0 15,175.0Participation Rate () - - 80.0 76.2 72.3Labor Demand - - 12,740.0 13,493.0 14,405.0a. Military - - 660.0 564.0 630.0b. Civilian 1/ 10,250.0 10,605.0 12,055.0 12,886.0 13,700.0
I A Agriculture 8,085.0 8,343.0 9,267.0 8,900.0 8,765.0I B Mining 53.0 59.0 85.0 105.0 115.0II Manufacturing 578.0 641.0 903.0 1,118.0 1,416.0III A Electricity, etc. 9.0 11.0 25.0 47.0 59.0III B Construction 114.0 144.0 317.0 387.0 450.0III C Transportation 125.0 149.0 268.0 350.0 475.0IV Services 1,286.0 1,262.0 1,190.0 1,979.0 2,420.0
(Unspecified) 2/ (485.0) (320.0) (81.0) (340.0) (135.0)c. Additional Foreign Demand - - 25.0 43.0 75.0
Labor Surplus - - 1,055.0 1,427.0 1,620.0Agricultural 3/ - - 750.0 895.0 850.0Nonagricultural - - 305.0 532.0 770.0
Cumulative Foreign Demand - - 36.0 220.0 690.0
1/ Economically active population.
2/ Unspecified labor demand in services for 1963, 1968 and 1973 refer, respectively,to SPO estimates for 1962, 1967 and 1972.
3/ Surplus labor in agriculture is included in agricultural labor estimates.
Sources: 1950 - Ecevit and Ozoton (1974), Population Census (1950) results.1953 - Estimated from 1950 and 1955 Population Censuses by interpolation.1963, 1968 - SPO (1973), Third Plan.1973 - Estimated on the basis of the Third Plan data.
- 67 -
respectively. In the same period, the share of agricultural labor in total
civilian labor demand declined from 77 per cent in 1963 to 64 per cent in
1973, with continually large volumes of labor surplus prevailing in the rural
areas.
The changing patterns of employment status for the economically
active population are shown in Table 4.2 for the selected population census
years.J/ The figures indicate only marginal changes in employment status in
1950-60, with significant changes beginning to take place after 1960. In
employment status patterns, the predominance of non-employees (or non-wage
earners) engaged in agriculture and trade is important. Large proportions of
the various non-employee categories are also observed in manufacturing,
transport and other services sectors.
Table 4.3 presents data on employment, net output (i.e., value
added) and productivity growth by major sectors in 1953-63 and 1963-73.
During both periods, total employment increased at an average rate of 1.3 per
cent per year (in contrast to 2.6 per cent annual increase in the 15-64 age
population). The overall productivity rise was somewhat faster in the 1963-73
period primarily due to notable productivity gains in the construction,
transportation and mining sectors. Considering the small base of
manufacturing employment in relation to agricultural labor, the employment
increases in this sector (41 percent in 1953-63 and 57 percent in 1963-73)
1/ In Turkish parlance, the term "economically active population" is usedloosely to denote either total labor supply or civilian labor demand. InTable 4.2, "economically active" population refers to civilian labordemand.
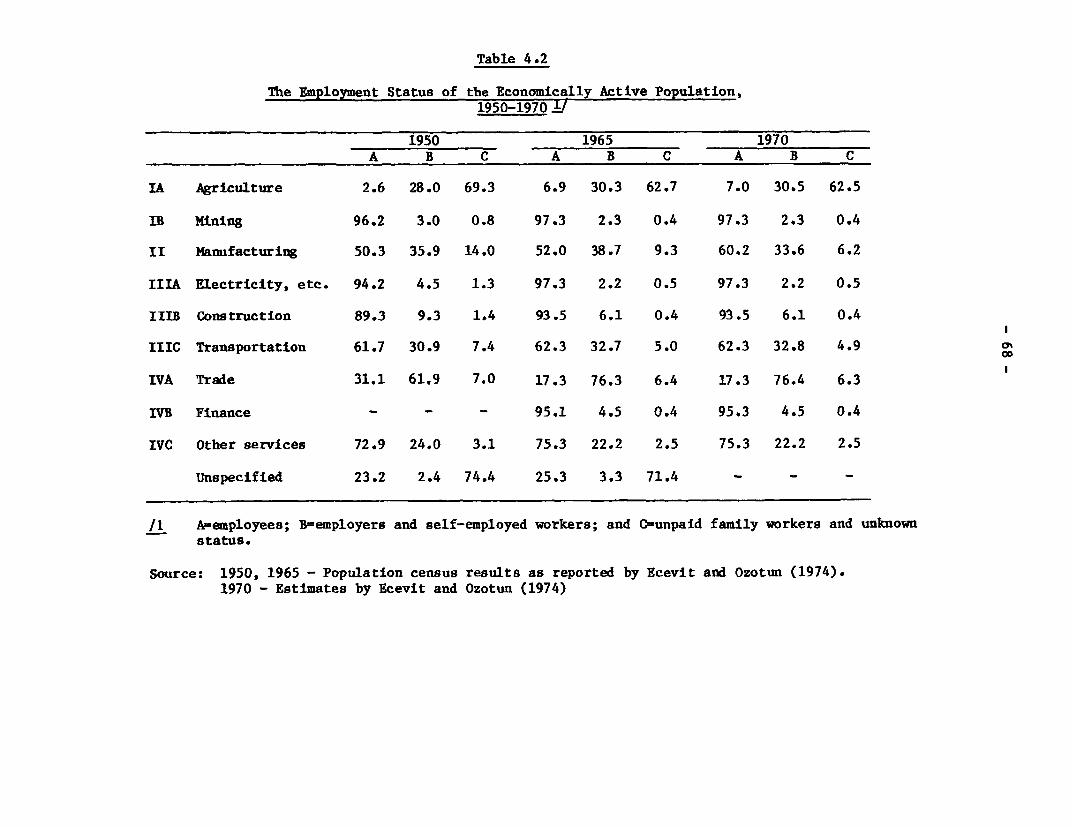
Table 4.2
The Employment Status of the Economically Active Population),1950-1970 J1
1950 1965 1970A B C A B C A B C
IA Agriculture 2.6 28.0 69.3 6.9 30.3 62.7 7.0 30.5 62.5
IB Mining 96.2 3.0 0.8 97.3 2.3 0.4 97.3 2.3 0.4
II Manufacturing 50.3 35.9 14.0 52.0 38.7 9.3 60.2 33.6 6.2
IIIA Electricity, etc. 94.2 4.5 1.3 97.3 2.2 0.5 97.3 2.2 0.5
IIIB Construction 89.3 9.3 1.4 93.5 6.1 0.4 93.5 6.1 0.4
IIIC Transportation 61.7 30.9 7.4 62.3 32.7 5.0 62.3 32.8 4.9
IVA Trade 31.1 61.9 7.0 17.3 76.3 6.4 17.3 76.4 6.3
IVB Finance - - - 95.1 4.5 0.4 95.3 4.5 0.4
IVC Other services 72.9 24.0 3.1 75.3 22.2 2.5 75.3 22.2 2.5
Unspecified 23.2 2.4 74.4 25.3 3.3 71.4 - - -
/1 A-employees; B-employers and self-employed workers; and C=unpaid family workers and unknownstatus.
Source: 1950, 1965 - Population census results as reported by Ecevit and Ozotun (1974).1970 - Estimates by Ecevit and Ozotun (1974)
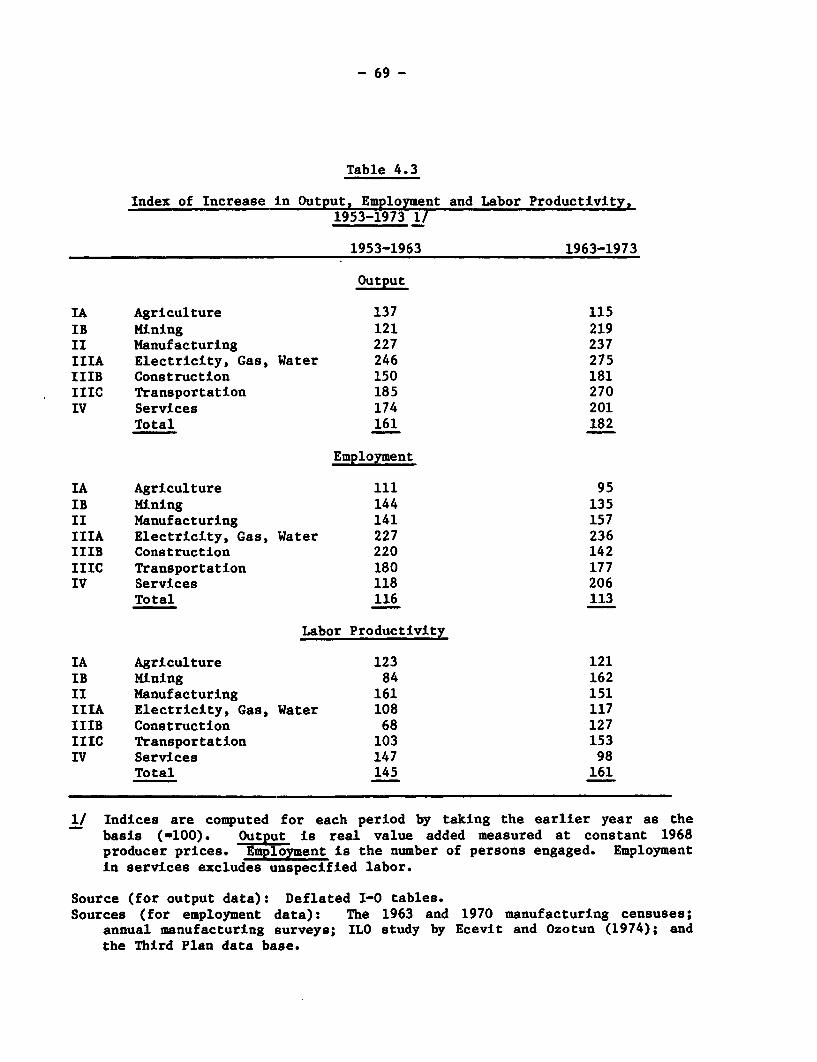
- 69 -
Table 4.3
Index of Increase in Output, Employment and Labor Productivity,1953-1973 1/
1953-1963 1963-1973
Output
IA Agriculture 137 115IB Mining 121 219II Manufacturing 227 237IIIA Electricity, Gas, Water 246 275IIIB Construction 150 181IIIC Transportation 185 270IV Services 174 201
Total 161 182
Employment
IA Agriculture 111 95IB Mining 144 135II Manufacturing 141 157IIIA Electricity, Gas, Water 227 236IIIB Construction 220 142IIIC Transportation 180 177IV Services 118 206
Total 116 113
Labor Productivity
IA Agriculture 123 121IB Mining 84 162II Manufacturing 161 151IIIA Electricity, Gas, Water 108 117IIIB Construction 68 127IIIC Transportation 103 153IV Services 147 98
Total 145 161
1/ Indices are computed for each period by taking the earlier year as thebasis (-100). Out ut is real value added measured at constant 1968producer prices. Employment is the number of persons engaged. Employmentin services excludes unspecified labor.
Source (for output data): Deflated I-0 tables.Sources (for employment data): The 1963 and 1970 manufacturing censuses;
annual manufacturing sgurveys; ILO study by Ecevit and Ozotun (1974); andthe Third Plan data base.
- 70 -
have not been sufficiently high to play a central role in the absorption of
the rapidly growing urban labor force. The figures clearly point out the
stagnant nature of productivity changes in the service sector from 1963
onwards, which made labor absorption of such proportions possible.
The productivity indices estimated in Table 4.3 also show a slowdown
in the growth of labor productivity in manufacturing from 61 percent in 1953-
63 to 51 percent in 1963-73. The productivity growth rates for manufacturing
labor (in terms of value added per worker as defined in Table 4.3) were 27 and
19 percent during the 1963-68 and 1968-73 subperiods, respectively. These
figures indicate the workings of a downward trend in the efficiency of labor
use in manufacturing, despite the increased capital intensity of industrial
investments (as shown in Table 4.7), and gradually reduced import rationing in
the early 1970s, as discussed earlier in Chapter 3. The simultaneous
occurrence of increased capital-output ratios and decreased rates of labor
productivity growth in manufacturing points also to a deceleration in the rate
of total factor productivity growth (TFPG) in this sector from 1963-73.-'
B. Sources of Changes in Employment
The sources of changes in employment have been decomposed by the
share total method for 1963-68 and 1968-73 on the assumption that sectoral
labor demand is linked with sectoral gross output through a fixed coefficient
at a given time. As a result, the decomposition of employment has generated
another factor (the change in labor coefficients) in addition to the four
1/ In a recent empirical study based on firm-level data, Krueger and Tuncer(1980) also find a secular downward trend in TFPG in private sectormanufacturing in the 1963-76 period. For an earlier contribution on theappraisal of labor productivity in Turkish manufacturing in the mid-1960s,see Kazgan (1972).
- 71 -
sources of growth identified in the decomposition of gross output, as
discussed in the preceeding chapter. (See Appendix 1.F for the decomposition
1/formulas) 1
Total Employment
Table 4.4 gives the aggregate measures for the sources of growth and
structural change in employment at five-year intervals during 1963-73. As
expected, the change in labor coefficients produced a large negative effect on
employment growth throughout the entire period. Technological change also had
a contractionary effect on aggregate employment primarily as a result of the
negative contribution of input-output coefficient changes to agricultural
expansion. The combined negative effects of changes in structural
coefficients were mainly offset by the pronounced positive effect of domestic
final demand expansion on employment increases. The observed relative
contributions of import substitution and export expansion to employment
generation over time closely correspond to the relative proportions of their
contribution to output growth, as described in Chapter 3.
To determine the employment generation potential of outward-oriented
growth in Turkey, the relative sizes of domestic and export demand
contributions to value added and employment growth were compared for 1963-
73. While export and domestic demand expansion explained, respectively, 9 and
90 percent of the growth of value added, their contributions to increases in
1/ For the decomposition of employment,a detailed attempt was made by theauthor to derive estimates for sectoral total labor (including wageearners as well as workers in nonemployee status) at the 25 sector levelof aggregation for the benchmark years 1963, 1968 and 1973. The subtotalemployment figures for major sectors were reconciled with the laborbalances shown in Table 4.1. The main statistical sources were (1) the1963 and 1970 manufacturing censuses; (2) annual manufacturing surveys;(3) an ILO study by Ecevit and Ozotun (1974); and (4) the Third Plan database. Unspecified labor demand in services was not included in theservice sector employment data.
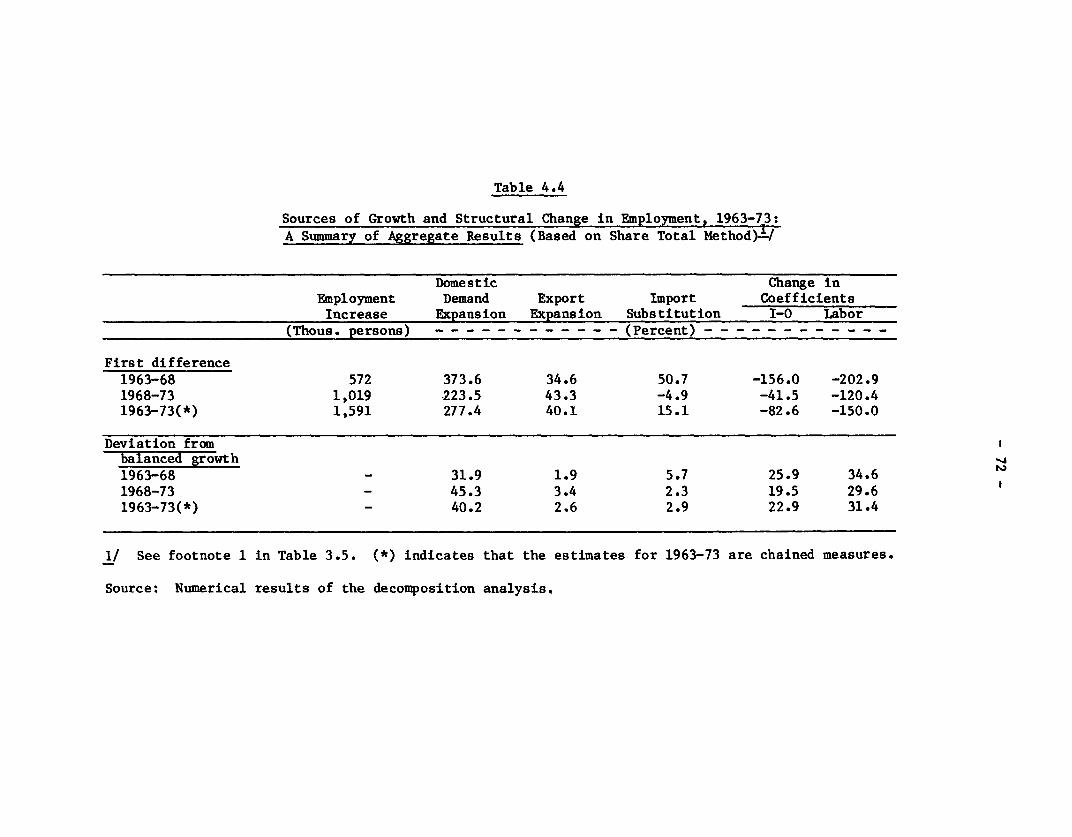
Table 4.4
Sources of Growth and Structural Change in Employment, 1963-73:
A Summary of Aggregate Results (Based on Share Total Method>&/
Domestic Change in
Employment Demand Export Import Coefficients
Increase Expansion Expansion Substitution 1-0 Labor
(Thous. persons) - - - - - - - - - - - - (Percent) - - - - - - - - - - - -
First difference1963-68 572 373.6 34.6 50.7 -156.0 -202.9
1968-73 1,019 223.5 43.3 -4.9 -41.5 -120.4
1963-73(*) 1,591 277.4 40.1 15.1 -82.6 -150.0
Deviation frombalanced growth1963-68 - 31.9 1.9 5.7 25.9 34.6
1968-73 45.3 3.4 2.3 19.5 29.6
1963-73(*) 40.2 2.6 2.9 22.9 31.4
1/ See footnote 1 in Table 3.5. (*) indicates that the estimates for 1963-73 are chained measures.
Source: Numerical results of the decomposition analysis.
- 73 -
overall employment were 40 and 277 percent. These figures clearly show that
export effects (as opposed to domestic demand effects) had a greater impact on
increasing employment than the expansion of value added in 1963-73. This
reflects the significant differences in the relative factor intensities of
export and domestic market-oriented production in the Turkish economy.
In contrast, the decomposition of structural change in employment
shows a different pattern. The deviation measures indicate that the changes in
labor and input-output coefficients account for 54 percent of the
compositional shifts in employment from 1963-73, whereas the relative
contribution of domestic demand effects was about 40 percent. However, export
effects on the structural change of labor demand remained unimportant during
1963-68 and 1968-73.
Sectoral Employment
Table 4.5 presents sectoral estimates for the sources of employment
growth, which were calculated as the chained first difference measures for
1963-73. Employment change figures in this table show that total employment
increased by about 1.6 million in 1963-73, despite the large decrease (of 0.5
million) in agricultural employment. The changes in labor and input-output
coefficients were the primary reasons for the decline of agricultural
employment. They were not balanced by the positive effects of demand
expansion. Approximately 56 percent of the growth in nonagricultural
employment occurred In services. This sector experienced stagnant labor
productivity growth, as reflected in the small negative employment effect of
changes in labor coefficients. Employment expansion in social overhead was
also substantial, in spite of the large negative effect caused by changes in
labor coefficients (mainly reflecting productivity gains in transportation).
In the latter sector, the employment contribution of domestic demand expansion
- 74 -
was dominant. Among the nonagricultural sectors, mining played a minor role
in employment expansion, partly due to the relatively rapid pace of growth in
its labor productivity.
The manufacturing sector as a whole provided 25 percent of increased
employment (about 2.1 million people) in nonagricultural sectors, despite the
negative employment effects of changes in labor coefficients in all its
branches (except basic metals). Domestic and export demand expansion explain,
respectively, 169 and 14 percent of the increase in manufacturing employment,
during 1963-73. However, these positive effects on manufac- turing employment
were largely offset by the negative employment impact (-110 percent) of
changes in labor coefficients.1/
The relative contribution of export expansion to employment growth
was less than 9 percent in all industries, except in food (32 percent),
textiles (25 percent), metal products (10 percent) and non-metallics (9
percent). In contrast, the relative contribution of import substitution to
employment growth varied widely among the manufacturing industries. The
asymmetrical effects of import substitution and technological change on
employment growth in the machinery and basic intermediate groups reflect the
same pattern discussed in the decomposition of production in Chapter 3.
The basic metals industry is the only example in which the change in
labor coefficients resulted in increased employment. This reflects the rapid
expansion of the labor force for this industry in the early 1970s for training
1/ During 1963-73,, nonagricultural employment in the Republic of Korea (witha population smaller than Turkey) increased by about 2.8 million people,and the incremental share of manufacturing was about 32 percent. In theKorean case, the relative contributions of domestic demand, exportexpansion and changes in labor coefficients to the growth of manufacturingemployment were 131, 113 and -137 percent, respectively. See Kim (1978).
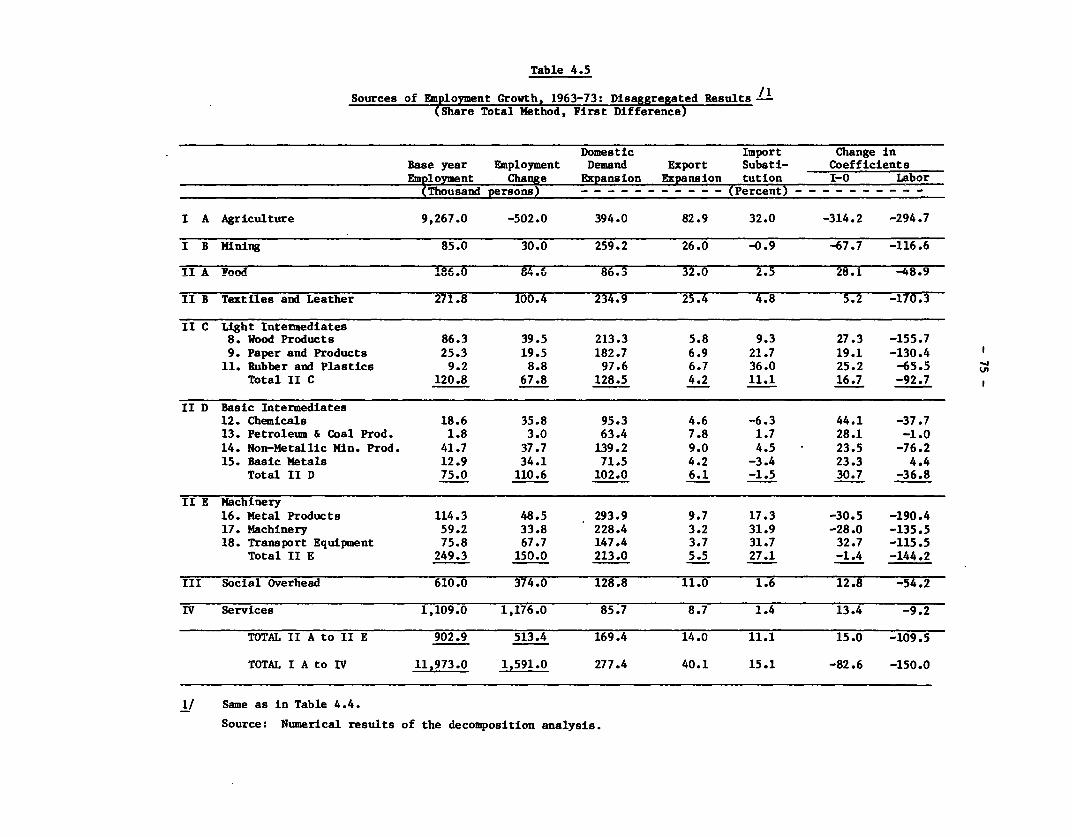
Table 4.5
Sources of Employment Growth, 1963-73: Disaggregated Results(Share Total Method, First Difference)
Domestic Import Change inBase year Employment Demand Export Substi- CoefficientsEmployment Change Expansion Expansion tution I-0 Labor
(Thousand persons) - - - - - - - - - - - (Percent) - - - - - - - - - -
I A Agriculture 9,267.0 -502.0 394.0 82.9 32.0 -314.2 -294.7
I B Mining 85.0 30.0 259.2 26.0 -0.9 -67.7 -116.6
TI A Food 186.0 84.6 86.3 32.0 2.5 28.1 -48.9
II B Textiles and Leather 271.8 100.4 234.9 25.4 4.8 5.2 -170.3
II C Light Intermediates8. Wood Products 86.3 39.5 213.3 5.8 9.3 27.3 -155.79. Paper and Products 25.3 19.5 182.7 6.9 21.7 19.1 -130.4
11. Rubber and Plastics 9.2 8.8 97.6 6.7 36.0 25.2 -65.5Total II C 120.8 67.8 128.5 4.2 11.1 16.7 -92.7
II D Basic Intermediates12. Chemicals 18.6 35.8 95.3 4.6 -6.3 44.1 -37.713. Petroleum & Coal Prod. 1.8 3.0 63.4 7.8 1.7 28.1 -1.014. Non-Metallic Min. Prod. 41.7 37.7 139.2 9.0 4.5 23.5 -76.215. Basic Metals 12.9 34.1 71.5 4.2 -3.4 23.3 4.4
Total II D 75.0 110.6 102.0 6.1 -1.5 30.7 -36.8
II E Machinery16. Metal Products 114.3 48.5 293.9 9.7 17.3 -30.5 -190.417. Machinery 59.2 33.8 228.4 3.2 31.9 -28.0 -135.518. Transport Equipment 75.8 67.7 147.4 3.7 31.7 32.7 -115.5
Total II E 249.3 150.0 213.0 5.5 27.1 -1.4 -144.2
III Social Overhead 610.0 374.0 128.8 11.0 1.6 12.8 -54.2
IV Services 1,109.0 1,176.0 85.7 8.7 1.4 13.4 -9.2
TOTAL II A to II E 902.9 513.4 169.4 14.0 11.1 15.0 -109.5
TOTAL I A to IV 11,973.0 1,591.0 277.4 40.1 15.1 -82.6 -150.0
1/ Same as in Table 4.4.
Source: Numerical results of the decomposition analysis.
- 76 -
prior to the completion of two large public sector projects (the integrated
steel works at Iskenderun, and the aluminum complex at Seydisehir).
The disaggregated estimates for the sources of employment growth
support the conclusions reached on the basis of aggregate measures. The
results point to the potential role of exports in generating additional
employment mainly in agriculture, food processing and textiles, but also, to a
lesser extent, in non-metallics, metal products and social overhead.l/
C. Sources of Changes in Investment Requirements
The lack of coefficient data on capital stocks has precluded an
analysis of the sources of capital expansion along the lines of the
decomposition of employment, as discussed above.2/ Instead, a method
developed by Watanabe (1975) in a sources of growth study on the Japanese
economy was adapted.3/ By using the available data on sectoral fixed
investments (by sector of destination), a sources of growth analysis has been
carried out for investments (i.e., the first differences in capital stocks)
rather than capital stocks in 1963-68 and 1968-73. As a result, the analysis
focuses on the differences between the second period and first period
investments. The following two causes of the differences were considered: (1)
the differences in the final demand expansions in the two consecutive periods;
and (2) the changes in production technologies (i.e., changes in incremental
1/ Turkey's comparative advantage in these sectors has been furtherstrengthened by the rapidly expanding import requirements of the oil-surplus countries in the Middle East.
2/ For public and private large-scale manufacturing (exluding small firms),Ebiri et al (1977) provide annual capital stock estimates for 15subsectors over 1965-75.
3/ See Appendix 1.F for the algebra of the decomposition scheme.
- 77 -
input-output and capital-output coefficients).l/
The numerical results of the investment growth analysis are
summarized at the 9 sector level of aggregation, as shown in Table 4.6.
According to the taible, the part of the investment increase attributed to
changes in production technologies was larger than the part attributed to the
expansion of final demand in all major sectors, except in food, textiles and
social overhead. These results support the earlier conclusions that export-
oriented manufacturing subsectors (such as food and textiles) have adopted
relatively more labor-intensive production technologies, and contributed more
effectively to employment generation (and capital savings) in their expansion
process.
The negative signs of the investment increments resulting from
differences in final demand expansion during the two consecutive periods
reflect the following factors:
(1) The long gestation lags and indivisibilities in fixed
investments (e.g., in mining and basic intermediates);
(2) The sharp increases in machinery and intermediate goods imports
in 1968-73, which restricted the growth of final demand on a net basis;
(3) The compositional shifts in consumer demand, which resulted in a
smaller increase in the final demand for unprocesssed agricultural products;
and
(4) The variations in cyclical conditions causing changes in the
rates of capacity utilization (e.g., adverse weather conditions for
agriculture in 1973).
These results also indicate the tenuous nature of medium-term input-output
projections which ignore gestation processes in capital formation and varying
1/ In this analysis, final demand is equal to domestic final demand plus ex-ports minus imports (by sector of origin).
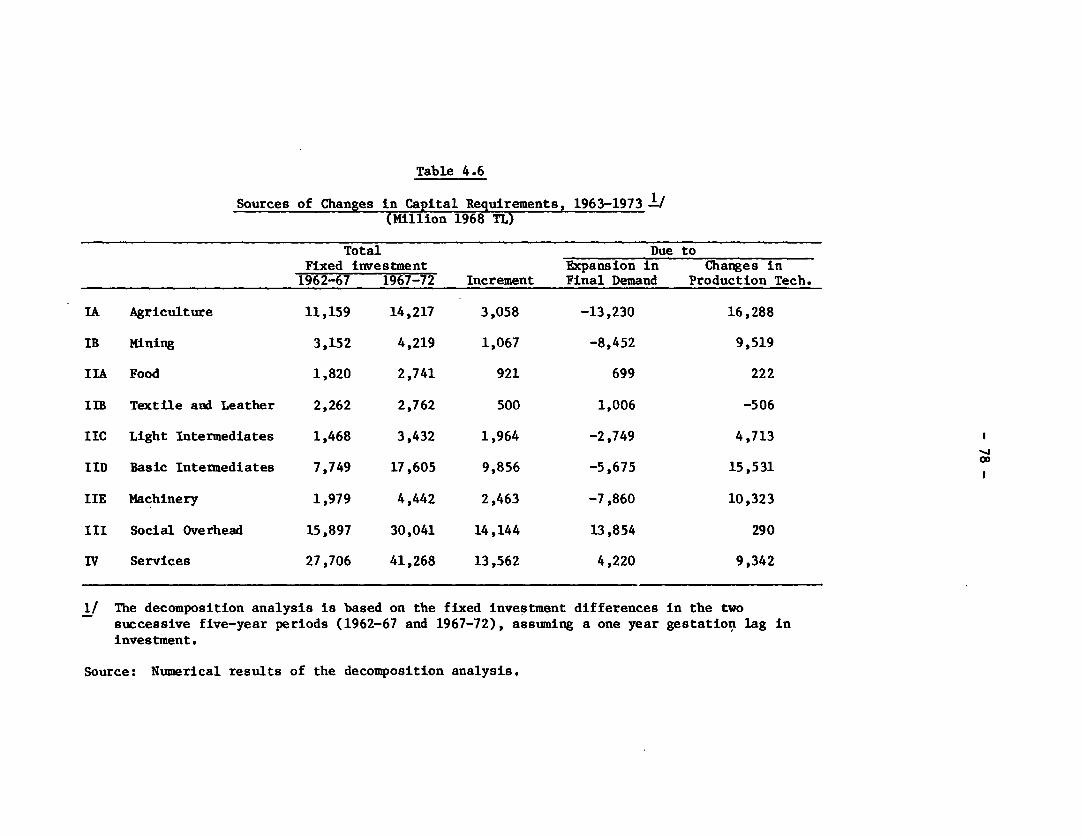
Table 4.6
Sources of Changes in Capital Requirements, 1963-1973 X
(Million 1968 TL)
Total Due to
Fixed investment Expansion in Changes in
1962-67 1967-72 Increment Final Demand Production Tech.
IA Agriculture 11,159 14,217 3,058 -13,230 16,288
IB Mining 3,152 4,219 1,067 -8,452 9,519
IIA Food 1,820 2,741 921 699 222
IIB Textile and Leather 2,262 2,762 500 1,006 -506
IIC Light Intermediates 1,468 3,432 1,964 -2,749 4,713
IID Basic Intermediates 7,749 17,605 9,856 -5,675 15,531
IIE Machinery 1,979 4,442 2,463 -7,860 10,323
III Social Overhead 15,897 30,041 14,144 13,854 290
IV Services 27,706 41,268 13,562 4,220 9,342
1/ The decomposition analysis is based on the fixed investment differences in the two
successive five-year periods (1962-67 and 1967-72), assuming a one year gestation lag in
investment.
Source: Numerical results of the decomposition analysis,
- 79 -
rates of capacity utilization in different sectors.
Table 4.7 presents complementary evidence on the variation of
relative factor intensities over time and by major sectors. Estimates for the
incremental capital-output and capital-labor ratios in 1963-68 and 1968-73
have been derived from the data base of this study, except for agriculture
(see footnote 2 on Table 4.7). The incremental coefficients shown in Table 4.7
indicate a trend in the increased capital intensity of fixed investments in
mining, manufacturing and social overhead during 1963-73. This trend was
particularly apparent in the basic intermediates group, which includes highly
capital-intensive industries such as chemicals, basic metals and petroleum
refining. Incremental capital-output and capital-labor ratios for basic
intermediates were about twice as large in 1968-73 as in 1963-68; and they
were substantially higher than the overall averages calculated for the
manufacturing sector. Nevertheless, this group's share in total manufacturing
investments increased from 51 percent in 1963-68 to 57 percent in 1968-73.
The upward trend in the capital intensity of manufacturing from
1963-73 continued under the implementation of the Third Plan (1973-77) and was
assumed in the projections of the Fourth Plan (1979-83). However, these plans
did not adopt a selective investment strategy to optimize the choices on the
timing, size and combination of capacity expansions in this sector. Instead,
available investment resources were thinly spread over numerous industrial
projects in the mid- and late 1970s. As a result, structural adjustment was
more difficult in the early 1980si/
1/ See Balassa (1979) for a review of the allocation of investment fundsplanned under the Fourth Plan. An analysis of the optimal mix of importsubstitution and export promotion investments in 1972-80 is provided in amulti-sectoral modeling study by Celasun (1974).

- 80 -
Table 4.7
Incremental Capital-Output and Capital-Labor Ratios,1963-73 1/
ICOR ICLR1963-68 1968 73 1963-68 1968 73
I A Agriculture 2/ 3.45 3.44 - -I B Mining 4.09 7.77 157.6 421.9II A Food 1.70 1.46 51.7 55.5II B Textile and Leather 1.36 1.75 49.4 50.6II C Light Intermediates 1.29 2.97 45.4 96.7II D Basic Intermediates 2.90 5.98 172.2 268.4II E Machinery 1.38 1.32 34.8 47.7III Social Overhead 2.48 3.96 91.4 150.2IV Services 3/ 2.53 2.65 52.3 63.9TOTAL II A to II E 1.92 2.83 71.0 103.9TOTAL I B to IV 2.45 3.29 66.1 92.3
1/ All monetary values are measured at constant 1968 domestic prices. ICORand ICLR denote incremental capital-output and capital-labor ratios,respectively. Output is real value added in producer prices. The unit ofICLR is thousand TL per worker.
2/ 1962-64, 1967-69 and 1972-74 averages have been used for 1963, 1968 and1973 output figures in the estimation of agricultural ICOR to smooth outthe effects of fluctuating weather conditions.
3/ Unspecified labor has been excluded in the estimation of ICLR forservices.
Sources: Data base of the sources of growth models, and investment data ofthe SPO Annual Programs
D. Sources of Changes in Relative Sectoral Prices
Relative price movements have not received sufficient attention in
the available empirical research on the Turkish economy.l/ The prolonged
protection of domestic industries discouraged active interest in the movements
of real incentives, product price differentials and relative factor prices
until the economic crisis emerged in the late 1970s. This analysis attempts
1/ The two notable exceptions are the empirical contributions of Krueger(1974) and Dervis and Robinson (1978). While Krueger (1974) provides fullydocumented estimates for the movements of effective exchange rates for awide range of commodities in 1950-70, Dervis and Robinson (1978) decomposethe factors that contributed to the drift in equilibrium exchange rates in1973-78.
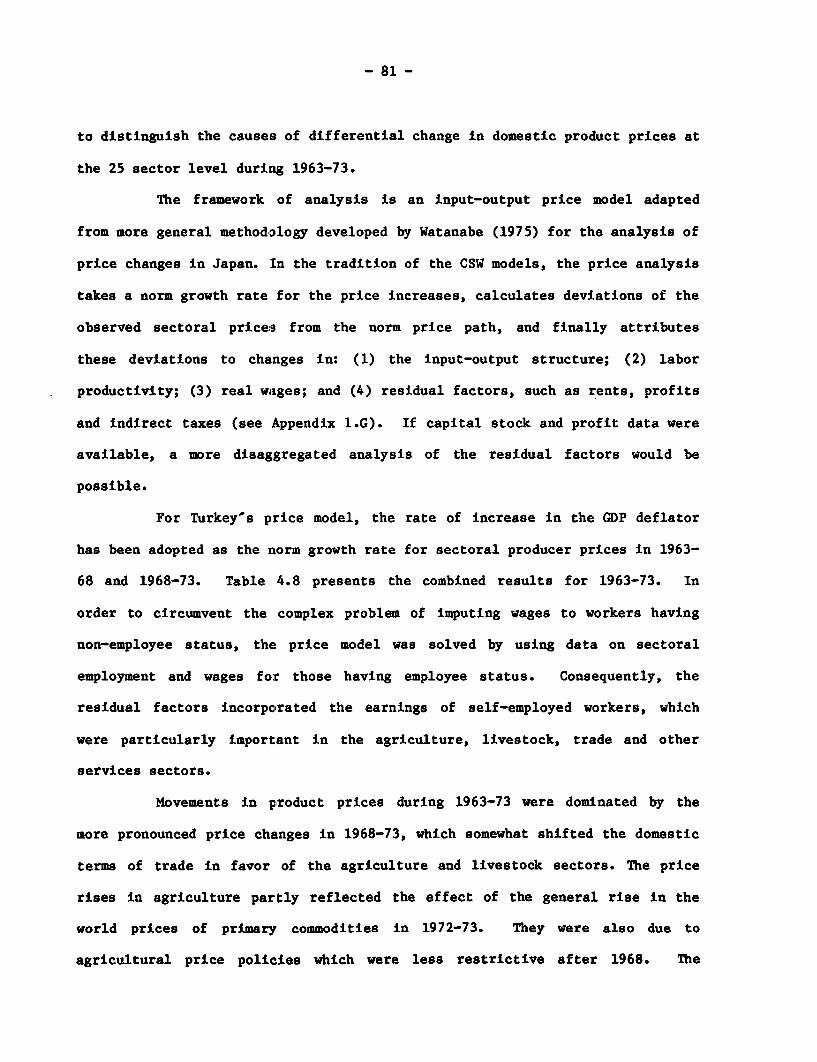
- 81 -
to distinguish the causes of differential change in domestic product prices at
the 25 sector level during 1963-73.
The framework of analysis is an input-output price model adapted
from more general methodology developed by Watanabe (1975) for the analysis of
price changes in Japan. In the tradition of the CSW models, the price analysis
takes a norm growth rate for the price increases, calculates deviations of the
observed sectoral prices from the norm price path, and finally attributes
these deviations to changes in: (1) the input-output structure; (2) labor
productivity; (3) real wages; and (4) residual factors, such as rents, profits
and indirect taxes (see Appendix 1.G). If capital stock and profit data were
available, a more disaggregated analysis of the residual factors would be
possible.
For Turkey's price model, the rate of increase in the GDP deflator
has been adopted as the norm growth rate for sectoral producer prices in 1963-
68 and 1968-73. Table 4.8 presents the combined results for 1963-73. In
order to circumvent the complex problem of imputing wages to workers having
non-employee status, the price model was solved by using data on sectoral
employment and wages for those having employee status. Consequently, the
residual factors incorporated the earnings of self-employed workers, which
were particularly important in the agriculture, livestock, trade and other
services sectors.
Movements in product prices during 1963-73 were dominated by the
more pronounced price changes in 1968-73, which somewhat shifted the domestic
terms of trade in favor of the agriculture and livestock sectors. The price
rises in agriculture partly reflected the effect of the general rise in the
world prices of primary commodities in 1972-73. They were also due to
agricultural price policies which were less restrictive after 1968. The
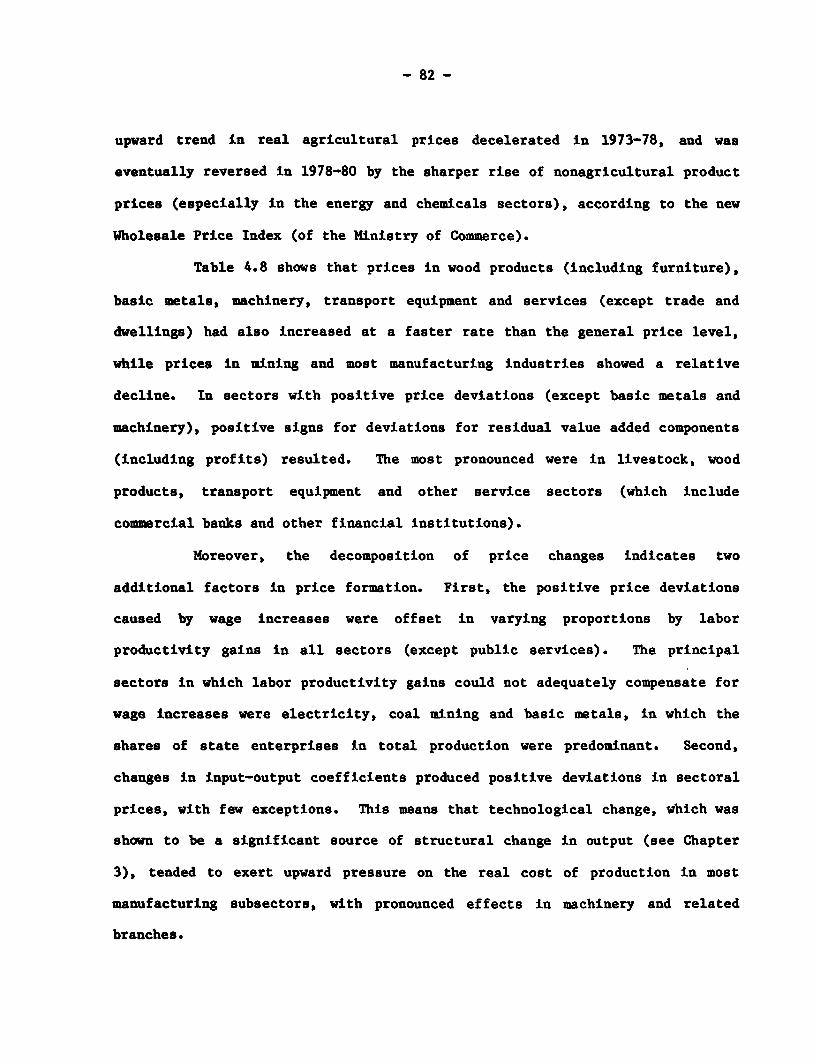
- 82 -
upward trend in real agricultural prices decelerated in 1973-78, and was
eventually reversed in 1978-80 by the sharper rise of nonagricultural product
prices (especially in the energy and chemicals sectors), according to the new
Wholesale Price Index (of the Ministry of Commerce).
Table 4.8 shows that prices in wood products (including furniture),
basic metals, machinery, transport equipment and services (except trade and
dwellings) had also increased at a faster rate than the general price level,
while prices in mining and most manufacturing industries showed a relative
decline. In sectors with positive price deviations (except basic metals and
machinery), positive signs for deviations for residual value added components
(including profits) resulted. The most pronounced were in livestock, wood
products, transport equipment and other service sectors (which include
commercial banks and other financial institutions).
Moreover, the decomposition of price changes indicates two
additional factors in price formation. First, the positive price deviations
caused by wage increases were offset in varying proportions by labor
productivity gains in all sectors (except public services). The principal
sectors in which labor productivity gains could not adequately compensate for
wage increases were electricity, coal mining and basic metals, in which the
shares of state enterprises in total production were predominant. Second,
changes in input-output coefficients produced positive deviations in sectoral
prices, with few exceptions. This means that technological change, which was
shown to be a significant source of structural change in output (see Chapter
3), tended to exert upward pressure on the real cost of production in most
manufacturing subsectors, with pronounced effects in machinery and related
branches.
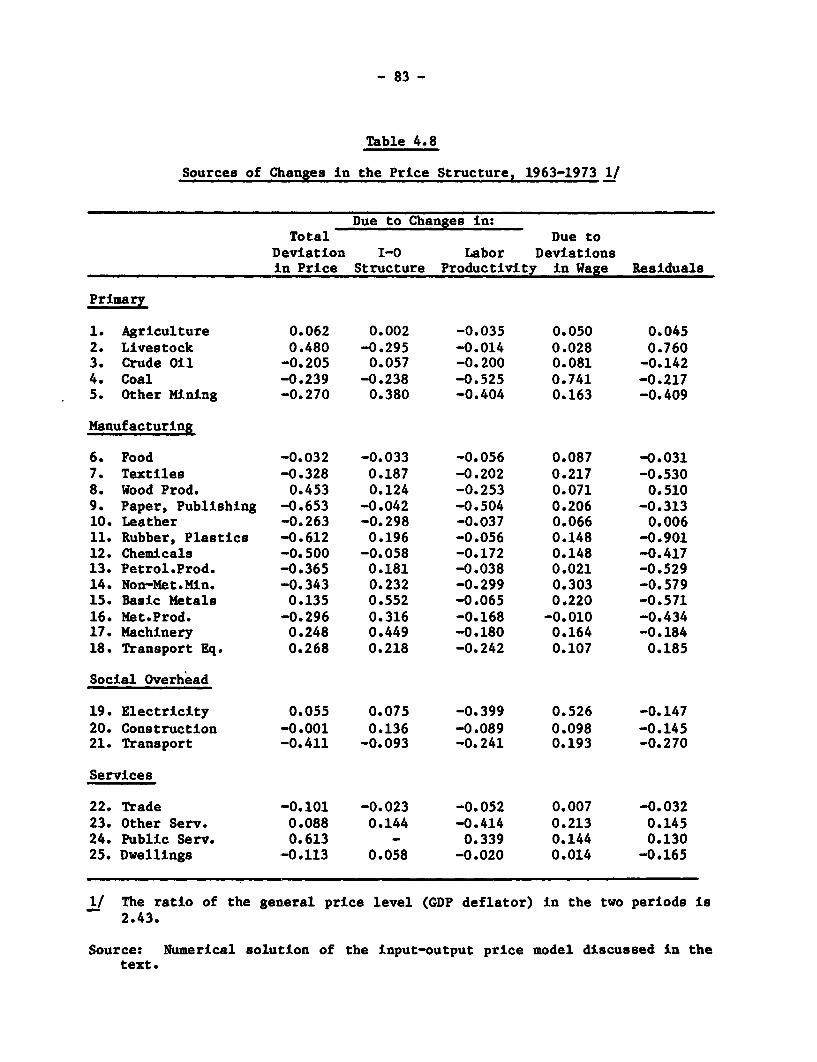
- 83 -
Table 4.8
Sources of Changes in the Price Structure, 1963-1973 1/
Due to Changes in:Total Due to
Deviation I-0 Labor Deviationsin Price Structure Productivity in Wage Residuals
Primary
1. Agriculture 0.062 0.002 -0.035 0.050 0.0452. Livestock 0.480 -0.295 -0.014 0.028 0.7603. Crude Oil -0.205 0.057 -0.200 0.081 -0.1424. Coal -0.239 -0.238 -0.525 0.741 -0.2175. Other Mining -0.270 0.380 -0.404 0.163 -0.409
Manufacturing
6. Food -0.032 -0.033 -0.056 0.087 -0.0317. Textiles -0.328 0.187 -0.202 0.217 -0.5308. Wood Prod. 0.453 0.124 -0.253 0.071 0.5109. Paper, Publishing -0.653 -0.042 -0.504 0.206 -0.31310. Leather -0.263 -0.298 -0.037 0.066 0.00611. Rubber, Plastics -0.612 0.196 -0.056 0.148 -0.90112. Chemicals -0.500 -0.058 -0.172 0.148 -0.41713. Petrol.Prod. -0.365 0.181 -0.038 0.021 -0.52914. Non-Met.Min. -0.343 0.232 -0.299 0.303 -0.57915. Basic Metals 0.135 0.552 -0.065 0.220 -0.57116. Met.Prod. -0.296 0.316 -0.168 -0.010 -0.43417. Machinery 0.248 0.449 -0.180 0.164 -0.18418. Transport Eq. 0.268 0.218 -0.242 0.107 0.185
Social Overhead
19. Electricity 0.055 0.075 -0.399 0.526 -0.14720. Construction -0.001 0.136 -0.089 0.098 -0.14521. Transport -0.411 -0.093 -0.241 0.193 -0.270
Services
22. Trade -0.101 -0.023 -0.052 0.007 -0.03223. Other Serv. 0.088 0.144 -0.414 0.213 0.14524. Public Serv. 0.613 - 0.339 0.144 0.13025. Dwellings -0.113 0.058 -0.020 0.014 -0.165
1/ The ratio of the general price level (GDP deflator) in the two periods is2.43.
Source: Numerical solution of the input-output price model discussed in thetext.
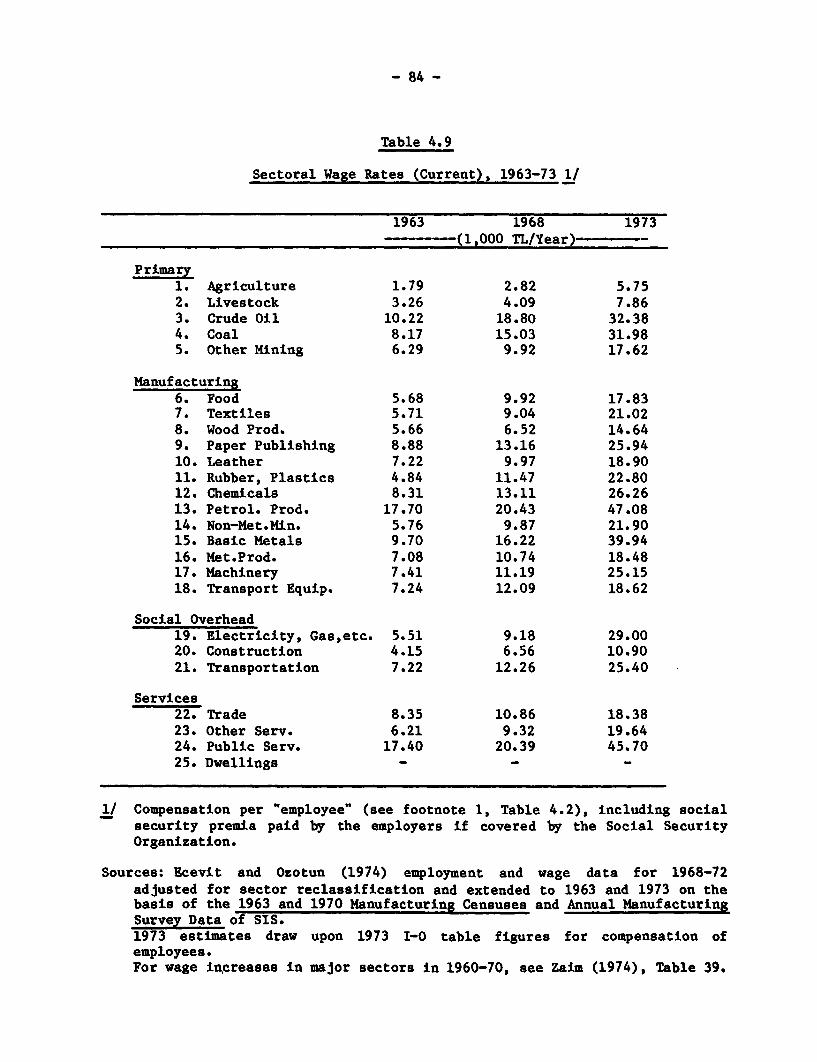
- 84 -
Table 4.9
Sectoral Wage Rates (Current), 1963-73 1/
1963 1968 1973--- --- (1,000 TL/Yea r) -
Primary1. Agriculture 1.79 2.82 5.752. Livestock 3.26 4.09 7.863. Crude Oil 10.22 18.80 32.384. Coal 8.17 15.03 31.985. Other Mining 6.29 9.92 17.62
Manufacturing6. Food 5.68 9.92 17.837. Textiles 5.71 9.04 21.028. Wood Prod. 5.66 6.52 14.649. Paper Publishing 8.88 13.16 25.9410. Leather 7.22 9.97 18.9011. Rubber, Plastics 4.84 11.47 22.8012. Chemicals 8.31 13.11 26.2613. Petrol. Prod. 17.70 20.43 47.0814. Non-Met.Min. 5.76 9.87 21.9015. Basic Metals 9.70 16.22 39.9416. Net.Prod. 7.08 10.74 18.4817. Machinery 7.41 11.19 25.1518. Transport Equip. 7.24 12.09 18.62
Social Overhead19. Electricity, Gas,etc. 5.51 9.18 29.0020. Construction 4.15 6.56 10.9021. Transportation 7.22 12.26 25.40
Services22. Trade 8.35 10.86 18.3823. Other Serv. 6.21 9.32 19.6424. Public Serv. 17.40 20.39 45.7025. Dwellings - - -
1/ Compensation per "employee" (see footnote 1, Table 4.2), including socialsecurity premia paid by the employers if covered by the Social SecurityOrganization.
Sources: Ecevit and Ozotun (1974) employment and wage data for 1968-72adjusted for sector reclassification and extended to 1963 and 1973 on thebasis of the 1963 and 1970 Manufacturing Censuses and Annual ManufacturingSurvey Data of SIS.1973 estimates draw upon 1973 I-0 table figures for compensation ofemployees.For wage increases in major sectors in 1960-70, see Zaim (1974), Table 39.
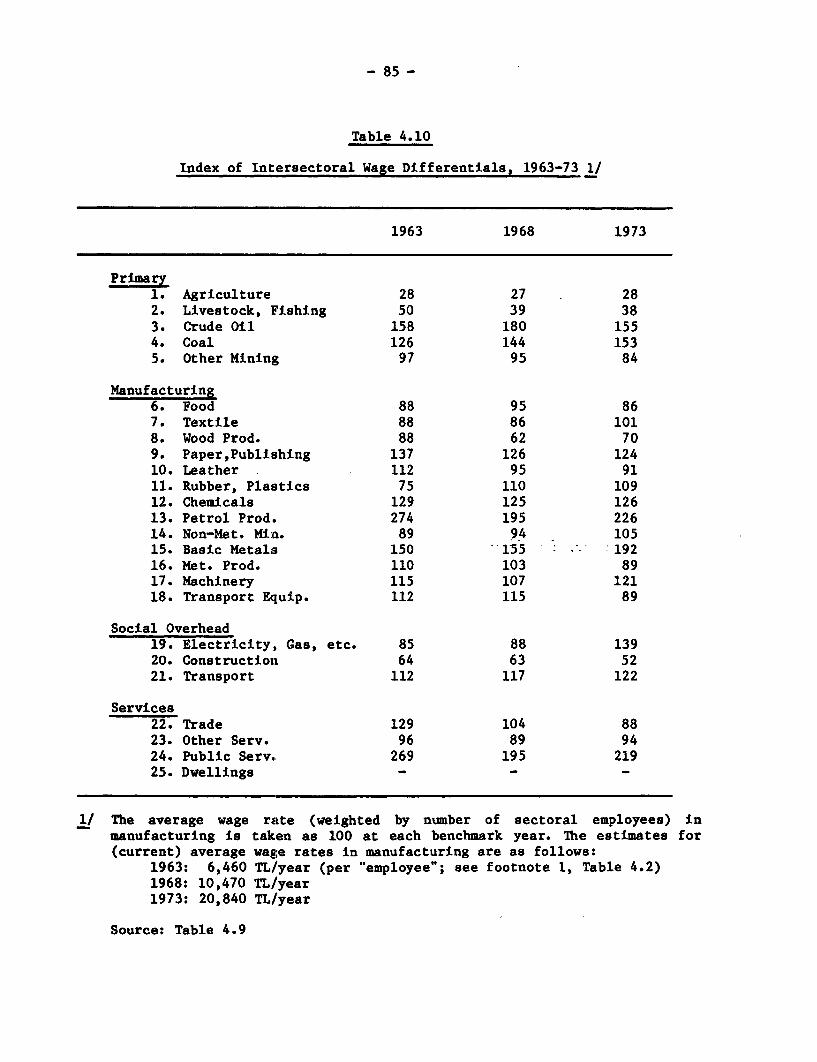
- 85 -
Table 4.10
Index of Intersectoral Wage Differentials, 1963-73 1/
1963 1968 1973
Primary1. Agriculture 28 27 282. Livestock, Fishing 50 39 383. Crude Oil 158 180 1554. Coal 126 144 1535. Other Mining 97 95 84
Manufacturing6. Food 88 95 867. Textile 88 86 1018. Wood Prod. 88 62 709. Paper,Publishing 137 126 12410. Leather 112 95 9111. Rubber, Plastics 75 110 10912. Chemicals 129 125 12613. Petrol Prod. 274 195 22614. Non-Met. Min. 89 94 10515. Basic Metals 150 155 1-9216. Met. Prod. 110 103 8917. Machinery 115 107 12118. Transport Equip. 112 115 89
Social Overhead19. Electricity,, Gas, etc. 85 88 13920. Constructioni 64 63 5221. Transport 112 117 122
Services22. Trade 129 104 8823. Other Serv. 96 89 9424. Public Serv. 269 195 21925. Dwellings -- -
1/ The average wage rate (weighted by number of sectoral employees) inmanufacturing is taken as 100 at each benchmark year. The estimates for(current) average wage rates in manufacturing are as follows:
1963: 6,460 TL/year (per "employee"; see footnote 1, Table 4.2)1968: 10,470 TL/year1973: 20,840 TL/year
Source: Table 4.9
- 86 -
Furthermore, the price changes due to deviations in wages largely
reflect the shifts in intersectoral wage differentials over time. As
reflected in Tables 4.9 and 4.10, manufacturing wages have increased
significantly in 1963-73 relative to wages in construction, other mining,
public services, trade and other services. This is partly the result of the
growing influence of labor unions in wage determination under the umbrella of
restrictive trade policies pursued in the 1960s. Within the manufacturing
sector proper, wage differentials among the subsectors remained large
throughout the period. The overall pattern was that the wages in labor-
intensive branches (e.g., food, textiles, wood products, plastics, leather and
non-metallics) generally lagged behind the wages in capital-intensive ones
(e.g., petroleum products, basic metals, chemicals). The wage differentials
within manufacturing were in varying degrees due to differences in relative
factor intensities, labor skills, levels of protection, unionization and
degree of monopoly power in the domestic markets.1/ In addition, the
manufacturing subsectors which lagged behind the others in relative wage
levels were also the ones which experienced significant effects of export
expansion on their growth. (See Table 3.9.)
In the transition towards more trade-oriented growth in Turkey, the
gradually reduced levels of protection and incentives for domestic market-
oriented industries will generate important shifts in sectoral prices,
relative wages and profits. Thus, the type of price analysis presented here
merits continuing research in the future with an extended data base covering
sectoral capital stocks and profit ratios.
1/ A regression study by Aksoy (1980) finds statistically significant effectsof unionization on relative wages in Turkish manufacturing during 1963-71.

- 87 -
E. Domestic Price Distortions, Labor Reallocation and Value Added Growth Rates
An appraisal of employment changes in Turkey would be incomplete
without considering the impact of labor reallocation on the overall growth
process. Viewed from the supply side, the movement of labor from low
productivity agriculture to high productivity nonagricultural sectors has been
an important source of value added growth in the country. The sectoral
reallocation of labor itl Turkey has been particularly significant because of
the unusually large differences between the productivity levels of the
agricultural and nonagricultural sectors. The cross-country average for the
ratio of value added per labor unit in nonagricultural sectors to that in
agriculture is estimated as 2.37 in Kuznets (1969), while the actual Turkish
data shows the ratio to be 4 to 5 in 1953-78.
The deviations of Turkey's sectoral productivity differentials from
Kuznets' cross-country norms are substantial, and are usually attributed to
domestic price distortions arising from the protection-cum-subsidy system.
Although the low crop yields observed in cereal farming may partly account for
the depressed levels of labor productivity in Turkish agriculture, overvalued
factor returns and incomes in nonagricultural sectors have been indicated by
unusually large sectoral productivity differentials in the past.
Some of the broad policy issues connected with overvalued non-
agricultural incomes in Turkey were first addressed by Hatiboglu (1978) in an
an attempt to estimate the proportion of the "rent element' in non-
agricultural value added. Hatiboglu deducts the following from the actual
value added created by newly employed workers in non agricultural sectors: (1)
the hypothetical (or normal) payments to capital and (2) the amount of value
added if these workers were employed in agriculture. This approach entails
numerous measurement difficulties, but it can be used to calculate reasonable
- 88 -
estimates for the overstated part of intersectoral productivity differences
over time.
In a more recent analysis of the Turkish economy by Balassa (1979),
estimates are also derived for the effects of labor reallocation and relative
price distortions on overall labor productivity growth (referred to as overall
productivity growth or OPG) during 1967-77. Balassa calculates the
hypothetical rate (2.7 percent a year) of OPG based on the assumption of the
constant sectoral composition of the labor force between 1967 and 1977, and
compares it to the actual rate (4.9 percent a year) of OPG. He attributes the
difference (2.2 percent a year) to the impact of labor reallocation (among
agriculture, industry and services) under the unadjusted relative prices of
this period. The effect of relative price distortions on OPG is estimated by
recalculating the sectoral composition of Turkish aggregate value added in
1967 in terms of price-corrected productivity differentials, and by applying
actual rates of sectoral labor productivity growth to the adjusted base-year
figures in 1967-77. With the base-year productivity figures adjusted
according to Kuznets' cross-country standards, the results indicate a 4.1
percent increase in OPG annually as compared to the actual rate of 4.9
percent.i'
In the context of this study, which has focused on demand-related
determinants of growth and structural change, the effects of domestic price
distortions and labor reallocation on value added growth rates are of further
interest for the following three reasons; (1) to determine whether the effects
1/ The estimated rates of increase in total employment in 1967-77 are 21.8and 11.2 percent in Balassa (1979) and the official Fourth Plan (SPO1979), respectively. The data base of the present study indicates a 10.7percent rise in total employment between our benchmark years 1968 and1978.
- 89 -
of price distortions on aggregate growth closely match the time pattern of
import substitution effects estimated in the decomposition of output changes;
(2) to determine the relative sizes of labor reallocation and price distortion
effects in the growth process in order to develop a realistic perspective on
the potential sources of future trade-oriented income growth as rates of
protection for nonagricultural activities decline; and (3) to reassess the
effects of price distortions on value added growth in reference to the cross-
country norms estimatedl for Turkey in Chapter 2. Based on the regressions of
Chenery and Syrquin (1975), these norms allow for shifts in population and
income level over time., Furthermore, they reflect the more recent experience
of a larger number of countries, as compared to the average patterns estimated
in Kuznets (1969) on the basis of less information.
The relative effects of labor reallocation and price distortions on
the growth of overall labor productivity and gross domestic product (GDP) in
19 53-78 have been estimated by employing the general approach used in Balassa
(1979). Because separate sectoral estimates for agriculture are not available
in the Chenery-Syrquin regressions, the economy has been broken down into
primary (i.e., agriculture and mining) and non-primary sectors, with all
relevant figures arranged accordingly .1 As a point of departure in the
analysis, the following estimates have been derived for the labor productivity
ratios in non-primary and primary comparisons at given points in time during
1953-78:
1/ The share of mining in primary value added was on the average less than 5percent in 1953-73. Hence, the conclusions drawn for the primary sectorpertain essentially to agriculture in the Turkish context.
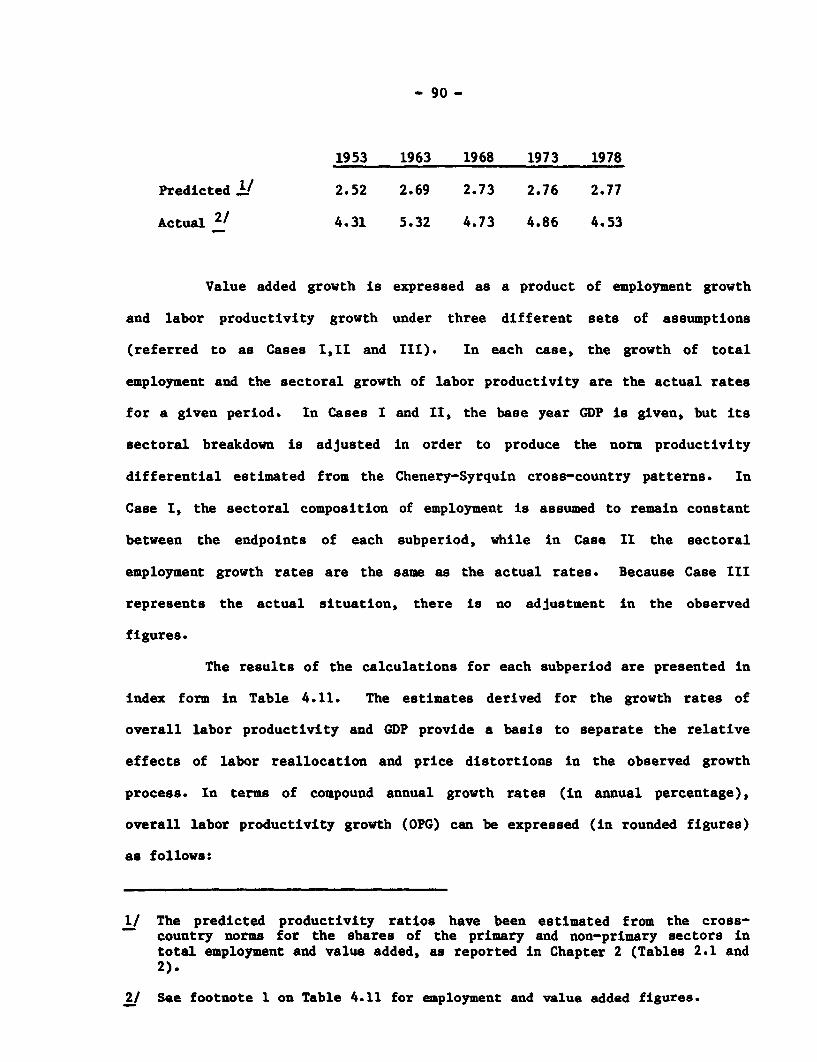
- 90 -
1953 1963 1968 1973 1978
Predicted 1/ 2.52 2.69 2.73 2.76 2.77
Actual 2/ 4.31 5.32 4.73 4.86 4.53
Value added growth is expressed as a product of employment growth
and labor productivity growth under three different sets of assumptions
(referred to as Cases I,II and III). In each case, the growth of total
employment and the sectoral growth of labor productivity are the actual rates
for a given period. In Cases I and II, the base year GDP is given, but its
sectoral breakdown is adjusted in order to produce the norm productivity
differential estimated from the Chenery-Syrquin cross-country patterns. In
Case I, the sectoral composition of employment is assumed to remain constant
between the endpoints of each subperiod, while in Case II the sectoral
employment growth rates are the same as the actual rates. Because Case III
represents the actual situation, there is no adjustment in the observed
figures.
The results of the calculations for each subperiod are presented in
index form in Table 4.11. The estimates derived for the growth rates of
overall labor productivity and GDP provide a basis to separate the relative
effects of labor reallocation and price distortions in the observed growth
process. In terms of compound annual growth rates (in annual percentage),
overall labor productivity growth (OPG) can be expressed (in rounded figures)
as follows:
1/ The predicted productivity ratios have been estimated from the cross-country norms for the shares of the primary and non-primary sectors intotal employment and value added, as reported in Chapter 2 (Tables 2.1 and2).
2/ See footnote 1 on Table 4.11 for employment and value added figures.
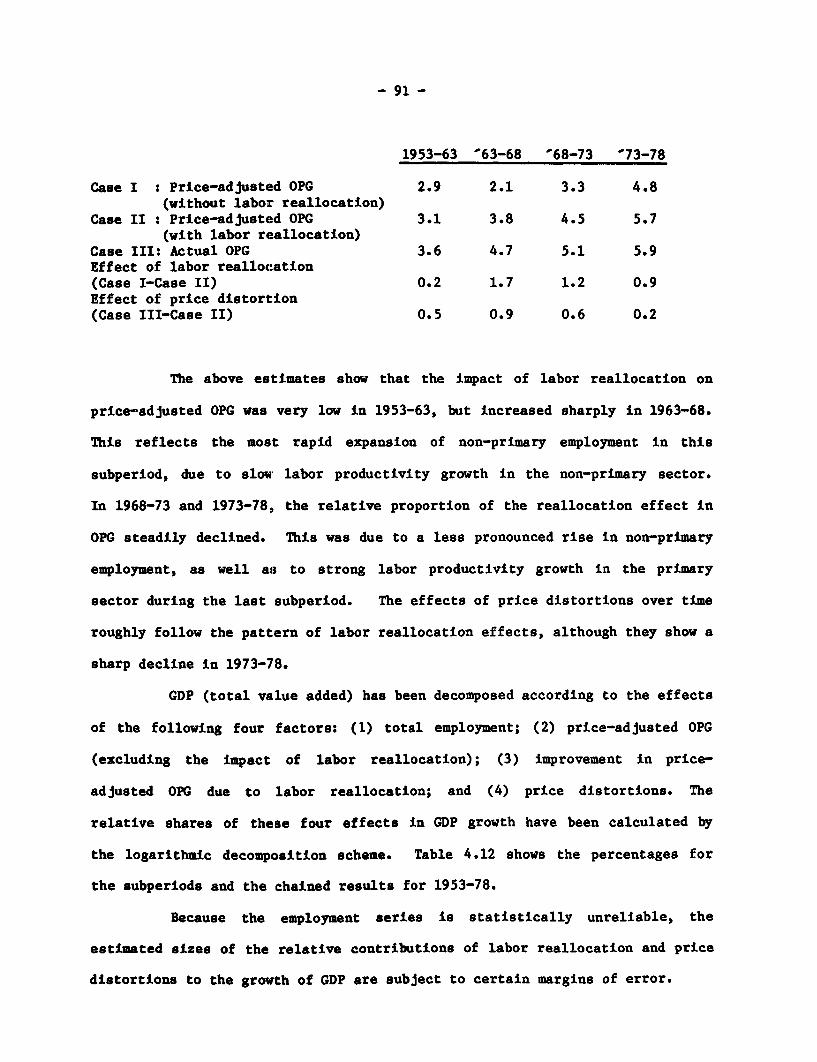
- 91 -
1953-63 p63-68 p68-73 p73-78
Case I : Price-adjusted OPG 2.9 2.1 3.3 4.8(without labor reallocation)
Case II : Price-adjusted OPG 3.1 3.8 4.5 5.7(with labor reallocation)
Case III: Actual OPG 3.6 4.7 5.1 5.9Effect of labor reallocation(Case I-Case II) 0.2 1.7 1.2 0.9Effect of price distortion(Case III-Case II) 0.5 0.9 0.6 0.2
The above estimates show that the impact of labor reallocation on
price-adjusted OPG was very low in 1953-63, but increased sharply in 1963-68.
This reflects the most rapid expansion of non-primary employment in this
subperiod, due to slow, labor productivity growth in the non-primary sector.
In 1968-73 and 1973-78, the relative proportion of the reallocation effect in
OPG steadily declined. This was due to a less pronounced rise in non-primary
employment, as well as to strong labor productivity growth in the primary
sector during the last subperiod. The effects of price distortions over time
roughly follow the pattern of labor reallocation effects, although they show a
sharp decline in 1973-78.
GDP (total value added) has been decomposed according to the effects
of the following four factors: (1) total employment; (2) price-adjusted OPG
(excluding the impact of labor reallocation); (3) improvement in price-
adjusted OPG due to labor reallocation; and (4) price distortions. The
relative shares of these four effects in GDP growth have been calculated by
the logarithmic decomposition scheme. Table 4.12 shows the percentages for
the subperiods and the chained results for 1953-78.
Because the employment series is statistically unreliable, the
estimated sizes of the relative contributions of labor reallocation and price
distortions to the growth of GDP are subject to certain margins of error.
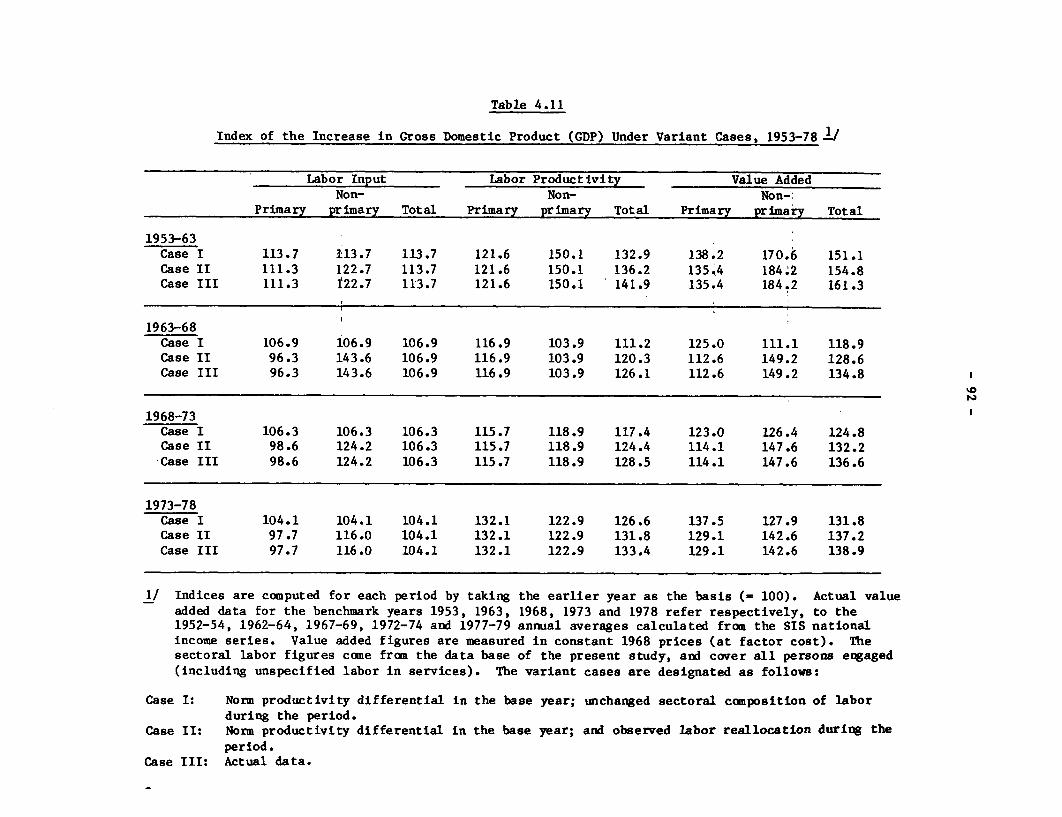
Table 4.11
Index of the Increase in Gross Domestic Product (GDP) Under Variant Cases, 1953-78 i
Labor Input Labor Productivity Value AddedNon- Non- Non-
Primary primary Total Primary primary Total Primary primary Total
1953-63Case I 113.7 113.7 113.7 121.6 150.1 132.9 138.2 170.6 151.1Case II 111.3 122.7 113.7 121.6 150.1 136.2 135.!4 184.2 154.8Case III 111.3 122.7 113.7 121.6 150.1 141.9 135.4 184.2 161.3
1963-68Case I 106.9 106.9 106.9 116.9 103.9 111.2 125.0 111.1 118.9Case II 96.3 143.6 106.9 116.9 103.9 120.3 112.6 149.2 128.6Case III 96.3 143.6 106.9 116.9 103.9 126.1 112.6 149.2 134.8
1968-73Case I 106.3 106.3 106.3 115.7 118.9 117.4 123.0 126.4 124.8Case II 98.6 124.2 106.3 115.7 118.9 124.4 114.1 147.6 132.2Case III 98.6 124.2 106.3 115.7 118.9 128.5 114.1 147.6 136.6
1973-78Case I 104.1 104.1 104.1 132.1 122.9 126.6 137.5 127.9 131.8Case II 97.7 116.0 104.1 132.1 122.9 131.8 129.1 142.6 137.2Case III 97.7 116.0 104.1 132.1 122.9 133.4 129.1 142.6 138.9
1/ Indices are computed for each period by taking the earlier year as the basis (- 100). Actual valueadded data for the benchmark years 1953, 1963, 1968, 1973 and 1978 refer respectively, to the1952-54, 1962-64, 1967-69, 1972-74 and 1977-79 annual averages calculated from the SIS nationalincome series. Value added figures are measured in constant 1968 prices (at factor cost). Thesectoral labor figures come from the data base of the present study, and cover all persons engaged(including unspecified labor in services). The variant cases are designated as follows:
Case I: Norm productivity differential in the base year; unchanged sectoral composition of laborduring the period.
Case II: Norm productivity differential in the base year; and observed labor reallocation during theperiod.
Case III: Actual data.
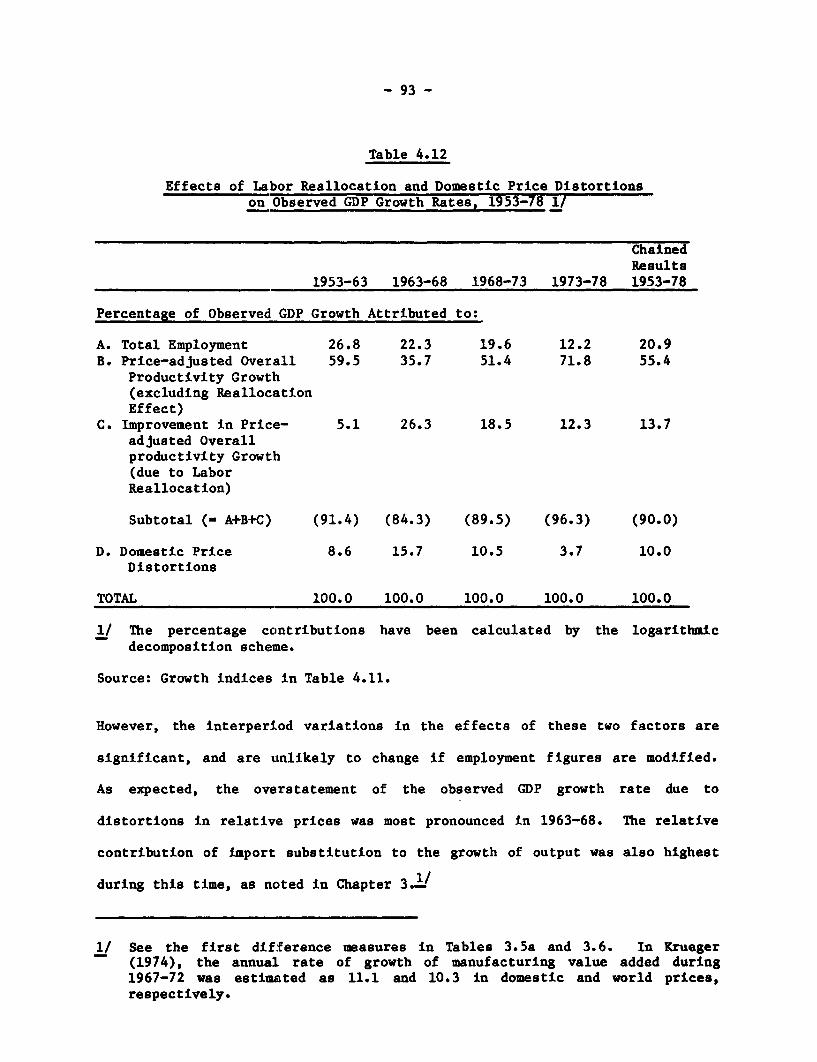
- 93 -
Table 4.12
Effects of Labor Reallocation and Domestic Price Distortionson Observed GDP Growth Rates, 1953-78 1_
ChainedResults
1953-63 1963-68 1968-73 1973-78 1953-78
Percentage of Observed GDP Growth Attributed to:
A. Total Employment 26.8 22.3 19.6 12.2 20.9B. Price-adjusted Overall 59.5 35.7 51.4 71.8 55.4
Productivity Growth(excluding ReallocationEffect)
C. Improvement in Price- 5.1 26.3 18.5 12.3 13.7adjusted Overallproductivity Growth(due to LaborReallocation)
Subtotal (- A+B+C) (91.4) (84.3) (89.5) (96.3) (90.0)
D. Domestic Price 8.6 15.7 10.5 3.7 10.0Distortions
TOTAL 100.0 100.0 100.0 100.0 100.0
1/ The percentage contributions have been calculated by the logarithmicdecomposition scheme.
Source: Growth indices in Table 4.11.
However, the interperiod variations in the effects of these two factors are
significant, and are unlikely to change if employment figures are modified.
As expected, the overstatement of the observed GDP growth rate due to
distortions in relative prices was most pronounced in 1963-68. The relative
contribution of import substitution to the growth of output was also highest
during this time, as noted in Chapter 3±'
1/ See the first difference measures in Tables 3.5a and 3.6. In Krueger(1974), the annual rate of growth of manufacturing value added during1967-72 was estimated as 11.1 and 10.3 in domestic and world prices,respectively.
- 94 -
The relative size of the price distortion effect somewhat declined
in 1968-73, when a semi-open trade strategy was pursued and agricultural
prices were allowed to increase faster than the general price level. The
latter trend continued in 1973-78. Because of the government's subsidy
policies, the terms of trade for agriculture did not deteriorate despite the
sharp rise in world fertilizer prices. Rapid reserve decumulation and heavy
borrowing led to the continued real increase of imports in 1973-77, and caused
a further decline in the premium of industrial imports until the emergence of
payments difficulties in mid-1977.
The relative impact of labor reallocation on observed GDP growth was
also substantial in 1963-68. It shows a time pattern that approximates
(although at different orders of magnitude) the interperiod differences in the
effect of price distortions in 1963-78. However, the trends indicated by
calculation of the Chenery-Syrquin cross-country norms for labor use suggest
that a further restructuring of the labor force is very likely in the future
transitional process. (See Table 2.2.) Consequently, the reallocation of
labor should be expected to continue having an impact (albeit more moderate)
on the future growth of GDP, even after relative price distortions disappear.
The chained results for the entire period, when Turkey's real GDP
increased over four-fold, suggest that approximately 10 percent of the growth
is overstated because of the effect of domestic price distortions, which are
measured in terms of deviations from the intersectoral productivity
differentials inferred from the cross-country structural norms of Chenery and
Syrquin (1975).l/ The estimated price distortion effect on observed GDP
growth is very significant, and suggests that overvalued factor returns and
1/ The chained estimates for the cumulative effects of price distortions onGDP growth are 11.8 and 14.3 percent in 1953-73 and 1963-73, respectively.
- 95 -
incomes exist in the non-primary part of the economy. As a result, the
gradual removal of domestic price distortions and the transition toward trade-
oriented growth imply a slowdown in the rise of average real incomes of non-
primary producers and workers in the adjustment period."1 Given the low
savings propensities of income groups in the primary sector, the changes in
the structure of real incomes could have serious consequences not only for
income distribution, but also for the processes of resources mobilization.
Finally, the downward trend in the relative contribution of
employment to overall value added growth in 1953-78 (as shown in Table 4.12)
indicates the scope and need for larger employment effects in the growth
process of the 1980s. Because of the growing labor surplus in the country,
the generation of productive employment in an increasingly less protected and
more outward-oriented economy will clearly require more attention in policy
planning and project studies.
1/ The length of the adjustment period may be shortened by a vigorous driveto accelerate total factor productivity growth In the economy.
- 96 -
5. STRUCTURAL CHANGE IN THE MANUFACTURING SECTOR
This section provides a closer look at the structural transformation
of Turkish manufacturing compared with the cross-country average patterns in
1953-78, and public and private shares in 1953-73. In addition, the
interindustry pattern of protection that prevailed in the late 1960s is
briefly discussed. Chapter 5 complements the sources of growth analysis, and
serves as a background for the discussion of the basic causes of limited trade
effects in Turkish industrialization in Chapter 6.
A. Actual and Predicted Patterns in Manufacturing Output
As discussed in Chapter 2, the comparison of Turkey's observed
structural characteristics with those predicted for a country of its size and
income level reveals that the actual shares of industrial output, exports and
employment in their respective totals generally lag behind the cross-country
norms, although a substantial catching-up effort took place in 1963-78.
Table 5.1 contrasts Turkey's manufacturing structure with the large
country (L) patterns predicted by the cross-country regressions of Chenery and
Taylor (1968). The latter study shows that the manufacturing development
pattern for large countries (with populations above 15 million) is primarily
determined by the changing composition of domestic demand with rising income,
and that the effects of trade differences are relatively unimportant. The
individual industries are then described as "early," "middle" or 'late" on the
basis of the timing of their essential growth in the process of
industrialization. In the Chenery-Taylor cross-section patterns for large
countries, "early" industries (such as food and textiles) contribute the most
to growth when an economy's per capita income level is below $ 200; while
"middle" industries (such as chemicals, petroleum refining, non-metallic
- 97 -
minerals, rubber and wood products) contribute about 40 percent of the
increase in industrial share at levels between $ 100 and $ 400 (in constant
1960 U.S. dollars). "Late" industries (such as basic metals, machinery, paper
and printing) mainly have an impact above the $ 300 level, which Chenery-
Taylor consider the mid-point in the industrialization process. In the
calculation of the predicted shares for Turkey, per capita income levels for
the benchmark years 1953, 1963, 1973 and 1978 have been estimated as $ 176, $
216, $ 318 and $ 382, respectively, in 1960 U.S. dollars.L/
The non-uniform deviation of domestic prices from world prices in
various Turkish manufacturing industries may effect the comparison of actual
and predicted shares. The comparatively larger domestic world price
differentials in metal fabricating and intermediate goods production probably
lead to an overstatement of the transition from light to heavy industries in
Turkey. (See, e.g., the nominal and effective rates of protection estimated
for 1968 in Table 4.4.) Consequently, the changes observed in actual shares
(based on value added figures measured in current producer prices) should be
interpreted broadly in qualitative terms.2/
1/ The Chenery and Taylor regression equations for subsector shares have thefollowing form:Xi - a + B1 ln Y + 02(ln y) + ylnN + celn ep + e2ln cmwhere Xi - value added per capita in sector;
y - per capita GNP (in 1960 dollars) at factor costN - population in millionsep- share of primary exports in GNPem share of manufactured exports in GNP
Remarks: (i) e and em are predicted values from the large countryregressions; and a, Pl, 02* Y, el and e2 are estimated coefficients.
(ii) The vaLues of y are initially estimated in 1964 dollars(see footnote 2, Chapter 2; and Table 1.1), and subsequently switched to 1960dollars using the US Wholesale Price Index.
2/ The actual value added shares expressed in terms of current douesticfactor cost result in somewhat smaller shares for basic and lightintermediates, and larger shares for machinery and related industries.

- 98 -
According to Table 5.1, in 1953 Turkey lagged substantially behind
the cross-country norms in all intermediate goods industries, while exceeding
the norms in food, textile, and machinery and allied industries. In 1963, the
actual shares of textiles, basic intermediates and machinery sectors were
comparable to the typical large country averages, with food processing
surpassing the norms and light intermediates (particularly wood and paper
products) falling markedly below the predicted proportions. The observed
transition from 1963 to 1973 is more striking, with a pronounced fall in the
share of food processing; a significant rise in the share of machinery and
transport equipment industries; and gradual improvements in the shares of the
light and basic intermediate goods industries.
The establishment of new branches specializing in consumer durables
production (including passenger cars) is the main factor behind the
particularly large share of industries grouped under the heading of machinery
production in 1973 and 1978. The latter were basically in the form of assembly
operations heavily dependent on the imports of parts and components at
concessional tariffs. However, their final products were strongly protected
by high tariff walls and quantitative restrictions. The actual shares in 1978
were strongly affected by the cyclical position of the economy, which was
weakened by severe shortages of oil and non-oil imports and output disruptions
in the chemicals and petroleum refining subsectors.
Using the cross-country framework developed by Chenery and Taylor
(1968) as a basis, the characteristics of the transformation of Turkish
manufacturing in 1953-78 may be summarized as follows:
(1) The transition within Turkish manufacturing closely follows the
structural pattern predicted for a country of Turkey's size and income level
in 1953-73. Primarily in response to the changing composition of domestic
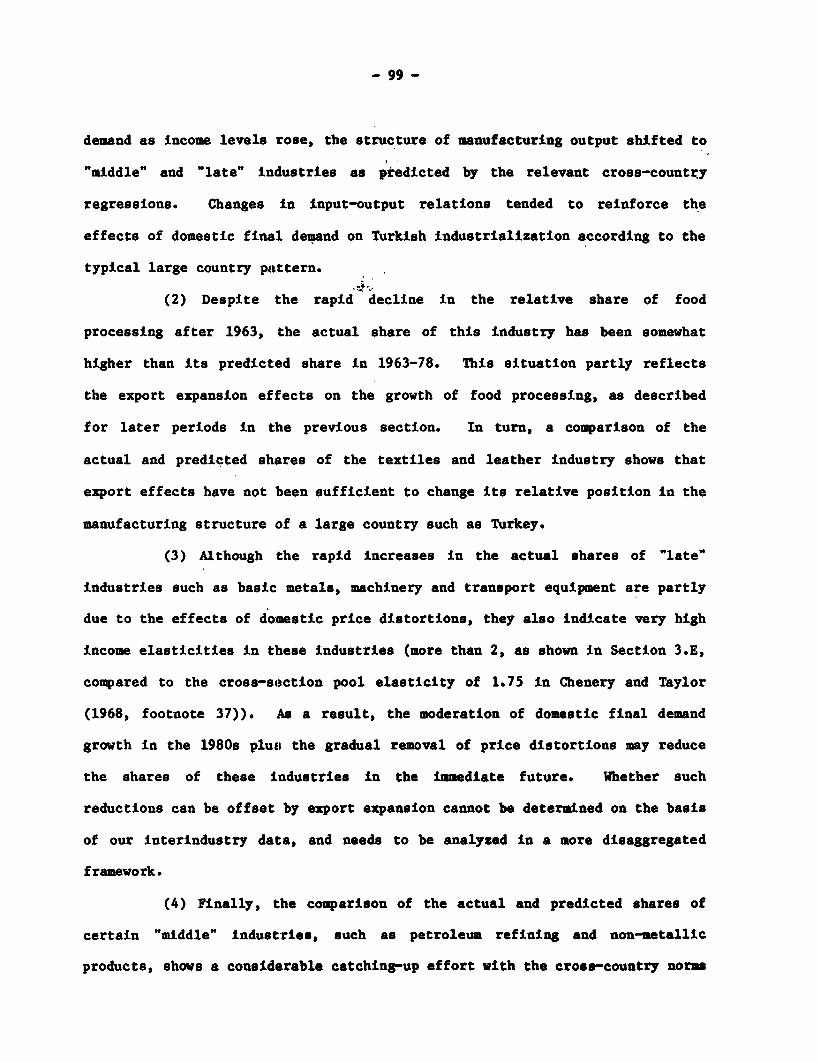
- 99 -
demand as income levels rose, the structure of manufacturing output shifted to
'middle" and "late" industries as predicted by the relevant cross-country
regressions. Changes in input-output relations tended to reinforce the
effects of domestic final demand on Turkish industrialization according to the
typical large country pattern.
(2) Despite the rapid decline in the relative share of food
processing after 1963, the actual share of this industry has been somewhat
higher than its predicted share in 1963-78. This situation partly reflects
the export expansion effects on the growth of food processing, as described
for later periods in the previous section. In turn, a comparison of the
actual and predicted shares of the textiles and leather industry shows that
export effects have not been sufficient to change its relative position in the
manufacturing structure of a large country such as Turkey.
(3) Although the rapid increases in the actual shares of "late"
industries such as basic metals, machinery and transport equipment are partly
due to the effects of domestic price distortions, they also indicate very high
income elasticities in these industries (more than 2, as shown in Section 3.E,
compared to the cross-section pool elasticity of 1.75 in Chenery and Taylor
(1968, footnote 37)). As a result, the moderation of domestic final demand
growth in the 1980s plusi the gradual removal of price distortions may reduce
the shares of these industries in the immediate future. Whether such
reductions can be offset by export expansion cannot be determined on the basis
of our interindustry data, and needs to be analyzed in a more disaggregated
framework.
(4) Finally, the comparison of the actual and predicted shares of
certain "middle" industries, such as petroleum refining and non-metallic
products, shows a considerable catching-up effort with the cross-country norms
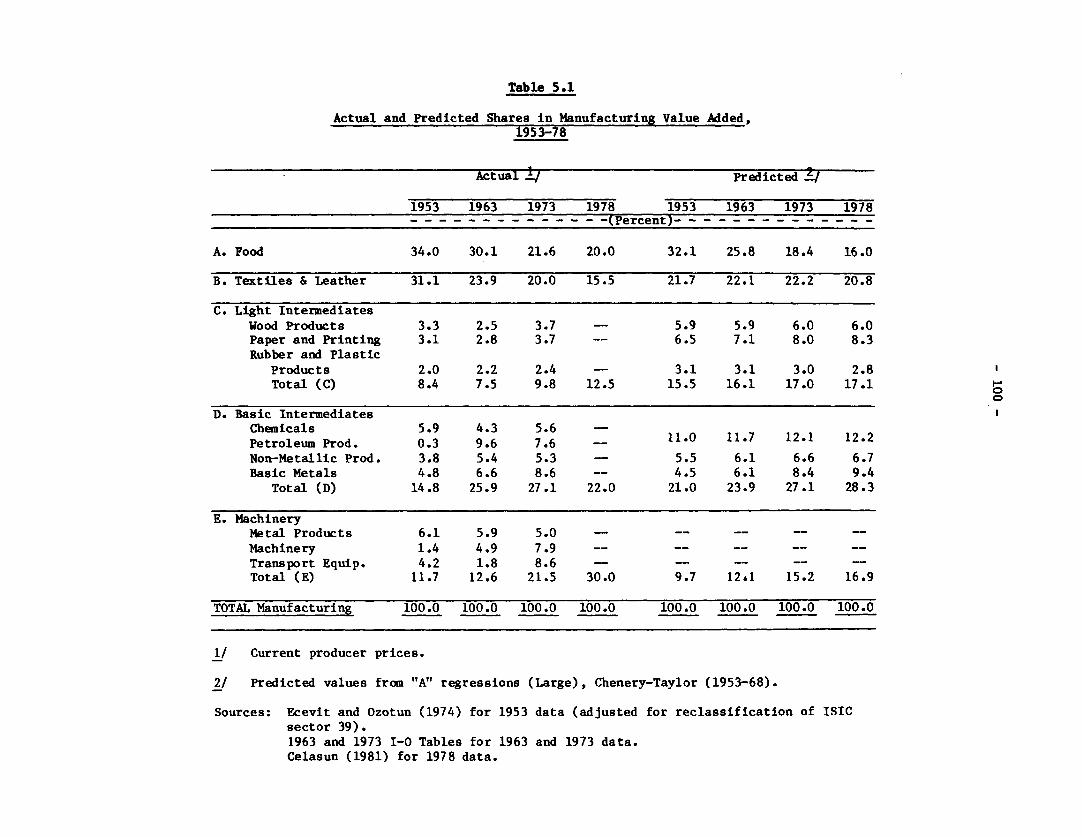
Table 5.1
Actual and Predicted Shares in Manufacturing Value Added,1953-78
Actual -7 Predicted
1953 1963 1973 1978 1953 1963 1973 1978
- - - - - - - - - - - - - -(Percent)…- - - - - - - - - - - - -
A. Food 34.0 30.1 21.6 20.0 32.1 25.8 18.4 16.0
B. Textiles & Leather 31.1 23.9 20.0 15.5 21.7 22.1 22.2 20.8
C. Light IntermediatesWood Products 3.3 2.5 3.7 - 5.9 5.9 6.0 6.0
Paper and Printing 3.1 2.8 3.7 -- 6.5 7.1 8.0 8.3
Rubber and PlasticProducts 2.0 2.2 2.4 - 3.1 3.1 3.0 2.8
Total (C) 8.4 7.5 9.8 12.5 15.5 16.1 17.0 17.1
D. Basic IntermediatesChemicals 5.9 4.3 5.6 -
Petroleum Prod. 0.3 9.6 7.6 __ 11.0 11.7 12.1 12.2
Non-Metallic Prod. 3.8 5.4 5.3 - 5.5 6.1 6.6 6.7
Basic Metals 4.8 6.6 8.6 -- 4.5 6.1 8.4 9.4
Total (D) 14.8 25.9 27.1 22.0 21.0 23.9 27.1 28.3
E. MachineryMetal Products 6.1 5.9 5.0 -- -- -- -- -
Machinery 1.4 4.9 7.9 -- -- -- -- --
Transport Equip. 4.2 1.8 8.6 - -- -- -- -
Total (E) 11.7 12.6 21.5 30.0 9.7 12d1 15.2 16.9
TOTAL Manufacturing 100.0 100.0 100.0 100.0 100.0 100.0 100.0 100.0
1/ Current producer prices.
2/ Predicted values from "A" regressions (Large), Chenery-Taylor (1953-68).
Sources: Ecevit and Ozotun (1974) for 1953 data (adjusted for reclassification of ISIC
sector 39).1963 and 1973 I-0 Tables for 1963 and 1973 data.
Celasun (1981) for 1978 data.
- 101 -
in 1953-63, but relatively more moderate expansion after 1963. However, the
comparative figures in Table 5.1 also indicate that significant time lags
occurred in the introduction and/or expansion of other "middle' industries,
such as paper, printing and rubber products. The relatively small proportions
of output in total manufacturing for a number of "middle" industries poses a
resource allocation problem, as a result of the highly capital-intensive
nature of their fixed investments (illustrated by Table 4.7). Yet, despite
their rapidly expanded shares in manufacturing fixed investment, basic
intermediate industries have contributed inadequately to import substitution
and employment creation, as shown in Chapters 3 and 4. These two related
problems are briefly considered below in terms of public and private sector
shares.
B. Patterns of Public and Private Sector Shares in Turkish Manufacturing
In Turkey's recent economic history, public enterprises have played
a significant role in the growth and structural change of the manufacturing
sector. Established in the 1930s as a temporary institutional vehicle for
industrial growth, the public enterprise sector has, nevertheless, become
firmly entrenched in the national economy, and it serves a variety of economic
and non-economic objectives pursued by the government. As analyzed in detail
elsewhere (Walstedt, 1980), because public and private enterprises in Turkish
manufacturing have never been sufficiently integrated under common rules of
pricing and allocation in the factor and product markets, there is a deeply
rooted dualism in the country's industrial development.
Tables 5.2 and 5.3 present the estimated relative shares of the
public and private sectors in manufacturing value added and investments,
respectively, at approximately the same level of disaggregation discussed in
Table 5.2
Public and Private Sector Shares in Manufacturing Value Added,
1953-72AL/
1953 1963 1972
Public Private Public Private Public Private
Large Small Large Small Large Small
- - - - - - - - - - - - - - - - - (Percent) - - - - - - - - - - - - - - - - -
A. Food 58.0 24.1 17.9 56.3 26.4 17.3 59.3 26.5 14.2
B. Textiles & Leather 41.4 38.1 20.5 19.5 51.0 29.5 15.5 57.6 26.9
C. Light IntermediatesWood Products 10.0 16.7 73.3 16.8 15.0 68.2 11.2 18.5 70.3
Paper 85.4 4.5 10.1 87.2 5.3 7.5 80.8 14.9 4.3
Printing 9.4 55.1 35.5 8.6 62.6 28.8 10.4 66.1 23.5
Rubber - 94.4 5.6 - 86.7 13.3 -- 89.5 10.5
Total (C) 22.0 37.4 40.6 31.9 29.2 38.9 29.0 37.3 33.7
D. Basic IntermediatesChemicals 8.8 64.5 26.7 30.2 61.3 8.5 29.6 66.6 3.8
Petroleum Prod. 100.0 -- -- 35.7 64.3 -- 49.1 50.9 --
Non-Metallic Prod. 13.3 60.5 26.2 26.9 55.5 17.6 21.3 63.9 14.8
Basic Metals 95.0 5.0 -- 87.2 12.8 -- 82.2 17.8 --
Total (D) 40.3 42.5 17.2 43.9 49.9 6.2 50.9 46.0 3.1
E. MachineryMetal Products 30.8 19.6 49.6 12.8 40.2 47.0 8.6 47.5 43.9
Machinery 12.6 23.3 64.1 11.2 67.2 21.6 9.7 72.4 17.9
Transport Equipment 76.1 3.3 20.6 42.9 19.6 37.5 34.4 42.2 23.4
Total (E) 44.8 14.2 41.0 19.5 42.7 37.8 18.7 53.5 27.8
TOTAL Manufacturing 45.4 31.1 23.5 34.8 40.7 24.5 36.6 44.9 18.5
1/ Shares computed in current producer prices; "small private" includes rural and/or private small
firms with less than 10 workers.
Source: Ecevit and Ozotun (1974), adjusted for modifications in sector classification.
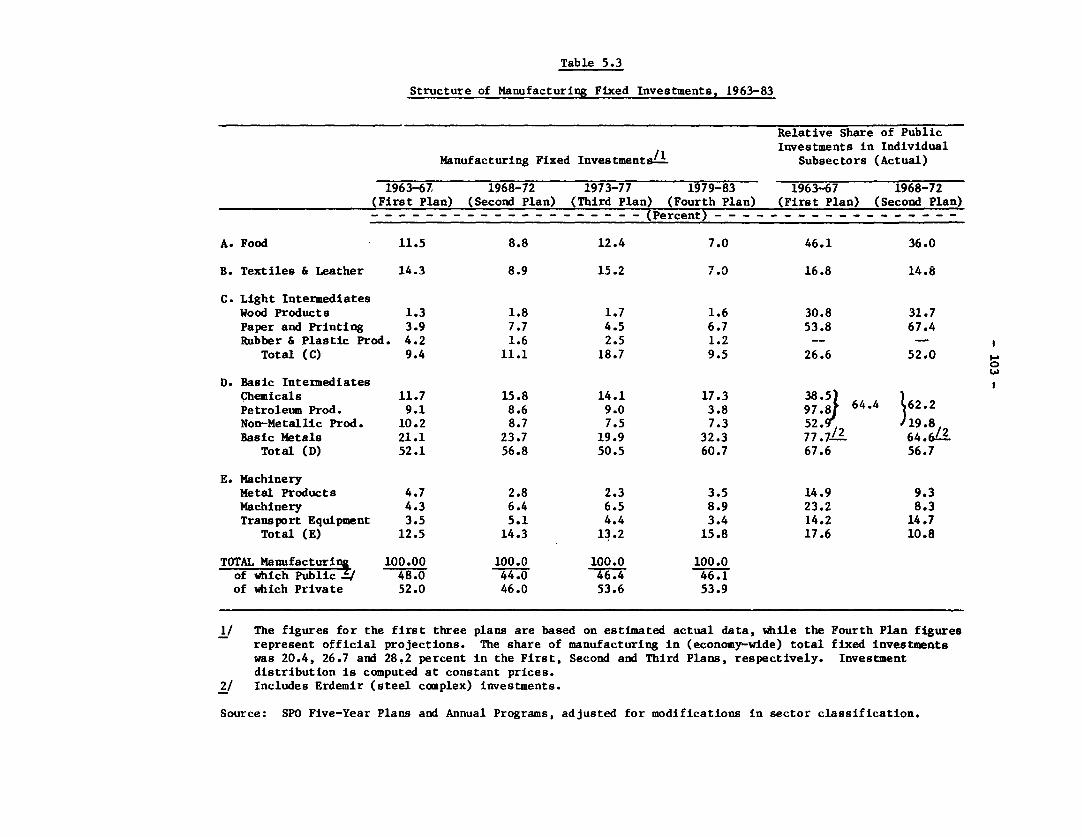
Table 5.3
Structure of Manufacturing Fixed Investments, 1963-83
Relative Share of PublicInvestments in Individual
Manufacturing Fixed Investments/' Subsectors (Actual)
1963-67 1968-72 1973-77 1979-83 1963-67 1968-72(First Plan) (Second Plan) (Third Plan) (Fourth Plan) (First Plan) (Second Plan)- - - - - - - - - - - - - - - - - - - - (Percent) - - - - - - - - - - - - - - - - - -
A. Food 11.5 8.8 12.4 7.0 46.1 36.0
B. Textiles & Leather 14.3 8=9 15.2 7.0 16.8 14.8
C. Light IntermediatesWood Products 1.3 1.8 1.7 1.6 30.8 31.7Paper and Printing 3.9 7.7 4.5 6.7 53.8 67.4Rubber & Plastic Prod. 4.2 1.6 2.5 1.2 -- --Total (C) 9.4 11.1 18.7 9.5 26.6 52.0
D. Basic IntermediatesChemicals 11.7 15.8 14.1 17.3 38.65Petroleum Prod. 9.1 8.6 9.0 3.8 97.81 6 I62Non-Metallic Prod. 10.2 8.7 7.5 7.3 52.9 J19.8Basic Metals 21.1 23.7 19.9 32.3 77.7/2 64.6/2Total (D) 52.1 56.8 50.5 60.7 67.6 56.7
E. MachineryMetal Products 4.7 2.8 2.3 3.5 14.9 9.3Machinery 4.3 6.4 6.5 8.9 23.2 8.3Transport Equipment 3.5 5.1 4.4 3.4 14.2 14.7Total (E) 12.5 14.3 13.2 15.8 17.6 10.8
TOTAL Manufacturing 100.00 100.0 100.0 100.0of which Public .4 48.0 44.0 46.4 46.1of which Private 52.0 46.0 53.6 53.9
1/ The figures for the first three plans are based on estimated actual data, while the Fourth Plan figuresrepresent official projections. The share of manufacturing in (economy-wide) total fixed investmentswas 20.4, 26.7 and 28.2 percent in the First, Second and Third Plans, respectively. Investmentdistribution is computed at constant prices.2/ Includes Erdemir (steel complex) investments.
Source: SPO Five-Year Plans and Annual Programs, adjusted for modifications in sector classification.
- 104 -
Chapter 3_1/
The most significant trends in the evolving patterns of public and
private ownership in manufacturing are the following:2/
(1) From 1953-63, the private share in total manufacturing value
added increased sharply due to the rapid expansion of private output in
textiles, machinery (particularly metal products, agricultural equipment and
vehicle assembly), petroleum products (mainly due to foreign private capital)
and, to a minor extent, in the basic metals industry. Within the machinery
group, the expansion of the relative share of large companies was very
significant. In chemicals (e.g., pharmaceuticals) and non-metallics, a shift
from small to larger firms was also apparent, while the private shares
declined. Public shares increased in chemicals, non-metallics (e.g., cement),
sugar (in food processing), and wood products, but decreased substantially in
textiles and machinery.
Both the disaggregated estimates of the sources of growth (shown in
Table 3.9) and the share figures indicate that the growth of the private
manufacturing industry in 1953-63 was very rapid, and that it benefited from
the contributions of import substitution in the machinery, textiles and rubber
products branches. During this time, an urban entrepreneurial class emerged,
and it played an increasing active political as well as economic role in the
1/ Because of the numerous organizational forms for public enterprises, andtheir extensive participation in the private sector, there are no fixedrules to partition industrial output between private and public shares.While Table 5.2 adheres to the practice of the SIS in reporting sectoralshares, Table 5.3 uses the SPO data sources, adjusted for consistency withTable 5.2 in the treatment of the basic metals subsector. (The Erdemirsteel complex is included in the public sector, although it is nominally aprivate enterprise, because it was established primarily with governmentcapital).
2/ See Korum (1975) for a comparative analysis of public and privateindustrial structures within the framework of Turkish I-0 tables.
- 105 -
subsequent periods. The private sector initiatives in the 1950s received
substantial support from the newly established institutions, such as the
Turkish Industrial Development Bank (funded by the World Bank), and benefited
from the government's ad hoc protection and subsidy measures.
(2) From 1963-73, policy interest in public enterprises as a vehicle
of industrial growth resumed, particularly in capital-intensive intermediate
goods industries. The relative scope of the private sector was increased
mainly in textiles, food processing, rubber products, chemicals (the less
capital-intensive categories), and machinery and related industries. In most
subsectors, the sustained rapid growth of private manufacturing value added
and investments was associated with shifts in the size of private
establishments.l/
(3) The sources of growth estimates discussed in Chapter 3 (Table
3.9), together with the value added shares shown in Table 4.2 suggest a
significant pattern. The growth of private manufacturing was more rapid for
subsectors in which domestic final demand expansion played an above average
role. Public shares typically increased in subsectors in which technological
change had a more than average effect on the growth process. The public
sector mainly attempted to address the problem of catching-up with the cross-
country norms in the "middle" industries, which met the rising intermediate
demand in all major sectors of the economy. In turn, export expansion effects
on the growth of food processing (involving lower stages of processing of
tobacco and dried fruits) largely occurred in public and semi-public units,
1/ Tekeli et al (1980) provide an extensive set of concentration measures forTurkish manufacturing In 1971-77. In about 65 percent of 115 four-digitprivate industries, the four-plant concentration ratio was above 50percent (in terms of the sales value). Also, the concentration ratios andintensity of electricity consumption together explain about 20 percent ofthe variation In the price-cost margins at the four-digit industry level.
- 106 -
while the export-oriented side of production growth in textiles was achieved
almost entirely by private firms toward the end of the 1963-73 period.
(4) The structure of fixed investments in manufacturing underwent
sequential shifts in the two consecutive five-year periods from 1963-73. The
shares of both light and basic intermediates in total manufacturing
investments increased during the period. The public sector took the lead in
paper, petroleum products, basic chemicals and metals. The investment shares
listed in Table 5.3 show the expanding scope of private fixed investments in
food processing (of non-monopoly goods), textiles, non-metallics, and
machinery and related industries (primarily consumer durables and vehicle
assembly plants). The subsector shares of manufacturing fixed investments
achieved under the Third Plan (1973-77) and projected in the Fourth Plan
(1979-83) suggest that these trends continued after 1973. The basic inter-
mediates group is absorbing more than 50 percent of the total investable
resources in the manufacturing sector through the implementation of public
enterprise projects.
Table 5.4 provides 1968 data on the structure of protection
estimated by Olgun (1975). In 1968 the economy was in a severely import-
constrained cyclical position, and comparisons of domestic and world prices
may be unreliable in some sectors (e.g., in agriculture and non-electrical
machinery, as noted by Olgun).
Nevertheless, the estimates indicate four salient characteristics of
the system of protection that prevailed in the 19609 and, to a considerable
extent, in the 1970s. First, the system of protection involved significant
discrimination between the primary and manufacturing sectors, which had
effective protection averaging 197 and 314 percent, respectively. The effects
of relative price distortions resulting from such discrimination have been
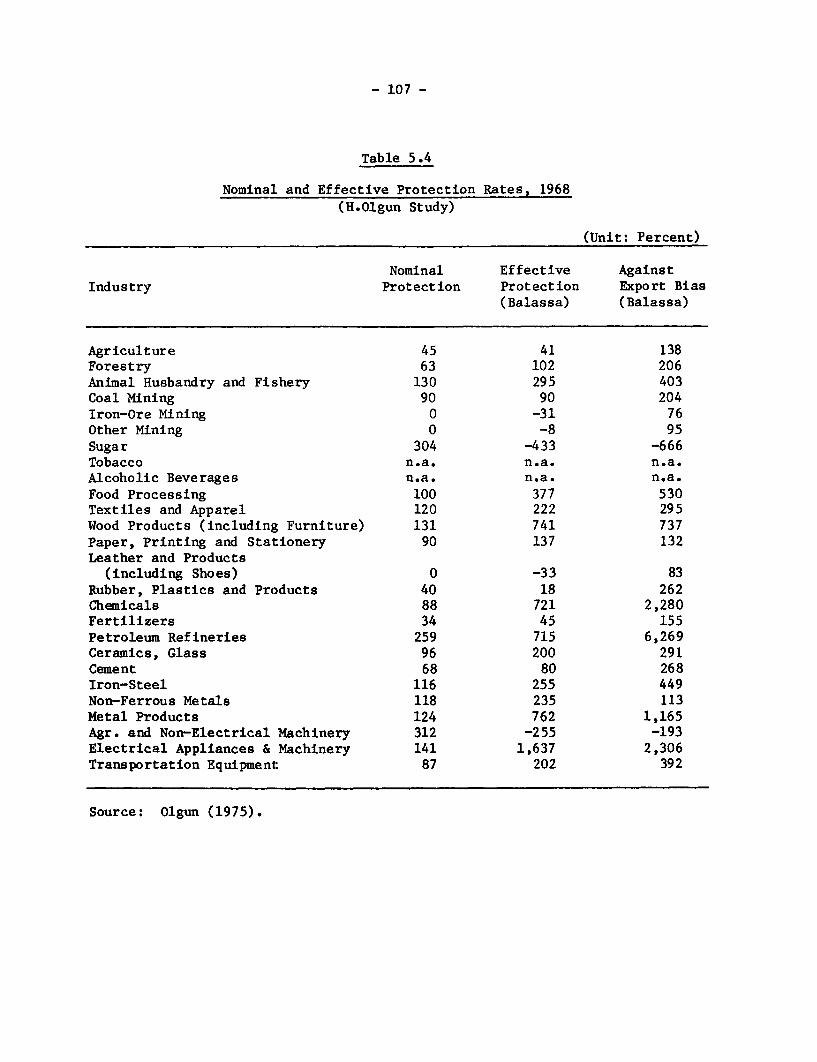
- 107 -
Table 5.4
Nominal and Effective Protection Rates, 1968
(H.Olgun Study)
(Unit: Percent)
Nominal Effective AgainstIndustry Protection Protection Export Bias
(Balassa) (Balassa)
Agriculture 45 41 138Forestry 63 102 206Animal Husbandry and Fishery 130 295 403Coal Mining 90 90 204Iron-Ore Mining 0 -31 76Other Mining 0 -8 95Sugar 304 -433 -666Tobacco n.a. n.a. n.a.Alcoholic Beverages n.a. n.a. n.a.Food Processing 100 377 530Textiles and Apparel 120 222 295Wood Products (including Furniture) 131 741 737Paper, Printing and Stationery 90 137 132Leather and Products
(including Shoes) 0 -33 83Rubber, Plastics and Products 40 18 262Chemicals 88 721 2,280Fertilizers 34 45 155Petroleum Refineries 259 715 6,269Ceramics, Glass 96 200 291Cement 68 80 268Iron-Steel 116 255 449Non-Ferrous Metals 118 235 113Metal Products 124 762 1,165Agr. and Non-Electrical Machinery 312 -255 -193Electrical Appliances & Machinery 141 1,637 2,306Transportation Equipment: 87 202 392
Source: Olgun (1975).
- 108 -
analyzed in Chapter 4.E in the context of overstated value added growth rates.
Second, the escalation in protection for the subsectors from lower to higher
stages of fabrication was substantial, as noted in the cases of agriculture
and food processing, and basic metals and metal products. Third, the wide
differences between nominal protection rates (based on price comparisons) and
nominal tariff rates (based on actual import taxes, not separately shown in
the table) reflected the presence of large import premia in all industries due
to quantitative import restrictions. Fourth, various export promotion schemes
did not remove the bias against exports, which is measured in Table 4.4 as the
percentage of excess value added realized in production for the domestic
market over value added generated in production for exports. ThIus, the
protectionist system reinforced the effects of domestic demand expansion as a
source of growth in manufacturing in general, and in private-led machinery and
related industries in particular.
The ownership patterns in Turkish manufacturing concerning the
relative shares of firms with foreign partnership are shown in Table 5.5 for
1973Ž11 The gross revenue and employment shares of firms with foreign
partnership were relatively high in those subsectors which had grown rapidly
in domestic market-oriented, but import-dependent ways, as in the case of
vehicle assembly, electrical appliances, chemical and pharmaceuticals. Minor
exceptions were certain non-metallic (e.g., earthware) projects. Foreign
private capital has also responded to the structure of incentives, which
favored inward-looking patterns of development, characterized by an increasing
dependence on imported current inputs.
1/ Foreign partnership in petroleum refining is not reported in Table 5.5.
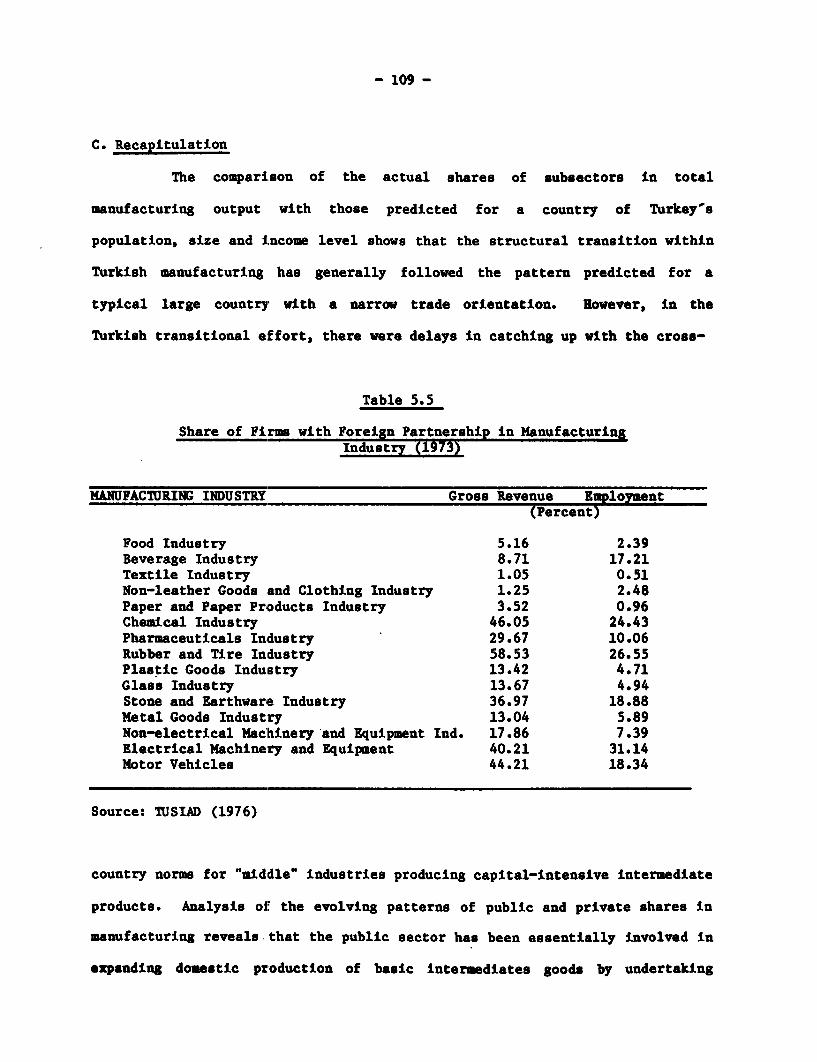
- 109 -
C. Recapitulation
The comparison of the actual shares of subsectors in total
manufacturing output with those predicted for a country of Turkey's
population, size and income level shows that the structural transition within
Turkish manufacturing has generally followed the pattern predicted for a
typical large country with a narrow trade orientation. However, in the
Turkish transitional effort, there were delays in catching up with the cross-
Table 5.5
Share of Firms with Foreign Partnership in ManufacturingIndustry (1973)
MANUFACTURING INDUSTRY Gross Revenue Employment(Percent)
Food Industry 5.16 2.39Beverage Industry 8.71 17.21Textile Industry 1.05 0.51Non-leather Goods and Clothing Industry 1.25 2.48Paper and Paper Products Industry 3.52 0.96Chemical Industry 46.05 24.43Pharmaceuticals Industry 29.67 10.06Rubber and Tire Industry 58.53 26.55Plastic Goods Industry 13.42 4.71Glass Industry 13.67 4.94Stone and Earthware Industry 36.97 18.88Metal Goods Industry 13.04 5.89Non-electrical Machinery and Equipment Ind. 17.86 7.39Electrical Machinery and Equipment 40.21 31.14Motor Vehicles 44.21 18.34
Source: TUSIAD (1976)
country norms for "middle" industries producing capital-intensive intermediate
products. Analysis of the evolving patterns of public and private shares in
manufacturing reveals that the public sector has been essentially involved in
expanding domestic production of basic intermediates goods by undertaking
- 110 -
highly capital-intensive investment projects, while private firms have been
mainly attracted to the development of industries in which domestic final
demand effects have been the principal source of growth.
Although the overall strategy of structural change in Turkish
manufacturing resembles the typical large country pattern predicted by cross-
country regressions, this analysis indicates two sets of problems at the
implementation and policy levels. The first is related to the steadily rising
capital intensity of public investments in basic intermediate goods
industries, which have absorbed a large proportion of available funds for
manufacturing development in the country.1/ To a considerable extent, the
unduly high capital-output ratios of public manufacturing investments reflect
inadequate planning at the project level, resulting in investable resources
thinly spread over a numerous ongoing projects. The long gestation lags in
public manufacturing investments have sharply reduced their potential
contribution to the trade adjustment process in the mid- and late 1970s.
The second set of problems is connected with the protectionist
system, which featured an anti-export bias in the past, and provided greater
effective protection at higher stages of fabrication. The consequence has
been the emergence of high-cost private firms that produce equivalent products
for the domestic market under different technological agreements, and that
exhibit no particular tendencies for the horizontal and/or vertical
specialization needed for trade-oriented sustainable growth in the 1980s.
These broad conclusions indicate the need for more detailed research on new
guidelines for future rationalization and restructuring of the Turkish
manufacturing sector.
1/ See Walstedt (1980, section 3) for additional relevant data.
6. TOWARD TRADE-ORIENTED GROWTH
AND STRUCTURAL CHANGE IN THE 1980s
The previous chapters have analyzed the sources of growth and
structural change in Turkey's recent economic history, and evaluated them in
the context of the average country patterns. Internal factors (domestic final
demand and technological change) have been shown to account for about 85
percent of the shifts in the productive structure during 1953-73. Export
expansion and import substitution in varying proportions were the remaining
factors. While export effects on growth and structural change became somewhat
more pronounced in 1968-73, import substitution effects were more important in
1953-68, but showed a sharp decline in the early 1970s.
After the 'easier" stage of import substitution was completed by the
end of the 1960s, the import intensity of intermediate inputs steadily
increased in the 1970s (notwithstanding the shift in fixed investments toward
heavy industry). Along with stagnant export growth, it contributed to the
massive external imbalance in the economy.l/ As a result, the narrow trade
orientation in Turkey"s transitional effort could no longer be sustained in
the aftermath of the external shocks of the mid-1970s. This paper finally
discusses the major causes of limited trade effects observed in Turkish
industrialization, and considers the prospects for transition toward more
outward orientation in the 1980s.
A. Trade Effects on Turkish Industrialization
The principal factors that limited the trade orientation of Turkish
industrialization after 1950 are broadly reviewed in terms of the country's
1/ See Balassa (1981),
- 112 -
size and natural endowments, institutional conditions, and economic policies.
(1) Large Country Characteristics and Natural Endowments
Chenery's empirically based cross-country comparisons show that the
sources of growth In large countries (i.e., a population over 15 million in
1960) differ from the average pattern in that the effects of domestic final
demand and technological change are more pronounced in aln major sectors. l/
In a typical large country, greater internal demand, relatively more diverse
natural resources, and higher internal transport costs induce an essentially
domestic market-or-iented growth process, with exports accounting for only 15
percent of the (gross) output change in manufacturing at the Turkish income
levels observed in 1953-73.
The Turkish situation nearly represents the extreme case of a semi-
closed (rather than a typical) large country identified in Chenery's cross-
section analysis. This study has shown that export expansion as a source of
growth contributed about 2.3 and 8.2 percent to the manufacturing output
increases in 1953-63 and 1963-73, respectively. In addition, import
substitution lost its relative importance after contributing significantly in
the earlier periods of industrialization. The timing of allocational
adjustments toward export expansion in general, and promotion of industrial
exports in particular has lagged far behind the normal transition expected for
a country of Turkey's size and income level during the past two decades.
The delayed shift toward normal export orientation may be partly
explained by the natural resource endowment of the country. In certain
countries which experienced export-led industrialization (such as Japan and
Korea), natural resource limitations restricted output expansion in the
1/ See Chanery (1979, Chapter 3).
- 113 -
primary sectors, necessitated substantial primary imports, and thereby
fostered the attitude that exports were essential for survival and sustained
economic growth. Industrial policies were framed in this atmosphere to
exploit the country's comparative advantage vigorously by emphasizing the
accumulation of skills and diffusion of new technologies.
In the Turkish case, the apparent availability and untapped
potential of the natural resources have been generally seen as promising
factors in Turkey's :Long-term development. Consequently, the prevalent
attitudes toward the natural resource potential of Turkey led to a policy
outlook in which outward-looking industrialization did not appear as
necessary. However, after experiencing domestic hardships in adjusting to
higher prices of imported oil in the late 1970s, more realistic public
attitudes have started to emerge regarding the need to complement primary
exports with export-oriented non-primary activities (including service as well
as manufactured exports).
Furthermore, the unprecedented growth of the population and the
rural influx to the urban areas after 1950 also created an environment in
which the internal market expanded rapidly for a wide range of manufactured
products, which could be produced domestically behind high tariff walls."/
The continual changes in the rural-urban mix of the population produced
compositional shifts in consumer demand, generated additional domestic
requirements for processed consumer goods, and thus contributed to the
expansion of home market-oriented manufacturing output. The large
1/ At this point, we merely point out the demand effects of demographicphenomena, and do not mention other direct and indirect effects on savingsrates, labor marketsl, public services, and pressures on rural and urbanland. Tuncer (1976) provides a thorough review of demographic aspects insocio-economic development, and examines the determinants of the Turkishfertility rates in a cross-sectional and time-series study.
- 114 -
inequalities in income distribution (with a Gini coefficient of around 0.55)
also created a bias in the structure of private consumption demand for
consumer durables. This led to considerable opportunities for high-cost
import substitution in metal fabricating industries.l/
(2)Institutional Conditions
The political conditions in the earlier periods of the Republic
produced deep-seated non-economic motivation for long-term development
policies. The unforgotten experiences of the Ottoman capitulations (involving
the loss of tax and tariff autonomy in some instances), and the difficult
negotiations for the settlement of old debts contributed to the growth of
economic nationalism. Preserving national sovereignty and achieving economic
independence (often interpreted as "self-sufficiency") became the priorities
of the national governments. These long-term tendencies were apparent in
certain attitudes toward development, such as the reluctance to allow large-
scale foreign private investment, the inclination to use a restrictive trade
regime, and the preference for protected and inward-oriented industriali-
zation.
The central concern with "self-sufficiency' also led to state
ownership in those sectors of the economy which were perceived as strategic by
the government. Lacking the preconditions of middle-class based capitalist
growth in the industrial and social overhead sectors, public authorities
introduced the etatist approach to development in the 1930s, which led to the
formation of a large state economic enterprise system (SEEs) to complement
1/ Import substitution for consumer durables appears to have been less in theexport-led industrialization of Korea, where there is a more equitabledistribution of income (with a Gini coefficient of around 0.36 in 1971).See Westphal and Kim (1974) and Kim (1978).
- 115 -
private activity in the! economy..Y
Pioneers in the development of key industries in the earlier
periods, the public enterprises increasingly became institutional instruments
for regional development, employment expansion and extra-market interventions
on social-political grounds. However, because their operational and financial
performances were generally inadequate, steadily rising budgetary transfers
and deficit financing from the Central Bank were required. Without a
reasonably well-functioning price mechanism and/or efficient public planning,
Turkey's mixed economy eventually became dualistic, and featured non-
integrated public and private enterprise subsystems with different types of
resource mobilization and allocation. The failure to build integrative
mechanisms in Turkey's mixed economy (i.e., establishing common rules for
finance, pricing and employment in state and private industrial enterprises)
has caused pervasive (listortions in the structure of savings, costs and
prices, and has thereby created numerous stumbling blocks for the adoption of
a flexible and outward-looking strategy in industrial development.
(3) Economic Policies and The Structure of Protection
The slow pace of the institutional development in Turkey's mixed
economy system (particularly in the area of tax and financial subsystems, SEE
organization, economy-wLde marketing arrangements, and suitably structured
agricultural co-operatives and small ancillary industries) produced a setting
in which governments often formulated and pursued their economic policies in
an ad hoc manner. Until recently, governments relied almost exclusively on
1/ See,e.g., Johnson (1967) and Solis (1971) for discussions of stateownership under economic nationalism in general, and in Mexico,respectively. The genesis and rational of etatism are examined by Okyar(1965). For a more recent analysis of Turkey's state manufacturingenterprises, see Walestedt (1980).
- 116 -
nou-price measures and selective policy means (such as concessional taxes,
import licences, preferential credits and administered prices) rather than
general policy instruments (fiscal, monetary and trade policy, including an
equilibrium rate of exchange) to achieve economy-wide objectives.
While producing some results in specific sectors, the tendency to
use selective measures and direct interventions as a predominant policy
approach created serious problems in the consistency and efficiency of savings
generation and resource allocation in the country. The adverse consequences
of avoiding general policy instruments have been particularly apparent in the
balance of payments. Control of the external accounts through ad hoc measures
proved to be cumbersome as well as counter-productive because the value of a
key policy tool, the foreign exchange rate, was unadjusted. After major
devaluations, the unchecked erosion in the real exchange rate often resulted
in the significant decline of the relative value of incentives for activities
that augmented foreign exchange (i.e., earnings and/or savings), as examined
in detail by Krueger (1974) and Dervis and Robinson (1978) for 1950-70 and
1973-77, respectively .V
The long-term institutional tendencies for inward-looking
industrialization were reinforced by the prolonged use of a semi-closed trade
and exchange rate regime, which discriminated against exports, and accorded
increased rates of effective protection at higher stages of fabrication (as
discussed In the final part of Chapter 5). The real effective exchange rates
provided insufficient incentives for export promotion, while the system of
protection contributed to the development of highly import-dependent private
manufacturing industries, which could be maintained only by massive capital
1/ See also Balassa (1981, Table 4) for the movement of real exchange ratesin 1967-81.
- 117 -
inflows after 1973../
3. Prospects for Transition 2/
Recent Policy Changes
As pointed out in Chapter 1, Turkey's delayed policy response to the
*xternal shocks of the mid-1970s were very costly in term of aggregate growth
losses, hyperinflation and political instability in 1977-80. External trade
disequilibrium was clearly the principal factor behind the economic
dislocations of the late 1970s. Foreign exchange stringency had restricted
the inflow of imports that were required (almost in fixed proportions) for
current production as well as capacity expansions needed for future growth.
Interruptions in growth occurred despite the existence of a sizable parallel
market and illegal imports that were largely financed by workers' remittances
outside official channels.
As shown in this study, the trade imbalances that emerged in the
1970s were mainly of a structural nature. Their gradual elimination required
an effective combination of anticyclical and structural policies in the
medium-run. However, the removal of the trade limit to income growth was
particularly difficult because of, on the one hand, the long-term character of
the supply measures taken to increase primary energy production and reduce oil
imports and, on the other, the increasing technological complexity and capital
intensity of import substitution in intermediate manufactured goods. In an
industrializing economy such as Turkey's, the budgetary, technological and
skill constraints require an increasingly selective approach to import
1/ Krueger (1974, pp.208) shows that Turkey's non-traditional exports werehighly responsive to real exchange rate changes in 1950-69.
2/ The present discussion partly draws on the author's earlier assessments(Celasun, 1980 b).
- 118 -
substitution in its later stages, which results in an alternating sequence of
capacity expansions in the industrial subsectors. Thus, the aggregate import-
output ratio tends to stabilize, if not gradually rise, over time. Accord-
ingly, the possibility of removing the trade bottleneck and resuming self-
sustained growth by further contraction of real aggregate imports was limited
in the late 1970s and will remain limited in the intermediate future. On the
eve of the 1980s, the resumption of growth required, therefore, a decisive
change in development strategy toward higher export orientation and more
efficient import substitution.i/
The policy package that was implemented in early 1980 signified a
determined political effort to set in motion government actions and market
forces to curb hyperinflation, and to initiate a more open development
process.2/ In addition to emphasizing the usual price measures in an IMF-
style stabilization-cum-devaluation program, the policy package introduced a
new set of policies for Turkey's mixed economy system. While lifting the
formal price controls in the private manufacturing industry, and granting a
considerable autonomy to public enterprises in their future pricing decisions,
the new approach assigned a larger role to domestic and foreign private
capital in export promotion and investment (such as in oil and non-oil
mining).
In June 1980, the policy mix was extended by an official decree
which allowed the commercial banks to set their borrowing and lending rates
1/ The evidence for the urgent need to adopt a trade-oriented strategy wasrapidly accumulating by the end of 1979, as discussed in length in Balassa(1979), Wolf (1980) and World Bank (1980).
2/ For detailed reviews of Turkey's stabilization policy experience in 1978-79, and of the 1980 policy package, see Balassa (1981) and Celasun (1980b).
- 119 -
freely, subject to certain constraints on preferential credits and obligations
to contribute to an initerest subsidy fund. The fiscal component of the new
policy framework was strengthened in 1981 by new tax legislation and
restrained public spending. The adoption of a flexible exchange rate policy
(which became more evident in early 1981) has been another cornerstone of the
new policy package.
As expected, the immediate economic effects of the 1980 policy
measures were very mixed, and took the form of the following: (1) a heavy
deflationary impact of monetary restraint and nominal price adjustments; (2)
intensified cost-push pressures on the general price level; (3) a sharp fall
in real wages and labor inrest, as a result; (4) increased capital inflows and
imports; and (5) a slor response from exports initially. The attempts to
implement a restrained wage policy led to numerous strikes, produced
considerable unrest, and resulted in the loss of 7.7 million work days in the
first eight months of 1980, comparing poorly with the 1.15 million work days
lost during 1979. After the military takeover in September 1980, public
sector workers with unsettled wage agreements were granted a tentative raise
of about 70 percent in gross nominal wages, pending formal settlements in 1981
and 1982. The deflationary impact and cost-push effects of the stabilization
measures resulted in a -2.2 percent growth in real GNP, and about a 94.7
percent rise in the Wholesale Price Index 1/
Once industriaL production resumed after the military intervention
and the new policies were strictly implemented (buttressed in 1981 by a tax
reform package), real GNP increased by about 4.4 percent in 1981, while the
1/ The year-on-year rate of inflation was 132 percent in March 1980, but fellto 94.7 percent in December 1980, 38 percent in June 1981, and 27.3percent in November 1981.
- 120 -
year-on-year inflation decelerated sharply to 27.3 percent in November 1981.
The balance of paymnts rapidly improved, with merchandise exports amd
workers' remittances rising to about $4.7 and $2.5 billion in 1981 from $2.8
and $2.1 billion levels, respectively, in 1980. In the external sector, the
particularly encouraging new trends have been the increased product
diversification in exports; the expansion of trading opportunities in the
Middle East; and the growing involvement of the Turkish contractors in the
infrastructure development projects of various oil-surplus countries in the
region.
Apart from the remaining problems (such as SEE reorganization,
rising unemployment and poor distribution of income), the improved
macroeconomic performance in 1981 bolstered general confidence at home and
abroad in the country's ability to halt the deepening crisis, and to switch to
a more viable growth path in the 1980s.
Policy-Making and Planning in the 1980s
When domestic inflation is under control, the formal policy
objectives need to be shifted in a balanced way from price stabilization to
the removal of external disequilibrium and long-term restructuring of the
economy in order to prosote sore employment and better income distribution.
The current account deficits ned to be reduced to historically normal and/or
financially manageable proportions of GNP, while sufficient capacity for
Import growthi to sustain a steady expansion of employment and GNP close to
potential output levels should be developed. This task requires a concerted
social effort to restructure factor allocation and domestic production in
order to maximize the capacity for foreign exchange generation after a
reasonable period of adaptation. The development process needs reorientation
towards trade-improving activities, and requires a more effective integration
- 121 -
of export promotion and import substitution under reduced protection. As
shown in Chapter 4, increased export promotion and employment objectives are
conplesentary because more favorable labor-output ratios characterize the
potentially export-oriented subsectors (including capital goods and consumer
durables).
The transition toward greater trade orientation has significant
implications for Turkey's political economy as well as for economic management
methods in the 1980s, which are discussed in the following paragraphs.
(1) Relative Prices and Incomes
The basic issue in the political realm concerns the design of
socially responsible arrangements for the equitable sharing of sacrifices
required in the adjusltment process. Above all, this process calls for
allocational and distributional changes to affect the transfer of real income
because of the sharply deteriorated terms of trade since the did-1970s. Until
the adoption of the 1980 policy package, the policyakers and organized socio-
economic groups avoided this adjustment through large-scale borrowing abroad,
and excessive monetary (expansion at home.
The assignment of higher priorities to trade-improving and resource
mobilization efforts will lead to the restrained growth of domestic
consumption and higher real prices for tradables and savings, with
corresponding income transfers from the users to the suppliers of scarce
foreign exchange and domestic capital. Both the private firms and the SESs
will be involved in the process of interrelated price and income adjustments,
and will be confronted with changes in the pattern of real profits and
wages. An indicated in Chapter 4.E, the gradual adaptation to world prices in
non-primary product markets is likely to result in the slackening growth of
the previously overvalued factor incomes in the urban areas. Clearly, the
- 122 -
distributional implications of relative price changes are very mixed, and they
require quantitative assessments in the future. A realistic and carefully
phased program is needed to reconcile the equity and growth objectives in the
new economic framework, with an emphasis on employment expansion in labor-
intensive sectors that increase foreign exchange.
(2) Resource Mobilization and Redirection of Investment
To support the 1980-81 policy measures, new financial resources need
to be significantly tapped and quickly directed to trade-improving activities.
Private savings (as reported in the national accounts) have recently exceeded
private investments, and have been partly drafted by the public sector through
the money creation processX The new stabilization measures are designed to
reduce the size of forced savings (or deficit financing) by enlargening the
share of public revenue in GNP, with a corresponding decline in the growth of
private disposable income. With public investments having a larger share in
total investments (as projected in the official programs) and concentrated
mainly in capital-intensive energy and infrastructure projects, the
mobilization and allocation of "rivate savings gain strategic importance in
expanding the production of tradable goods in the economy. As self-financing
in the private manufacturing industry decreases, more energetic efforts will
be required to attract foreign direct investment, and to mobilize workers'
remittances for the financing of export-oriented projects-2
(3) Reforming the Institutional Structure and Policy System
The modified aisa of the new development orientation will require
1/ Gross private savings (including deficit financing) are projected to reach10 to 11 percent of GNP from 1981 onwards.
2/ See Wolf (1980) for an elucidation of the differential effects of varioustypes of capital Inflows in development.
- 123 -
major reforms in policy instruments and in the way they are implemented. In
the policy reform process, a central task concerns the improvement of the
institutional effectiveness of Turkey's mixed economy, which has a large state
enterprise subsystem (SEEs) that complements private business activity. As
noted earlier, the basic problem is not the large share of the SEEs, but
rather the dualism of the mixed economic system, which is characterized by
different types of economic behavior in its subsystems (public and private).
Instead of focusing solely on the legal and administrative aspects
of the SEEs, a series of steps may be taken to rationalize the economic basis
of the SEE decision-making procedures by insisting on the calculation of
economic returns and real subsidies (or the subsidy equivalent of effective
protection). The subsidies may be specified annually and be subject to ex
post evaluations by public representatives. / To further strengthen the
institutional base of Tlurkey's mixed economy, more efficient arrangements are
required for the operation of financial and labor markets. The range of
financial instruments available to the public needs to be extended, while
measures should be taken to reduce the large spread that exists between the
relevant interest rates for borrowers of funds and suppliers of small savings.
In the difficult field of industrial relations, an early return to the system
of collective bargaining would help mobilize broad labor support for the new
development strategy.
If the functioning of the price mechanism improves, a more balanced
combination of general and selective instruments may be arranged in the
government's policy package. For example, a crucial move would be the
preparation of a timetable for the gradual restructuring of the trade regime
1/ See Walstedt (1980, pp.196) for the outline of a reform program for theSEEs.
- 124 -
in order to provide appropriate guidelines for micro-level planning of export
promotion and import substitution. The modified protectionist system may
formally aim to remove the inherent bias against exports (by narrowing the
product range of probibited imports); reduce discrimination among industries
to normal proportions; and increase the effectiveness of the exchange rate
instrument as an equilibriating mechanism for the balance of payments. The
redesign of the trade policy framework may be complemented by sector-specific
studies to identify promising lines of vertical and/or horizontal
specialization for selective support by the government.
The suggested policy changes involve a variety of political and
technical issues, and they should be viewed as a continual reform process that
can only be implemented in stages. Turkey's planning machinery also needs to
be tailored to the new circumstances with a sharper focus on the optimal mix
of policy aims and means in a dynamic setting. The reorientation of the
planning work would require the development of indigenous research capacity,
and less involvement in operational matters, which can be delegated to the
relevant agencies.
(4) Accelerating Total Factor Productivity Growth
There is the need and scope for an economy-wide drive to increase
total factor productivity growth in the 19809. This is apparent from the
domestic and foreign capital constraints on aggregate growth, low levels of
capacity utilization and productivity in most sectors (including agriculture),
and unused potential of applied research in the country. The applied research
efforts should be directed towards the diffusion and adaptation of technical
innovations that have capital-saving and energy-conserving biases in
production. An improved and wider use of the semi-skilled labor potential of
the country would also buttress the sustained expansion of exports of goods
- 125 -
and packaged services to the oil-surplus areas in the Middle East.
Finally, the domestic economic performance in the medium-run will
also depend on the changes that are taking place in the world economy. Newly
evolving external conditions require highly innovative policies and
arrangements to develop more productive and supportive forms of co-operation
at the international and regional levels.
C. Future Research
The findings of this study can be complemented and extended by
research in several promising directions. A simple, but useful follow-up
would be to express the study's input-output data in deflated world prices,
and to reestimate the sources of growth with the same methodology. To
compensate partly for the use of domestic prices in our analytical
assessments, the effects of domestic price distortions on value added growth
rates in 1953-78 have been estimated. (See Chapter 4) Another practical
extension relates to the estimation of the sources of multi-sectoral growth
from 1973-77, when negative import substitution became more pronounced, and
export expansion effects declined sharply, as shown in an economy-wide
analysis by Balassa (1981).L/
One of the more challenging research tasks would be to integrate the
production function approach and the input-output methods used in this
project. However, a major problem here would be the lack of reliable
estimates for capital stocks and functional distribution of income at the
sectoral level. Nonetheless, with judiciously assembled and "guesstimated"
production-function data, a useful attempt may be made to construct a
historical price-endogenous multi-sectoral model, which should be able to
1/ The year 1978 can not be used as a suitable benchmark year because of itsunusual cyclical characteristics and import shortages.
- 126 -
track structural changes occurring under given policies and exogenous
conditions,I' With the aid of such a model, deeper issues may be examined,
such as the distributional consequences of semi-closed trade policies and the
distorting effects of dual economic behavior in public and private
enterprises.
For the immediate policy concerns in the early 1980s, empirical
research connected with the estimation of incentive and cost-benefit
indicators at the disaggregated level is particularly relevant for the
redesign of the system of protection. The commodity-level cost surveys which
have already been initiated should be complemented by sectoral studies
covering demand and supply aspects, including the possible restructuring of
the existing operations under the newly adopted trade-oriented strategy.
1/ See Dervis and Robinson (1978) for an earlier use of a price-endogenousmulti-sectoral model in analyzing trade-growth relationships in 1973-83.
- 127 -
REFERENCES
Akbay, C. (1973), Sectoral Distribution of Indirect Taxes in 1968, StateInstitute of Statistics, Publication No. 678, Ankara.
Aksoy, A. (1980), ."Wages, Relative Shares and Unionization in TurkishManufacturing," in Ozbudun and Ulusan (1980).
Balassa, B. (1976), "Accounting for Economic Growth: The Case of Norway,"World Bank, Development Research Center, Discussion Paper No.17,Washington, D.C.
(1979), Policies for Stable Economic Growth In Turkey," paperpresented at the seminar on "The Role of the Exchange Rate in Shapingan Outward Oriented Economy," Istanbul.
(1981), "The Policy Experience of Newly Industrializlng Economiesafter 1973 and the Case of Turkey," paper presented at secondconference on "The Role of Exchange Rate Policy in Achieving anOutward-Oriented Economy" (organized by Meban Securities), Istanbul.
Baysan, T. (1980), "Seinsitivity of Resource Allocation Shifts to the Size ofTariff Reductions," M.E.T.U. Studies in Development, Vol.7, Nos. 3and 4, Ankara, p.p. 255-88.
Bhagwati, J.N. (1978), Foreign Trade Regimes and Economic Development: Anatomyand Consequences of Exchange Control Regimes, Columbia UniversityPress, Now York.
Bulutay, T., Yildiris, N. and Tezel, Y. (1974), National Income in Turkey:1923-48, Publication No. 375 (in Turkish), Faculty of PoliicalSciences, Ankara University.
Celasun, M. (1970), "Prospective Growth of Non-Agricultural Employment inTurkey," in Miller (1970).
- - (1974), Perspectives of Economic Growth in Turkey: 1973-77,Publication No. 27, Faculty of Arts and Sciences, Middle EastTechnical University, Ankara.
(1978), "The Turkish Development Policy Problems and Turkey-EECRelations," In FPI (1978), pp. 53-69.
(1980a), "Real and Monetary Aspects in the Turkish EconomlcPlanning," M.Z.T.U. Studies In Development, Vol.7, Nos. 1 and 2,Ankara, pp. 1-36.
(1980b), "Towards Policy Adjustments in Turkish Development in the1980s," Middle East Technical University, Ankara (aimeo).
(1981), "Egtension of the Data Base for the Sources of GrowthStudy on the Turkish Economy," Middle East Technical University,Ankara (dimeo).
- 128 -
Chakraverty, A. et al (1970), Structural Interdependence of the TurkishEconomy: 1963, State Planning Organization, Ankara.
(1973), The Flow Structure of Imports in the TurkishEconomy: 1967 and 1968, State Institute of Statistics, Ankara.
Chenery, H.B. (1960), "Patterns of Industrial Growth", American EconomicReview, September, pp. 624-54.
(1979), Structural Change and Development Policy, OxfordUniversity Press, New Yor.
and Shishido S. and Watanabe T. (CSW, 1962) "The pattern ofJapanese Growth, 1914-54", Econometrica, Vol. 30, No.1, pp. 98-139.
- - and Syrquin, M. (1975), Patterns of Development: 1950-70, OxfordUniversity Press.
and Taylor (1968), "Development Patterns: Among Countries andOver Time," Review of Economics and Statistics, November, pp. 391-416.
and Watanabe, T. (1975), "The Role of Industrialization inJapanese Development: 1914-65," (draft), World Bank.
Denison, E.F. (1967), Why Growth Rates Differ, The Brookings Institution,Washington, D.C.
Dervis, K. and Robinson, S. (1978), "The Foreign Exchange Gap, Growth andIndustrial Strategy in Turkey: 1973-1983," World Bank Staff WorkingPaper, No. 306, Washington, D.C.
Ebiri, K. et al (1977), Capital and Labor in the Turkish ManufacturingIndustry, State Planning Organization (DPT: 1624-SPD: 303), Ankara.
Ecevit, L. and Ozotun, E. (1975), "The Changing Structural Distribution ofIncome and Employment in Turkey and Kusnets Hypothesis", WorkingPaper, WEP 2-23/WP 23, International Labor Office, Geneva.
Pane, G. (1973) "Consistent Measures of Import Substitution, "Oxford EconomicPapers, July, pp. 251-61.
FPI (1978), "The Symposium on The Enlargement of EEC and Turkey," ForeignPolicy (VII, No. 3-4), Foreign Policy Institute, Ankara.
Gocmencelebi, K. (1974) "New Wholesale Price Index, Methodology andApplication," Statistics (Statistical Association), Vol. 2 (inTurkish), Ankara.
Hamurdan, Y. (1970), "Surplus Labor in Turkish Agriculture," in Miller (1970).
Hatiboglu, Z. (1978), An Unconvential Analysis of The Turkish Economy: AnEssayon Economic Devl-opment, Aktif Buro Basim Organizasyon,Istanbul.
- 129 -
Hic, M. (1972), "Turkey's Entry into the Common Market: General Aspects of theProblem," in I]D (1972).
IED (1972), Problems of Turkey~s Economic Developnent, Publication No. 316,Institute of Economic Development, Faculty of Economics, IstanbulUniversity.
Johnson, H.G. (1962), Money, Trade and Economic Growth, Harvard UniversityPress.
(1967), "rhe Ideology of Economic Policy in the New States," inEconomic Nationalism in Old and New States, Chicago.
Kazgan, G. (1972), "Structural Change in Turkish Manufacturing Industry," inIED (1972).
Kim, K.S. (1978), Industrialization and Structural Change in Korea, KoreaDevelopment Institute, Seoul.
Korum, U. (1963), Input-Output Analysis, Publication No. 146 (in Turkish),Faculty of Political Sciences, Ankara University.
(1975), "The Structure of Interdependence of the Public and PrivateSectors in the Turkish Manufacturing Industry," paper presented toInternational Seminar on the Turkish and Other Countries' Experiencewith a Mixed Economy, Hacettepe University, Ankara.
(1976) "Import Substitution in Turkey, in Relation to Integrationwith the DEC," paper presented to "International Seminar on Turkey-EEC Relations," October, Antalya.
Krueger, A.O. (1974), Foreign Trade Regimes and Economic Development: Turkey,Columbia University Press, New York.
(1978), Foreign Trade Regimes and Economic Development:Liberalization Attempts and Consequences, Columbia University Press,New York.
and Tuncer, B. (1980), Microeconomic Aspects of ProductivityGrowth Under Import Substitution: Turkey, Working Paper No. 532,National Bureau of Economic Research, Cambridge, Massachusetts.
Kubo, Y. (1977.), "Japan Country Study: Sources of Growth Calculations," mimeoWorld Bank, Washington, D.C.
(1978), "Sourceis of Growth Decomposition Equations," mimeo, WorldBank Washington, D.C.
and Robinson, S. (1979), "Sources of Industrial Growth and StructuralChange: A Comparative Analysis of Eight Countries," paper presentedat the Seventh International Conference on Input-Output Techniques,Innsbruck, Autria.
- 130 -
Kuznets, S. (1969), Modern Economic Growth, Rate, Structure and Spread, YaleUniversity Press, New Haven, Connecticut.
Lewis, S.R. and Soligo, R. (1965), "Growth and Structural Change in Pakistan'sManufacturing Industry," Pakistan Development Review, Spring, pp. 94-139.
Miller, D. editor, (1970), Essays on Labor Force and Employment in Turkey,USAID, Ankara.
Morley, S.A. and Smith G.W., (1970), "On the Measurement of ImportSubstitution," American Economic Review, September, pp. 728-735.
Okyar, 0. (1965), "The Concept of Etatism," Economic Journal, March, pp. 98-111.
(1979), "Inflation and Political Democracy in Turkey (1923-78),"Foreign Policy (VIII, Nos. 1 and 2), Foreign Policy Institute,Ankara.
Olgun, H. (1975), "The Structure of Protection in Turkish ManufacturingIndustries," M.E.T.U. Studies in Development, Vol.6, No. 75, Ankara,pp. 129-62.
Ozbudun, E. and Ulusan, A., editors, (1980), The Political Economy of IncomeDistribution in Turkey, Holmes and Meier Publishers, Inc. New York.
Solis, L. (1971), "Mexican Economic Policy in the Post- War Period: The Viewsof Mexican Economists," American Economic Review (Supplement) Vol.61,No 3, pp. 1-67.
State Institute of Statistics (SIS) (1976 b), Economic Accounts of StateEconomic Enterprises, Publication No. 762, Ankara (in Turkish).
…---- ------ Input-Output Tables, 1968 and 1973 (inboth Turkish and English).
…----…- ----- -…-- - - ------------ (1973), National Income and Expenditure ofTurkey: 1948-72, Publication No. 680, Ankara.
--- --(1974), National Income and Expenditure ofTurkey: 1962-73, Publication No. 712, Ankara.
(1976 a), Statistical Yearbook of Turkey:1975, Publication No. 750, Ankara.
-- -- (1979), Turkey's Import Flow Table for1973, Publication No. 884, Ankara (in Turkish).
State Planning Organization (SPO) (1973), The Third Five-Year Plan, Ankara (inTurkish).
- (1976), Income Distribution: 1973, DPT:1495-SPD: 290, Ankara (in Turkish).
- 131 -
State Planning Organization (SPO) (1979), The Fourth Five-Year Plan, Ankara(in Turkish)
Syrquin, M. (1976), "Sources of Industrial Growth and Change: An AlternativeMeasure," World Bank.
Tekeli, I. and Ilkin, IS. (1974), 1947 Development Plan of Turkey, PublicationNo.24 (in Tuikish), Middle East Technical University, Faculty ofAdministrative Sciences, Ankara.
et al (1980), Concentration in Turkish Manufacturing Industry,Working Paper No.18, Economic and Social Research Institute (ESA),Middle East Technical University, Ankara.
TSKB (1977), Annual Report of the Turkish Industrial Development Bank,Istanbul.
TTSOB (1966), Private Sector a d Development in Turkey, The Turkish Union ofChambers of Commerce and Industry, Ankara (in Turkish).
Tuncer, B. (1976), Economic Oevelopment and Population, Publication D-20,Hacettepe University, Ankara (in Turkish).
TUSIAD (1976), Turkey: An Economic Survey, Turkish Industrialists andBusinessmen's Association, Istanbul.
USAID (1974), Economic and Social Indicators: Turkey, USAID-Ankara, August.
Walstedt, B. (1980), State Manufacturing Enterprise in a Mixed Economy: TheTurkish Case, The Johni Hopkins University Press, Baltimore.
Watanabe, T. (1975) "Changes in Factor Uses and Prices," mimeo, World Bank,Washington, D.C.
Westphal, L. and Kim, K.S. (1974), "Industrial Policy and Development inKorea," forthcoming In Balassa, B. (ed.), Development Strategies inSemi-Industrialized Countries, World Bank.
Wolf, C. (1980), "Turkish Development Prospects and Policies in Light ofExperience Elsewhere," Rand Corporation (N-1449), Santa Monica,California.
World Bank (1974), "Turkey: Prospects and Problems of an Expanding Economy," AWorld Bank Country Economic Report, Washington, D.C.
(1980), "Turkey: Policies and Prospects for Growth," A World BankCountry Study, Washington, D.C.
Yalcintas, N. (1970), "Manpower and Employment Objectives and the Role ofResearch and Statistics," in Miller (1970).
Zaim, S. (1974), Incomes and Wages Policy in Turkey, The Turkish Confederationof Employers Associations, Publication No. 28 (in Turkish).
- 132 -
APPENDIX 1
MODELS FOR SOURCES OF GROWTH DECOMPOSITION
A. Methodology in Brief
A.1 Major Characteristics of the Models Used in the Present Study
Appendix I gives the algebra of the models used to analyze the
sources of growth and structural change in Turkish economic development during
the sample period 1953-73. Although the thrust of the study is to decompose
factors which jointly caused differences in the rates of production growth in
the various sectors of the economy, the analysis is also extended to the
determination of the sources of changes in the sectoral patterns of value
added, imports, factor use and relative prices.
The fundamental logic of the models is based on the earlier
contributions of (1) Chenery (1960); (2) Chenery, Shishido and Watanabe's
investigation of the Japanese industrialization experience (CSW, 1962); and
(3) their subsequent modifications, which are reviewed elsewhere by Fane
(1973) and Syrquin (1976).
These models differ from the sources of growth models in the
tradition of the celebrated work of Denison (1967). The Denison-type models
employ the production-function approach, and attempt to measure the relative
contributions of primary factor accumulation and reallocation in the aggregate
growth process. Hatiboglu (1978) adopts the Denison approach in his general
appraisal of Turkish economic growth in 1950-75 with imputed factor returns in
the nonagricultural sectors.
The type of models used in the present analysis have the following
significant characteristics:
- 133 -
(i) The principal Eeature of the line of research originally established
by Chenery (1960) and CSW (1962) is that, with the material balance (supply-
demand) equations in an input-output (I-0) framework as a basis, the shifts in
the sectoral structure of production (or of a related vector such as value-
added, factor use, etc..) are attributed to a number of supply and demand
factors, which are treated as autonomous elements in the analysis. These
autonomous elements, which are also referred to as causal factors, are usually
the following: (1) domestic final demand; (2) technological change (or, more
specifically, changes in I-0 coefficients); (3) exports; and (4) import-
substitution. In some versions of the models, the elements (1) and (2) are
combined under the catelgory of domestic demand effect, and (3) and (4) are
considered the trade effect on the growth and structural change of the
variable under examination.
(ii) In empirical iLmplementation, there are two types of measures that
can be used to quantify the changes observed in the sectoral variables over a
given time frame: (1) first differences (increments) and (2) deviations from a
proportional (or balanceel) growth path. The deviation measures are calculated
with respect to a reference growth pattern in which all relevant variables of
the input-output system grow at a specified "norm" rate, called the
proportionality factor. In the sources of growth analysis of production,
value-added and imports, the proportionality factor is considered the ratio of
gross domestic product (G]DP) in the terminal year to that of the base year. In
the analysis of price changes, this factor becomes the ratio of the general
price level in the terminal and base years.
(iii) The use of an input-output (I-0) framework in the sources analysis
also permits the distinction between the direct and total effects of the
autonomous elements in the! process of growth and structural change. The total
- 134 -
effects reflect the indirect linkage effects of a change in the production
level of a particular sector in the economy. In this study, the direct and
total effects are calculated separately, but the results are presented
selectively in the text for cases that are relevant to the discussion.
(iv) The empirical work along the lines of the pioneering CSW models
requires comparable interindustry data for the benchmark periods at the same
level of sector aggregation. Among the problems were the typical statistical
difficulties in processing available sectoral data in a format permitting
comparisons over time. This was particularly hard for the earlier periods in
which there are no I-0 tables, such as the benchmark periods 1952-54 (average)
and 1957-59 (average). In addition, deflating all data to a common price
basis was cumbersome. The deflation of current price I-0 data to constant
prices is essential under two sets of circumstances: (1) if there were
intersectoral differences in price movements, and/or (2) if there were
intrasectoral differences in the changes of production, import and export
prices over time.
In the Turkish context, these two types of price variations were
significant enough to warrant complementary research on the construction of
appropriate price indices, and the deflation of all current price data into
the constant prices of a suitable reference period, which was selected as the
year 1968. The latter serves as the base year for deflated official national
income data. An integral part of the study was time-consuming empirical
research to deflate the current price sectoral production and trade data for
the benckmark periods (1952-54 (average), 1957-59 (average), 1963, 1968 and
1973), as described in Appendix 2. The mathematical formulas presented below
have been applied to Turkish intersectoral data measured in real terms by 1968
- 135 -
constant domestic priced!.
(v) Another common difficulty in the sources of growth decomposition
calculations over a specified period is an index number problem. The
resolution of this problem requires a choice of using either (1) the base
period volume weights, while using the structural coefficients of the terminal
period, or (2) the terminal period volume weights, while using the structural
coefficients of the base period. In a way, the problem is conceptually
similar to decomposing a change in value terms into price and quantity
indices. An attempt is made to circumvent this problem by computing both the
Laspeyres and Paasche types of decomposition measures, as indicated in the
mathematical formulations below.
A.2 Treatment of Import Substitution
The treatment of import substitution (IS) is a source of dispute in
empirical research for the field. The evolution of the treatment in the
literature is broadly summarized as follows:
(i) An early contribution by Chenery (1960), which used deviation
measures, treated the IS factor in terms of changes in the share of imports in
the total supply of a given sector. Lewis and Soligo (1965) adopted the
approach of Chenery (1960) in their assessment of the Pakistan growth
experience, but preferred to work with first differences as measures of
changes in the sectoral output and trade variables. These two studies were
both conducted in terms of direct effects, and had not explicitly incorporated
the effects of I-0 linkages and coefficient changes over time.
1/ In future investigations of the Turkish economic transformation, asignificant contribution would be to deflate the available I-0 data intoconstant world market prices to remove the distorting effects of economicrents in national income formation, as aptly pointed out by Hatiboglu(1978).
- 136 -
(ii) CSW (1962), in their study of Japanese growth, which considered the
domestic linkage effects of causal factors, measured the IS factor in terms of
deviation of import growth from the proportional path of expansion. Although
such an IS measure somewhat reflects the actual replacement of imports by
domestic production, it does not adequately measure changes in the sectoral
ratios of output (or imports) to total supply.
(iii) Criticizing the IS measure of CSW (1962), Morley and Smith (1970)
proposed a variant approach to IS. They introduced a new concept of gross
(redefined) imports, which was to be obtained by premultiplying the import
vector by the Leontief inverse, and measuring IS as the change in the share of
gross (redefined) imports in total (redefined) supply incorporating gross
output and gross imports. In Morley and Smith (1970), the IS factor
represents the domestic production recessary to substitute completely for
imports, which is an extreme view of the actual IS process. Similarly, Fane
(1973) suggested an alternative measure of IS involving two components:
namely, IS in sector (j), and indirect IS contributions of production increase
in sector (j). As in Chenery (1960), Lewis and Soligo (1965), and Morley and
Smith (1970), Pane also employed the share method in defining IS by focusing
on the changing share of imports in total supply over time.
(iv) More recent contributions to the analysis of IS came from Syrquin
(1976) and Balassa (1976). Again adopting the share approach, Syrquin seeks
to quantify the effects of changes in the ratio of imports to total domestic
demand, and proposes a series of refinements in the treatment of imports and
IS for situations where detailed data of import use are available. In turn,
Balassa extends the two-commodity trade model of Johnson (1962) to a
multisectoral context, and seeks to explain changes in imports over time in
terms of pro-trade and anti-trade biases in production and consumption. In
- 137 -
the Balassa framework, import-substitution is defined in terms of deviations
of the growth rates of the sector's production and consumption from the
Oneutral growth," i.e., the growth rate of national product.
In the present Turkey study, the IS factor is treated along the
lines of the CSW (1962) and Syrquin (1976) formulations, which are also
referred to as constant composition and constant share (or, for short,
composition and share) methods. To provide additional evidence on the
changing pattern of imsports, the decomposition measures for the sources of
growth of imports (by commodity, i.e., by sector of origin) are also
calculated and presented for selected periods in 1953-73.
In recent research on observed IS in Turkish economic growth, Korum
(1976) adopts the Lewis and Soligo (1965) measurement of the IS contribution
to growth, and provides sectoral estimates of this measure (at a 37 sector
level of aggregation) by using the current price sectoral production and trade
data available in the 1963, 1968 and 1973 I-0 tables. Despite the calculation
of only direct effects, and the use of undeflated sectoral data, the overall
conclusions of Korum's study are similar to those here in that the role of
trade effects in TurkishL industrial growth has been very narrow in 1963-73.
This review of the sources of growth models suggests that their
analytical frameworks need to be extended in a number of new directions. A
possible extension wouLd be the integration of the aggregate production-
function approach of Denison (1967) with the I-0 methods used here. The
accumulation of primary factor inputs (i.e., capital and labor) and their
continual reallocation over time interact with the causal factors identified
in the I-0 models of sources of growth. Within a broader framework of
analysis, the growth contributions of a variety of autonomous factors
(including factor inputs as well as exports, IS and technical progress) may be
- 138 -
quantified more systematically. Another direction of extension would be the
explicit introduction of policy variables into the sources of growth
investigations. In future research, the historically validated price-
endogenous I-0 models, which allow direct substitution in production and
consumption, are likely to serve as more comprehensive frameworks to establish
causal chains between past policies and observed growth and structural change
in individual economies.
B. Notation
The analytical frameworks used in this study are briefly sketched
here to facilitate the interpretation of the empirical findings presented in
the text.-
All frameworks are structured around the Leontief I-0 system, in
which the sectors are denoted by the subscripts i and/or J. In this research
i,j - 1,2,... 25. With each application, the frameworks are implemented over
a time period with specified base and end years, which are typically
designated in the literature as period 1 and period 2, respectively. For the
sake of simplicity, equations are given in matrix form. All I-0 data is
expressed in constant prices, unless otherwise indicated. The notations
adopted are the following:
Xt : production (or output) vector in period t (t-1,2),
Dt : domestic final demand vector in period t (t-1,2),
Wt : intermediate demand vector in period t (t-l,2).
Et : export vector in period t (t-1,2),
Mt : import vector in period t (t-1,2),
At : matrix of (total) input-output coefficients in period t (t-1,2)
1/ See Syrquin (1976) and Kubo (1977 and 1978) for comprehensive reviews ofthe alternative formulas for decomposition measures.
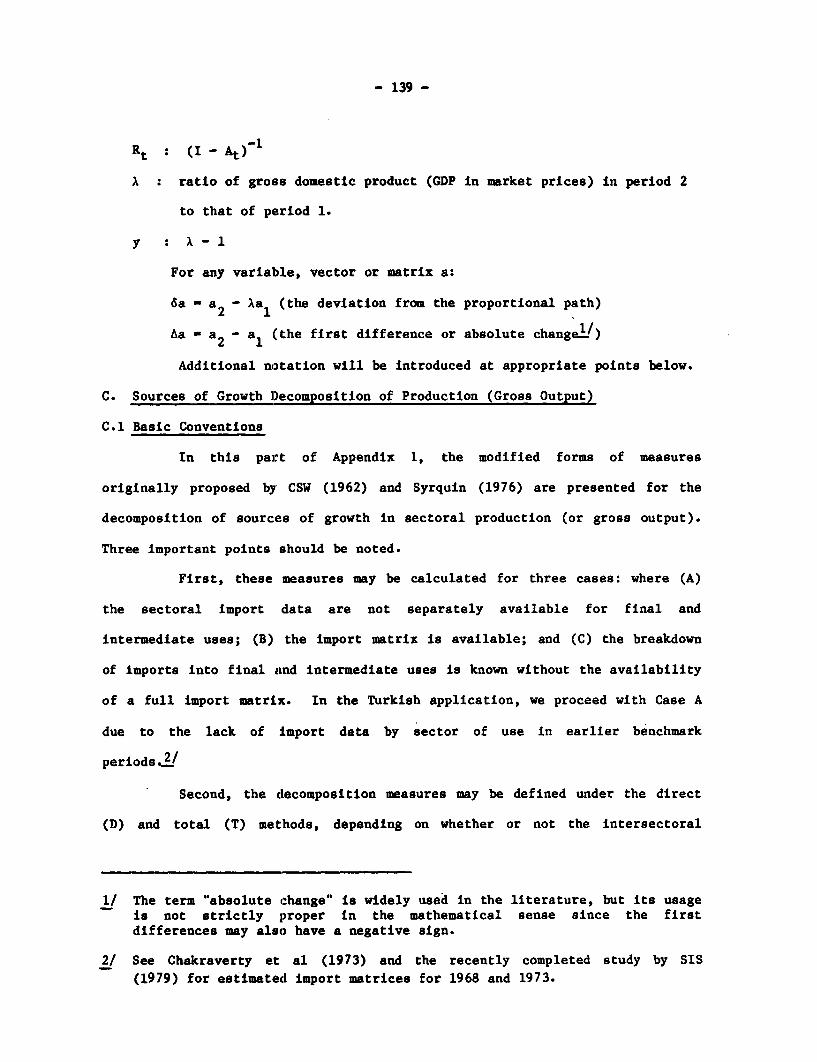
- 139 -
Rt (I-At)-l
A: ratio of gross domestic product (GDP in market prices) in period 2
to that of period 1.
y A - 1
For any variable, vector or matrix a:
6a - a2 - AaX (the deviation from the proportional path)
Aa - a2 - a (the first difference or absolute change-L')
Additional notation will be introduced at appropriate points below.
C. Sources of Growth Decomposition of Production (Gross Output)
C.1 Basic Conventions
In this part of Appendix 1, the modified forms of measures
originally proposed by CSW (1962) and Syrquin (1976) are presented for the
decomposition of sources of growth in sectoral production (or gross output).
Three important points should be noted.
First, these measures may be calculated for three cases: where (A)
the sectoral import data are not separately available for final and
intermediate uses; (B) the import matrix is available; and (C) the breakdown
of imports into final and intermediate uses is known without the availability
of a full import matrix. In the Turkish application, we proceed with Case A
due to the lack of import data by sector of use in earlier benchmark
periods ./
Second, the decomposition measures may be defined under the direct
(D) and total (T) methods, depending on whether or not the intersectoral
1/ The term "absolute change" is widely used in the literature, but its usageis not strictly proper in the mathematical sense since the firstdifferences may also have a negative sign.
2/ See Chakraverty et al (1973) and the recently completed study by SIS(1979) for estimated import matrices for 1968 and 1973.
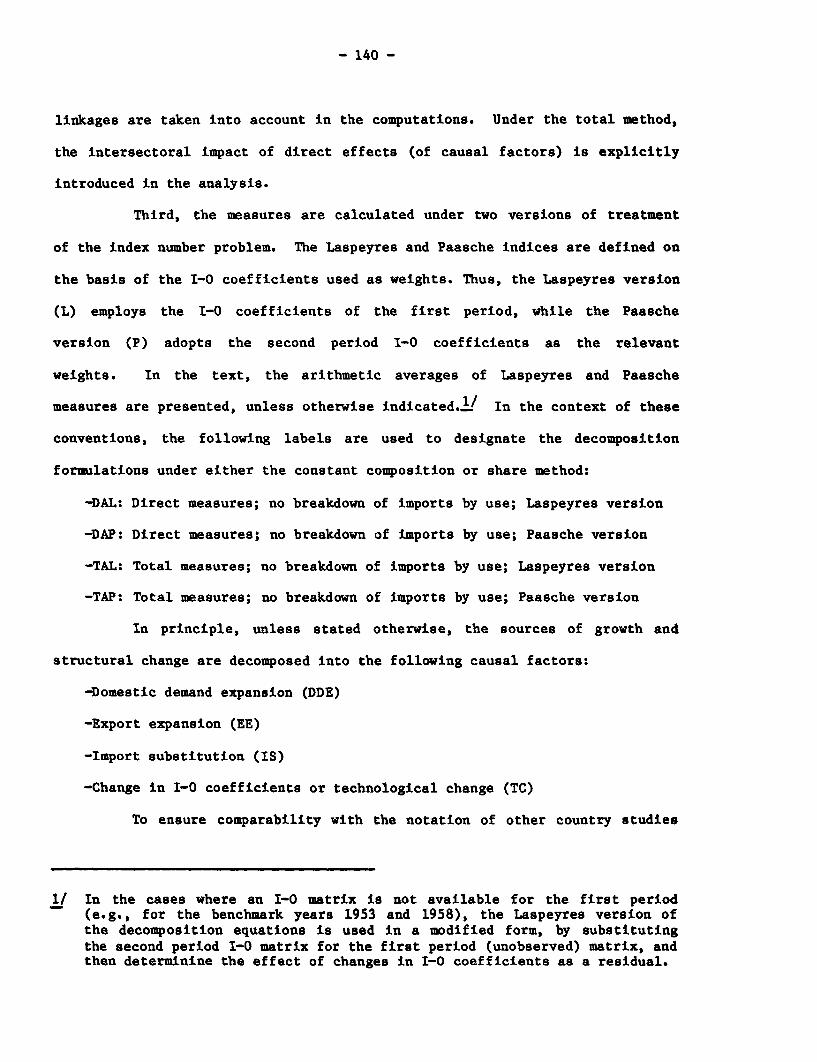
- 140 -
linkages are taken into account in the computations. Under the total method,
the intersectoral impact of direct effects (of causal factors) is explicitly
introduced in the analysis.
Third, the measures are calculated under two versions of treatment
of the index number problem. The Laspeyres and Paasche indices are defined on
the basis of the I-0 coefficients used as weights. Thus, the Laspeyres version
(L) employs the I-0 coefficients of the first period, while the Paasche
version (P) adopts the second period I-0 coefficients as the relevant
weights. In the text, the arithmetic averages of Laspeyres and Paasche
measures are presented, unless otherwise indicated.1! In the context of these
conventions, the following labels are used to designate the decomposition
formulations under either the constant composition or share method:
-DAL: Direct measures; no breakdown of imports by use; Laspeyres version
-DAP: Direct measures; no breakdown of imports by use; Paasche version
-TAL: Total measures; no breakdown of imports by use; Laspeyres version
-TAP: Total measures; no breakdown of imports by use; Paasche version
In principle, unless stated otherwise, the sources of growth and
structural change are decomposed into the following causal factors:
-Domestic demand expansion (DDE)
-Export expansion (EE)
-Import substitution (IS)
-Change in I-0 coefficients or technological change (TC)
To ensure comparability with the notation of other country studies
1/ In the cases where an I-0 matrix is not available for the first period(e.g., for the benchmark years 1953 and 1958), the Laspeyres version ofthe decomposition equations is used in a modified form, by substitutingthe second period 1-0 matrix for the first period (unobserved) matrix, andthen determinine the effect of changes in I-0 coefficients as a residual.
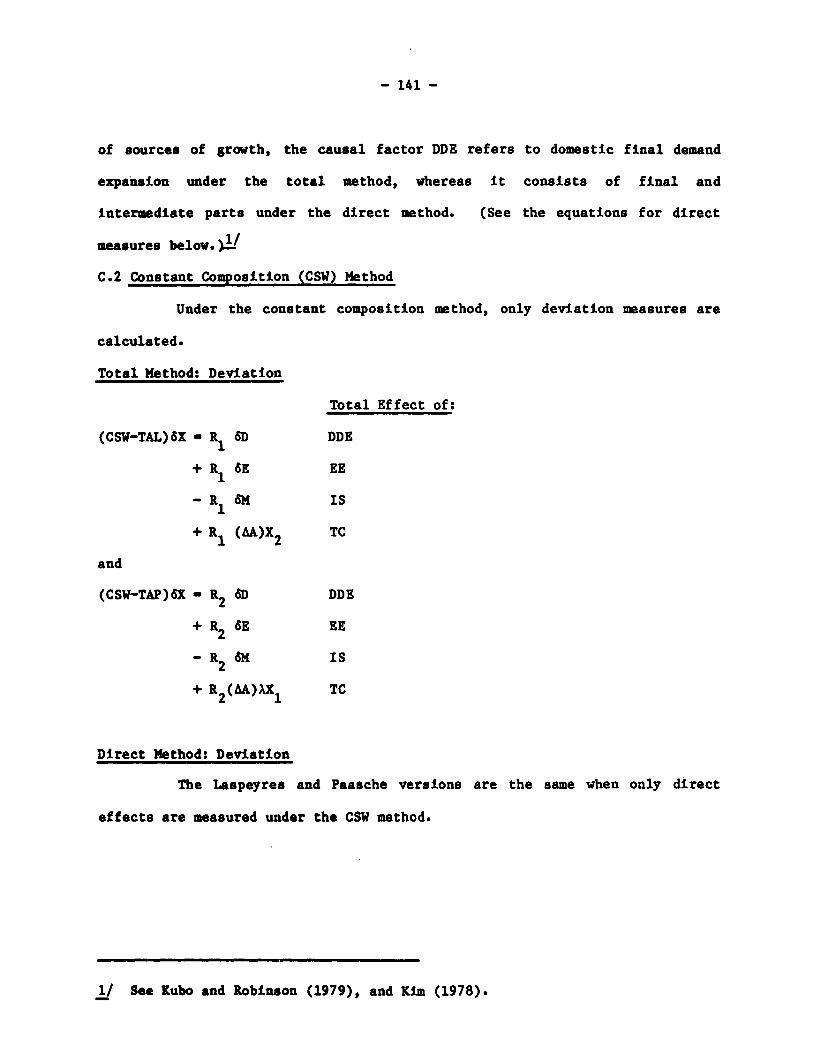
- 141 -
of sources of growth, the causal factor DDE refers to domestic final demand
expansion under the total method, whereas it consists of final and
intermediate parts under the direct method. (See the equations for direct
measures below. j/
C.2 Constant Composition (CSW) Method
Under the constant composition method, only deviation measures are
calculated.
Total Method: Deviation
Total Effect of:
(CSW-TAL)6X - R1 6D DDE
+ R1 6E EE
- R1 6M IS
+ R1 (AA)X2 TC
and
(CSW-TAP)6X - R2 6D DDE
+ R2 6E EE
- R2 8M IS
+ R2(AA)AXl TC
Direct Method: Deviation
The Laspeyres and Paasche versions are the same when only direct
effects are measured under the CSW method.
1/ See Kubo and Robinson (1979), and Kim (1978).
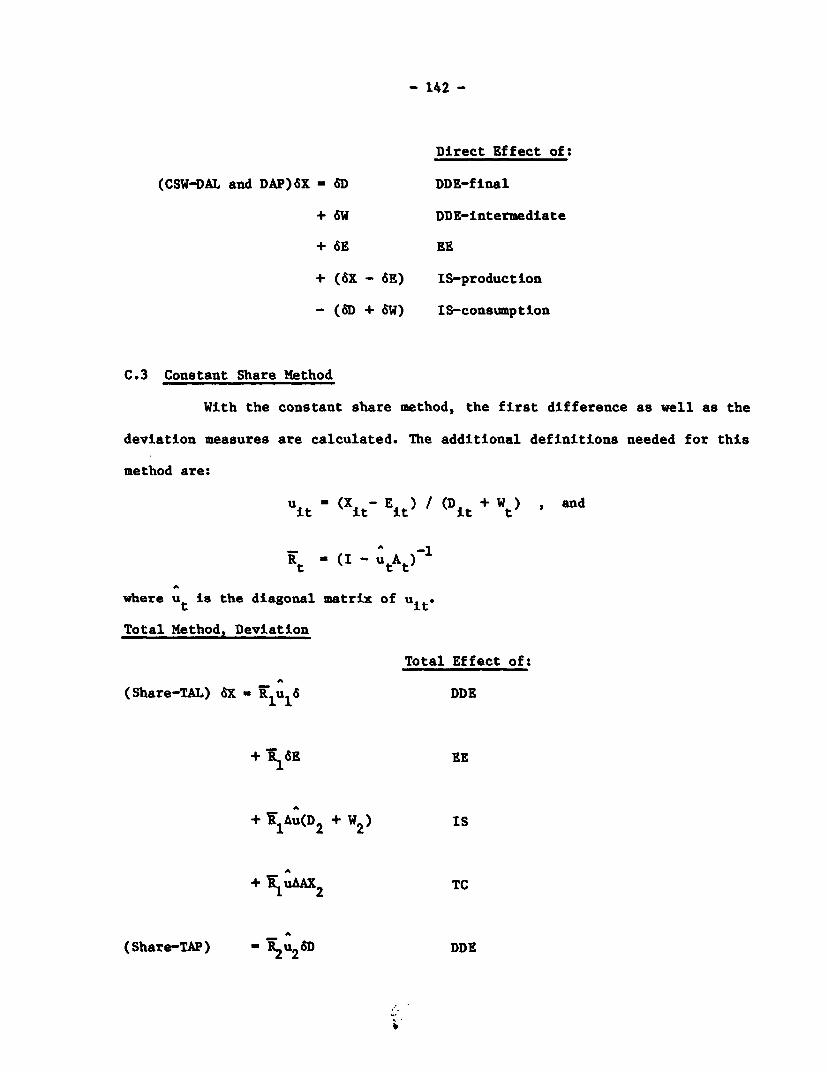
- 142 -
Direct Effect of:
(CSW-DAL and DAP)6X - SD DDE-final
+ SW DDE-intermediate
+ 6E EE
+ (6X - 6E) IS-production
- (6D + 6W) IS-consumption
C.3 Constant Share Method
With the constant share method, the first difference as well as the
deviation measures are calculated. The additional definitions needed for this
method are:
u it (Xit Eit /(Dit +Wt and
Rt ' (I - utAt)
where ut is the diagonal matrix of uit.
Total Method, Deviation
Total Effect of:A
(Share-TAL) 6X - !1u1 6 DDE
+ 716E EE
+ K1Au(D2 + W2) Is
+ T uAAX2 TC
(Share-TAP) - R2u2 6D DDE
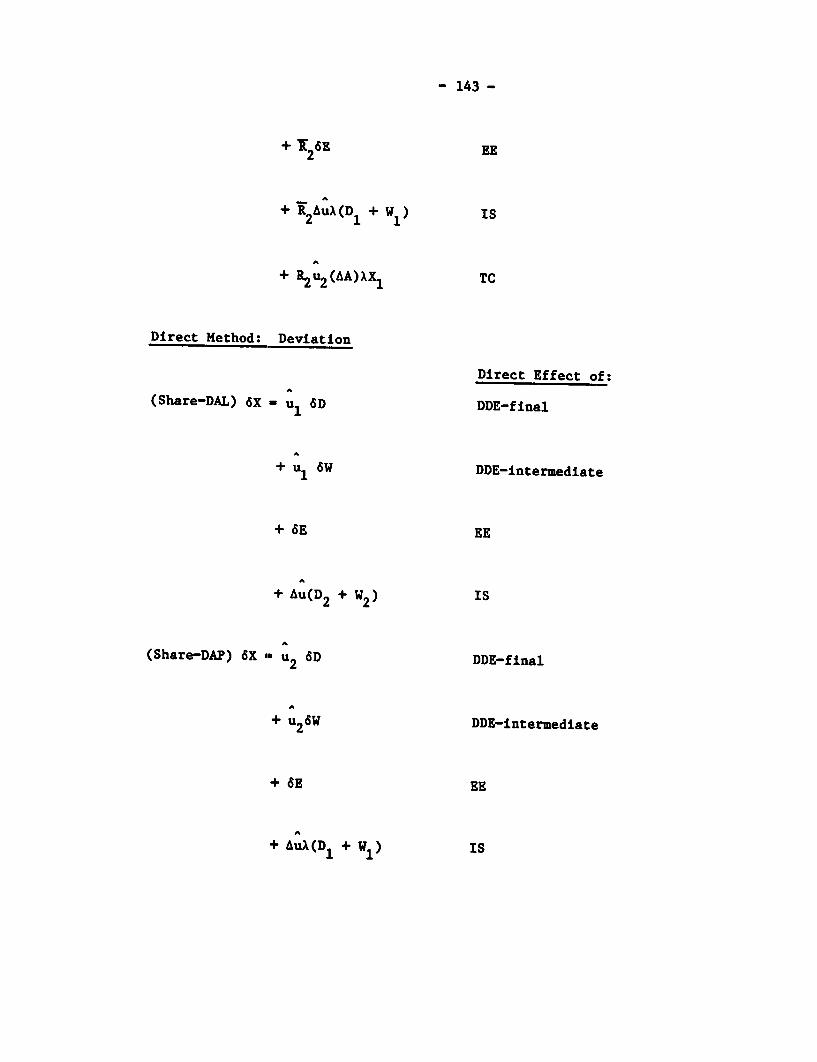
- 143 -
+ 7 26E EE
+ R2AuA(D1 + Wi) IS
+ R2u2(AA)XX, TC
Direct Method: Deviation
Direct Effect of:
(Share-DAL) 6X - u 6D DDE-final
+ u1 SW DDE-intermediate
+ SE EE
+ Au(D 2 + W2) IS
(Share-DAP) 6X l u2 6D DDE-final
+ u2 W DDE-intermediate
+ KE EE
+ AuA(D1 + W1) IS
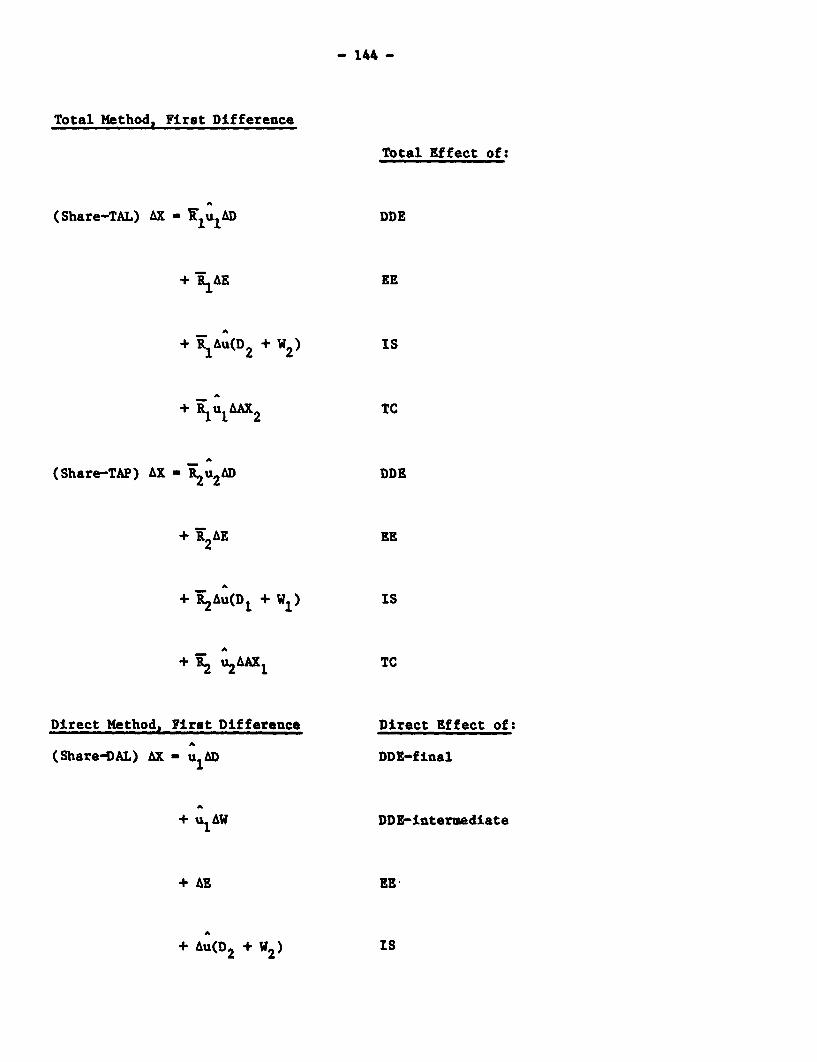
- 144 -
Total Method, First Difference
Total Effect of:
(Share-TAL) AX - VIuIAD DDE
+ R1 AE EE
-A
+ RAu(D2 + I 2) IS
+ RlulAX2 TC
(Share-TAP) AX - R2u2 AD DDE
+ R2AE ER
2
+ R2Au(DI + W1) IS
+ R u2AAX, TC
Direct Method. First Difference Direct Effect of:
(Share-DAL) AX - u1 AD DDE-final
+ u1AW DDE-intermediate
+ AE EE
+ Au(D2 + W2) Is
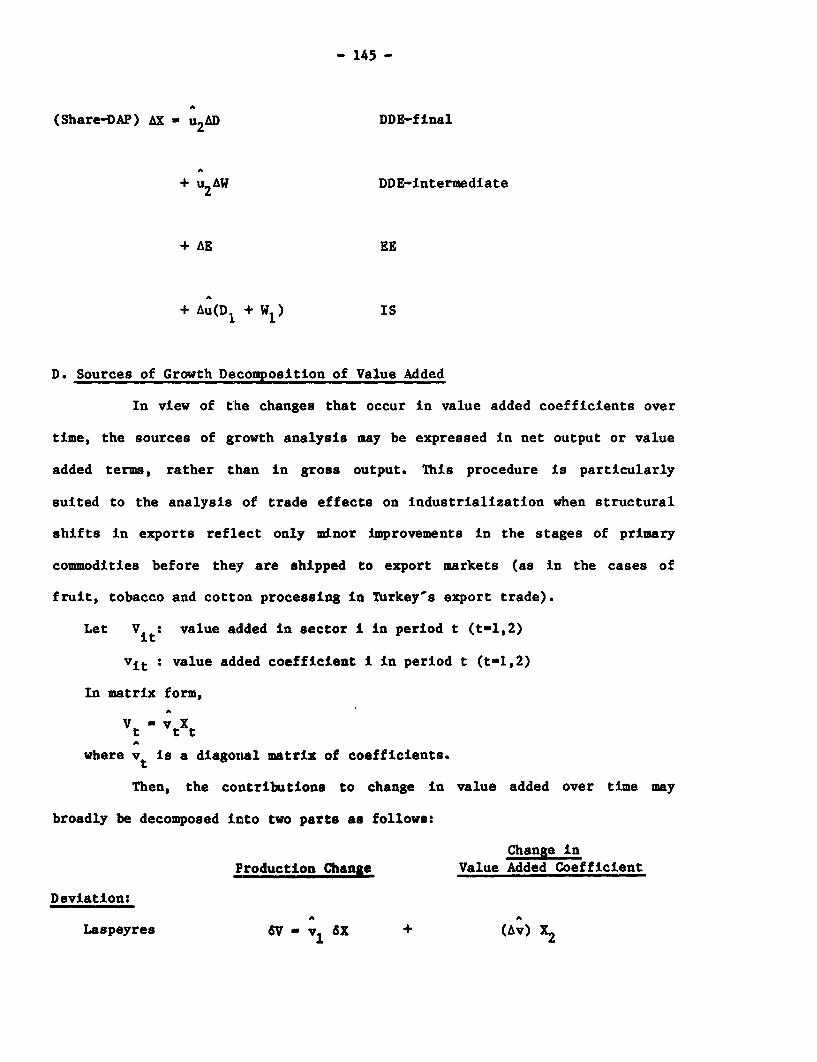
- 145 -
(Share-DAP) AX - u2 AD DDE-final
+ u2 AW DDE-intermediate
+ AE EE
+ Au(D1 + W1 ) IS
D. Sources of Growth Decomposition of Value Added
In view of the changes that occur in value added coefficients over
time, the sources of growth analysis may be expressed in net output or value
added terms, rather than in gross output. This procedure is particularly
suited to the analysis of trade effects on industrialization when structural
shifts in exports reflect only minor improvements in the stages of primary
commodities before they are shipped to export markets (as in the cases of
fruit, tobacco and cotton processing in Turkey's export trade).
Let Vit : value added in sector i in period t (t-1,2)
vit : value added coefficient I in period t (t-1,2)
In matrix form,
vt ' vtXt
where vt is a diagotnal matrix of coefficients.
Then, the contributions to change in value added over time may
broadly be decomposed into two parts as follows:
Change inProduction Change Value Added Coefficient
Deviation:
Laspeyres SV- v ax + (Av) X2
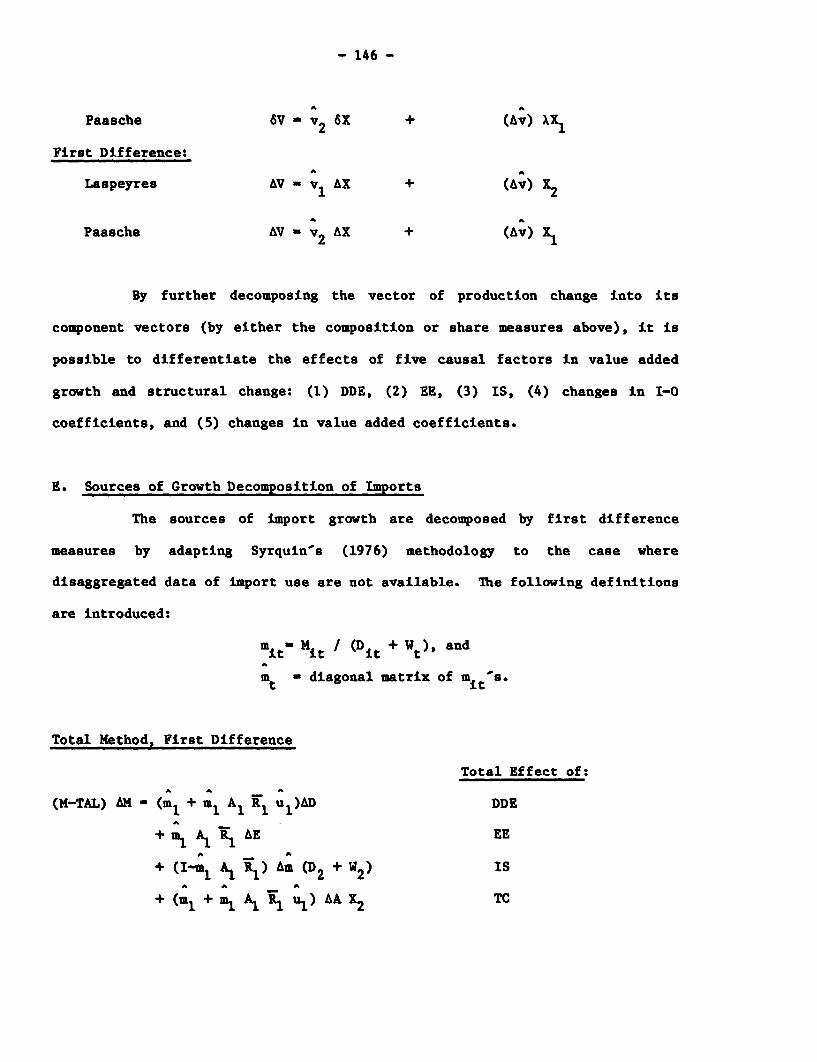
- 146 -
Paasche +V v2 6x (Av) XX
First Difference:
Laspeyres AV - v1 AX + (Av) X2
Paasche AV A v2 AX + (Av) X1
By further decomposing the vector of production change into its
component vectors (by either the composition or share measures above), it is
possible to differentiate the effects of five causal factors in value added
growth and structural change: (1) DDE, (2) EE, (3) IS, (4) changes in 1-0
coefficients, and (5) changes in value added coefficients.
E. Sources of Growth Decomposition of Imports
The sources of import growth are decomposed by first difference
measures by adapting Syrquin's (1976) methodology to the case where
disaggregated data of import use are not available. The following definitions
are introduced:
it Mit / (Dit + Wt), and
mt - diagonal matrix of mits.
Total Method, First Difference
Total Effect of:
(M-TAL) AM - (in1 + m1 A1 R1 u1)AD DDE
+ m Al R AE EE
+ (I-m A1 R) Am (D2 + W2) IS
+ (m1 + ml A1l i ul) AA A 2 TC
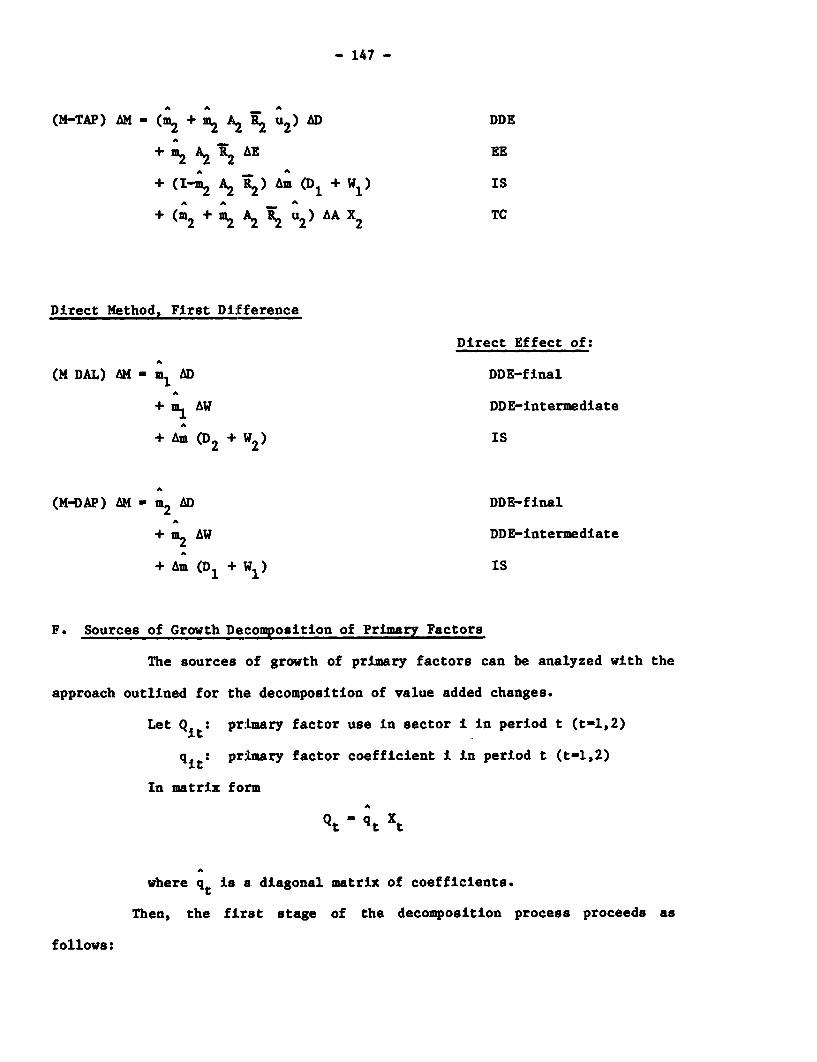
- 147 -
(M-TAP) AM - (i 2 + m2 A2 AD DDE
+i A2 R2 E EE
+ (I-2 A2 R2 ) aim (D1 + W1 ) IS
+ (m2 + m2 A2 R2 u2) A A2 TC
Direct Method, First Difference
Direct Effect of:
(M DAL) AM - m AD DDE-final
+ ml AW DDE-intermediate
+ Am (D 2 + 2) IS
(M-DAP) AM - m2 AD DDE-final
+ m2 AW DDE-intermediate
Am (D 1 + W1) IS
F. Sources of Growth Decomposition of Primary Factors
The sources of growth of primary factors can be analyzed with the
approach outlined for the decomposition of value added changes.
Let Qit: pr:lmary factor use in sector i in period t (t-1,2)
qit: primary factor coefficient i in period t (t-1,2)
In matrix form
Qt q t xt
where qt is a. diagonal matrix of coefficients.
Then, the firet stage of the decomposition process proceeds as
follows:
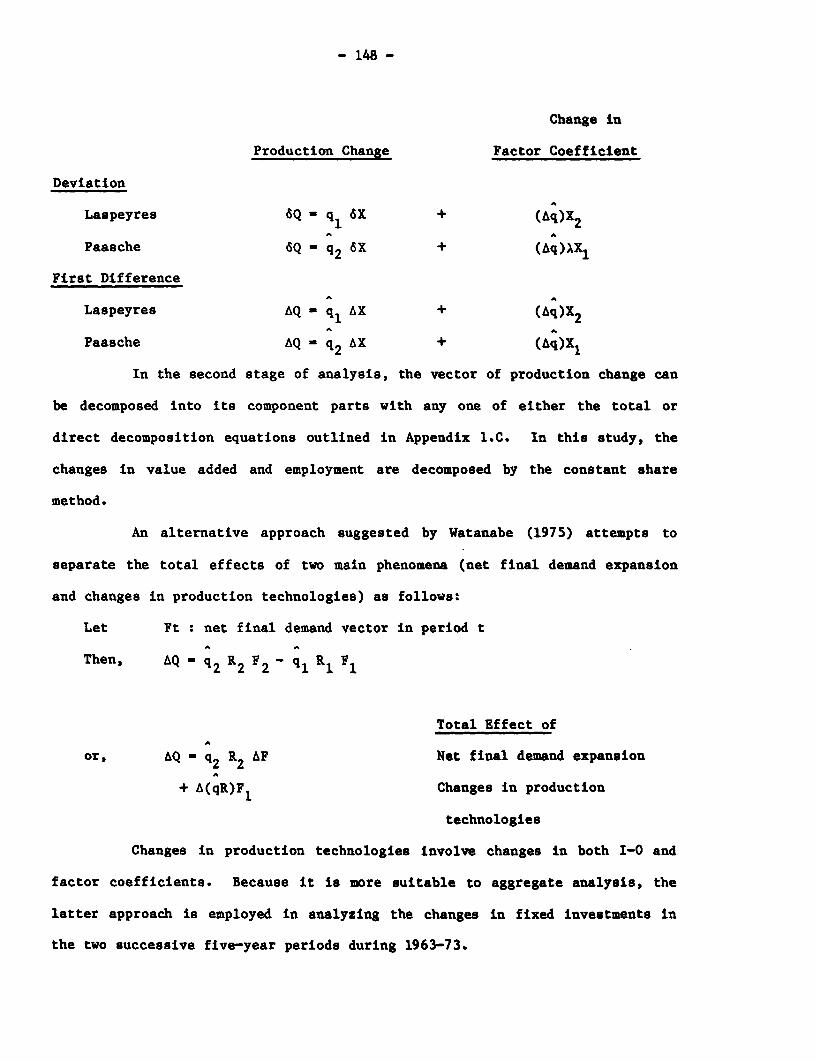
- 148 -
Change in
Production Change Factor Coefficient
Deviation
Laspeyres Q -q 6 + (Aq)X2
Paasche 6Q q2 6X + (Aq)X 1
First Difference
Laspeyres AQ - qAX + (Aq)X2
Paasche AQ -q2 AX + (Aq)X1
In the second stage of analysis, the vector of production change can
be decomposed into its component parts with any one of either the total or
direct decomposition equations outlined in Appendix 1.C. In this study, the
changes in value added and employment are decomposed by the constant share
method.
An alternative approach suggested by Watanabe (1975) attempts to
separate the total effects of two main phenomena (net final demand expansion
and changes in production technologies) as follows:
Let Ft : net final demand vector in period t
Then, AQ q2 R2 F2 - q1 1 1
Total Effect ofA
or, AQ q2 R2 AF Net final demand expansion
+ A(qR)F1 Changes in production
technologies
Changes in production technologies involve changes in both I-0 and
factor coefficients. Because it is more suitable to aggregate analysis, the
latter approach is employed in analyzing the changes in fixed investments in
the two successive five-year periods during 1963-73.
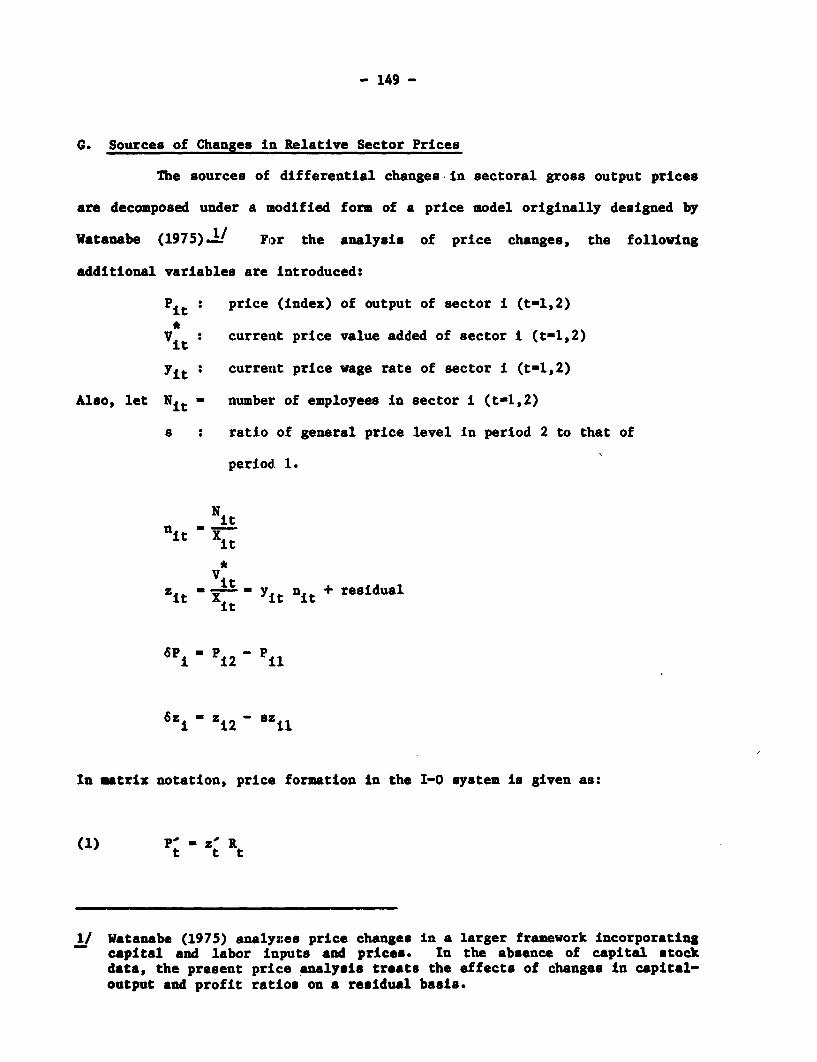
- 149 -
G. Sources of Changes in Relative Sector Prices
The sources of differential changes in sectoral gross output prices
are decomposed under a miodified form of a price model originally designed by
Watanabe (1975) .2 For the analysis of price changes, the following
additional variables are introduced:
Pit : price (index) of output of sector i (t-1,2)
Vit : current price value added of sector i (t-1,2)
Yit : current price wage rate of sector I (t-1,2)
Also, let Nit - number of employees in sector I (t-1,2)
8 : ratio of general price level in period 2 to that of
period 1.
Nitnit Xit
z Xi ' yi ni + residuali it it t
6i1 Pi2 ail
i 1i2 11
In matrix notation, price formation In the I-0 system is given as:
t t t
1/ Watanabe (1975) analyzes price changes in a larger framework incorporatingcapltal and labor inputs and prices. In the absence of capital stockdata, the present pric:e analysis treats the effects of changes in capital-output and profit ratios on a residual basis.
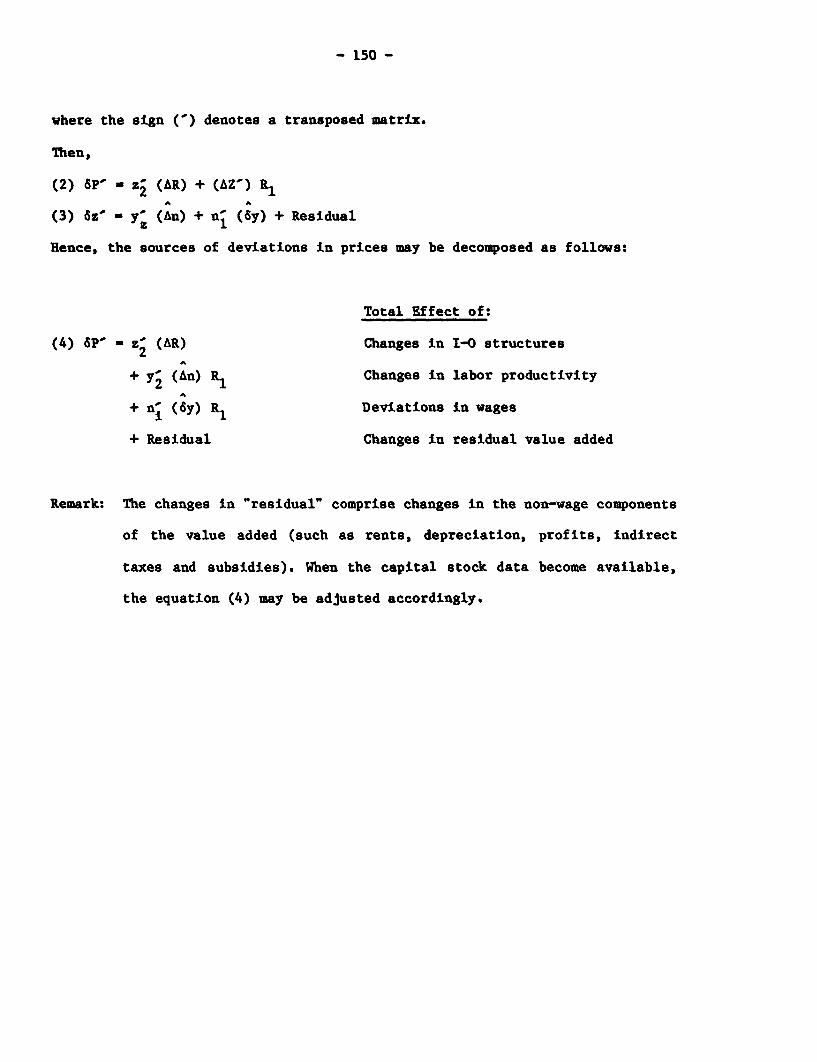
- 150 -
where the sign (') denotes a transposed matrix.
Then,
(2) pP' - Z2 (AR) + (AZ') R1
(3) Sz' - y; (An) + ni (dY) + Residual
Hence, the sources of deviations in prices may be decomposed as follows:
Total Effect of:
(4) 8P' - Z2 (AR) Changes in I-0 structuresA
+ Y2 (An) R. Changes in labor productivityA
+ ni (Sy) R1 Deviations in wages
+ Residual Changes in residual value added
Remark: The changes in "residual" comprise changes in the non-wage components
of the value added (such as rents, depreciation, profits, indirect
taxes and subsidies). When the capital stock data become available,
the equation (4) may be adjusted accordingly.
- 151 -
APPENDIX 2
DEFLATION OF THE TURKISH 1-0 TABLES:
A Summary Note on the Methodology and Related Empirical Research
A. General
This sources of growth study for Turkey is largely made possible by
three I-0 tables available for the benchmark years 1963, 1968 and 1973. These
tables have been adjusted and re-organized around 25X25 sectors, as defined in
Tables A2.1 and A2.2. The 1963 and 1973 tables were then deflated to constant
1968 prices. For the earlier benchmark years 1953 and 1958 (for which I-0
tables are not available), the data on sectoral output, trade and final demand
are also processed at the 25 sector level of aggregation, and estimated in
1968 prices.
The deflation oE the 1963 and 1973 tables to constant 1968 prices by
the double deflation method is briefly described in the following paragraphs.
(The deflation effort wasg somewhat simplified because imports are classified
by sector of origin (i.e., on a competitive basis) in the official Turkish I-0
tables.)
B. Deflation Procedure
Notation
Xi : sectoral production (or output) in current prices
(including indirect taxes on domestic output and
import taxes on imports (Mi))
Di : sectoral domestic final demand in current prices
Ei : sectoral exports (ex-factory) in current prices
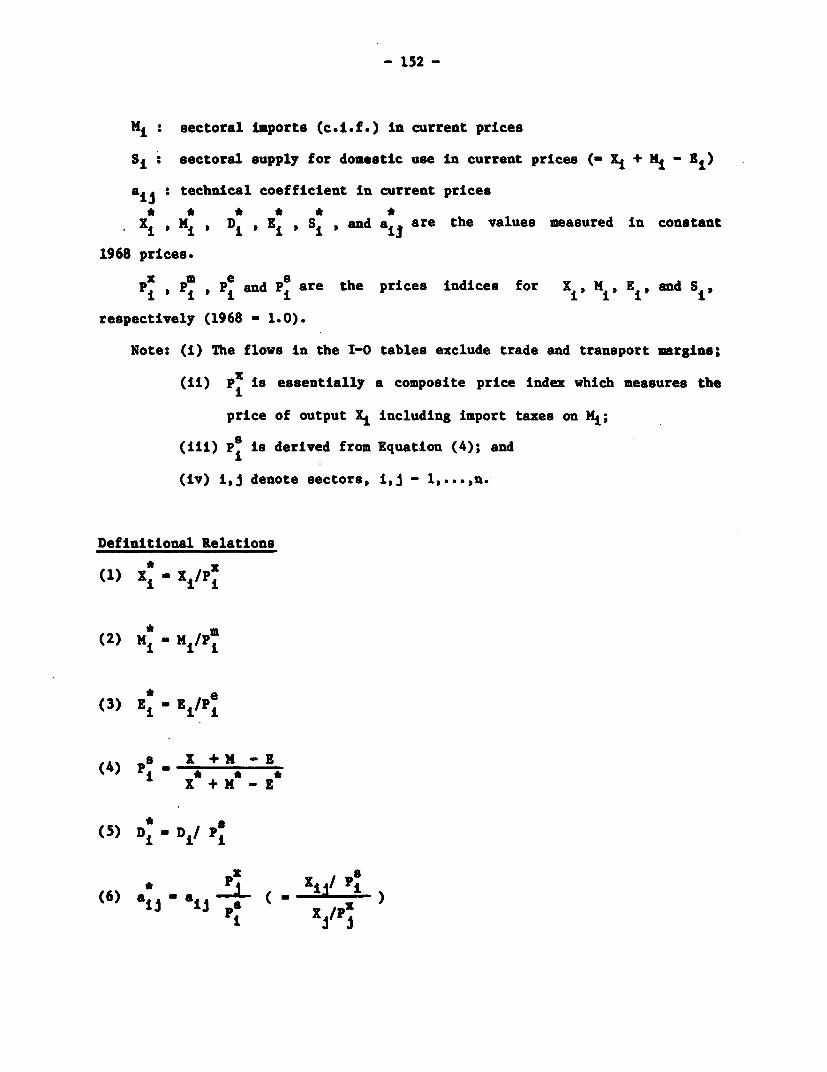
- 152 -
ML : sectoral Imports (c.l.f.) In current prices
S .: sectoral supply for domestic use in current prices (- Xi + Ml -Bi)
aii : technical coefficient in current prices
* * * * * *Xi Mi , Di * Bi * Si , and a., are the values measured In constant
1968 prices.
P , eand Pi are the prices indices for X1, Mis E., and Siv
respectively (1968 - 1.0).
Note: (i) The flows in the I-0 tables exclude trade and transport margins;
(11) Pz is essentially a composite price index which measures the
price of output Xi including import taxes on Mi;
(iii) P is derived from Equation (4); and
(iv) i,J denote sectors, i, -
Definitional Relations
(1) ;X 'i/Pi
(2) mN -N/P m
(3) E; E iP e
(4) P, X + M E
(5) D; - D Pi
(6) ai aij p (- )
I i /p
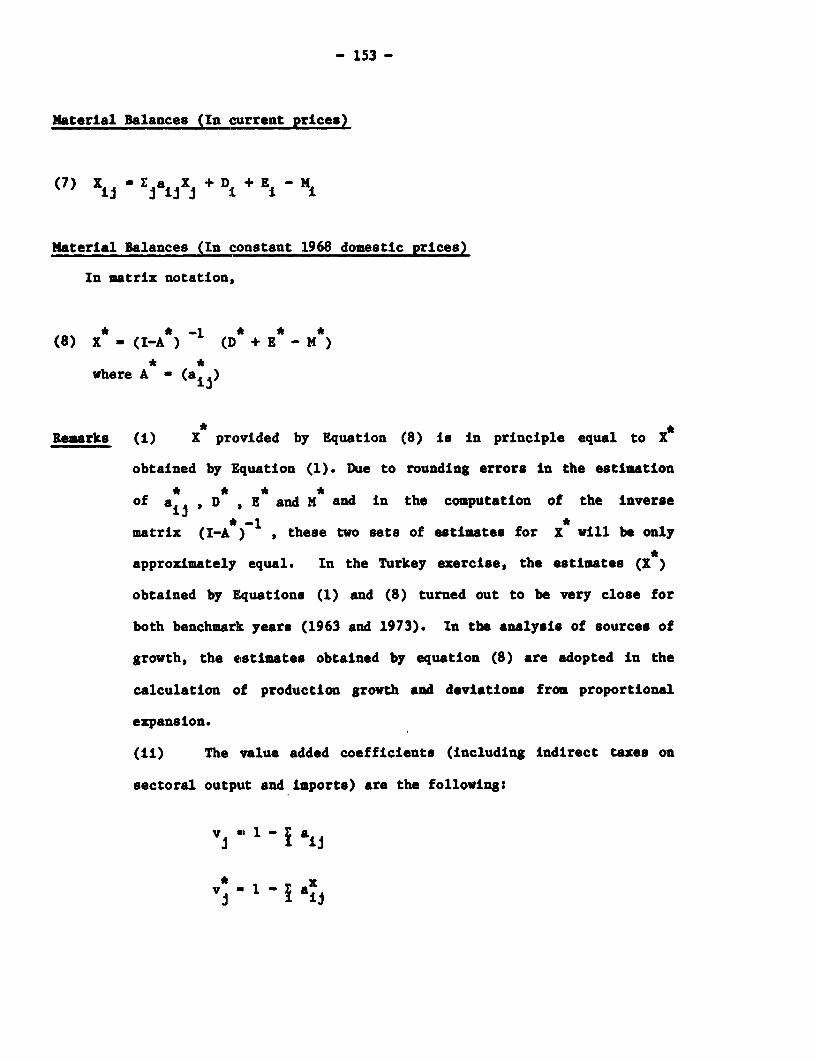
- 153 -
Material Balances (In current prices)
(7) X 1J Zai Xi + DI +E BI M-
Material Balances (In constant 1968 domestic prices)
In matrix notation,,
(8) g - (I-A ) 1(D + E -HM)* *
where A - (aij)
Remarks (i) X provided by Equation (8) is in principle equal to
obtained by Equation (1). Due to rounding errors in the estimation
* * * *of aij D E and M and In the computation of the inverse
matrix (I-A ) , these two sets of estimates for X will be only
approximately equal. In the Turkey exercise, the estimates (X )
obtained by Equations (1) and (8) turned out to be very close for
both benchmarlc years (1963 and 1973). In the analysis of sources of
growth, the estimates obtained by equation (8) are adopted in the
calculation of production growth and deviations from proportional
expansion.
(ii) The value added coefficients (including indirect taxes on
sectoral output and imports) are the following:
v~ ljaij
* ~~xv a 1- iav;j iii
- 154 -
Similarly, gross domestic product measured in current and
constant prices becomes,respectively:
GDP - E v X
and* * *
GDP - 5 viXi
For the comparison of national income estimates and deflated I-0
aggregates, sectoral value added figures are recomputed in producer
prices which are net of import taxes, as shown in Table 3.1 in
Chapter 3.
(iii) For decomposition of value added, it is sufficient to use the
estimates for (v) without recomputing them in terms of producer
prices in the strict sense (i.e., net of import tax on Mj).
C. Construction of Trade Price Indices
There are no sectorally arranged trade (i.e., import and export)
price indices available in Turkey which could be used in the present study.
Consequently, a special effort was required to construct sectoral trade price
indices (at a 25 sector level of aggregation, as defined in Table A.2.1) to
deflate current price sectoral trade data to constant domestic prices. The
empirical work undertaken in this context is outlined as follows:
(i) The year 1963 was taken as the base period in the original
calculation of sectoral average trade price indices, but subsequently the
base was switched to 1968. In view of the continually shifting
composition of trade (imports, in particular) during 1953-73, the year
1963 represents a more reasonable mid-point than the other benchmark
periods. The selection of 1963, which had a relatively strong balance of
payments, also makes it possible to contrast the characteristics of the
- 155 -
unplanned and planned eras of 1953-63 and 1963-73, respectively.
(ii) After the establishment of the base 1963, the next step was to
select two separate samples of commodities for the imports and exports of
each international sector in the I-0 system. The commodities included in
the samples were determined on two practical grounds: (1) the availability
of the quantity and value statistics at the commodity level in all
benchmark years; and (2) their relative importance in sectoral trade in
the larger segment of the period 1953-73. The commodity breakdown of
sectoral imports and exports of the 1963 I-0 table (in Chakraverti et al
(1970)), and the Ul!l Yearbooks of International Trade Statistics provided
helpful information at this point (see Tables A.2.6 and A.2.7).
(iii) The price indices for specific commodity imports (c.i.f.) and
exports (f.o.b.) incorporated in the sectoral samples were calculated in
terms of their unit: values with the base 1963, using Turkey's tables in
the UN Yearbooks of International Trade Statistics, for the benchmark
years 1953, 1958, 19168 and 1973. The years 1953 and 1958 represent three-
year averages for 1952-54 and 1957-59, respectively, in order to smooth
out the conjunctural variations in these subperiods. The US dollar values
of the international trade data were converted to local currency values
(i.e., Turkish lira) at the prevailing official exchange rates. For 1973,
the existence of multiple exchange rates was taken into account in view of
the State Institute of Statistics, (SIS) foreign trade data 1/
(iv) The average import and export price indices were calculated for
sectoral samples using the 1963 relative weights (with the Laspeyres
method), but were sritched to the base year 1968, which is the constant-
See, for example, (SIS) Statistical Yearbook of Turkey, 1975.
- 156 -
price reference year in the main study.
(v) In sectors where information on commodlty trade was limited and/or
inconsistent, World Bank price indices for world exports of minerals and
manufactured goods were used. l The Bank international price indices are
based on current US dollar values, and, therefore, had to be adjusted for
changes in Turkish foreign exchange rates during 1953-73. Because the
World Bank manufactured trade prices are adjusted for freight charges from
developed to developing countries, they could be directly used in the
calculation of Turkey's import price indices in manufacturing sectors
lacking adequate price data.
(vi) While the use of c.i.f. prices for imports is consistent with the
Turkish I-0 conventions, the f.o.b. price indices for sectoral commodity
exports needed to be adjusted for differences in f.o.b. and ex-factory
prices. As a result of the lack of readily available data on export
subsidies, and to avoid additional cumbersome work, it was assumed that
the long-term movements of the domestic f.o.b. and ex-factory prices were
approximately the same at the sector level during the time period of this
analysis. Thus, the domestic f.o.b. price indices were used to deflate
commodity export vectors in the current-price 1-0 tables.
(vii) The current values of invisible imports were deflated to constant
prices by the World Bank price index for manufactured goods trade.
However, the deflation of the invisible service exports in the 1-0 tables
required two types of treatment for: (1) distributional (mainly, trade and
transport) margins on commodity exports; and (2) direct service exports.
For the first part, the economy-wide average (commodity) f.o.b. price
See World Bank (1975), "Price Forecasts for Major Primary Commodities,"Tables 11 and 17.
- 157 -
index was used. Second, the direct service exports were deflated by the
Bank price index used for Invisible imports.
(viii) To fill various small gaps in trade price statistics, available
expert judgment was used (e.g., the minor account of electricity trade in
1973). Tables A..2.3 and A.2.4 list the results of empirical work on the
construction of trade price indices, while Tables A.2.6 and A.2.7 present
the base period weights of 1963 for commodity imports and exports in
individual sectors,
D. Construction of Price Indices for Production and Supply
The price indices for production (or output) and supply at the 25
sector level were constructed for the deflation of the 1963 and 1973 I-0
tables into 1968 constant prices. The sectoral production estimates for the
benchmark years 1953 and 1958 were derived primarily from the data expressed
in 1968 prices, and thLus required no special work on production prices.
For the years 1963 and 1973, the main sources of production price
data were (1) the new Wholesale Price Index (new WPI) of the Ministry of
Commerce and SIS,1/ and (2) the sectoral value added deflators used in the
national accounts worked out by the SIS. While the first source was used in
estimating the prices of agricultural and industrial production (with some
adjustments for the year 1973), the second source was used to estimate the
service sectors' prices. As Indicated above, the gross production price (Pi)
is essentially a comlposite price Index which defines the price of production
Xi including import taxes on M1 . Consequently, the construction of this index
involved several steps as follows:
(i) Determination of the sectoral production figures net of import taxes
See Gocmencelebi (1974).
- 158 -
in current price I-0 tables that were rearranged at the 25 sector level of
aggregation;
(ii) Estimation of price indices for sectoral production net of Import
taxes (from the new WPI and GDP deflator series);
(iil) Deflation of sectoral production data, net of import taxes, by price
indices estimated in step (ii) into 1968 constant prices;
(iv) Estimation of sectoral import taxes in 1968 prices, using 1968 tax
rates on deflated sectoral imports;
(v) Calculation of the 1968 constant price value of Xi by adding the
reestimated import taxes (in 1968 prices) to the deflated net production
figures determined in step (iii); and
(vi) Estimation of the gross production price (Pi) on the basis of the
current price and constant price value of Xi After the estimation of
the price index (pt) , the sectoral supply price (Pt) was determined in a
manner shown in subsection B in this annex, using Equation (4). The
results are listed in Table A.2.5.
Although the use of the United Nations ISIC sectoral classification
in the new WPI, unlike the other WPIs available in Turkey, facilitates the
construction of production price deflators for I-0 studies, the new WPI
estimates are not realistic in some periods during which substantial price
changes took place in the economy. In particular, for the period 1972-73, the
new WPI data does not adequately reflect the increases that actually occurred
in industrial prices. As a result, it underestimates the rise in the general
price level. The alternative price estimates for this period are the
following:
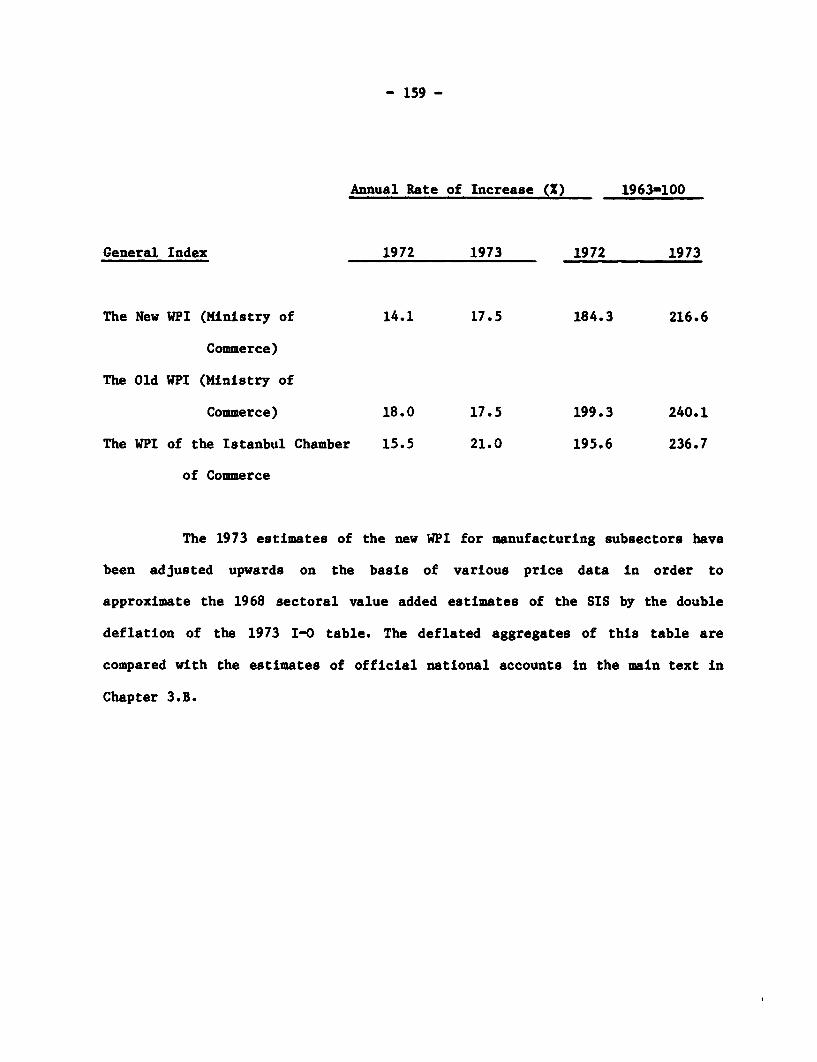
- 159 -
Annual Rate of Increase (x) 1963-100
General Index 1972 1973 1972 1973
The New WPI (Ministry of 14.1 17.5 184.3 216.6
Commerce)
The Old WPI (Ministry of
Commerce) 18.0 17.5 199.3 240.1
The WPI of the Istanbul Chamber 15.5 21.0 195.6 236.7
of Commerce
The 1973 estimates of the new WPI for manufacturing subsectors have
been adjusted upwards on the basis of various price data in order to
approximate the 1968 sectoral value added estimates of the SIS by the double
deflation of the 1973 I-0 table. The deflated aggregates of this table are
compared with the estimates of official national accounts in the main text in
Chapter 3.B.
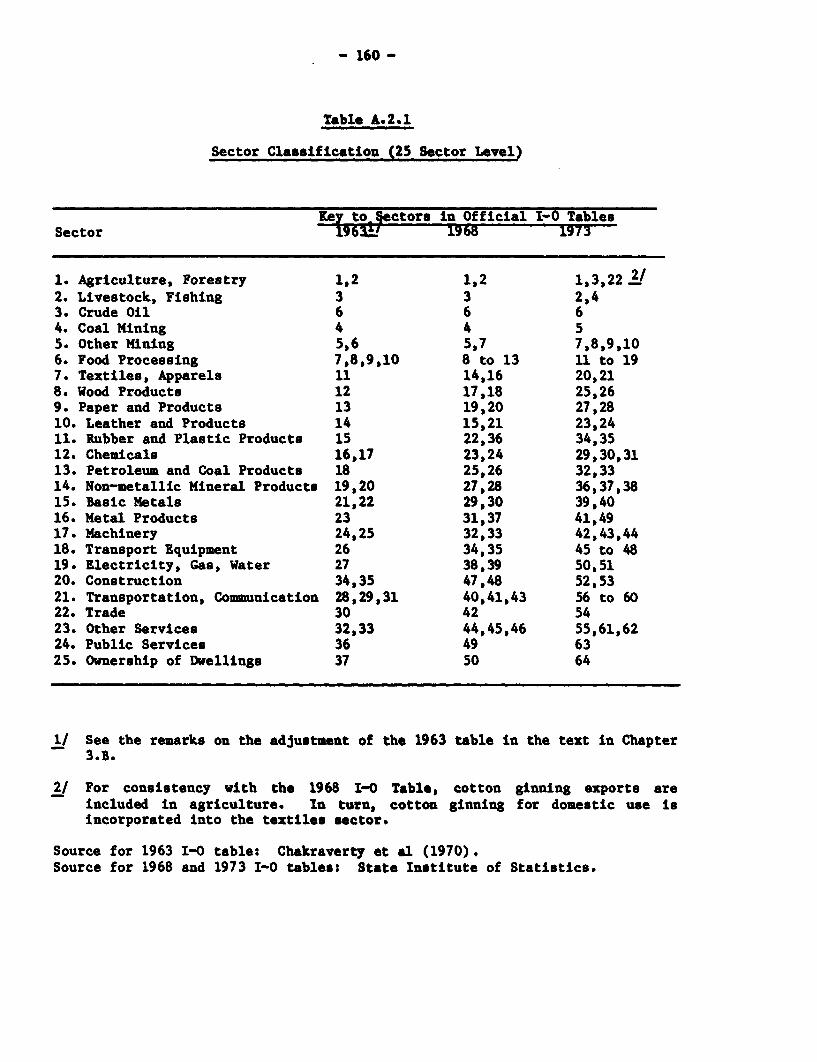
- 160 -
Table A.2.1
Sector Classification (25 Sector Level)
KSt tojSectors in Official -O TablesSector 19 6 1-11 196 - 19731
1. Agriculture, Forestry 1,2 1,2 1,3,221/2. Livestock, Fishing 3 3 2,43. Crude Oil 6 6 64. Coal Mining 4 4 55. Other Mining 5,6 5,7 7,8,9,106. Food Processing 7,8,9,10 8 to 13 11 to 197. Textiles, Apparels 11 14,16 20,218. Wood Products 12 17,18 25,269. Paper and Products 13 19,20 27,2810. Leather and Products 14 15,21 23,2411. Rubber and Plastic Products 15 22,36 34,3512. Chemicals 16,17 23,24 29,30,3113. Petroleum and Coal Products 18 25,26 32,3314. Non-metallic Mineral Products 19,20 27,28 36,37,3815. Basic Metals 21,22 29,30 39,4016. Metal Products 23 31,37 41,4917. Machinery 24,25 32,33 42,43,4418. Transport Equipment 26 34,35 45 to 4819. Electricity, Gas, Water 27 38,39 50,5120. Construction 34,35 47,48 52,5321. Transportation, Communication 28,29,31 40,41,43 56 to 6022. Trade 30 42 5423. Other Services 32,33 44,45,46 55,61,6224. Public Services 36 49 6325. Ownership of Dwellings 37 50 64
1/ See the remarks on the adjustment of the 1963 table in the text in Chapter3.B.
2/ For consistency with the 1968 1-0 Table, cotton ginning exports areIncluded in agriculture. In turn, cotton ginning for domestic use isincorporated Into the textiles sector.
Source for 1963 I-0 table: Chakraverty et al (1970).Source for 1968 and 1973 I-0 tables: State Institute of Statistics.
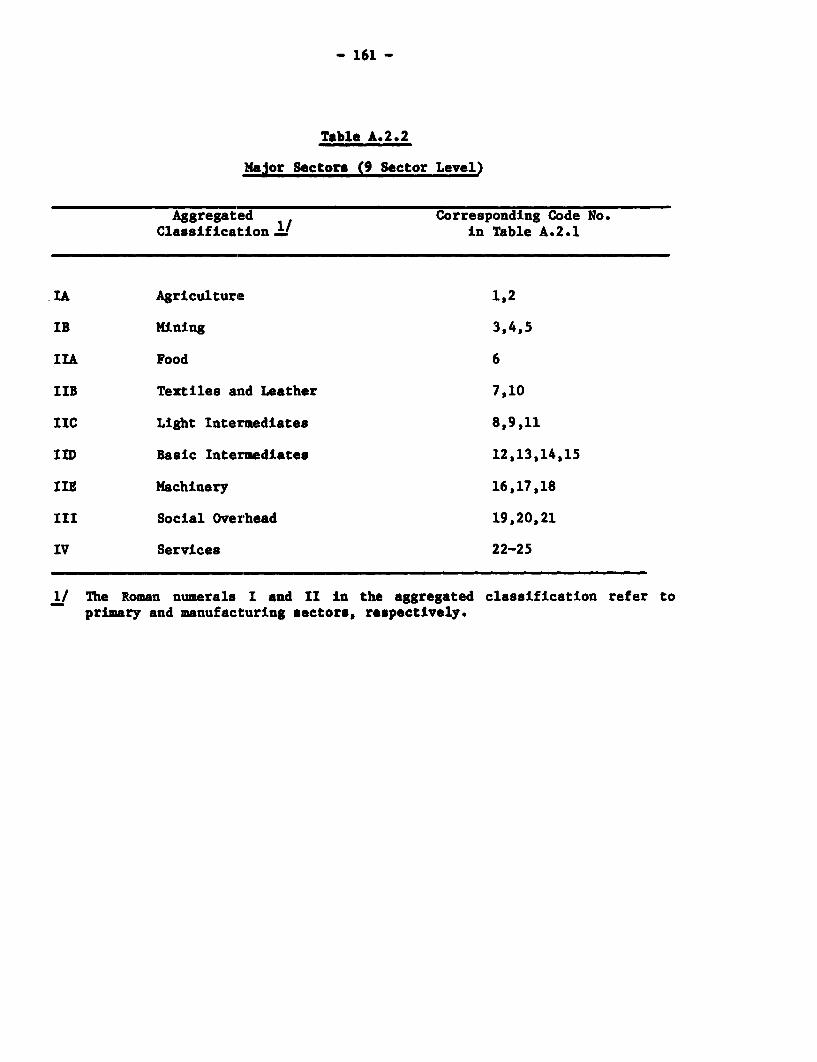
- 161 -
Table A.2.2
Major Sectors (9 Sector Level)
Aggregated Corresponding Code No.Classification Ž1 in Table A.2.1
IA Agriculturie 1,2
IB Mining 3,4,5
IlA Food 6
IIB Textiles and Leather 7,10
IIC Light Intermediates 8,9,11
IID Basic Intermediates 12,13,14,15
III Machinery 16,17,18
III Social Overhead 19,20,21
IV Services 22-25
1/ The Roman numerals I and II in the aggregated classification refer toprimary and manufacturing sectors, respectively.
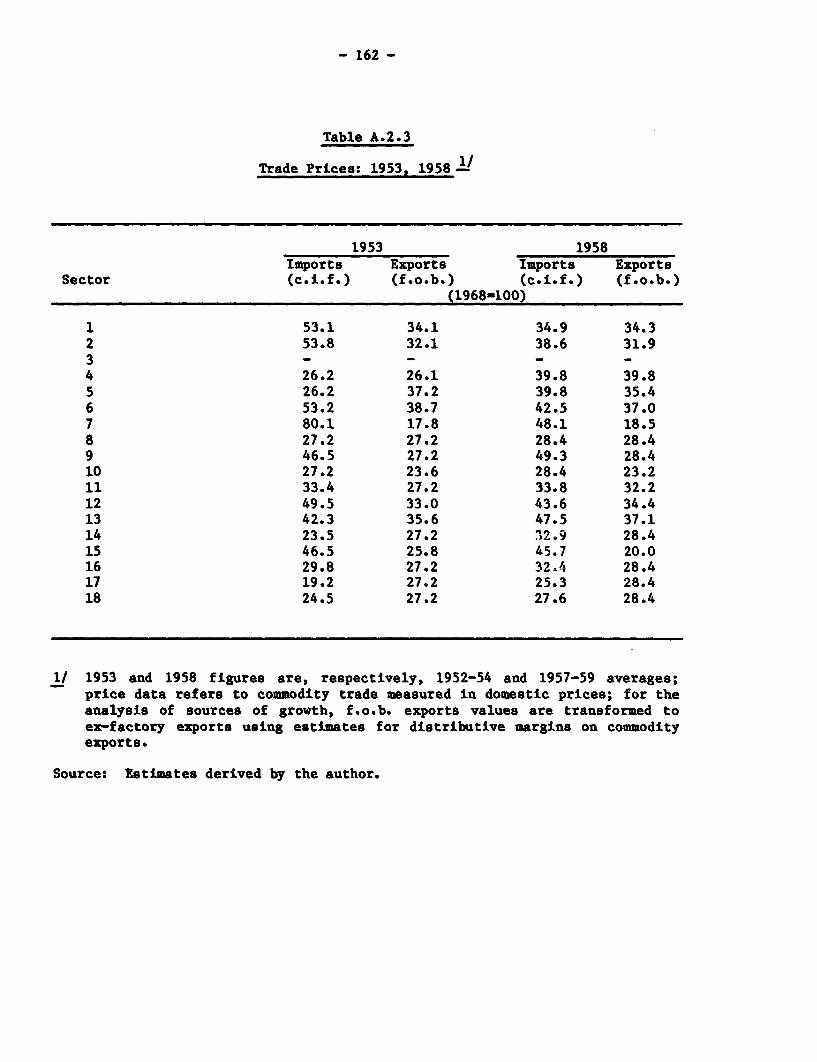
- 162 -
Table A.2.3
Trade Prices: 1953, 1958 1,
1953 1958Imports Exports Imports Exports
Sector (c.i.f.) (f.o.b.) (c.i.f.) (f.o.b.)(1968-100)
1 53.1 34.1 34.9 34.32 53.8 32.1 38.6 31.934 26.2 26.1 39.8 39.85 26.2 37.2 39.8 35.46 53.2 38.7 42.5 37.07 80.1 17.8 48.1 18.58 27.2 27.2 28.4 28.49 46.5 27.2 49.3 28.410 27.2 23.6 28.4 23.211 33.4 27.2 33.8 32.212 49.5 33.0 43.6 34.413 42.3 35.6 47.5 37.114 23.5 27.2 32.9 28.415 46.5 25.8 45.7 20.016 29.8 27.2 32.4 28.417 19.2 27.2 25.3 28.418 24.5 27.2 27.6 28.4
1/ 1953 and 1958 figures are, respectively, 1952-54 and 1957-59 averages;price data refers to commodity trade measured in domestic prices; for theanalysis of sources of growth, f.o.b. exports values are transformed toex-factory exports using estimates for distributive margins on commodityexports.
Source: Estimates derived by the author.
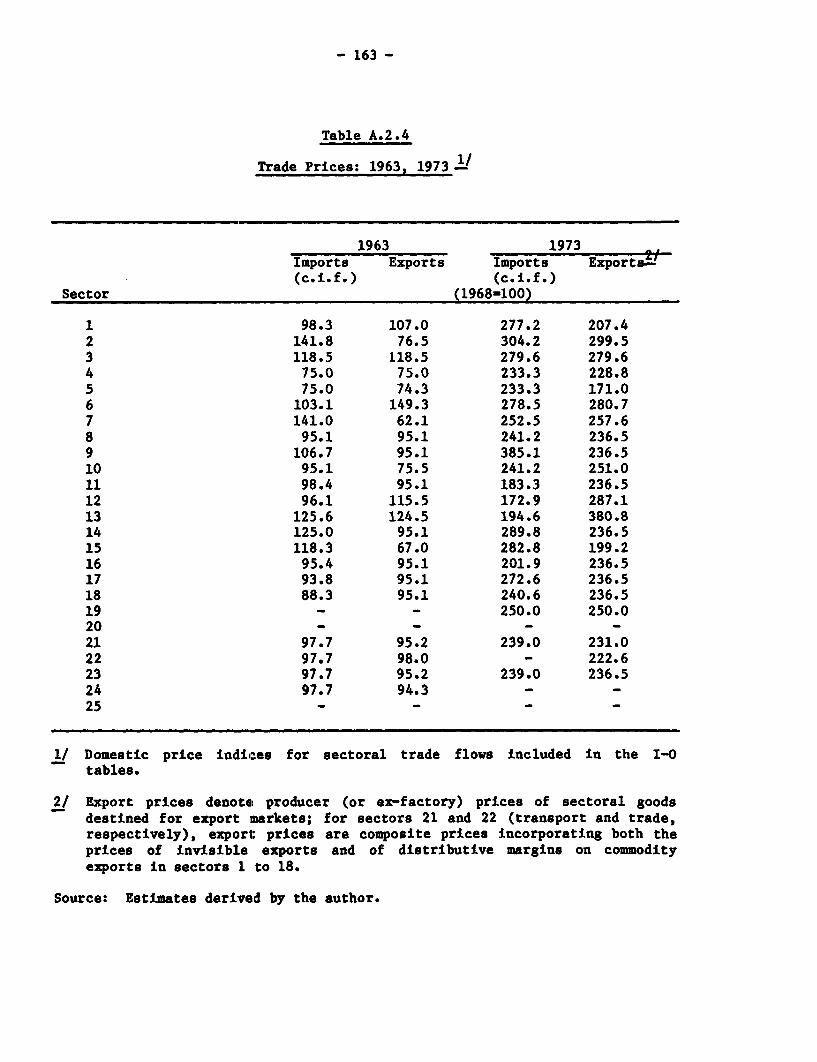
- 163 -
Table A.2.4
Trade Prices: 1963, 1973 1,
1963 _ 1973 ^Imports Exports Imports Exports-(c.i.f.) (c.i.f.)
Sector (1968-100)
1 98.3 107.0 277.2 207.42 141.8 76.5 304.2 299.53 118.5 118.5 279.6 279.64 75.0 75.0 233.3 228.85 75.0 74.3 233.3 171.06 103.1 149.3 278.5 280.77 141.0 62.1 252.5 257.68 95.1 95.1 241.2 236.59 106.7 95.1 385.1 236.510 95.1 75.5 241.2 251.011 98.4 95.1 183.3 236.512 96.1 115.5 172.9 287.113 125.6 124.5 194.6 380.814 125.0 95.1 289.8 236.515 118.3 67.0 282.8 199.216 95.4 95.1 201.9 236.517 93.8 95.1 272.6 236.518 88.3 95.1 240.6 236.519 - - 250.0 250.020 - - - -21 97.7 95.2 239.0 231.022 97.7 98.0 - 222.623 97.7 95.2 239.0 236.524 97.7 94.3 - -25 - - _ _
1/ Domestic price indices for sectoral trade flows included in the I-0tables.
2/ Export prices denote! producer (or ex-factory) prices of sectoral goodsdestined for export markets; for sectors 21 and 22 (transport and trade,respectively), export: prices are composite prices incorporating both theprices of invisible exports and of distributive margins on commodityexports in sectors 1 to 18.
Source: Estimates derived by the author.
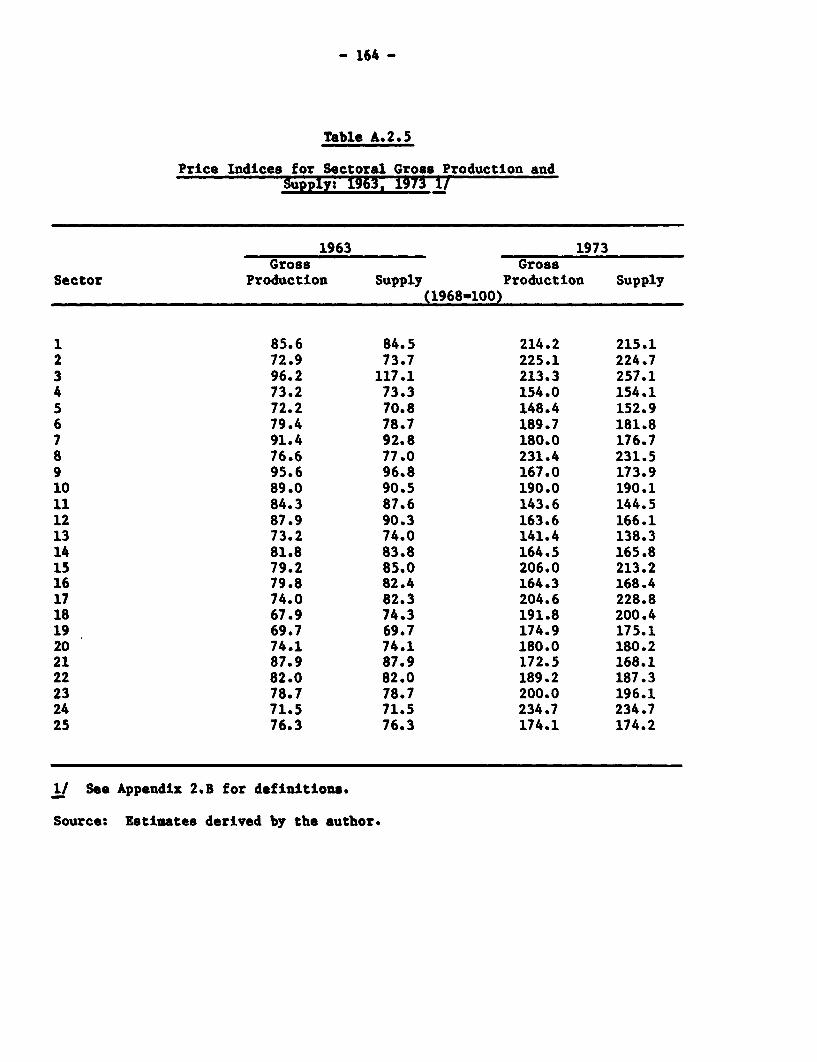
- 164 -
Table A.2.5
Price Indices for Sectoral Gross Production andSupply: 1963, 1973 1/
1963 1973Gross Gross
Sector Production Supply Production Supply(1968-100)
1 85.6 84.5 214.2 215.12 72.9 73.7 225.1 224.73 96.2 117.1 213.3 257.14 73.2 73.3 154.0 154.15 72.2 70.8 148.4 152.96 79.4 78.7 189.7 181.87 91.4 92.8 180.0 176.78 76.6 77.0 231.4 231.59 95.6 96.8 167.0 173.910 89.0 90.5 190.0 190.111 84.3 87.6 143.6 144.512 87.9 90.3 163.6 166.113 73.2 74.0 141.4 138.314 81.8 83.8 164.5 165.815 79.2 85.0 206.0 213.216 79.8 82.4 164.3 168.417 74.0 82.3 204.6 228.818 67.9 74.3 191.8 200.419 69.7 69.7 174.9 175.120 74.1 74.1 180.0 180.221 87.9 87.9 172.5 168.122 82.0 82.0 189.2 187.323 78.7 78.7 200.0 196.124 71.5 71.5 234.7 234.725 76.3 76.3 174.1 174.2
1/ See Appendix 21B for definitions.
Source: Estimates derived by the author.
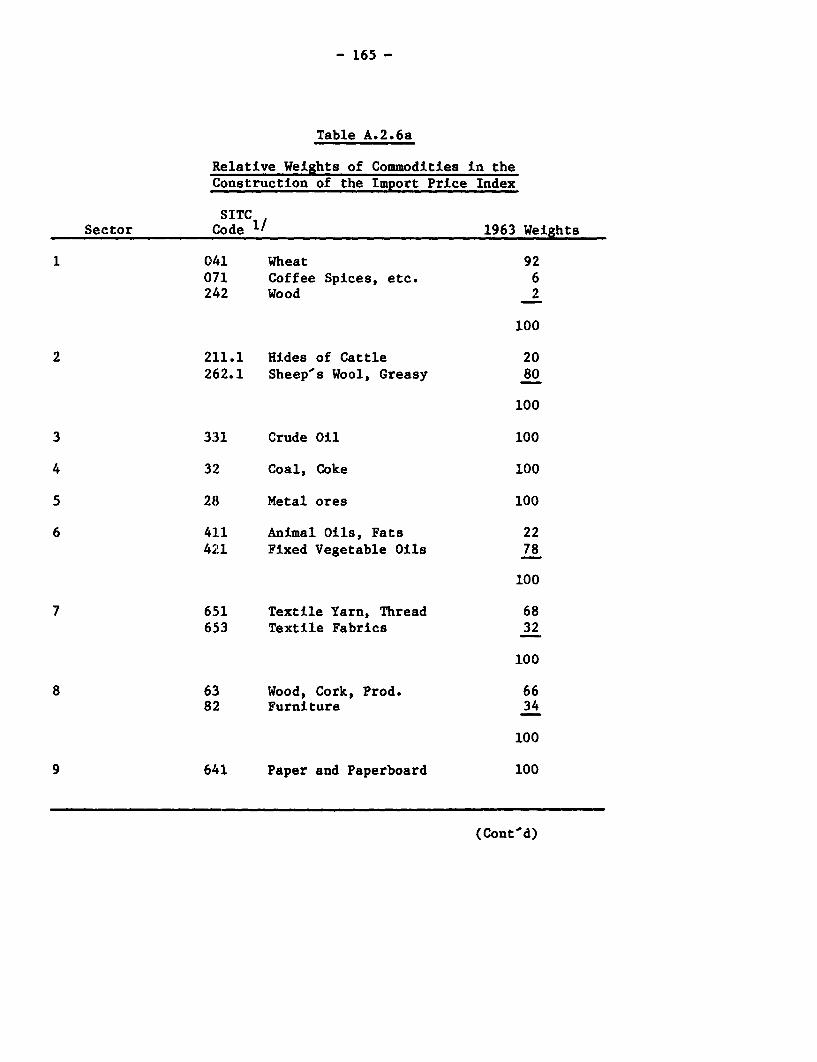
- 165 -
Table A.2.6a
Relative Weights of Commodities in theConstruction of the Import Price Index
SITCSector Code 1/ 1963 Weights
1 041 Wheat 92071 Coffee Spices, etc. 6242 Wood 2
100
2 211.1 Hides of Cattle 20262.1 Sheep's Wool, Greasy 80
100
3 331 Crude Oil 100
4 32 Coal, Coke 100
5 28 Metal ores 100
6 411 Animal Oils, Fats 22421 Fixed Vegetable Oils 78
100
7 651 Textile Yarn, Thread 68653 Textile Fabrics 32
100
8 63 Wood, Cork, Prod. 6682 Furniture 34
100
9 641 Paper and Paperboard 100
(Cont'd)
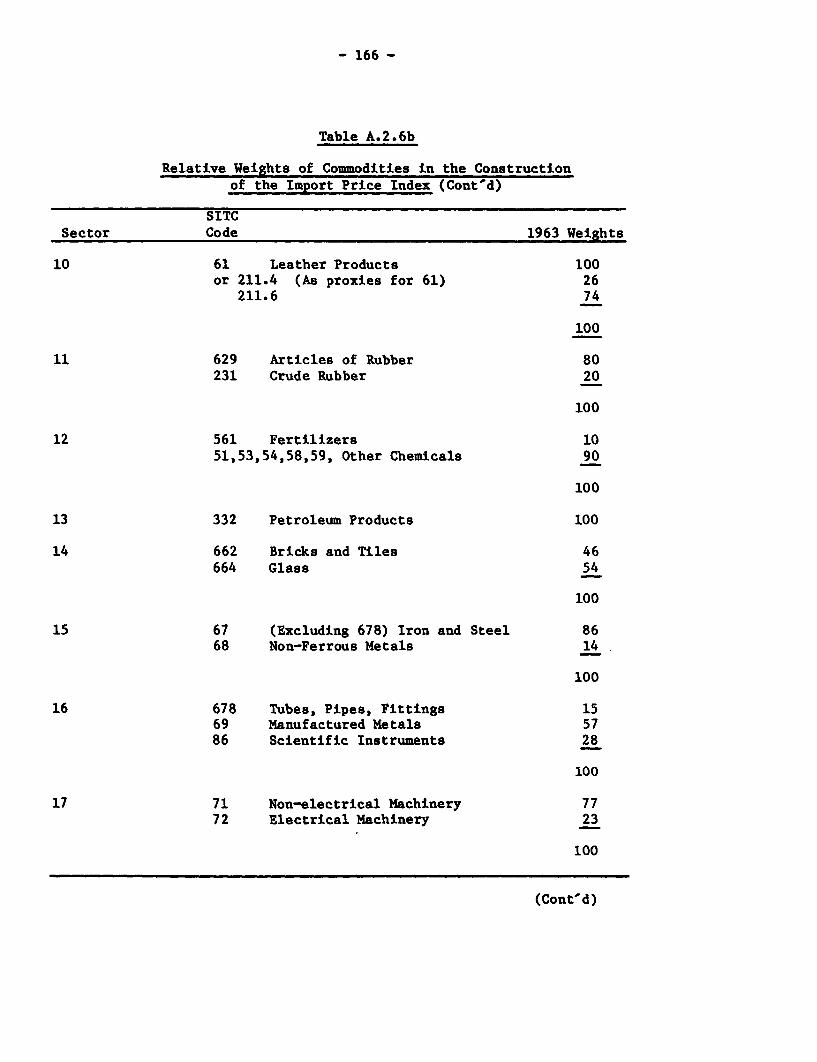
- 166 -
Table A.2.6b
Relative Weights of Commodities in the Constructionof the Import Price Index (Cont'd)
SITCSector Code 1963 Weights
10 61 Leather Products 100or 211.4 (As proxies for 61) 26
211.6 74
100
11 629 Articles of Rubber 80231 Crude Rubber 20
100
12 561 Fertilizers 1051,53,54,58,59, Other Chemicals 90
100
13 332 Petroleum Products 100
14 662 Bricks and Tiles 46664 Glass 54
100
15 67 (Excluding 678) Iron and Steel 8668 Non-Ferrous Metals 14
100
16 678 Tubes, Pipes, Fittings 1569 Manufactured Metals 5786 Scientific Instruments 28
100
17 71 Non-electrical Machinery 7772 Electrical Machinery 23
100
(Cont'd)
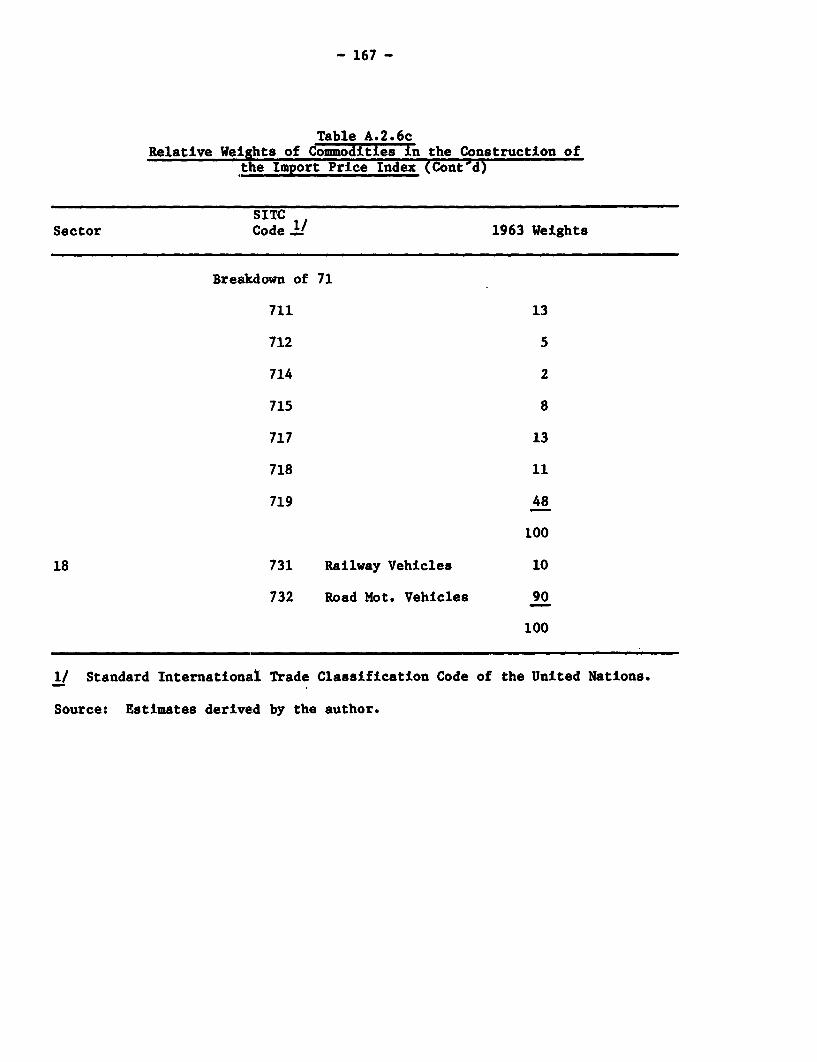
- 167 -
Table A.2.6cRelative Weights of Commodities in the Construction of
the Import Price Index (Cont'd)
SITCSector Code - 1963 Weights
Breakdown of 71
711 13
712 5
714 2
715 8
717 13
718 11
719 48
100
18 731 Railway Vehicles 10
732 Road Mot. Vehicles 90
100
I/ Standard International Trade Classification Code of the United Nations.
Source: Estimates derived by the author.
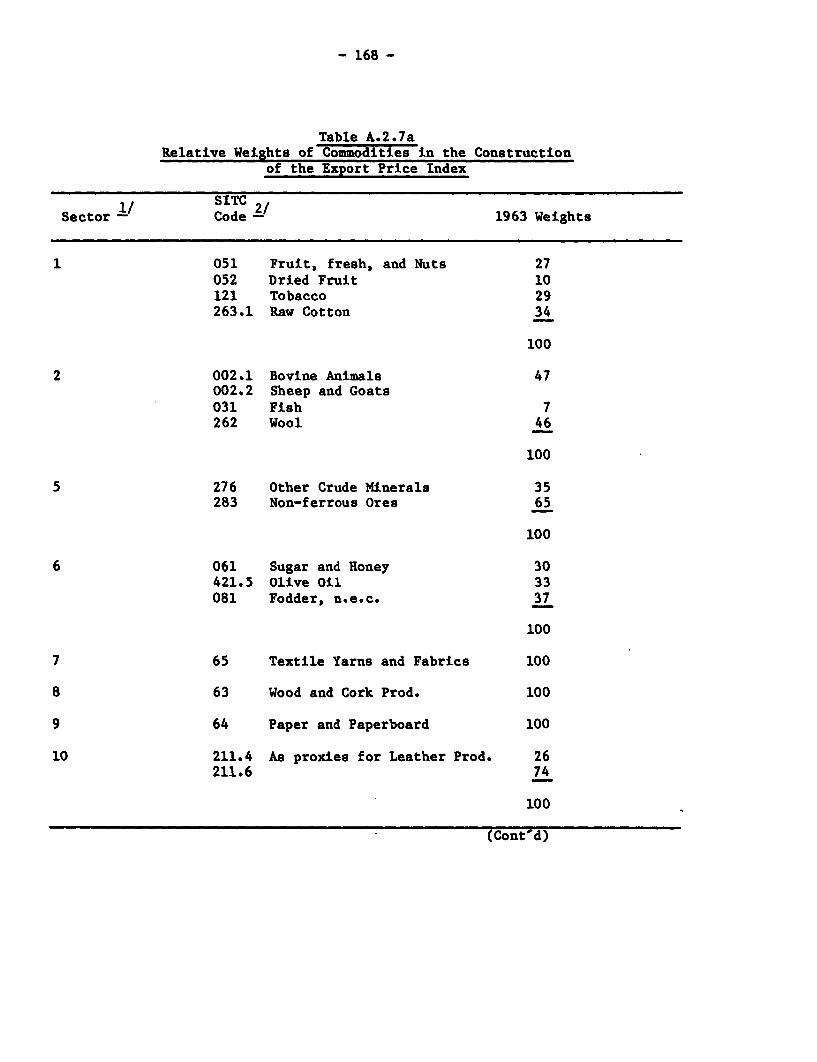
- 168 -
Table A.2.7aRelative Weights of Commodities in the Construction
of the Export Price Index
1/ SITC 2/Sector - Code - 1963 Weights
1 051 Fruit, fresh, and Nuts 27052 Dried Fruit 10121 Tobacco 29263.1 Raw Cotton 34
100
2 002.1 Bovine Animals 47002.2 Sheep and Goats031 Fish 7262 Wool 46
100
5 276 Other Crude Minerals 35283 Non-ferrous Ores 65
100
6 061 Sugar and Honey 30421.5 Olive Oil 33081 Fodder, n.e.c. 37
100
7 65 Textile Yarns and Fabrics 100
8 63 Wood and Cork Prod. 100
9 64 Paper and Paperboard 100
10 211.4 As proxies for Leather Prod. 26211.6 74
100
(Cont'd)
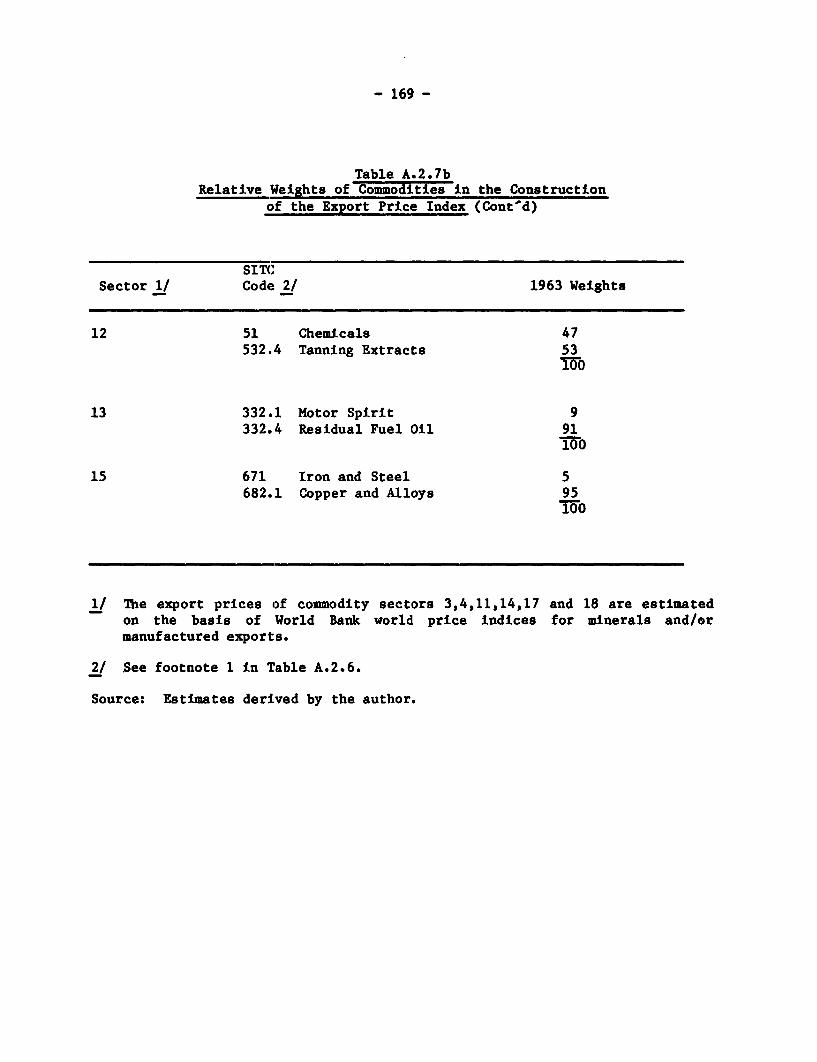
- 169 -
Table A.2.7bRelative Weights of Commodities in the Construction
of the Esport Price Index (Cont'd)
SITCSector 1/ Code 2/ 1963 Weights
12 51 Chemicals 47532.4 Tanning Extracts 53
13 332.1 Motor Spirit 9332.4 Residual Fuel Oil 91
15 671 Iron and Steel 5682.1 Copper and Alloys 95
1/ The export prices of commodity sectors 3,4,11,14,17 and 18 are estimatedon the basis of World Bank world price indices for minerals and/ormanufactured exports.
2/ See footnote 1 in Table A.2.6.
Source: Estimates derived by the author.

World Bank Capital Utilization in Development FinanceManufactuing: Colombia, Companies
Publications Israel, Malaysia, and the Cxamines the role of development
of Related nippfines finance companies as major mecha-Romeo M. Bautista, nisms for assisting medium-scaleInterest lHelen Hughes, David Lirm productive Industries, assesses theirDavid Morawetz, and potential for aiding small enterprisesIn meeting socioeconomic objectivesFrancisco E. Thoumi of developing countries, andThe authors surveyed L 200 discusses the evolution of Worldmanufacturing firms in four develop- Bank assistance to them.Ing countries to estabiish actual Sector Policy Paper. April 1976. 68levels of capital utilization. The infor- pgsicuig7anxs.EgLhmation collected was the first and pages (anciuding 7 annexes). Engish.remains the only data base available French, German, and Spanish.for the study of capital utilization. It Stock Nlos. PP-7601-E, PP-7601-F,was found that capital utilization Is PP-7601-G, PP-7601-S. $5.00.Automotive Industies im not as low as had been supposed.
Developing Countries The study Is concemed with factorsJack Baranson that cause differences in levels of Empirical Justification forThe role of intemadonal corpora- capital utlization and the policies Infant Industry Protectiontions, the adaptadon problems of that might be used to increase It. Larry E. Westphaltheir affiliates, and the impact of Oxford University Press, 1982. 288 Reviews the empirical evidenceeconomic policy on market structure. pages (including bibliography, Index). available concerning the nature ofThe Johns Hopkins Uniuersity Prss, LC 81-9526. ISBNl 0-19-520268-6, the costs and benefits of infant1969. 120 pages (including statistical $22.00 hardcouer. stry deveopment and formsannex). some hypotheses about policies to
promote Infant Industries. Based onLC 77-85339. ISBt 0-8018-1086-8, CtBenefit Evaluaton of research conducted under the$5.00 (L3.00) paperback. LC "ndu t Ealuaton oSources of Industrial Growth andSpanish: La industria automotriz en los WDich Inlue Foreign Structual Change" research project.pases en desarrollo. Editorial Tecnos, Ownersh gn World Bank Staff Working Paper No.1971. eEarry Cc. Pursell 445. March 1981. 38 pages (including320 pesetas.QarQ.Preirfens)
320 pesetas. ~~~~Describes a methodology for treating Stfemckesl.WP04.$0.foreign capital for cross-section cost- Stock No. WP0445. $3.00.
A Brief Review of the benefit studies when there Is Invest-World Lube Oils Industry ment by foreigners that Is specific to Employment and Develop.A. Ceyhan, H. Kohil, a particular activity. Illustrates the ment of SmaUl EnterprlseL. WUjetiileke, and methodology by using the results David L. Gordon,BR. WiJetilheke, andof a larger study of eighty-four corinain authorB. R. Choudhury. manufacturing firms In the coordinating authorThis report assesses the structure. Ivory Coast. Examines the potential role of thebackground. and outlook for the World Bank Staff Working Paper NIo. World Bank in encouraging develop-world lube oils Industry. Presents the 465, July 1981. 45 pages. Ing countries to assist smallhistorical and projected lube oils enterprises and suggests that effl-demand and trends In manufacturing Stock Nlo. WP-0465. $3.00. clent substitution of labor for capitaltechnologies and production capacity is possible In a broad spectrum ofand provides an indicative assess- small-scale manufacturing and otherment of the economics of lube oil activities that are able to absorb aproduction with detailed market and rapidly growing labor force.economic data. Sector Policy Paper. February 1978. 93Energy Industries Report Series No. 1. pages (including 3 annexes). EngiLsh,1982. 48 pages (including 13 annexes, French, and Spanish.references). Stock Nlos. PP-7803-E, PP-7803-F,ISBN 0-8213-0054-7. $3.00. PP-7803-S. $5.00.
ESstfimnating Total Factor isw that an intemational safeguard codeProductivity Growth in a should be InsUtuted to smooth theDeveloping Country IndustriaFizaffon and process of adjustment to freer tradeAnne 0. Krueger and Growth-The Experienceof in the developed countries.Baran Tuncer Large Countries World Bank Staff Working Paper No.
World Bank Staff Working Paper No. Hiollis Chenery 453. April 1981. 30 pages (including422. October 1980. 64 pages (includ- Discusses common elements of the ppeing references, appendix). experience of large developing coun- Stock No. WP-0453. $3.00.
Stock No. WP-0422. $3.00. tries with industrialization, drawingon the World Banks research projecton 'The Sources of Industrial Growth Industrial Strategy for Lateand Structural Change:. It was pre- Starters: The Experience
NEW sented to a conference of the Chinese of Kenya. TanzaniaAcademy of Science and Is designed and Zambia
Financing Small-Scale to provide a comparative framework Ravi Gulhati andIndustry and Agriculiture in for assessing the performance of the Uda Sekhar
DeVeloping Countries: The Chinese economy. It shows thatdDeveloping Countries: The despite Its unique features, China Assesses the extent and nature of
Merits and Limitations of shares many characteristics with industrialization in three African"Commercial" Policies other large semi-industrial countries. countries. Summarizes the record ofDennis Anderson and Notes some implications for trade Industrial development during theFarida Khambata policy and future growth. last twenty-five years and exploresA discussion of how two factors lead World Bank Staff Working Paper No. some of the issues facing theseto an unwillingness of financial 539.1982. 38 pages. Industrial policies.Institutions to finance small-scale ISBN 0-8213-0097-0. $3.00.Industry and agriculture In developing World Bank Staff Working Paper No.countries: (a) controls In Interest rates 457. May 1981. 63 pages (includingand (b) the Initially high risks and Industrial Project Analysis: references, annex).administrative costs involved. Notes Case Studies Stock No. WP-045 7. $3.00.that most economists appeal for a Frank H. Lamson-Scribner, Jr.relaxation of the controls, but showsthat this policy alone will not achieve Cases and exercises dealing withan efficient flow of finance to small- financial and economic analysis, and Korean Industrial Compe-scale activities. Draws on observa- project preparation and optimization. tence: Where It Came Fromtions madejdutrin sevel countries and World Bank (EDI), January 1977. xii Larry E. Westphal,
outlines ways to reduce risks and + 211 pages. (Available from ILS, Yung W. Rhee, andadministrative costs over time. 1715 Connecticut Avenue, N.W., Garry G. PursellWorld Bank Staff Working Paper Yo. Washington, D.C. 20009, U.S.A.) Discusses how Kiorea has been able519. May 1982. r pages ( diglPpeng $5.00 paperback. to establish successfully an indepen-519.eMayn1982. 41 pages (including dent base of technological know-howreferences). and marketing expertise In manyISBN-0-8213-0007-5. $3.00. Industrial Prospects and sectors during the past fifteen years
Policies in the Developed and suggests how KNorea'sCountriles experiences might be useful In
Fostering the Capital. Bela Balassa programming the development ofGoods Sector in LDCs: A other countries that are currently atSurvey of Evidence and Addresses the allegations that eariler stages of Industrialization.Requirements Increases In the Import of manufac- World Bank Staff Working Paper No.Howard Fack tured goods from developing coun- Juld 76 paff (includiNg
tries adversely affect the industrial 469. July 1981. 76 pages (IncludingWorld Bank Staff Working Paper No. sector in the developed countries references).376. March 1980. v + 59 pages and that growing protectionism in Stock No. WP-0469. $3.00.(Including references). the deveioped countries has made It
Stock Mo WP~03 7. $3.00.necessary for developing countries toStock Nlo. WP-0376. $3.00. tum to domestic markets or to trade Macroeconomic Implica-
among themselves In order to sell tions of Factor Substitutiontheir manufactured goods. Arguesthat trade with the developing coun- In Industrial Procesestries actually benefits the developed Howard Packcountries, that rates of Industrial World Bank Staff Working Paper
protctio shold b lowred,and Mo. 3 77. March 1980. uii + 60 pages(including bibliography).Stock No. WP-0377. $3.00.
Made In Jamalca: The Mining Industry and Volume 1: The Planning ofThe Development of the the Developing Countries Industrlial Inesiment Ph-Manufacturing Sector Rex Bosson and grams: A MethodologyMahmood All Ayub Bension Varon David A. Kendrick andThis book, the flrst detailed study of An overview of the world's nonfuel Ardy J. StoutesdiJkJamaica's manufacturing sector, pro- mining industry, Its structure and The analytical approach with specialvides a comprehensive assessmeni: operation, and the major factors emphasis on the complications arls-of the important characteristics of bearing on them. Ing from economies of scale; a
rltsthe develndopments o stheusct oreI Oxford University h'ess, 1977; 2nd helpful Introduction to linear andrelates the develpritingm1978t.o04pages(inclding mixed-integer programming, facilitat-
during the past two decades, prnting, 1978. 304 pages (Including Ig understanding of subsequentdescribes the extent of protection 12 appendixes, bibliography, index). volumes In the series.provided to the sector in 1978, and LC 77-2983. ISBN 0-19-920096-3,examines the prospects for growth of $29.50 hardcouer: ISBN 0-19-920099-8, The Johns Hopkins Unluersity Pin s,manufactured exports during the $14.95 paperback. 1979.144 pages (including Index).coming years. Policy recommenda- LC 78-8428. ISBN 0-8018-2139-8,tions are made on the basis of French: L'industrie miniere dans le $18.50 (£9.75) hardcouer- ISBNthis analysis. tiers monde. Economica, 1978. 0-8018-2152-5, $12.00 (£4.50)
The Johns Hopkins University Press, ISBN 2- 7178-0030-1, 49 francs. paperback.1981. 144 pages. Spanish: La industria minera y los French: La programmation des
LC 80-27765. ISBN 0-8018-2568-7, paises en desarrollo. Editorial Tecnos, investissements industriels: methode et$6.50 (£4.25) paperback. 1978. etude de cas. Economica, 1981. (Com-
ISBN 84-309-0779-3, 640 pesetas. bines translation of this book with
Managerial Structures andl that of the case study of the fertilizergractices In Manufacturingi Industry in Volume 2, below.)
Enterprises: A Yugoslav NEW ISBN 2-71 78-0328-9, 65 francs.
Case Study Occupational StructuresVoue:TePln ng fMartin Schrenk of Industries Volume 2: The Plann ofExplores the managerial procedures Manuel Zymelman Invetsment trogray s n thand practices that have evolved in FertUizer IndustyYugoslavia's manufacturing industries Eighty-four tables profile the occupa- Armeane M. Choksi,under the Yugoslav system of "self- tional compositlon of industries In Alexander Meeraus, andmanagement socialism," discusses each of twenty-six countries. Datathe inferences that can be drawn show the structure of employment by Ardy J. StoutjesdUkfrom these observations regarding sectors and industries for each coun- Discusses the main products andeconomic efficiency, and concludes try; cross-classify 120 occupations processes of relevance to fertilizerwith some observations on the with fifty-eight Industries; and provide production and a systematic descrip-strengths and weaknesses of this information about productivity (value tion of the planning problems thatparticular pluralistic system. added per person engaged), energy need to be addressed during the
consumption per person engaged, project identification phase.World Bank Staff Working Paper No. and employment.ThJosHpknUivriyPes455. May 1981. iu + 100 pages The Johns Hopkins Untuersity Press,(including 4 appendixes). 1980; second printing, 1982. 211 pages. 1980. 320 pages.Stock No. WP-0455. $5.00. ISBN 0-8213-0126-8. $20.00. LC 78-8436. ISBN 0-8018-2138-X,
$25.00 (£13.75) hardcover; ISBN
Manufacture of Heavy The Planning of Investment 0-8018-p153-3, $15.00 (f6.25)Electrical Equipment In ProgramsDeveloping Countries Alexander Meeraus andAyhan Qilingiroglu Ardy J. StoutjesdUlk editors Policies for IndustrialAnalyzes growth and competitive- Series comprising two volumes that Progress In Developingness, comparing prices and costs describe a systematic approach to Countrieswith those in the international Investment planning, relying pri- John Cody, Helen Hughes,market. marily on mathematical program- and David Wall, editors
ming techniques. Includes both4,The Johns Hopkins University Press, general methodologica. lumes and tAnt lysnl c ithe prinipal policy Issues1969. 235 pages (including studies dealing with spmlc that Influence the course and pace of2 annexes). industrial subsectors. Industrialization In the developing
countries.- The text organized alongLC 76-89962. ISBN 0-8018-1097-3, lines of governmental administrative$5.50. (43.25) paperback. responsibility for various industrial
Spanlsh: Fabricaci6n de equipo policies, Includes chapters on trade,electrico pesado en los pafses en finance, labor-technology relations,
desarrolloa fdltorial Ten m, 1971. taxation, licensing--and other directdesarrollo. Teros, 1971.330 pesetas.
production controls, public W Transition toward Moreenterprises, Infrastructure and loca- Rapid and Labor-Intensivetion industry-agricultur linkage. Suma Industry In Deelop- nuk1sti Developmentband the Interrational environment. Ing Countries: Some Issues The Case of the PhilippinesOxford Unlversity Press, 1980:2nd Dennis Anderson Barend A. de Vriesprinting, 1982. 325 pages (includingbibningraphy, Index). The role of small Industries In the World Bank Staff Working Paper 1o.
development process ias been the 424. October 1980. 32 pages (lnclud-LC 79-24786. ISBI 0-19-520176-0, subject of a large number of studies Ing references, 12 tables).$24.95 hardcover; ISBN 0-19-520177-9, over the past thirty years. This paper$9.95 paperback. examines changes In the size struc- Stock 1O. WP-0424. $3.00.
ture of industry, by region. Itdiscusses entrepreneurship and
MISW argues that, while small and large Why the Emperors Newflnms alike are highly responsive to Clothes Are riot Made in
Pollution Control in the growth of markets, the Colombia: A Case Study inentrepreneurial response Is neither as Latin American and East
Sao Paulo, Brazil: Costs, full nor as efficient as Is desirable Asian ManufacturedBenefits, and Effects on and It analyzes small Industry pro-Industrial Location grams and their relaton to EDdportsVinod Thomas development policy. David MorawetzDiscusses the nature of the Industrial World Bank Staff Working Paper nO. rocuses on the exports of a particu-air polludon problem In Sao Paulo, 518. 1982. 77 pages (includiniclar comaodity (dothing) from a par-summarizes possible policy actons to references). (Colombia) In an attempt to under-combat the problem, and presents a ISBN 0-8213-0006-7. $3.00. stand why Latn America has been socostibenefit framework to analyze much less successful at exportingpollution-control policies, manufactured goods to date thanWorld Bank Staff Working Paper No. Small-Scale Enterprises in East Asia. It Is the flrst study to go501. Nouember 1981.127 pages (Includ- Korea and Taiwan Into great detail In examining theIng annex, references). Sam P. S. Ho price. and especially the nonpricecdeterminants of export success.Stock 1o. WP-0501. $5.00. World Bank Staff Working Paper nO. Oxford Unineity Press, 198U.208
384. April 1980. ui + 151 pages OI nurit rs,18.0.. t D~~~ages (including appendixes,
The Process of Industrial (Including 4 appendixes). ebi lography). .e sDevelopment and Stock No. WP-0384. $5.00. LC 81-9547. ISBN 0-19-520283-X,Alternative Development $22.00 (14.50) hardcouer.Strategies State ManufacturingBela Balassa Enterprise in a Mied MW KlWorld Bank Staff Working Paper No. Economy: The Turkish Case Trasacton Costs ofCredit to the438. October 1980. 42 pages Berthl WaIstedt Smal-Scale Sector in the rbfillppinw.(including appendix). Traces the historic roots of etatism" Katrlne Anderson Salto andStock No. WP-0438. $3.00. and reviews the performance of six Delano P Villanueva
major state Industries In Turkey. World Bank Reprint Series: Nfumber 226.Reprinted from Economic Development and
Small Enterprises and The Johns Hopkins University Press, Cultural Change, vol. 29. no. 3 (April 198):631-40.Development Policy in the 1980. 354 pages (Including appen- Stock No. RP-0226. 1ee of charge.Philippines: A Case Study dixes, Index).Dennis Anderson and LC 78-21398. ISBN 0-8018-2226-2,
drila Khambata $30.00 (017.50) hardcover;ISBIY 0 -8018-2227-0, $13.50 (i7.00)
Presents an expost evaluation of the paperback.Small and Medium Industries Pro-gram Introduced In the Philippines In1974, and reassesses the assump-tions behind the programs. One of aseries of case studies and surveysbeing financed by the World Bank'sResearch Committee.
World Bank Staff Working Paper 11o.468. July 1981. 239 pages (includingbibliography, annex).Stock 11o. WP-0468. $10.00.
WORLD BANK PUBLICATIONSORDER FORM
SEND TO:WORLD BANK PUBUCAllONS WORLD BANK PUBLICATIONSP.Q BOX 37525 or 66, AVENUE D'IENAWASHINGTON, D.C. 20013 75116 PARIS, FRANCEU.S.A.
Name:
Address:
Stock or ISBN # Author, Title Qty. Price Total
Sub-Total Cost:Postage & handling fee for more than two free items ($1.00 each):
Total copies: Air mail surcharge ($2.00 each):TOTAL PAYMENT ENCLOSED:
Make checks payable: WORLD BIANK PUBLICATIONSPrepayment on orders from Individuals Is requested. Purchase ordwer are accepted from booksellers, library suppliers, libraries, and Institutions.All prIces Include cost of postage by the least expensive means. The prices and publication dates quoted in this Catalog are subject to changewithout notice.
No refunds will be given for Items thast cannot be filled. Credit will be applied towards future orders.No more than two free publicatons will be provided witou charge. Requests for additonal copies will be filled at a charge of US $1.00 per
copy to cover handling and postage costs.Airmnall delivery will require a prepayment of US $2.00 per copy.Mall-order payment to the WVorld Bank need not be In U.S. dollars, but the amount remitted must be at the rate of exchange on the day the
order is placed. The WVorld Bank will also accept Unescocoupons.

I


I
I

I
II
The World Bank
Headquarters European Office Tokyo Office U1818 H Street, N.W. 66, avenue d'lena Kokusai BuildingWashington, D.C 20433, U.S.A 75116 Paris, France 1-1 Marunouchi 3-chomeTelephone: (202) 477-1234 Telephone: (1) 723-54.21 Chiyoda-ku, Tokyo 100, JapanTelex: WUI 64145 WORLDBANK Telex: 842-620628 Telephone: (03) 214-5001
RCA 248423 WORLDBK Telex: 781-26838Cable Address: INTBAFRAD
WASHINGTONDC
ISSN 0253-21 15/ISBN 0-8t3-0258-2