Sort yourselves into groups of five. Review Nickerson’s Guideposts for Sustainability (above)....
53
ourselves into groups of five. Nickerson’s Guideposts for Sustainability (above). about all aspects of transportation by private auto on Nickerson’s sustainability criteria, is transpor e automobile sustainable ? Why or why not? Provide specific examples!! Sustainability and Transportation
-
Upload
jacob-campbell -
Category
Documents
-
view
229 -
download
2
Transcript of Sort yourselves into groups of five. Review Nickerson’s Guideposts for Sustainability (above)....

• Sort yourselves into groups of five.• Review Nickerson’s Guideposts for Sustainability (above).• Think about all aspects of transportation by private automobile.• Based on Nickerson’s sustainability criteria, is transportation by
private automobile sustainable? Why or why not? Provide specific examples!!
Sustainability and Transportation

Brock University - TREN 3P18
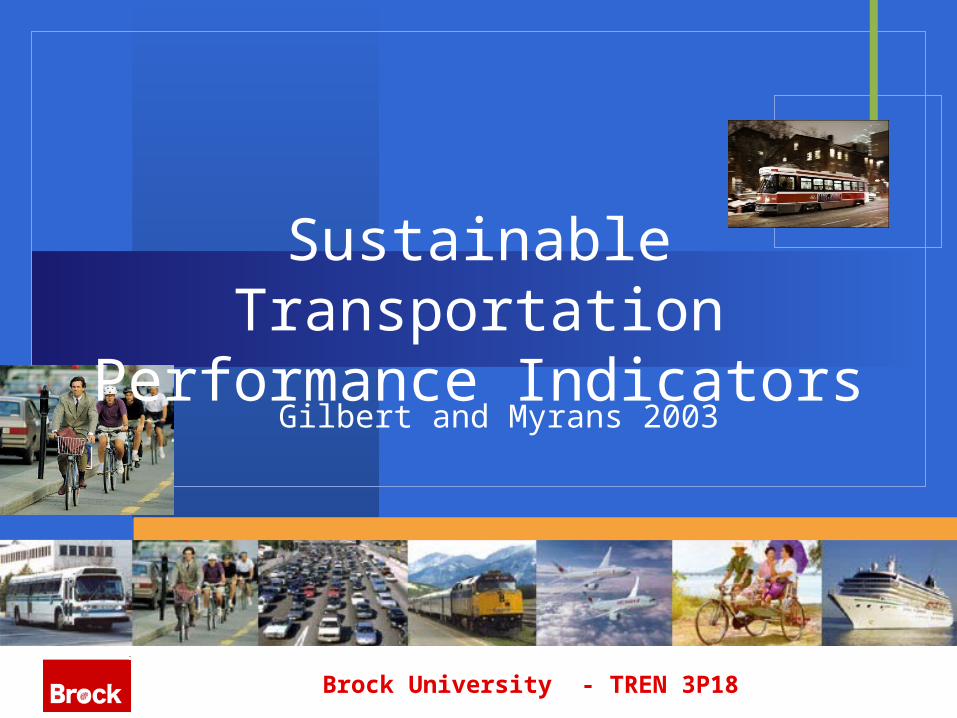
Sustainable Transportation Performance Indicators

What is Sustainable Transportation?
Literature definitions somewhat imprecise Definition reviewed in 2005:
Centre for Sustainable Transportation. 2005. Defining sustainable transportation. Prepared by Al Cormier and Richard Gilbert for Transport Canada (doc. No. T8013-4-0203). March 31, 2005 – 22 pp. Available online at http://cst.uwinnipeg.ca/completed.html#dst

What is Sustainable Transportation?
SeeGilbert and Myrans, 2003: Sustainable Transportation Performance Indicators
Environment
Economy Equity
Environment
Economy Equity
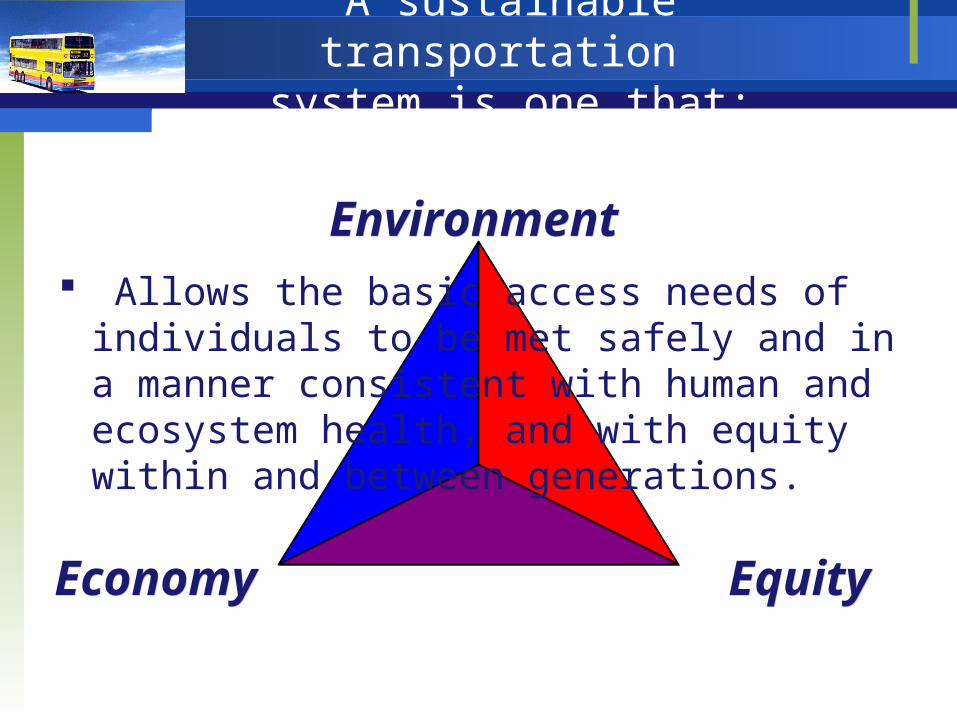
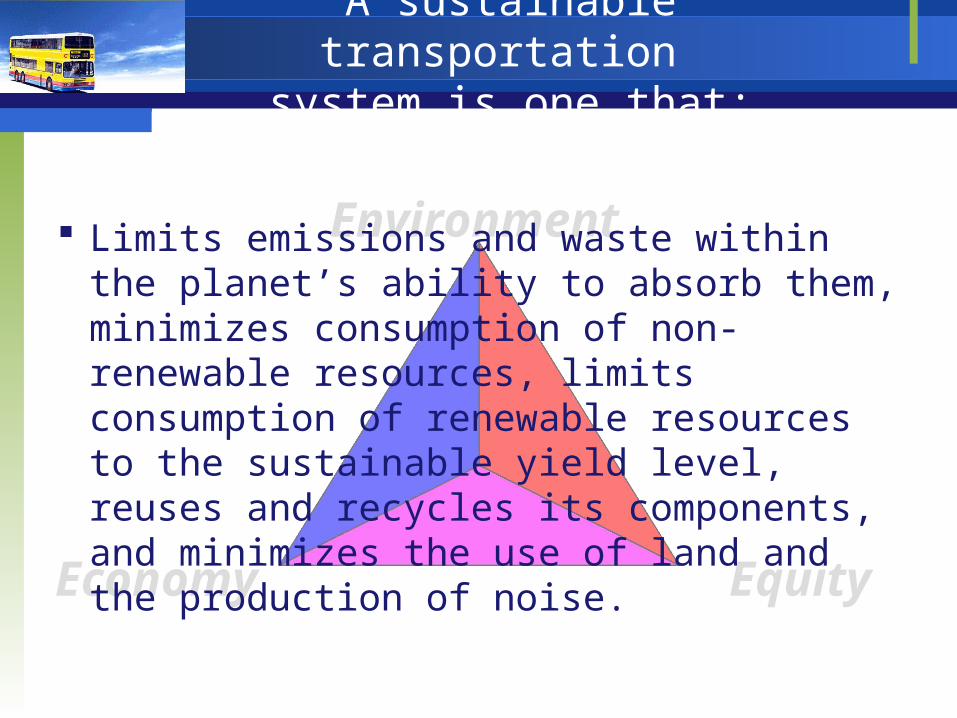
A sustainable transportation system is one that:
Allows the basic access needs of individuals to be met safely and in a manner consistent with human and ecosystem health, and with equity within and between generations.
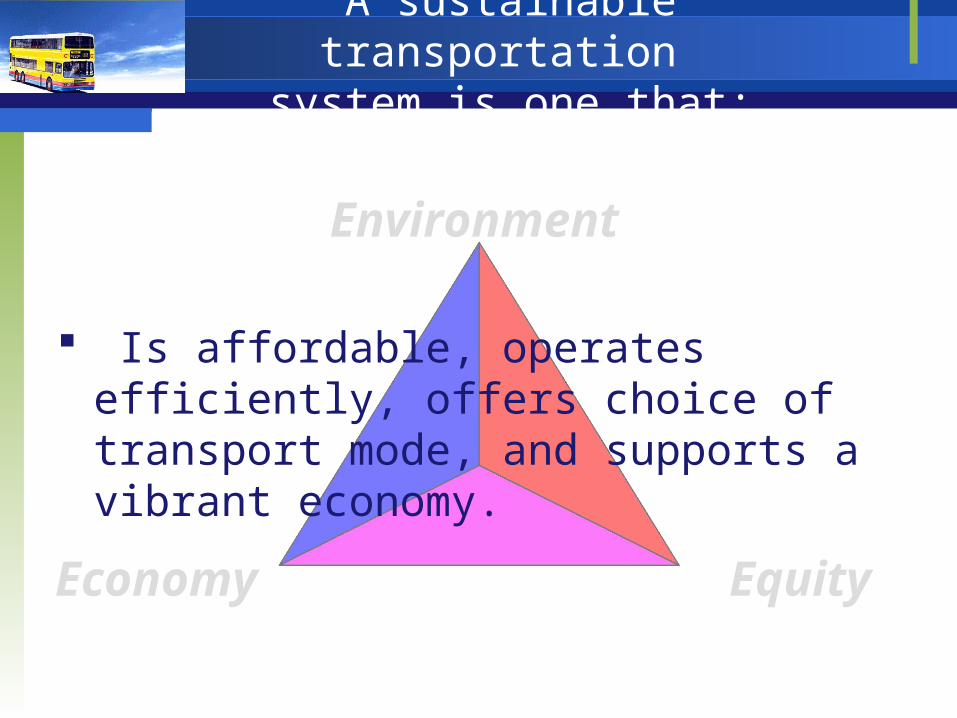
A sustainable transportation system is one that:
Environment
Economy Equity
Is affordable, operates efficiently, offers choice of transport mode, and supports a vibrant economy.
A sustainable transportation system is one that:
Environment
Economy Equity
Limits emissions and waste within the planet’s ability to absorb them, minimizes consumption of non-renewable resources, limits consumption of renewable resources to the sustainable yield level, reuses and recycles its components, and minimizes the use of land and the production of noise.

Brock University - TREN 3P18
Indicators
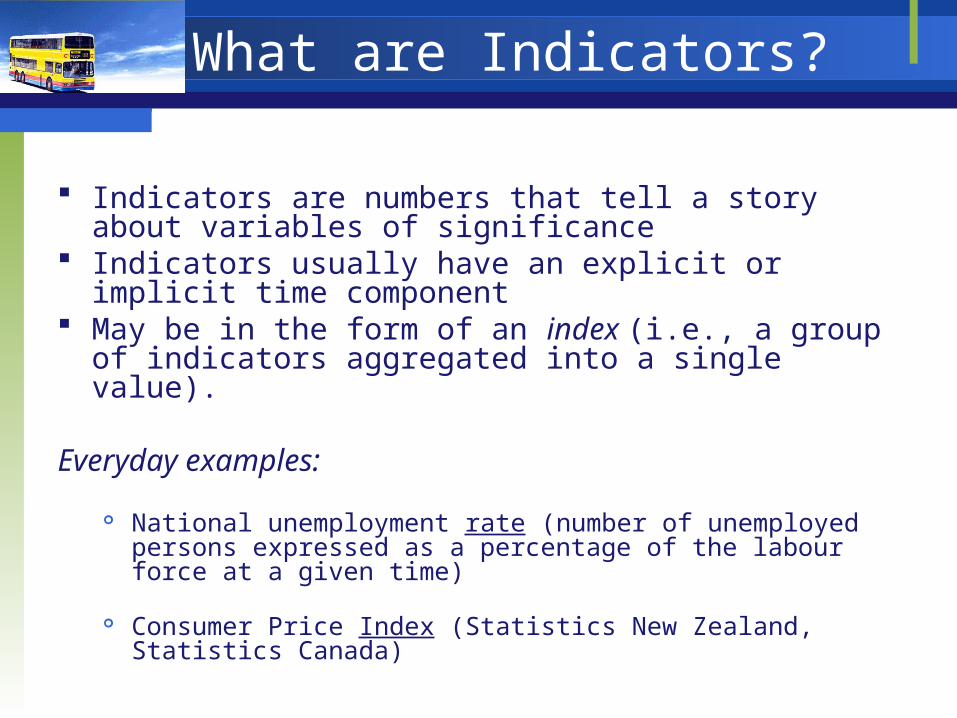
What are Indicators?
Indicators are numbers that tell a story about variables of
significance Indicators usually have an explicit or implicit time
component May be in the form of an index (i.e., a group of indicators
aggregated into a single value).
Everyday examples:
National unemployment rate (number of unemployed persons expressed as a percentage of the labour force at a given time)
Consumer Price Index (Statistics New Zealand, Statistics Canada)
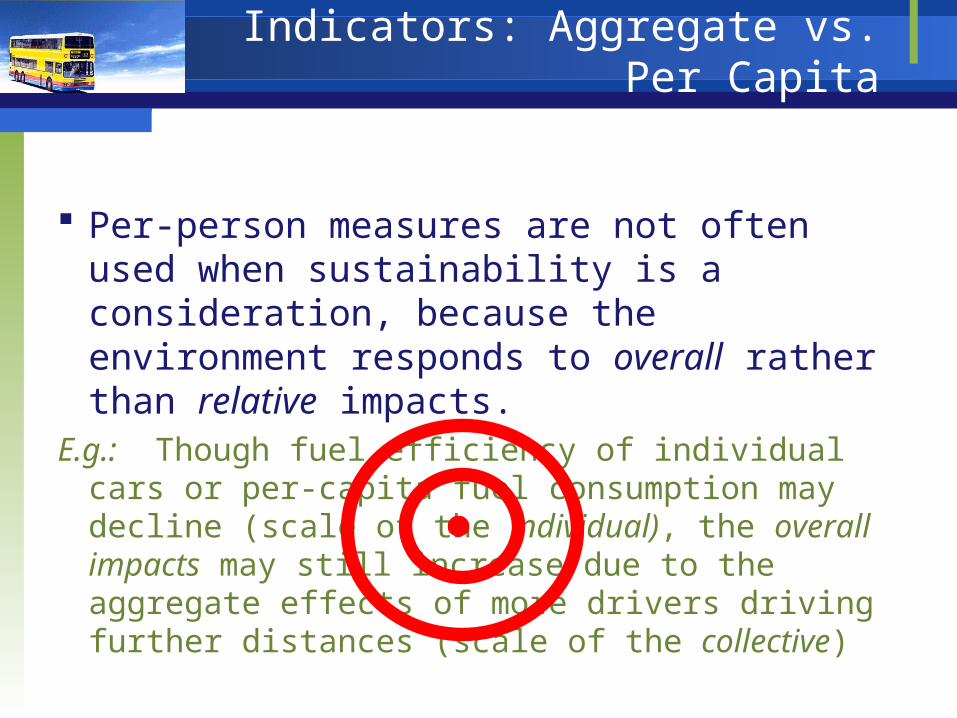
Per-person measures are not often used
when sustainability is a consideration, because the environment responds to overall rather than relative impacts.
E.g.: Though fuel efficiency of individual cars or per-capita fuel consumption may decline (scale of the individual), the overall impacts may still increase due to the aggregate effects of more drivers driving further distances (scale of the collective)
Indicators: Aggregate vs. Per Capita

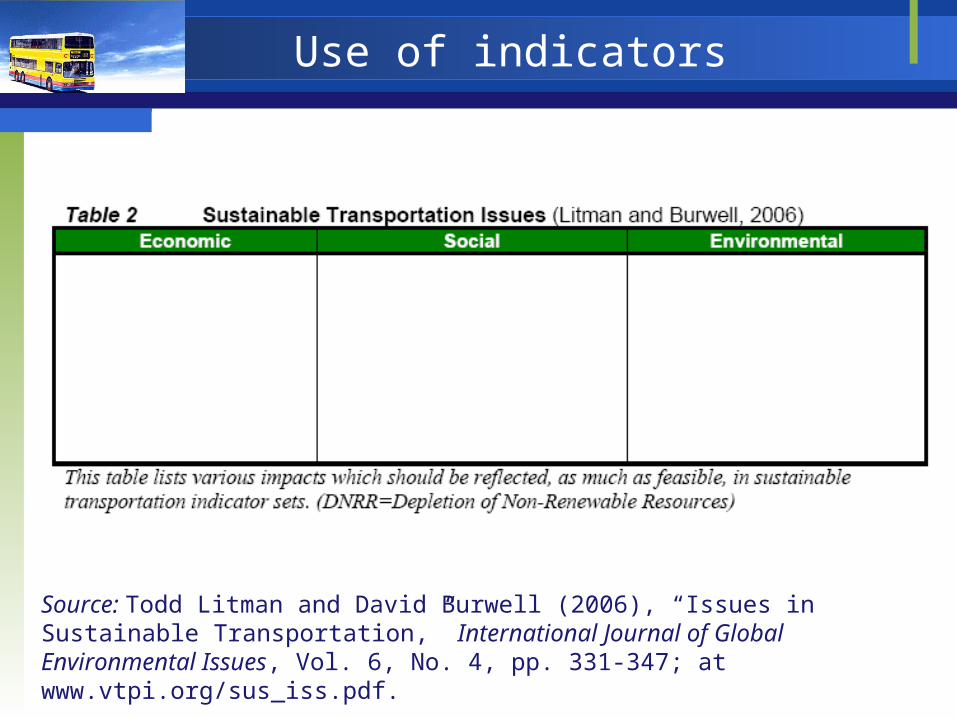
Use of indicators
Source: Litman, Todd. 2009. Sustainable Transportation Indicators.*VMT = Vehicle Miles Traveled
*
Use of indicators
Source: Todd Litman and David Burwell (2006), “Issues in Sustainable Transportation,” International Journal of Global Environmental Issues, Vol. 6, No. 4, pp. 331-347; at www.vtpi.org/sus_iss.pdf.

Towards consistent indicators?
There is no universally accepted definition of sustainability, sustainable development or sustainable transport (Litwin 2009)
There are currently no standardized indicator sets for comprehensive and sustainable transport planning (Litwin 2009)

Towards consistent indicators?
In recent correspondence (14 Jan 2014) , Richard Gilbert stated that no further work had been done on transportation indicators using his approach
Most recent comprehensive attempt is therefore Gilbert and Myrans (2003) -> old data, but still the best overall example!
Brock University - TREN 3P18
Sustainable Transportation Performance Indicators
Gilbert and Myrans 2003

Sustainable Transportation Performance Indicators
1. Energy use for transport
2. Greenhouse gas emissions
3. Other transport emissions
4. Injuries and fatalities
5. Movement of people
6. Movement of freight
7. Travel by cars and planes
8. Personal vehicle movement
9. Urban land use
10.Length of paved roads
11.Household spending
12.Relative transit costs
13.Energy intensity
14.Emissions intensity

What the STPI can be used for
a means of tracking from year to year whether transport in Canada is becoming more sustainable (like the definition), or moving away.
can tell us about the effects of government policies, by looking at how specific STPI change after the policies are implemented.
can help shape new policies, by showing the kinds of change that the policies should produce.
can also guide the private sector, by showing what is needed for sustainability.

1. Energy use for transport
Almost 100% of energy used for transport in Canada is from oil
Energy used for transport in Canada increased by 21.5% between 1990 and 2000, from 1,878 to 2,282 petajoules (1015 j).
2. Greenhouse gas emissions
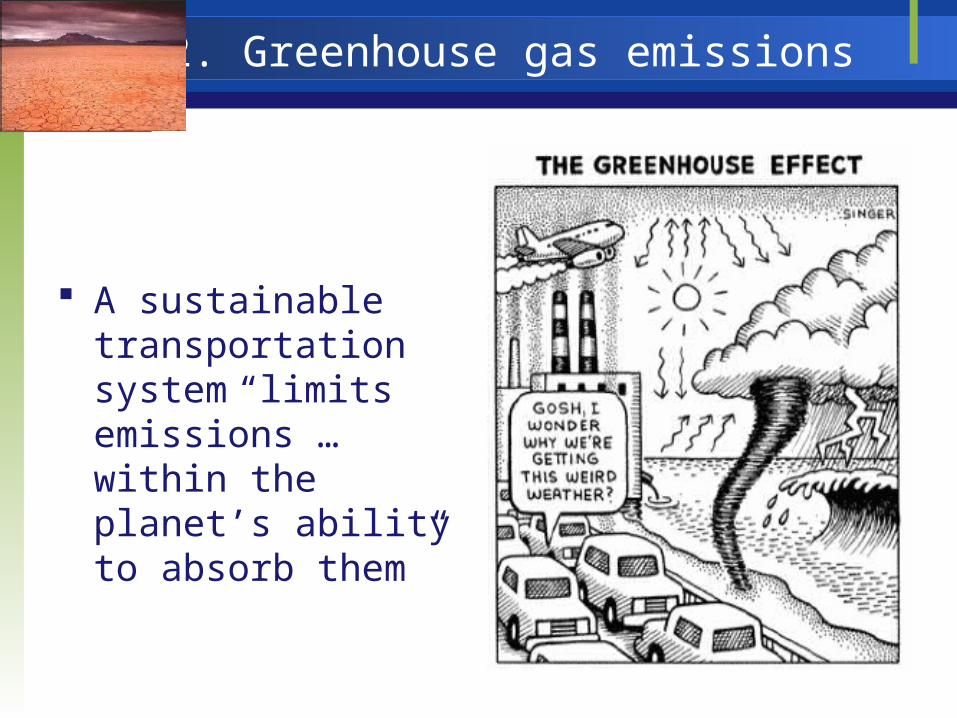
A sustainable transportation system “limits emissions … within the planet’s ability to absorb them”

2. Greenhouse gas emissions
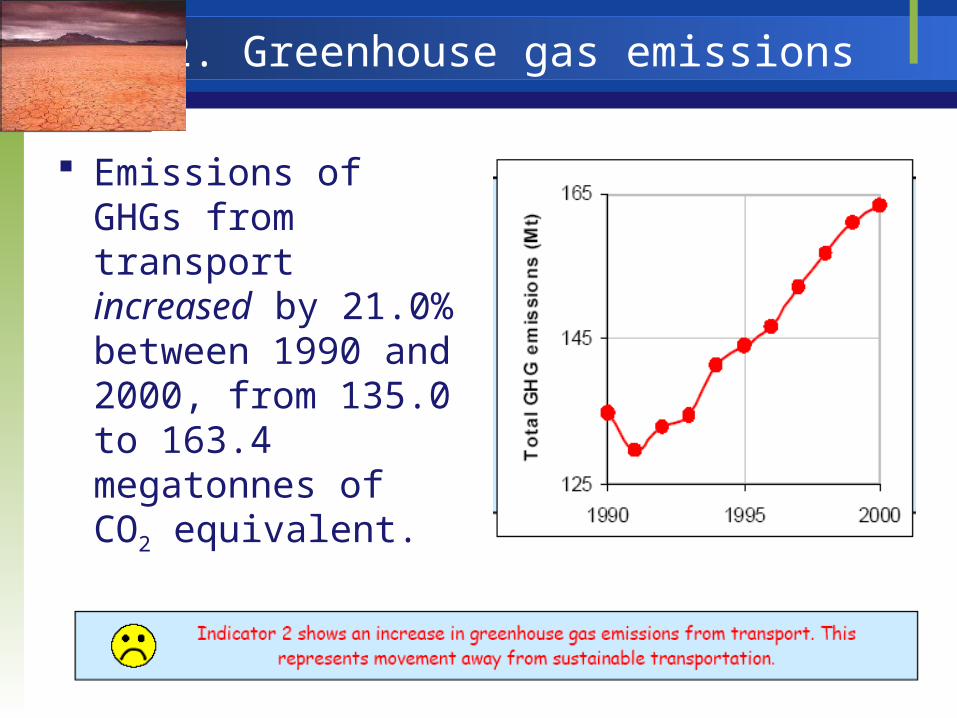
Transport contributes about a third of total GHG emissions directly, and much more if its share of emissions from fuel production is counted.
When these emissions decline, there is progress towards sustainable transportation.
2. Greenhouse gas emissions
Emissions of GHGs from transport increased by 21.0% between 1990 and 2000, from 135.0 to 163.4 megatonnes of CO2 equivalent.

3. Other transport emissions
Index of locally acting emissions from road transport: CO, SO2, NOx, and VOCs
Index fell by 9.1% between 1990 and 2000, due to improvements in vehicle technology
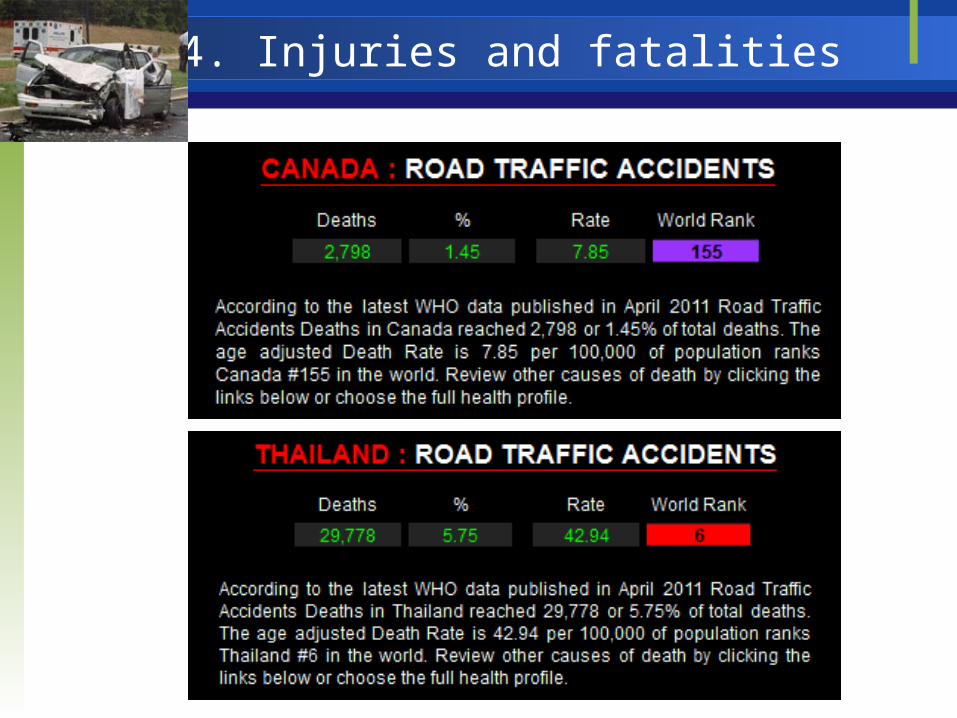
4. Injuries and fatalities
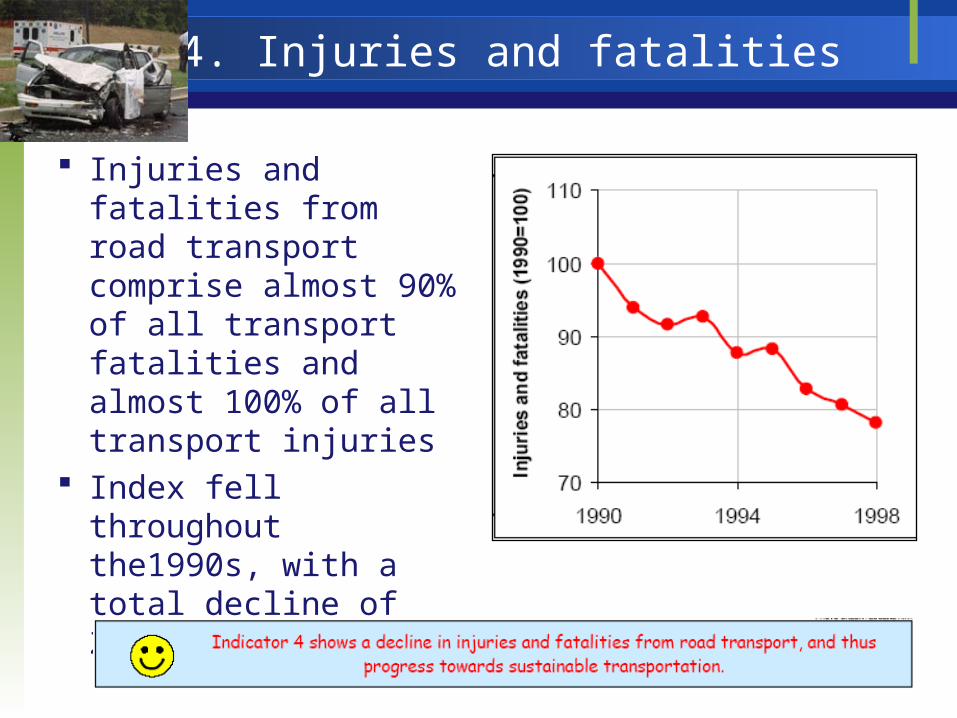
Injuries and fatalities from road transport comprise almost 90% of all transport fatalities and almost 100% of all transport injuries
Index fell throughout the1990s, with a total decline of 21.8%

4. Injuries and fatalities
Injuries and fatalities from road transport comprise almost 90% of all transport fatalities and almost 100% of all transport injuries
Index fell throughout the1990s, with a total decline of 21.8%
Traffic death rate per 100,000 inhabitants
Canada: 6 (2012) USA: 11.6 (2012) Worst in world:
Eritrea (48.4), Dominican Republic (41.7), Libya (40.5), Thailand (38.1)
Best in world:Norway (2.9), Sweden (3), Denmark (3), Palestinian territories (3.2)
4. Injuries and fatalities
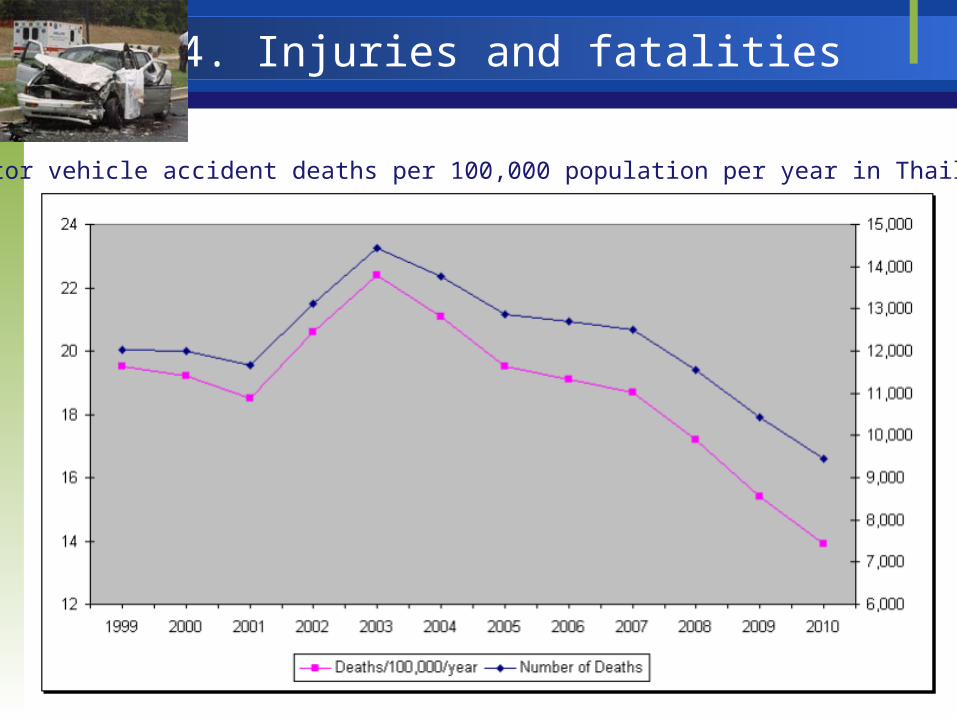
4. Injuries and fatalities
Motor vehicle accident deaths per 100,000 population per year in Thailand

4. Injuries and fatalities
Contributing factors: drunk-driving laws seat-belt laws safety features in vehicles
(e.g., airbags and better brakes)
safety features in highway design (e.g., better alignments and signage)
enforcement of speed limits and safe-driving requirements

5. Movement of people
Modes of travel in Canada (2000):
74.3% - personal vehicle 17.1% - air 3.9% - urban transit 2.7% - school bus 1.8% - inter-city bus 0.3% - inter-city rail

5. Movement of people
Most movement of Canadians is in personal motorized vehicles
As this movement increases, the unsustainable effects of transport tend to increase.
Motorized movement increased 14.7% (1990 – 2000), from 509 to 583 billion person-kilometres.

5. Movement of people
Main contributing factor: 11.2% increase in Canada’s population (1990 – 2000).
Small (3.1%) overall increase in travel per person
Decline noticed in late 1990s

6. Movement of freight
Freight Movement in Canada (2000):
43.9% by rail
28.7% by water
27.4% by road
less than 0.1% by air
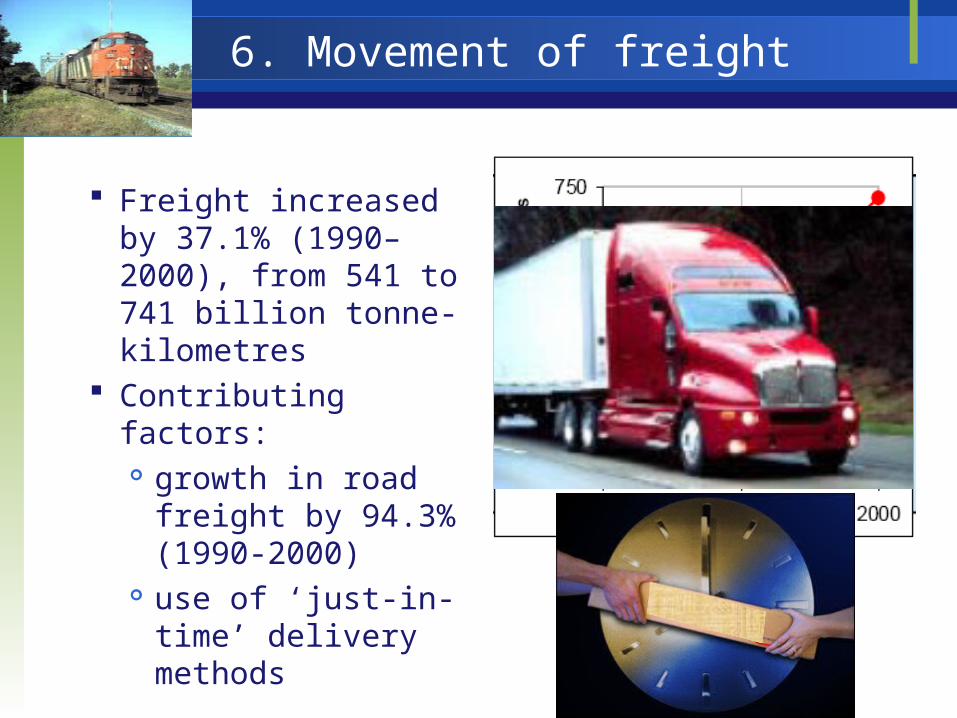
6. Movement of freight
Freight increased by 37.1% (1990–2000), from 541 to 741 billion tonne-kilometres
Contributing factors: growth in road
freight by 94.3% (1990-2000)
use of ‘just-in-time’ delivery methods
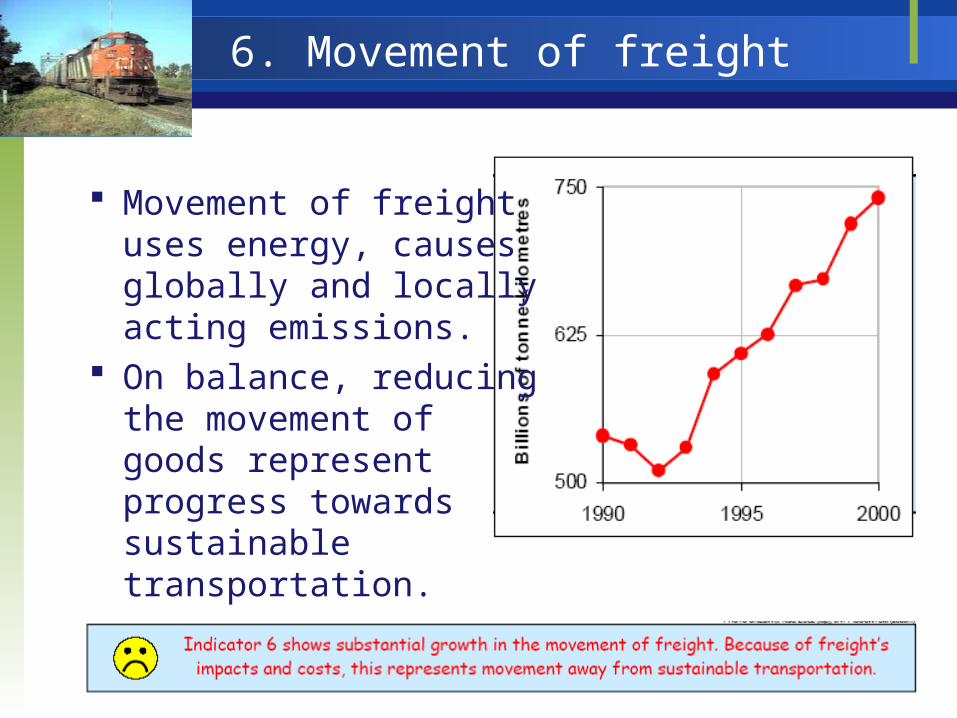
6. Movement of freight
Movement of freight uses energy, causes globally and locally acting emissions.
On balance, reducing the movement of goods represent progress towards sustainable transportation.
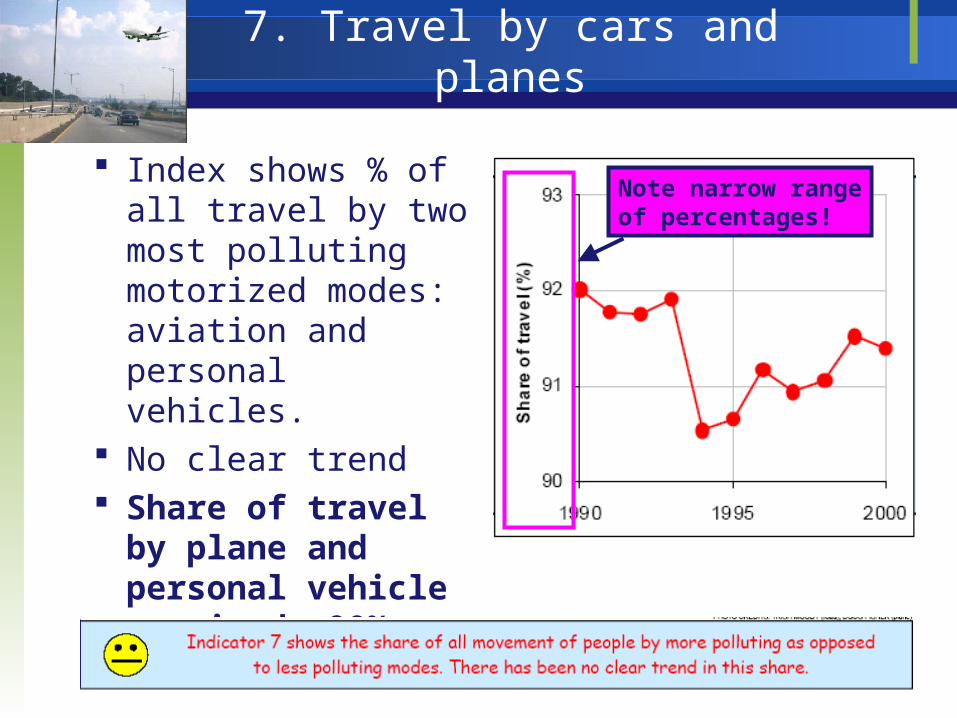
7. Travel by cars and planes
Index shows % of all travel by two most polluting motorized modes: aviation and personal vehicles.
No clear trend Share of travel by
plane and personal vehicle remained >90% every year.
Note narrow rangeof percentages!
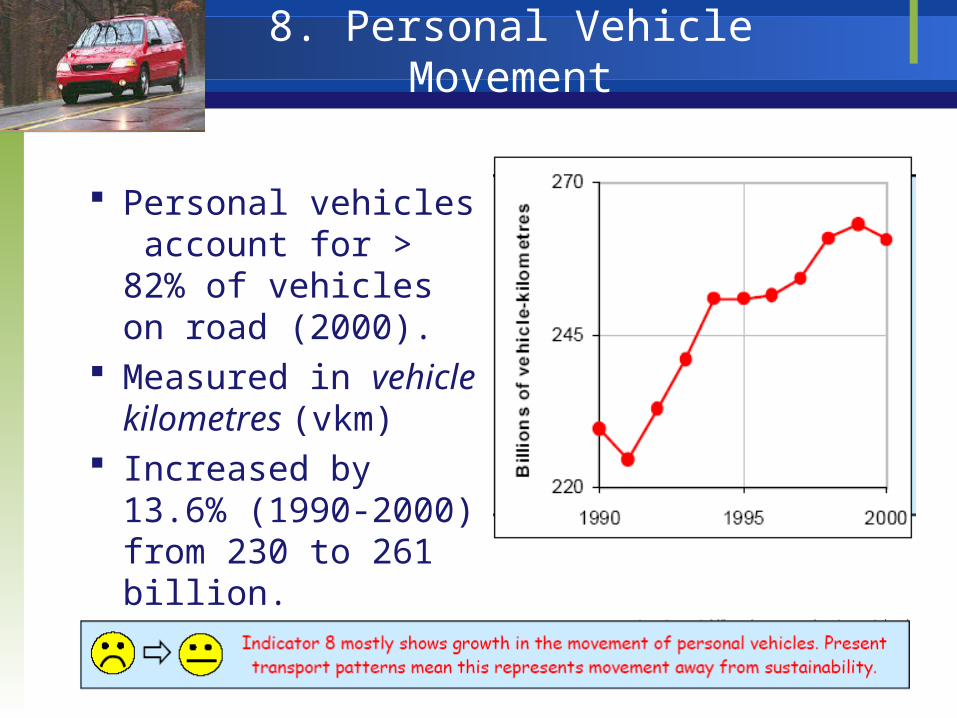
8. Personal Vehicle Movement
Personal vehicles account for > 82% of vehicles on road (2000).
Measured in vehicle kilometres (vkm)
Increased by 13.6% (1990-2000) from 230 to 261 billion.

8. Personal Vehicle Movement
Average occupancy of personal vehicles fell by 4.8%,from 1.74 to 1.66 persons / vehicle.
Each car driven an average of 17,500 km/year in Canada.
Main change in 1990s: growth in SUVs, minivans, and pick-up trucks: increased from 16.8% in 1990 to 28.4% in 2000.
SUVs use about 35% more fuel per km than passenger cars (US CAFE fleet average data, 2005)
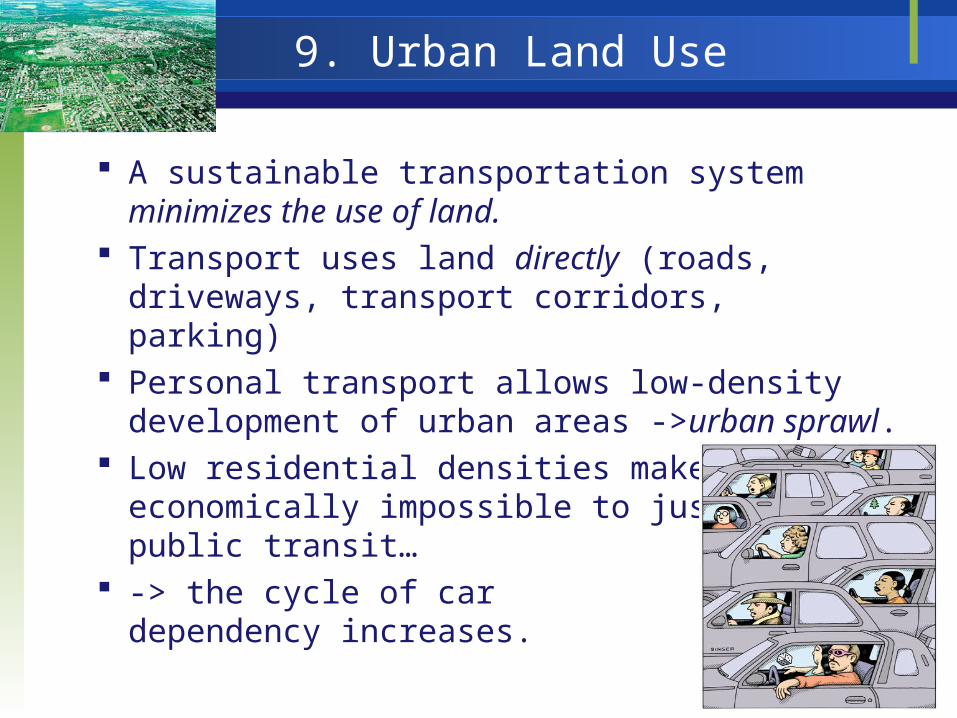
9. Urban Land Use
A sustainable transportation system minimizes the use of land.
Transport uses land directly (roads, driveways, transport corridors, parking)
Personal transport allows low-density development of urban areas ->urban sprawl.
Low residential densities make it economically impossible to justify public transit…
-> the cycle of car dependency increases.

9. Urban Land Use
Developed land per urban resident increased by 28.9%, (1971 -1996), from 971 to 1,251 square metres
Highest rate of growth occurred 1991 - 1996

10. Length of paved roads
Impacts of new roads: direct land use energy consumption
(construction, maintenance, use)
Adding new roads encourages driving, enhances sprawl and car dependency, and results in inefficient use of infrastructure.

10. Length of paved roads
Length of paved roads increased by 23.6% (1985-1995), from 243,800 to 301,300 two-lane-kilometre equivalents.

11.Household transportation spending
The share of after-tax household spending on transport increased from 16.1% to 19.2% (1982 – 2000)
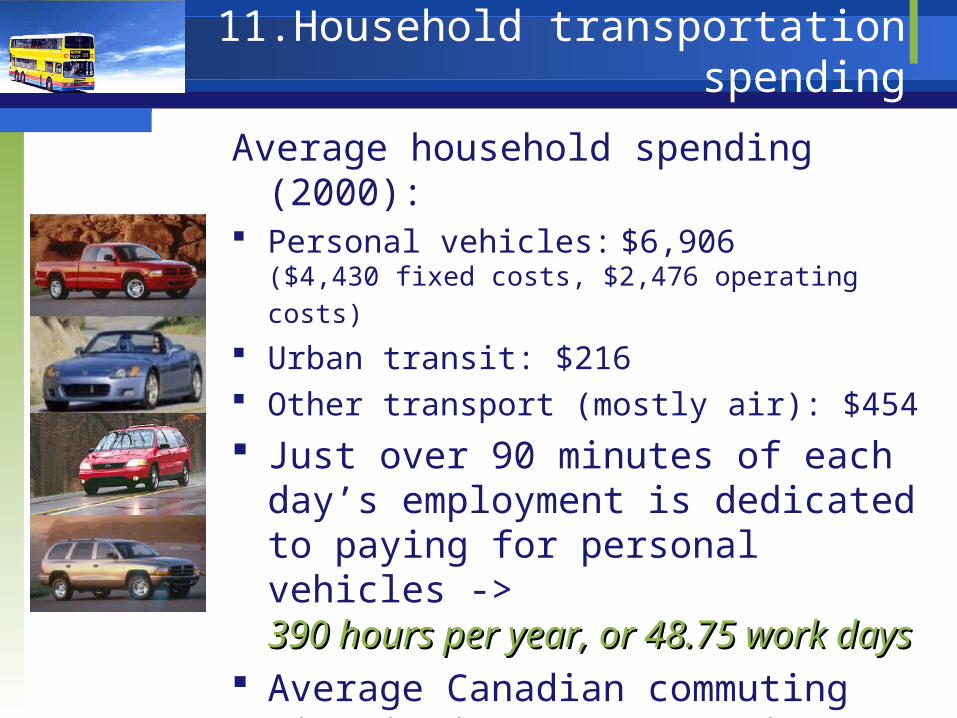
Average household spending (2000): Personal vehicles: $6,906
($4,430 fixed costs, $2,476 operating costs) Urban transit: $216 Other transport (mostly air): $454
Just over 90 minutes of each day’s employment is dedicated to paying for personal vehicles -> 390 hours per year, or 48.75 work days390 hours per year, or 48.75 work days
Average Canadian commuting time is just over 60 minutes per day-> 260 hours per year, or 32.5 work days260 hours per year, or 32.5 work days
11.Household transportation spending
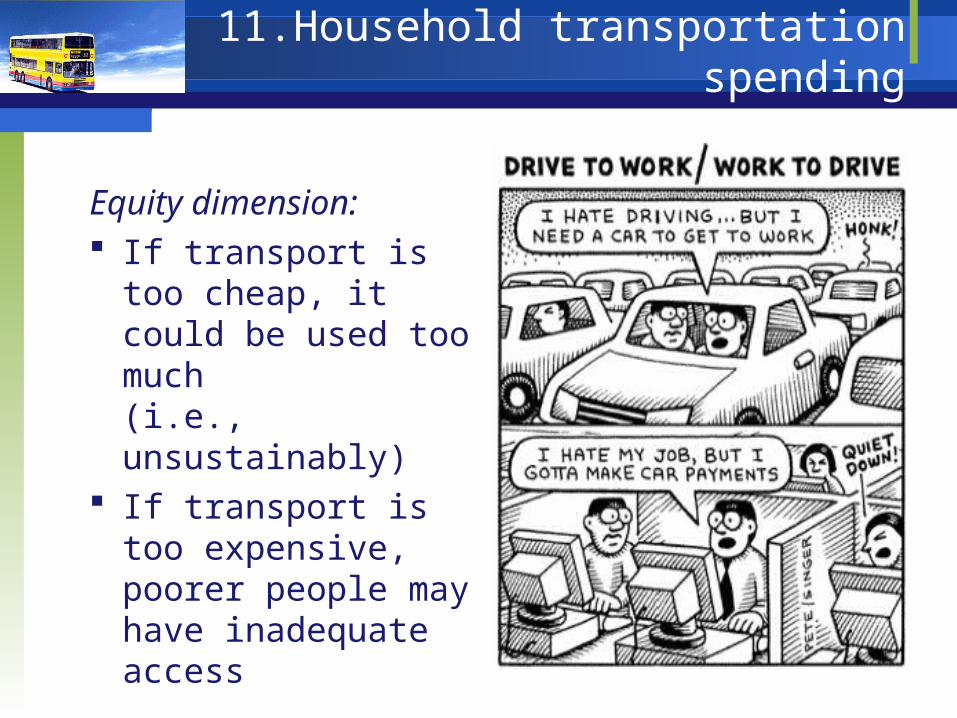
Equity dimension: If transport is too
cheap, it could be used too much (i.e., unsustainably)
If transport is too expensive, poorer people may have inadequate access
11.Household transportation spending
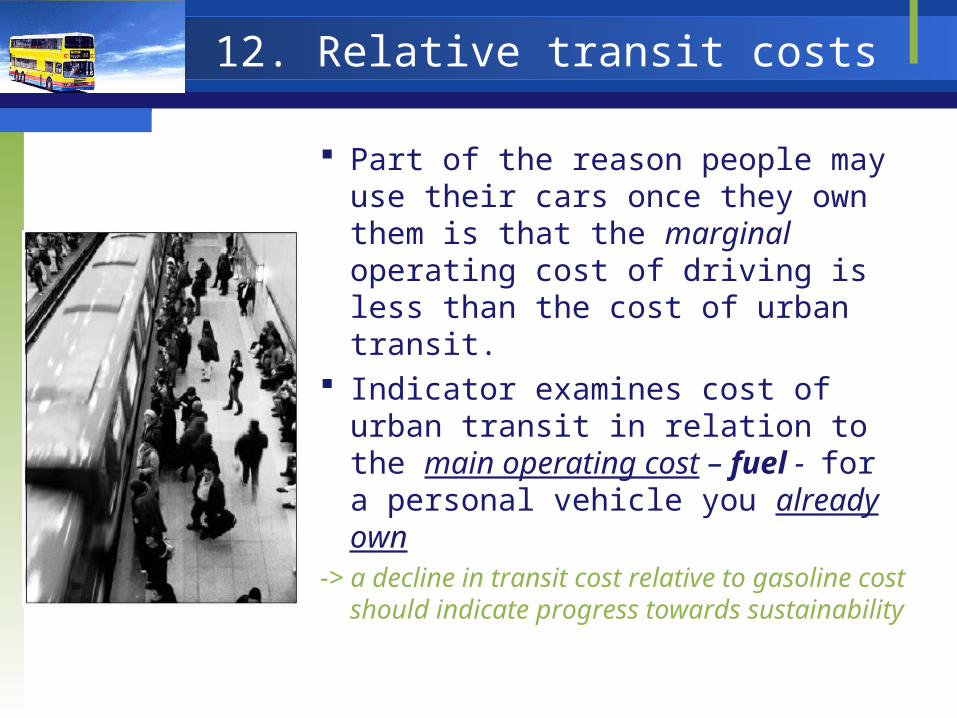
12. Relative transit costs
Part of the reason people may use their cars once they own them is that the marginal operating cost of driving is less than the cost of urban transit.
Indicator examines cost of urban transit in relation to the main operating cost – fuel - for a personal vehicle you already own
-> a decline in transit cost relative to gasoline cost should indicate progress towards sustainability
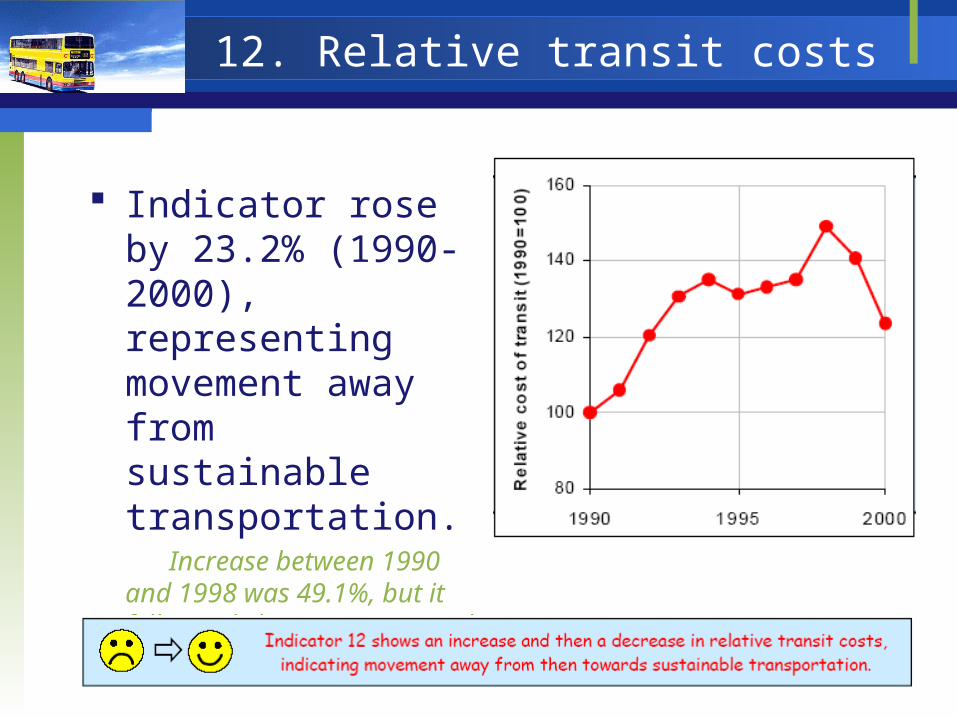
12. Relative transit costs
Indicator rose by 23.2% (1990-2000), representing movement away from sustainable transportation.
Increase between 1990 and 1998 was 49.1%, but it fell steeply between 1998 and 2000.

13. Energy intensity: cars and trucks
Indicator examines the technical performance of road vehicles, specifically energy used per unit of distance covered.
Cars and trucks account for almost 75% of all transport energy use -> basis of this indicator.
Energy intensity varies Energy intensity varies greatly among personal greatly among personal vehicles: 1 l/ 100 km vehicles: 1 l/ 100 km (prototype car in front) (prototype car in front) vs. 11 l/ 100 km (van vs. 11 l/ 100 km (van behind).behind).

13. Energy intensity: cars and trucks
Energy intensity of cars and trucks increased by 6.3% (moved away from sustainability) between 1990 and 1995 (with dip in 1991), then declined to 5.4% above1990 level in 2000.
Main contributing factor was growth of proportion of fuel-hungry sport-utility vehicles (SUVs), minivans, and light trucks.
In the second half of the decade, this factor was offset by reductions in the fuel intensity of other vehicles, notably heavy trucks.

14. Emissions intensity
Indicator is concerned with the technical performance of road vehicles, specifically the amount of locally acting emissions per unit of transport activity.
Lower emissions per unit of transport activity is desirable -> goal of ZEV (zero emissions vehicles)
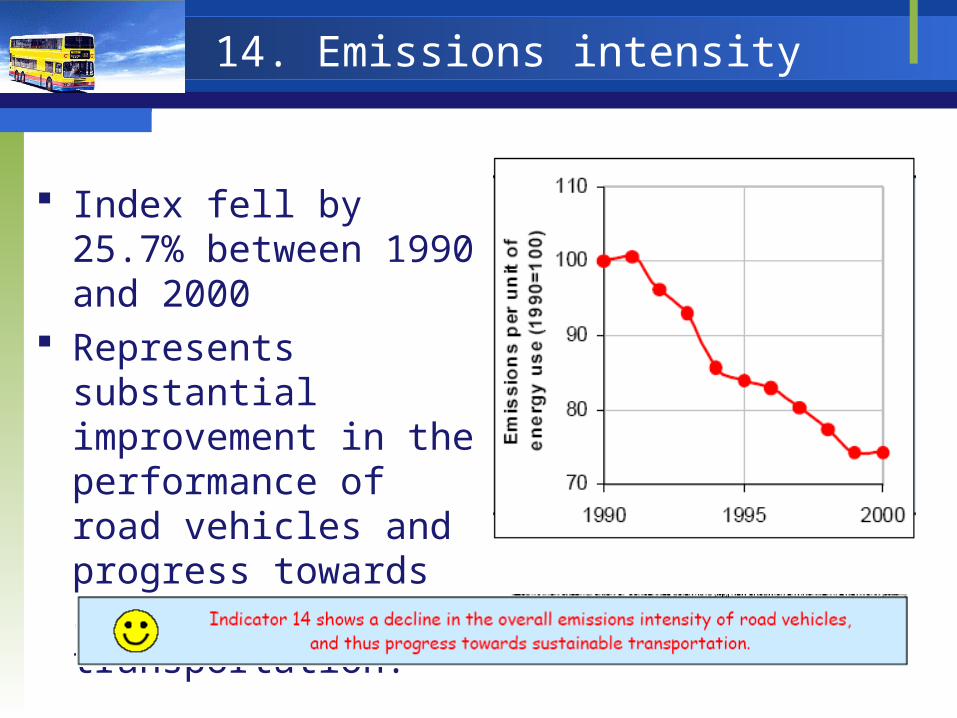
14. Emissions intensity
Index fell by 25.7% between 1990 and 2000
Represents substantial improvement in the performance of road vehicles and progress towards sustainable transportation.

Brock University - TREN 3P18
Conclusions

Sustainable Transportation in Canada: CONCLUSIONS
Indicators 1, 2, 5, 6, 8, 9, 10, 11, and 13 suggests that transportation in Canada has been mostly moving away from sustainability
Trends in a few (5, 8, 13) show improvement

Sustainable Transportation in Canada: CONCLUSIONS
Some indicators (3, 4, 14) show that progress has been made towards sustainable transportation.

Sustainable Transportation in Canada: CONCLUSIONS
Some indicators (3, 4, 14) show that progress has been made towards sustainable transportation.


![[PPT]12 Guideposts of Auditions - Administrationpebblebrookhigh.typepad.com/files/12-guideposts-of... · Web view12 Guideposts of Auditions Michael Shurtleff Side # 1 A: Hey mom.](https://static.fdocuments.us/doc/165x107/5adec9427f8b9a9a768eac1a/ppt12-guideposts-of-auditions-administr-view12-guideposts-of-auditions-michael.jpg)