Some important weather radar correction algorithms and the ... · ERAD 2014 - THE EIGHTH EUROPEAN...
6
ERAD 2014 - THE EIGHTH EUROPEAN CONFERENCE ON RADAR IN METEOROLOGY AND HYDROLOGY Some important weather radar correction algorithms and the development of the new 3D radar composite product at the Hungarian Meteorological Service. Roland Steib 1 , Péter Németh 1 , István Seb ˝ ok 1 , and Csaba Szegedi 1 1 Hungarian Meteorological Service, Kitaibel Pál u. 1, 1024 Budapest, Hungary (Dated: 25 July 2014) Roland Steib 1. Introduction In the last few years important weather radar based developments took place at the Remote Sensing Division of the HMS (Hungarian Meteorological Service). Some of these developments will be presented in this paper. In the first chapter of this paper a short overview of our radar network will be presented. In the last decade the number of RLANs (Radio Local Area Networks) was dynamically increasing all over the world. This fact led to the situation that our C-band radar system was affected more and more by RLAN interferences. Despite the collaboration with the National Media and Infocommunications Authority, it is not possible to detect and remove all interfering devices, especially near big towns. That is why an own correction algorithm was developed, which we call WifiFilter. This algorithm has been in operative use at the HMS since 2008. The essential parts of this filter and our experience of using it in our radar network will be presented in the next chapter. In case of intensive precipitation a well known phenomena is the attenuation of the radar echo. In order to improve the quality of radar reflectivity in such cases a polarimetric based attenuation correction algorithm is just under implementation. Our experiences with this algorithm and some of our preliminary results will be shown in the next chapter. Nowadays most of the radar systems are able to draw individual three dimensional representation of a radar Volume scan. Our goal was to develop a national 3D radar composite product, which can be visualized in our HAWK-3 (Hungarian Advanced WorKstation) system. In the last part of the paper the structure of this product and our possibilities of visualize it within HAWK-3 will be demonstrated. 2. Hungarian radar network At present three radars are operated operational by the HMS. Our fourth radar is just under construction. The locations of the radars can be seen in Figure 1. The modernisation of our old radar network (MRL-5 radars) began in 1999. First the MRL-5 radar in Budapest was replaced with an alternate dual-polarimetric, Doppler radar (DWSR-2500C). This radar had an analog signal processor and it was able to produce only the ZDR (differential reflectivity) dual-polarimetric parameter. After a little break the Napkor radar was also replaced by an EEC (Enterprise Electronics Corporation) radar (DWSR-2501C). The difference from the Budapest radar is, that it has a digital signal processor and beside the ZDR it could produce the Φ DP (differential propagation phase) and the ρ HV (correlation coefficient) dual polarimetric parameters. A year later the Szentgotthárd radar site was closed and a new radar site called Pogányvár, which is identical with the Napkor radar site, was built a few ten kilometers eastward. In 2013 the Budapest radar was upgraded to a SIDPOL (simultaneous dual polarization) radar. It could produce an additional dual-polarimetric parameter called LDR (linear depolarization ratio). In 2014 our radar network was expanded by the Szentes radar site (DWSR-5001C). It is also a SIDPOL radar and it’s signal processor is identical with the upgraded Budapest radar. We can say that we now own a quite homogeneous radar network in Hungary. All our radars are dual-plarimetric, magnetron-based, Doppler C-band radars, which were constructed by EEC. Figure 1: Radar network in Hungary ERAD 2014 Abstract ID 224 1 [email protected]
Transcript of Some important weather radar correction algorithms and the ... · ERAD 2014 - THE EIGHTH EUROPEAN...

ERAD 2014 - THE EIGHTH EUROPEAN CONFERENCE ON RADAR IN METEOROLOGY AND HYDROLOGY
Some important weather radar correction algorithmsand the development of the new 3D radar composite
product at the Hungarian Meteorological Service.Roland Steib1, Péter Németh1, István Sebok1, and Csaba Szegedi1
1Hungarian Meteorological Service, Kitaibel Pál u. 1, 1024 Budapest, Hungary(Dated: 25 July 2014)
Roland Steib
1. Introduction
In the last few years important weather radar based developments took place at the Remote Sensing Division of the HMS(Hungarian Meteorological Service). Some of these developments will be presented in this paper. In the first chapter of thispaper a short overview of our radar network will be presented. In the last decade the number of RLANs (Radio Local AreaNetworks) was dynamically increasing all over the world. This fact led to the situation that our C-band radar system wasaffected more and more by RLAN interferences. Despite the collaboration with the National Media and InfocommunicationsAuthority, it is not possible to detect and remove all interfering devices, especially near big towns. That is why an owncorrection algorithm was developed, which we call WifiFilter. This algorithm has been in operative use at the HMS since 2008.The essential parts of this filter and our experience of using it in our radar network will be presented in the next chapter. In caseof intensive precipitation a well known phenomena is the attenuation of the radar echo. In order to improve the quality of radarreflectivity in such cases a polarimetric based attenuation correction algorithm is just under implementation. Our experienceswith this algorithm and some of our preliminary results will be shown in the next chapter. Nowadays most of the radar systemsare able to draw individual three dimensional representation of a radar Volume scan. Our goal was to develop a national 3Dradar composite product, which can be visualized in our HAWK-3 (Hungarian Advanced WorKstation) system. In the last partof the paper the structure of this product and our possibilities of visualize it within HAWK-3 will be demonstrated.
2. Hungarian radar network
At present three radars are operated operational by the HMS. Our fourth radar is just under construction. The locationsof the radars can be seen in Figure 1. The modernisation of our old radar network (MRL-5 radars) began in 1999. First theMRL-5 radar in Budapest was replaced with an alternate dual-polarimetric, Doppler radar (DWSR-2500C). This radar hadan analog signal processor and it was able to produce only the ZDR (differential reflectivity) dual-polarimetric parameter.After a little break the Napkor radar was also replaced by an EEC (Enterprise Electronics Corporation) radar (DWSR-2501C).The difference from the Budapest radar is, that it has a digital signal processor and beside the ZDR it could produce theΦDP (differential propagation phase) and the ρHV (correlation coefficient) dual polarimetric parameters. A year later theSzentgotthárd radar site was closed and a new radar site called Pogányvár, which is identical with the Napkor radar site, wasbuilt a few ten kilometers eastward. In 2013 the Budapest radar was upgraded to a SIDPOL (simultaneous dual polarization)radar. It could produce an additional dual-polarimetric parameter called LDR (linear depolarization ratio). In 2014 our radarnetwork was expanded by the Szentes radar site (DWSR-5001C). It is also a SIDPOL radar and it’s signal processor is identicalwith the upgraded Budapest radar. We can say that we now own a quite homogeneous radar network in Hungary. All our radarsare dual-plarimetric, magnetron-based, Doppler C-band radars, which were constructed by EEC.
Figure 1: Radar network in Hungary
ERAD 2014 Abstract ID 224 1 [email protected]

ERAD 2014 - THE EIGHTH EUROPEAN CONFERENCE ON RADAR IN METEOROLOGY AND HYDROLOGY
3. The WifiFilter correction algorithm
In the last decade the quality of C-band radars have been affected more and more by RLAN (Radio Local Area Network)devices in many parts of Europe. These devices are mainly operated by internet providers in the same frequency band as C-bandradars. This fact can influence the quality of radar data significantly. When radars are operated near big cities, we will probablyobserve some disturbing interferences especially in the lower elevations of radar products. Although in radar softwares thereare already algorithms to correct unwanted clutters, but they are not good enough to filter out RLAN interferences. That is whyan own correction algorithm was constructed to filter out the unwanted echoes caused by RLANs. An important feature of thisprogram is to remove the real precipitation echoes as less as possible. We call this correction algorithm WifiFilter. Because ourradar software (EDGE) is a modular software, it is possible to write own modules (correction, conversion, etc.), which can beinserted in the radar control software. Parallel with the correction module development in the HMS, a team from the TechnicalUniversity in Budapest also tried to find a technique for eliminating interference caused by RLANs on meteorological radars(Horváth and Varga, 2009).
Our three operative radars are affected by RLANs in different degree. The Budapest radar is affected more than the coun-tryside radars (Napkor, Pogányvár). In Figure 2 two uncorrected CMAX pictures can be seen. This fact made it necessary towrite individual correction modules for each radars. Our contryside radars use the same and a much simple method than theBudapest radar. In our correction algorithms we rely on the special characteristic of RLAN echoes. RLANs can be recognizedfrom the shape of these echoes, because they are usually only a few rays wide. Another important characteristic of RLANsis that some radar parameters (radial velocity, ZDR, etc.) have different behavior in RLAN echoes than in real precipitationechoes.
(a) Budapest (b) Napkor
Figure 2: CMax without correction
Our main correction algorithm is called WifiFilterB. This algorithm relies on the shape of the echoes. It can filter outunwanted interferences, which are only a few rays wide (see Figure 3), while keeping almost every useful informations. Inmost cases this algorithm can filter out RLANs at our countryside radars (see Figure 3b). Unfortunately at our Budapest radarthe number of RLANs is much more and somtimes they are also wider (not only a few rays) and in this case the correctionmodule is not able to filter out all RLAN echoes (see Figure 3a). The use of this module still left some RLAN echoes (forexample in direction 190, 230, 300 degree) in the CMax radar product. At this radar it is not always adequate to use only theWifiFilterB correction module. That is why we developed three additional algorithms, which are called WifiFilterA, WifiFilterRand WifiFilterV, where WifiFilterA and WifiFilterR can only be used together.
The WifiFilterA correction algorithm relies on the shape of the echoes and on some Volume parameters. It can handle asector, where the number of rays is less or equal than 10. If the RLAN is constant in time, it is possible to choose the direction,the width and the maximum elevation of the sector manually, and in this selected sector the reflectivity values along a raywill be removed. The use of the automatic mode of WifiFilterA is much more common, because most of the RLANs are notconstant in time. In the automatic mode the interferences are detected with the help of the radial velocity or the ZDR data.It will be examined if these Volume parameters are below or above a defined threshold value. If it is the case, the signal willbe treated as RLAN and the original reflectivities of a selected sector will be flaged, in order to handle it in latter correctionmodules.
ERAD 2014 Abstract ID 224 2
ERAD 2014 - THE EIGHTH EUROPEAN CONFERENCE ON RADAR IN METEOROLOGY AND HYDROLOGY
(a) Budapest (b) Napkor
Figure 3: CMax with WifiFilterB correction
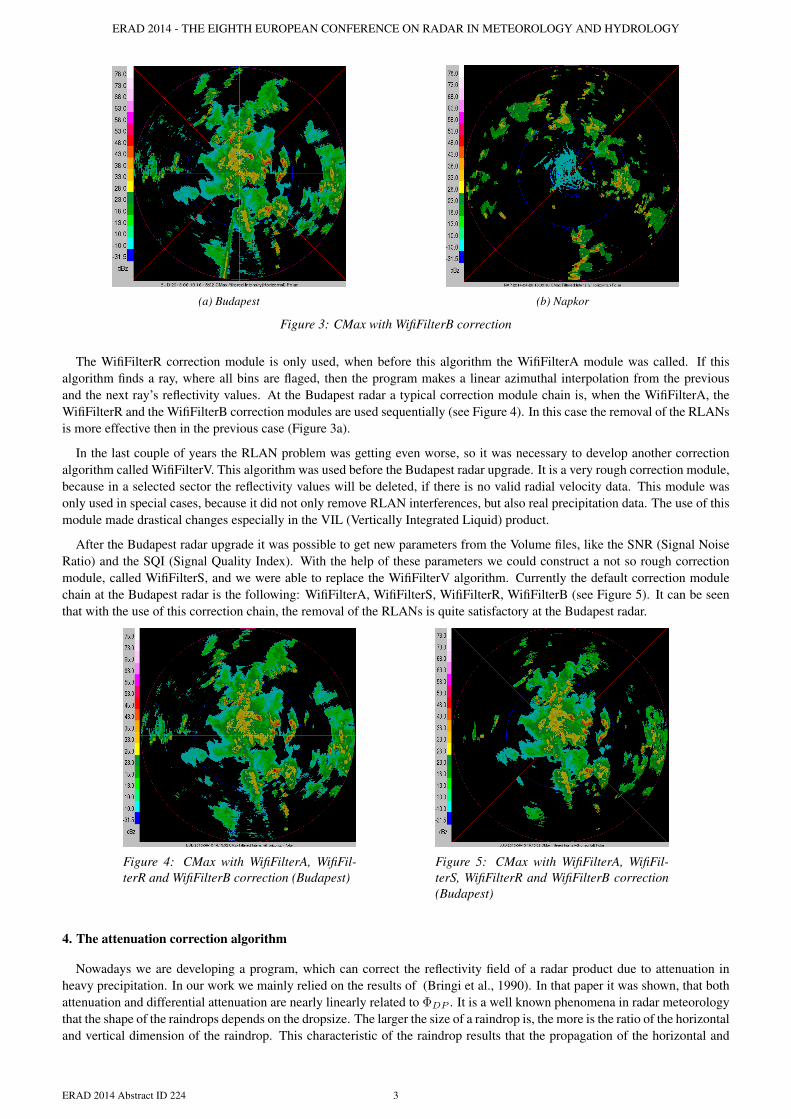
The WifiFilterR correction module is only used, when before this algorithm the WifiFilterA module was called. If thisalgorithm finds a ray, where all bins are flaged, then the program makes a linear azimuthal interpolation from the previousand the next ray’s reflectivity values. At the Budapest radar a typical correction module chain is, when the WifiFilterA, theWifiFilterR and the WifiFilterB correction modules are used sequentially (see Figure 4). In this case the removal of the RLANsis more effective then in the previous case (Figure 3a).
In the last couple of years the RLAN problem was getting even worse, so it was necessary to develop another correctionalgorithm called WifiFilterV. This algorithm was used before the Budapest radar upgrade. It is a very rough correction module,because in a selected sector the reflectivity values will be deleted, if there is no valid radial velocity data. This module wasonly used in special cases, because it did not only remove RLAN interferences, but also real precipitation data. The use of thismodule made drastical changes especially in the VIL (Vertically Integrated Liquid) product.
After the Budapest radar upgrade it was possible to get new parameters from the Volume files, like the SNR (Signal NoiseRatio) and the SQI (Signal Quality Index). With the help of these parameters we could construct a not so rough correctionmodule, called WifiFilterS, and we were able to replace the WifiFilterV algorithm. Currently the default correction modulechain at the Budapest radar is the following: WifiFilterA, WifiFilterS, WifiFilterR, WifiFilterB (see Figure 5). It can be seenthat with the use of this correction chain, the removal of the RLANs is quite satisfactory at the Budapest radar.
Figure 4: CMax with WifiFilterA, WifiFil-terR and WifiFilterB correction (Budapest)
Figure 5: CMax with WifiFilterA, WifiFil-terS, WifiFilterR and WifiFilterB correction(Budapest)
4. The attenuation correction algorithm
Nowadays we are developing a program, which can correct the reflectivity field of a radar product due to attenuation inheavy precipitation. In our work we mainly relied on the results of (Bringi et al., 1990). In that paper it was shown, that bothattenuation and differential attenuation are nearly linearly related to ΦDP . It is a well known phenomena in radar meteorologythat the shape of the raindrops depends on the dropsize. The larger the size of a raindrop is, the more is the ratio of the horizontaland vertical dimension of the raindrop. This characteristic of the raindrop results that the propagation of the horizontal and
ERAD 2014 Abstract ID 224 3

ERAD 2014 - THE EIGHTH EUROPEAN CONFERENCE ON RADAR IN METEOROLOGY AND HYDROLOGY
vertical electromagnetic wave is different. Equation 4.1 shows the calculation of ΦDP , where ΦH(r) is the horizontal andΦV (r) is the vertical propagation phase and r is range from the radar. The nearly linearly relationship between αH (attenuation)and ΦDP is shown in Equation 4.2, where a is a constant with a value of 0.08. The unit of αH is (dBz). If αH is added to Zm
(measured reflectivity) we finally get Z (corrected reflectivity), as it can be seen in equation 4.3.
ΦDP (r) = ΦH(r) − ΦV (r) (4.1)
αH = a ∗ ΦDP , where a = 0.08 (4.2)
Z = Zm + αH (4.3)
In Figure 6 one can see the relationship between the differential propagation phase, the measured and the corrected reflec-tivity. The three values are represented along a specific radar ray. ΦDP is a monotonly increasing function. The value of ΦDP
is increasing when the radar ray is inside the precipitation, otherwise it does not change the value. It is also visible that withincreasing distance from the radar the difference between Zm and Z is also increases.
Figure 6: Measured and corrected reflectivity
An example can be seen in Figure 7. Figure 7a shows the reflectivity without attenuation correction and Figure 7b thereflectivity with the implemented correction algorithm. The biggest differences between the two figures can be seen in areas,which are behind a high reflectivity area, so in this case in the southwest direction to the radar behind a thunderstorm line. Thiscorrection algorithm is already in a semi-operative mode.
(a) No attenuation correction (b) Attenuation correction
Figure 7: Reflectivity
ERAD 2014 Abstract ID 224 4

ERAD 2014 - THE EIGHTH EUROPEAN CONFERENCE ON RADAR IN METEOROLOGY AND HYDROLOGY
5. The 3D composite radar product
Our HAWK-3 visualization system is able to visualisize all meteorological data (numerical model outputs, synop data,satelite data, radar data, etc.), that are in use at HMS. This software can represent three dimensional meteorological fieldsincluding radar data. A 3D composite radar product was constructed with a specific file structure, which can be visualized inHAWK-3. Since 2013 the generation of this 3D product is operational.
The main part of this program is to convert the reflectivity data of the radar Volumes to a 3D grid. This procedure is done intwo steps. First the reflectivity data of a radar Volume is converted to a pseudo-3D grid. The base of this grid is an equidistant(φ, λ) grid with 813 rows and 961 columns with nearly 1 km resolution. This is the yellow colored area in Figure 8. Thevertical resolution of this pseudo-3D grid is defined by radar characteristics (height, elevation angles), which can be seen inFigure 9. The grid points in the pseudo-3D grid are located in the intersections of the lines, which are perpendicular to the baseplain (red line) and of the radar rays (blue lines). The number of vertical gridpoints is equal with the number of the radar’selevation angles. The second step of this procedure is to interpolate the reflectivity values from these gridpoints to the definedCartesian 3D gridpoints (black points), which is visible also in Figure 9. By default the number of the vertical layers in the 3Dgrid is 16 and the resolution is 1 km. This procedure is repeated for every radar in the system. In case of overlapping radars itis possible that in one 3D grid point there are reflectivity data from different radars. The last step of this program is to constructthe composite 3D grid. If there are more reflectivity values in a 3D grid, the maximum of them will be selected.
Figure 8: The base of our 3D grid.
Figure 9: Interpolation from pseudo-3D grid to Cartesian 3D grid.
ERAD 2014 Abstract ID 224 5

ERAD 2014 - THE EIGHTH EUROPEAN CONFERENCE ON RADAR IN METEOROLOGY AND HYDROLOGY
The 3D composite reflectivity values will be stored in a NetCDF (Network Common Data Form) file in order to vizualize iteasily in the HAWK-3 system. The structure of this file is the following:
dimensions:
• maxLonPoints = 961
• maxLatPoints = 813
• maxVerLevels = 16
• gmTimLen = 12
• RadNum = 4
• SiteCodeLen = 3
variables:
• char GMTime(gmTimLen), "GMT (yyyymmddhh)"
• char SiteCode(RadNum, SiteCodeLen), "Three letter site code"
• float La1, "first latitude"
• float Lo1, "first longitude"
• float Dx, "x grid increment"
• float Dy, "y grid increment"
• float VerLevel(maxVerLevels), "Vertical Layer Levels"
• byte refl3D(maxVerLevels, maxLatPoints, maxLonPoints), "3D composite reflectivity"
In Figure 10 the visualization of a 3D composite NetCDF radar file can be seen. The picture in the background is a horizontalcross section from the 3D radar composite file in a height of 5000 m above sealevel. On this layer an arbitrary line can be drawn(black line signed with the letters A and B at the ends). After drawing this line the vertical cross section will be visualizedautomatically, which can be seen in the foreground.
Figure 10: Representation of 3D composite radar data in HAWK-3.
References
V. N. Bringi, V. Chandrasekar, N. Balakrishnan, and D. S. Zrnic, “An examination of propagation effects in rainfall on radarmeasurements at microwave frequencies.” in J. Atmos. Oceanic Technol., 1990, pp. 829–840.
Z. Horváth and D. Varga, “Channel allocation technique for eliminating interference caused by RLANs on meteorologicalradars in 5 GHz band.” March 2009, pp. 24–34. [Online]. Available: http://www.hiradastechnika.hu/data/upload/file/2009/2009_III/HT09_IIIa_5.pdf
ERAD 2014 Abstract ID 224 6