
Geometric Correction of Airborne Radar SAR Image … · Geometric Correction of Airborne Radar SAR...
5
Geometric Correction of Airborne Radar SAR Image on a Digital Terrain Model, and Overlay with Satellite SPOT Data Philippe Durand , Luan Jaupi, Dariush Ghorbanzadeh Abstract —We propose in this paper an original method to correct the geometric distortions of a radar image. The comparison of satellite data, reveals a specific problem. Data can be more or less noisy, but especially the geometry of their acquisition requires corrections for comparaisons between them. In this paper we show how highly deformed radar images can be geometrically corrected and compared to map data coming from digital terrain models and also with data coming from SPOT satellite. Radar images that we use, are from the sensor airborne radar Varan, which is used for data acquisition campaign in the South- East of France. Applications include both structural geology, land cover or study of coastline. We propose a solution to rectify radar image in the geometry of a nu- merical terrain model. The method adopted here, is to produce a synthesis radar image by encoding all flight parameters of aircraft or satellite from a digital terrain model; radar image can then be compared to the synthetic image because points of landmarks can be clearly identified. Finally, we obtain a correspondence between the points of real radar image distorted, and those in the land or map. From this method, it is possible to simulate radar image of aircraft or satellite missions as ERS1 or ERS2 and propose some geomet- rical corrections. However, Satellite images acquired on areas of complex landscapes are of course much more distorted than those acquired from airborne radar. Finally, we can consider other comparisons: we then apply the superposition of radar data and SPOT images of terrains with or without landforms. Index Terms—SAR images, Geometric Corrections, SPOT, Digital Terrain Model. I. Introduction T HE images discussed in this article come from a synthetic aperture radar imaging system: (SAR system). It was used during a mission in the south of France in order to collect data images for geology, geo- morphology and land use. Radar imagery, show artifacts. Firstly, it has a multiplicative noise known as speckle, secondly it is deformed geometrically because of its acquisition. In the first part of this article, we recall these facts. We not seek here the correction of speckle noise, in fact, its removal can cost the loss of precious radiometric informations. We focus on geometric corrections. These corrections will enable us to make comparisons of satel- lites datas and map datas. We give an application on the Philippe Durand, Luan Jaupi, Dariush Ghorbanzadeh are with the Department of Mathematics (modélisation mathématiques et numériques), Conservatoire National des Arts et Métiers, 292 rue Saint martin, 75141 Paris FRANCE e-mail: [email protected], [email protected], [email protected] location of oyster beds invisible on a SPOT image. We give another application in geology: it is the extraction of directs line accidents with mathematical morphology tools. II. Characteristics of airborne radar Varan We give here the main characteristics of radar VARAN which allowed the aquisition image data southeast of France referred to here. This is an X-band radar (3cm). It offers better resolution than L-band radar (25 cm). The slant-range resolution is δ r =3m. This is a theorical resolution. In SAR mode, azimut resolution depend of b , the real antenna length: δ az = b/2, here δ az =3m also. The altitude of flight is 5800 m. At last, there are two kinds of polarization, horizontal and vertical. For example: In the HH configuration we have emission and reception of horizontally polarized wave. For More technical details about this captor you can see [11] III. Nature of the radar imaging, geometric deformations Consider a target with a size at least equal to the resolving power of the sensor. It is further assumed that the wavelength is large compared to the roughness, but less than that of the target. This assumption ensures that the phases of the diffuser elements are independent and uniformly distributed in the interval [0, 2π]. This target can then be analyzed as consisting of several elementary reflectors. The energy reflected from the target is the sum returned by each of the elementary reflectors energy. Ac- cording to the law of large numbers, the resulting energy is a discrete random number. [6].We can then show that the radar signal follows a Rayleigh distribution. F z (r)= r σ 2 exp(- r 2 2σ 2 ) (1) Let’s see what can be said of the deformation of a flat surface. Take four points A,B,C,D (AB = BC = CD) equally spaced in a perpendicular direction to the flight axis of the plane or the satellite .In the radar image, Near the vertical of the plane, the points A ,B ,C ,D satisfies (A B <B C <C D ) . A second type of deformations is caused by montainous landscapes. When the sensor takes pictures near the top of mountains, it may happen that the reflected response from the top of the relief arrives before the response of his foot. We speak of a phenomenon of reveral on the image. Proceedings of the World Congress on Engineering 2014 Vol I, WCE 2014, July 2 - 4, 2014, London, U.K. ISBN: 978-988-19252-7-5 ISSN: 2078-0958 (Print); ISSN: 2078-0966 (Online) WCE 2014
Transcript of Geometric Correction of Airborne Radar SAR Image … · Geometric Correction of Airborne Radar SAR...

Geometric Correction of Airborne Radar SARImage on a Digital Terrain Model, and Overlay
with Satellite SPOT DataPhilippe Durand , Luan Jaupi, Dariush Ghorbanzadeh
Abstract—We propose in this paper an originalmethod to correct the geometric distortions of a radarimage. The comparison of satellite data, reveals aspecific problem. Data can be more or less noisy, butespecially the geometry of their acquisition requirescorrections for comparaisons between them. In thispaper we show how highly deformed radar images canbe geometrically corrected and compared to map datacoming from digital terrain models and also with datacoming from SPOT satellite. Radar images that weuse, are from the sensor airborne radar Varan, whichis used for data acquisition campaign in the South-East of France. Applications include both structuralgeology, land cover or study of coastline. We propose asolution to rectify radar image in the geometry of a nu-merical terrain model. The method adopted here, is toproduce a synthesis radar image by encoding all flightparameters of aircraft or satellite from a digital terrainmodel; radar image can then be compared to thesynthetic image because points of landmarks can beclearly identified. Finally, we obtain a correspondencebetween the points of real radar image distorted, andthose in the land or map. From this method, it ispossible to simulate radar image of aircraft or satellitemissions as ERS1 or ERS2 and propose some geomet-rical corrections. However, Satellite images acquiredon areas of complex landscapes are of course muchmore distorted than those acquired from airborneradar. Finally, we can consider other comparisons: wethen apply the superposition of radar data and SPOTimages of terrains with or without landforms.
Index Terms—SAR images, Geometric Corrections,SPOT, Digital Terrain Model.
I. Introduction
THE images discussed in this article come from asynthetic aperture radar imaging system: (SAR
system). It was used during a mission in the south ofFrance in order to collect data images for geology, geo-morphology and land use. Radar imagery, show artifacts.Firstly, it has a multiplicative noise known as speckle,secondly it is deformed geometrically because of itsacquisition. In the first part of this article, we recall thesefacts. We not seek here the correction of speckle noise, infact, its removal can cost the loss of precious radiometricinformations. We focus on geometric corrections. Thesecorrections will enable us to make comparisons of satel-lites datas and map datas. We give an application on the
Philippe Durand, Luan Jaupi, Dariush Ghorbanzadehare with the Department of Mathematics (modélisationmathématiques et numériques), Conservatoire Nationaldes Arts et Métiers, 292 rue Saint martin, 75141 ParisFRANCE e-mail: [email protected], [email protected],[email protected]
location of oyster beds invisible on a SPOT image. Wegive another application in geology: it is the extractionof directs line accidents with mathematical morphologytools.
II. Characteristics of airborne radar Varan
We give here the main characteristics of radar VARANwhich allowed the aquisition image data southeast ofFrance referred to here. This is an X-band radar (3cm).It offers better resolution than L-band radar (25 cm).The slant-range resolution is δr = 3m. This is a theoricalresolution. In SAR mode, azimut resolution depend ofb , the real antenna length: δaz = b/2, here δaz = 3malso. The altitude of flight is 5800 m. At last, thereare two kinds of polarization, horizontal and vertical.For example: In the HH configuration we have emissionand reception of horizontally polarized wave. For Moretechnical details about this captor you can see [11]
III. Nature of the radar imaging, geometricdeformations
Consider a target with a size at least equal to theresolving power of the sensor. It is further assumed thatthe wavelength is large compared to the roughness, butless than that of the target. This assumption ensures thatthe phases of the diffuser elements are independent anduniformly distributed in the interval [0, 2π]. This targetcan then be analyzed as consisting of several elementaryreflectors. The energy reflected from the target is the sumreturned by each of the elementary reflectors energy. Ac-cording to the law of large numbers, the resulting energyis a discrete random number. [6].We can then show thatthe radar signal follows a Rayleigh distribution.
Fz(r) = r
σ2 exp(−r2
2σ2 ) (1)
Let’s see what can be said of the deformation of a flatsurface. Take four points A,B,C,D (AB = BC = CD)equally spaced in a perpendicular direction to the flightaxis of the plane or the satellite .In the radar image, Nearthe vertical of the plane, the points A′, B′, C ′, D′ satisfies(A′B′ < B′C ′ < C ′D′) . A second type of deformationsis caused by montainous landscapes. When the sensortakes pictures near the top of mountains, it may happenthat the reflected response from the top of the reliefarrives before the response of his foot. We speak of aphenomenon of reveral on the image.
Proceedings of the World Congress on Engineering 2014 Vol I, WCE 2014, July 2 - 4, 2014, London, U.K.
ISBN: 978-988-19252-7-5 ISSN: 2078-0958 (Print); ISSN: 2078-0966 (Online)
WCE 2014

IV. Creating a synthetic image in thegeometry of the flight of the aircraft or
satellite.We propose to correct the radar image (Figure 4) on
the geometry of a digital terrain model: mnt (Figure 1).
A. Pretreatment of the digital terrain model (mnt)To create a synthetic image having the same geometry
as the actual scene, it must first rotate the mnt so thatscanning lines of the plane corresponding to the row ofthe matrix containing numerical datas of digital terrainmodel.The second step is to improve the resolution of mnt. Thematrix of mnt, is small (300×400 points). We increase themnt size, with a bicubic resampling of the matrix. Sizeis multiplied by two. The method is based on a splineinterpolation of degree 2 [1]. The bicubic even kernel isgiven by:
H(x) =
1 − 2x2 + x3 0 ≤ x ≤ 14 − 8x+ 5x2 − x3 1 ≤ x ≤ 20 otherwise
(2)
. We can then resample the digital function by writingthe following convolution product:
f(x) =∑
f(n) ∗H(x− n) (3)
The result is the image of the digital terrain modelresampled below:
Fig. 1. : Sainte Victoire mnt
B. Synthesis of a radar imageThen a radar image is synthesized using the
parameters of the plane or satellite: We need firstof the following parameters:-Altitude of the aircraft: Aav
-Aperture of the antenna: Apant
-Angle to the nearest terrain feature: Φmin
-Angle the more distant land: Φmax
-The slope of the antenna: Φmoy
-Distance of the aircraft Dav
Fig. 2. : Geometry of radar image
Then, it is then possible to calculate other parameters:
-Φ, angle between the scan trace, and the vertical ofthe plane:
Φ = arctan(Dav + x
Aav − z) (4)
r-distance between the plane and the mnt-point:
r =√
(Dav + x)2 + (Aav − z)2 (5)
Θ: angle of incidence:
Θ = arcosderx.sin(Φ) + cos(Φ)√derx2 + dery2 + 1
(6)
Where derx, dery are partial derivatives associate tomnt. From these parameters, we may, at any point ofa scan line, know the total backscattered energy. Thisenergy is given by the following equation:
E = σ0cos(Θ)√
1 + derx2 (7)
Fig. 3. :Synthesized image
If the resolution r is less than the mesh of the mnt,energy is recognized as the energy returned by severalpixels. During the synthesis, we share the energy receivedon these pixels. We will now make a readjustment,
Proceedings of the World Congress on Engineering 2014 Vol I, WCE 2014, July 2 - 4, 2014, London, U.K.
ISBN: 978-988-19252-7-5 ISSN: 2078-0958 (Print); ISSN: 2078-0966 (Online)
WCE 2014
between the real scene and the synthesized one from thedigital terrain model and flight parameters of the aircraftpicture.
Fig. 4. :Real scene
C. Readjustment of the real image on the synthesizedimage
The synthetic image is the ideal image that wouldbe obtained without speckle noise. The readjustment ofthe real image VARAN on this image synthesis shouldhelp rectify errors flight of the aircraft. The polynomialmodel of degree 2 is well suited for this first correction.
Examination of the table below shows that the averagedifferences in x and y are approximately one pixel. A dif-ference of one pixel from the exact point is a mandatoryapproximation. [5]
. Therefore, the readjustment can be considered verygood.
Average difference in x in y in xy1,79 1,68 0,97
Fig. 5. :Readjustment of the real image on the synthesized
However, the mnt resampled, the accuracy is 25 meters,for a more precise result, We would need to have moreaccurate digital terrain models.
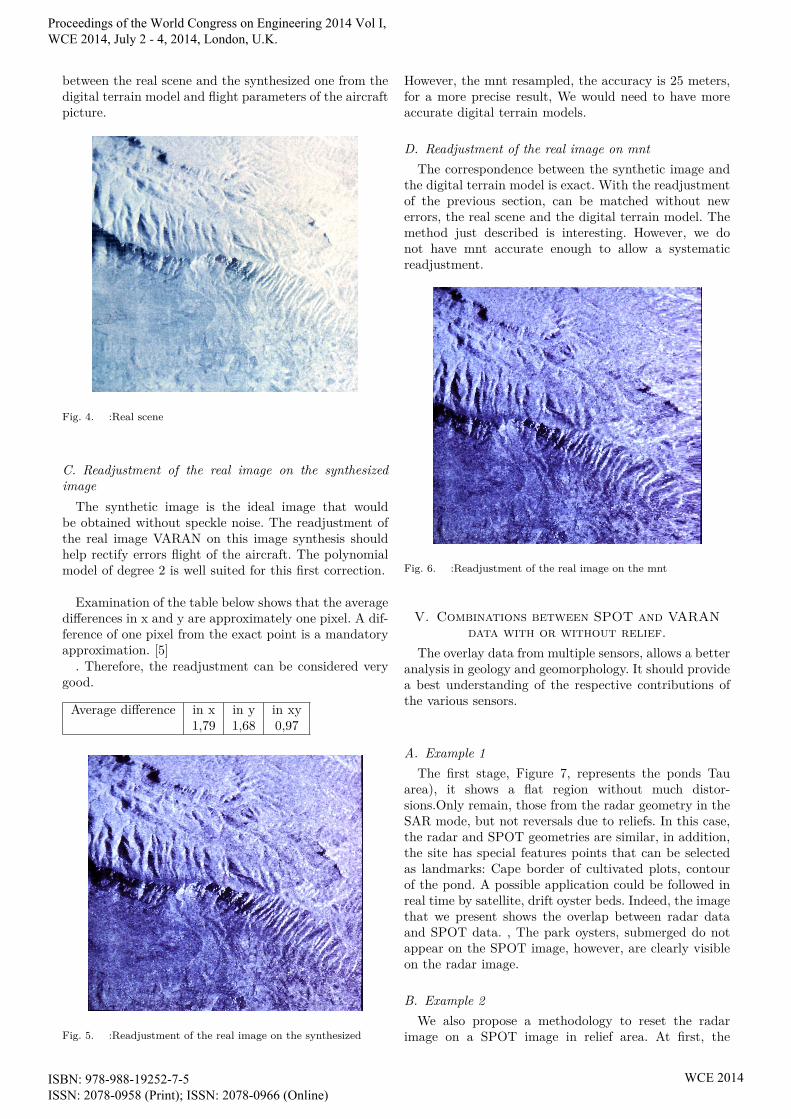
D. Readjustment of the real image on mntThe correspondence between the synthetic image and
the digital terrain model is exact. With the readjustmentof the previous section, can be matched without newerrors, the real scene and the digital terrain model. Themethod just described is interesting. However, we donot have mnt accurate enough to allow a systematicreadjustment.
Fig. 6. :Readjustment of the real image on the mnt
V. Combinations between SPOT and VARANdata with or without relief.
The overlay data from multiple sensors, allows a betteranalysis in geology and geomorphology. It should providea best understanding of the respective contributions ofthe various sensors.
A. Example 1The first stage, Figure 7, represents the ponds Tau
area), it shows a flat region without much distor-sions.Only remain, those from the radar geometry in theSAR mode, but not reversals due to reliefs. In this case,the radar and SPOT geometries are similar, in addition,the site has special features points that can be selectedas landmarks: Cape border of cultivated plots, contourof the pond. A possible application could be followed inreal time by satellite, drift oyster beds. Indeed, the imagethat we present shows the overlap between radar dataand SPOT data. , The park oysters, submerged do notappear on the SPOT image, however, are clearly visibleon the radar image.
B. Example 2We also propose a methodology to reset the radar
image on a SPOT image in relief area. At first, the
Proceedings of the World Congress on Engineering 2014 Vol I, WCE 2014, July 2 - 4, 2014, London, U.K.
ISBN: 978-988-19252-7-5 ISSN: 2078-0958 (Print); ISSN: 2078-0966 (Online)
WCE 2014

Fig. 7. :Comparison Radar-Spot On "Etangs de Tau"
distortions of the radar image is corrected by restoringthe geometry of the digital terrain model (see previoussection). Then, the overlap between the corrected radarimage and SPOT Image is performed. This is a delicateoperation, with the first readjustment errors, add thosefrom the SPOT image ( not exactly in the geometry ofthe mnt. The acquisition of SPOT mnt on this regionwould allow us to solve this last source of errors. Therelief features visible on the radar image are superposedon the visible areas of SPOT imagery. (See Figure 8)
Fig. 8. :Comparison Radar-Spot Sainte Victoire mountain
VI. Application of mathematical morphologyextraction directions geological accidentsThe extraction of networks is a central topic of a
great importance in remote sensing. From the radarscene acquired on the Massif de Bras ( Luc southernFrance) were extracted three directions of fracturesaffecting the Lias and partly Triassic. They correspondto real families accidents. Two of these families wereknown. The radar scene confirmed their existence,in addition, the third direction (North 160) is tobe highlighted. We can strengthen these directions,by manufacturing of structuring elements, and theapplication of morphological operations in each direction.
Fig. 9. :Direction of fracturation north 160
VII. Conclusion
The geometric rectfication a radar image on the digitalterrain model is the starting point that should be used tocompare images with different geometries. Spot imagingis less sensitive to geomorphologic accidents . Instead, theradar image, can solve this problem. On the other handclimatic conditions do not affect collect of radar data.It is therefore essential to have more effective tools tocompare the data between them. We can only encourageresearch to efficient pretreatments. we need to developtools that would help to improve the fusion of differentsatellite data, and better understand and use data fromdifferent sensor remote sensing.
References
[1] R.Bernstein, Image geometry and rectification manual of re-mote sensing manual of remote sensing, (American Society ofPhotogrametry, 1983, ch. 21, pge. 873-921).
[2] F. Cuq F., P. Durand, S. Hamidou, A. Simonin, Utilisation defiltres géostatistiques pour l"analyse de changement d’elle rtird’images satellitaires , (Photointerprtion Eska Paris, 1990 6,no 3, pge.33-38).
[3] P. Durand, M. Hakdaoui, J. Chorowicz, J.P Rudant, A. SimoninCaractérisation des textures urbaines sur image radar Varanpar approche morphologique et statistique. Application à la villedu Luc, (Int. J. Remote sensing, 1994 15, no 5, pge. 1065-1078).
[4] P. Durand, A. Mekarnia, A, Chorowicz J., Télé-analysegéologique du radar aéroporté VARAN sur la montagne SainteVictoire, (Photointerprétation Eska Paris, 1988, 27, no. 6, pge.1-10).
[5] J.Y Garinet Techniques de recalage d’images de tdetection ettransparence, (Thesis,1985, Toulouse).
[6] Goodman J.W. Some fundamental properties of speckle, (J.Opt. Soc. Am., 1976 66, n◦ 11 p 1145-1150)
[7] C.D.LLoyd, S.Berberoglu, P.J. Curran and P.M. Atkinson Acomparison of texture measures for per-field classification ofmediterranean land cover (Int. J. Remote sensing, 25, n 19,pp. 3943-3965, 2004).
[8] G. Matheron, Eléments pour une théorie des milieux poreux,(Masson, 1967)
[9] J.P Rudant J.P. , J Chorowicz, P. Durand, Problèmesd’interprétation g’omorphologique et modélisation géométriqued’images radar à partir d’un modèle numérique de térrain,(C.R.A.S„ Gauthier Villars, Paris, 1988, 306, n1).
[10] J.P. Rudant, B. Cervelle, J. Chorowicz, P. Durand, KamounP., S. Louhala S, L. Polidori, S. Riazanoff, A. Simonin,I. Tannous, Evaluation des données VARAN en géolo-gie,géomorphologie sur le sud est de la France, (Proc. of 4thInternational Colloquium on Spectral Signatures of Objects inRemote Sensing (ESA) , 1988).
Proceedings of the World Congress on Engineering 2014 Vol I, WCE 2014, July 2 - 4, 2014, London, U.K.
ISBN: 978-988-19252-7-5 ISSN: 2078-0958 (Print); ISSN: 2078-0966 (Online)
WCE 2014

[11] D. Vaillant VARAN S: An airborne synthetic apertureradar for research in microwave remote sensing, (Proc.EARSEL/ESA Symposium; 1985, p167-172).
Proceedings of the World Congress on Engineering 2014 Vol I, WCE 2014, July 2 - 4, 2014, London, U.K.
ISBN: 978-988-19252-7-5 ISSN: 2078-0958 (Print); ISSN: 2078-0966 (Online)
WCE 2014


![Index [complements.lavoisier.net] · Subcanopy and Subsurface (AirMOSS) 260–261 airborne sensors AirMOSS 260–261 E‐SAR/F‐SAR/PLMR2, 261–262 and features 260 HyMap 259–260](https://static.fdocuments.us/doc/165x107/5e3275efbac565760d5b4a2e/index-subcanopy-and-subsurface-airmoss-260a261-airborne-sensors-airmoss.jpg)


