Solubilities of corundum, wollastonite and quartz in H O ...manning/pdfs/nm06.pdf · Solubilities...
12
Solubilities of corundum, wollastonite and quartz in H 2 O–NaCl solutions at 800 °C and 10 kbar: Interaction of simple minerals with brines at high pressure and temperature Robert C. Newton, Craig E. Manning * Department of Earth and Space Sciences, University of California Los Angeles, Los Angeles, CA 90095-1567, USA Received 23 February 2006; accepted in revised form 14 August 2006 Abstract Solubilities of corundum (Al 2 O 3 ) and wollastonite (CaSiO 3 ) were measured in H 2 O–NaCl solutions at 800 °C and 10 kbar and NaCl concentrations up to halite saturation by weight-loss methods. Additional data on quartz solubility at a single NaCl concentration were obtained as a supplement to previous work. Single crystals of synthetic corundum, natural wollastonite or natural quartz were equili- brated with H 2 O and NaCl at pressure (P) and temperature (T) in a piston-cylinder apparatus with NaCl pressure medium and graphite heater sleeves. The three minerals show fundamentally different dissolution behavior. Corundum solubility undergoes large enhancement with NaCl concentration, rising rapidly from Al 2 O 3 molality ðm Al 2 O 3 Þ of 0.0013(1) (1r error) in pure H 2 O and then leveling off to a max- imum of 0.015 at halite saturation (X NaCl 0.58, where X is mole fraction). Solubility enhancement relative to that in pure H 2 O, X Al 2 O 3 =X Al 2 O 3 , passes through a maximum at X NaCl 0.15 and then declines towards halite saturation. Quenched fluids have neutral pH at 25 °C. Wollastonite has low solubility in pure H 2 O at this P and T ðm CaSiO 3 ¼ 0:0167ð6ÞÞ. It undergoes great enhancement, with a maximum solubility relative to that in H 2 O at X NaCl 0.33, and solubility >0.5 molal at halite saturation. Solute silica is 2.5 times higher than at quartz saturation in the system H 2 O–NaCl–SiO 2 , and quenched fluids are very basic (pH 11). Quartz shows monotonically decreasing solubility from m SiO 2 ¼ 1:248 in pure H 2 O to 0.202 at halite saturation. Quenched fluids are pH neutral. A simple ideal-mixing model for quartz-saturated solutions that requires as input only the solubility and speciation of silica in pure H 2 O reproduces the data and indicates that hydrogen bonding of molecular H 2 O to dissolved silica species is thermodynamically negligible. The maxima in X Al 2 O 3 =X Al 2 O 3 for corundum and wollastonite indicate that the solute products include hydrates and Na + and/or Cl species produced by molar ratios of reactant H 2 O to NaCl of 6:1 and 2:1, respectively. Our results imply that quite simple mechanisms may exist in the dissolution of common rock-forming minerals in saline fluids at high P and T and allow assessment of the interaction of simple, con- gruently soluble rock-forming minerals with brines associated with deep-crustal metamorphism. Ó 2006 Elsevier Inc. All rights reserved. 1. Introduction Fluid inclusions in rocks of deep-seated origin give indi- cation of the complexity of fluid activity in the earth’s inte- rior. Fluid compositions approaching pure H 2 O are rarely observed; instead, the fluids trapped in minerals of perido- tites, granulites and eclogites are usually CO 2 -rich (Touret, 1971; Roedder, 1972) and may be very salty, with daughter crystals of chloride, sulfate, oxide and silicate minerals (e.g., Philippot and Selverstone, 1991; Smit and Van Ree- nen, 1997). Some high-pressure granulite terranes feature both carbonic and salty fluid inclusions, apparently cap- tured coevally during deep-crustal metamorphism (Touret, 1985; Crawford and Hollister, 1986). These observations predict substantial immiscibility between CO 2 -rich and sal- ine aqueous fluids even at quite elevated P and T, as de- duced from experimental fluid-inclusion studies (Johnson, 1991; Gibert et al., 1998; Shmulovich and Graham, 2004). Possible roles of complex fluids in metamorphism, meta- somatism, and mineralization have been debated. H 2 O 0016-7037/$ - see front matter Ó 2006 Elsevier Inc. All rights reserved. doi:10.1016/j.gca.2006.08.012 * Corresponding author. Fax: +1 310 825 2779. E-mail address: [email protected] (C.E. Manning). www.elsevier.com/locate/gca Geochimica et Cosmochimica Acta 70 (2006) 5571–5582
Transcript of Solubilities of corundum, wollastonite and quartz in H O ...manning/pdfs/nm06.pdf · Solubilities...
www.elsevier.com/locate/gca
Geochimica et Cosmochimica Acta 70 (2006) 5571–5582
Solubilities of corundum, wollastonite and quartz in H2O–NaClsolutions at 800 �C and 10 kbar: Interaction of simple minerals
with brines at high pressure and temperature
Robert C. Newton, Craig E. Manning *
Department of Earth and Space Sciences, University of California Los Angeles, Los Angeles, CA 90095-1567, USA
Received 23 February 2006; accepted in revised form 14 August 2006
Abstract
Solubilities of corundum (Al2O3) and wollastonite (CaSiO3) were measured in H2O–NaCl solutions at 800 �C and 10 kbar and NaClconcentrations up to halite saturation by weight-loss methods. Additional data on quartz solubility at a single NaCl concentration wereobtained as a supplement to previous work. Single crystals of synthetic corundum, natural wollastonite or natural quartz were equili-brated with H2O and NaCl at pressure (P) and temperature (T) in a piston-cylinder apparatus with NaCl pressure medium and graphiteheater sleeves. The three minerals show fundamentally different dissolution behavior. Corundum solubility undergoes large enhancementwith NaCl concentration, rising rapidly from Al2O3 molality ðmAl2O3
Þ of 0.0013(1) (1r error) in pure H2O and then leveling off to a max-imum of �0.015 at halite saturation (XNaCl � 0.58, where X is mole fraction). Solubility enhancement relative to that in pure H2O,X Al2O3
=X�
Al2O3, passes through a maximum at XNaCl � 0.15 and then declines towards halite saturation. Quenched fluids have neutral
pH at 25 �C. Wollastonite has low solubility in pure H2O at this P and T ðmCaSiO3¼ 0:0167ð6ÞÞ. It undergoes great enhancement, with
a maximum solubility relative to that in H2O at XNaCl � 0.33, and solubility >0.5 molal at halite saturation. Solute silica is 2.5 timeshigher than at quartz saturation in the system H2O–NaCl–SiO2, and quenched fluids are very basic (pH 11). Quartz shows monotonicallydecreasing solubility from mSiO2
¼ 1:248 in pure H2O to 0.202 at halite saturation. Quenched fluids are pH neutral. A simple ideal-mixingmodel for quartz-saturated solutions that requires as input only the solubility and speciation of silica in pure H2O reproduces the dataand indicates that hydrogen bonding of molecular H2O to dissolved silica species is thermodynamically negligible. The maxima inX Al2O3
=X�
Al2O3for corundum and wollastonite indicate that the solute products include hydrates and Na+ and/or Cl� species produced
by molar ratios of reactant H2O to NaCl of 6:1 and 2:1, respectively. Our results imply that quite simple mechanisms may exist in thedissolution of common rock-forming minerals in saline fluids at high P and T and allow assessment of the interaction of simple, con-gruently soluble rock-forming minerals with brines associated with deep-crustal metamorphism.� 2006 Elsevier Inc. All rights reserved.
1. Introduction
Fluid inclusions in rocks of deep-seated origin give indi-cation of the complexity of fluid activity in the earth’s inte-rior. Fluid compositions approaching pure H2O are rarelyobserved; instead, the fluids trapped in minerals of perido-tites, granulites and eclogites are usually CO2-rich (Touret,1971; Roedder, 1972) and may be very salty, with daughter
0016-7037/$ - see front matter � 2006 Elsevier Inc. All rights reserved.
doi:10.1016/j.gca.2006.08.012
* Corresponding author. Fax: +1 310 825 2779.E-mail address: [email protected] (C.E. Manning).
crystals of chloride, sulfate, oxide and silicate minerals(e.g., Philippot and Selverstone, 1991; Smit and Van Ree-nen, 1997). Some high-pressure granulite terranes featureboth carbonic and salty fluid inclusions, apparently cap-tured coevally during deep-crustal metamorphism (Touret,1985; Crawford and Hollister, 1986). These observationspredict substantial immiscibility between CO2-rich and sal-ine aqueous fluids even at quite elevated P and T, as de-duced from experimental fluid-inclusion studies (Johnson,1991; Gibert et al., 1998; Shmulovich and Graham, 2004).
Possible roles of complex fluids in metamorphism, meta-somatism, and mineralization have been debated. H2O
5572 R.C. Newton, C.E. Manning 70 (2006) 5571–5582
activity in deep-crustal metamorphism must be quite low inorder to prevent widespread hydration reactions, or, athigher temperatures, rock melting. Estimates of H2O activ-ity in granulite facies metamorphism based on hydrousmineral equilibria range from 0.15 (Valley et al., 1983) to0.4–0.5 (Aranovich et al., 1987); more modern estimatesbased on experimental revision of phlogopite stability indi-cate that the higher values may be generally more appropri-ate (Aranovich and Newton, 1998). The amount of suchfluids which typically participated in deep-crustal meta-morphism is also debated. Some authors suggest that fluidaction typically is negligible (Lamb and Valley, 1984),whereas others have found evidence that fluid effects insome high-grade metamorphic episodes have been large(Ague, 1994; Manning and Ingebritsen, 1999). Evidencefrom stable isotope alteration in some granulites indicatesthat fluid masses which interacted with rocks must havebeen quite small, perhaps only a fraction of the rock massesthey interacted with (Valley et al., 1990). Newton et al.(1998) showed, however, that very small fluid-to-rock ra-tios could account for dehydration of biotite to form orth-opyroxene during granulite facies metamorphism, andNewton and Manning (2005) demonstrated that quitesmall amounts of saline fluids with a high sulfate contentcould account for the wide-spread oxidation known tohave affected some exposed deep-crustal terranes (e.g.Cameron and Hattori, 1994).
Lack of experimental information has hampered inter-pretation of fluid action at deep-crust and upper mantleconditions. Most of the existing experimental work relatesto fluids at low P and T near the critical point of H2O,where the solution behavior is quite complex. A vivid dem-onstration of this is the solubility of quartz in the low pres-sure range. At 0.5 kbar, the temperature coefficient ofsolubility changes from positive to negative over the range300–500 �C (Kennedy, 1950). Calculations of phase equi-libria and component activities in the simple systemH2O–NaCl at pressures below 2 kbar (where NaCl is partlyto strongly associated) require complex algorithms (Bowersand Helgeson, 1983). Quartz solubility in H2O–NaCl fluidsundergoes strong increase with increasing salinity at 1–2 kbar (Novgorodov, 1977; Xie and Walther, 1993; New-ton and Manning, 2000; Shmulovich et al., 2006). If solutesilica exists as a neutral monomeric dihydrate with addi-tional hydrogen-bonded water molecules (e.g., Waltherand Orville, 1983), decrease of H2O activity in H2O–NaClfluids should inhibit quartz solubility, as it does in H2O–CO2 and H2O–Ar fluids (Walther and Orville, 1983), unlessthere is strong interaction of quartz with NaCl-bearing flu-ids in the low-pressure range, perhaps with the formationof Na-silicate or Si chloride species. Anderson and Burn-ham (1967) suggested the reaction:
SiO2quartz
þ2H2OþNaCl ¼ H3NaSiO4;aq þHCl ð1Þ
Measurements at elevated P and T suggest that chloridesolutions, and quartz solubility in them, are much simpler
than at shallow-crustal conditions (Aranovich and New-ton, 1996, 1997; Newton and Manning, 2000; Shmulovichet al., 2001, 2006; Tropper and Manning, 2004). Aranovichand Newton (1996) found that at 650–850 �C and10–15 kbar, the activities of H2O and NaCl are closelyapproximated by a simple mixing model involving fully dis-sociated NaCl, in which Na+ and Cl� ions mix ideally withH2O molecules. This ideal-fused-salt model, advocated byBradley (1962) for melting of hydrated salt mixtures at highT and P, leads to the simple expressions for componentactivities
aH2O ¼ ð1� X NaClÞ=ð1þ X NaClÞ ð2aÞ
aNaCl ¼ 4X 2NaCl=ð1þ X NaClÞ2 ð2bÞ
where XNaCl is the mole fraction of NaCl. Moreover,quartz solubility in such fluids is also simpler than at lowP and T. Newton and Manning (2000) found that above7 kbar, the solubility of quartz decreases monotonicallywith NaCl concentration. This implies that solvent interac-tion is much weaker at high pressures, probably due todestabilization of hydrated aqueous silica by decreasingH2O activity. Finally, Zotov and Keppler (2002) and New-ton and Manning (2003) found that quartz solubility andsilica activity in aqueous fluids could be described accurate-ly by an ideal solution model in which silica monomers(H4SiO4 Æ solvated H2O) and dimers (H6Si2O7 Æ solvatedH2O) mix ideally with H2O molecules. These observationssuggest that insight into the interaction of minerals withcomplex natural fluids may be gained from simple mixingconsiderations once accurate solubility data at high P
and T are compiled for a number of common minerals.The present study investigates the solubilities of corun-
dum and wollastonite at 800 �C and 10 kbar, and NaClmole fraction (XNaCl) from zero to halite saturation(�0.58; Aranovich and Newton, 1996). Previous work onthe solubilities of these minerals is too scant to draw gener-al conclusions about dissolution reactions in H2O–NaCl athigh T and P. Anderson and Burnham (1967) made a fewreconnaissance experiments on the solubility of corundumin moderately concentrated NaCl solutions at 700 �C andpressures up to 4 kbar. They suggested that NaCl enhancescorundum solubility, but did not establish the magnitudeof the effect. Walther (2001) found that NaCl concentra-tions up to 1 molal (1.8 mol%) enhances corundum solubil-ity at pressures up to 2 kbar and temperatures to 500 �C.These data cannot be extrapolated to higher P and T: thepossibility exists that NaCl enhancement of corundum sol-ubility behaves like that of quartz, and that pressure in-crease beyond 2 kbar reverses the initial solubilityenhancement. No experimental data on the solubility ofwollastonite in NaCl solutions were available prior to thepresent study. The only comprehensive data on quartz inNaCl solutions at elevated P and T are those of Newtonand Manning (2000) and Shmulovich et al. (2001). Thetwo data sets are in reasonable agreement: they showmonotonic decrease of quartz solubility with NaCl
Solubility of quartz, corundum and wollastonite at high P and T 5573
concentration at pressures greater than 5 kbar. These data,together with the present data for corundum and wollas-tonite, provide a framework for a first assessment of thephysical chemistry of dissolution reactions of minerals inconcentrated brines at deep-seated conditions.
2. Experimental methods
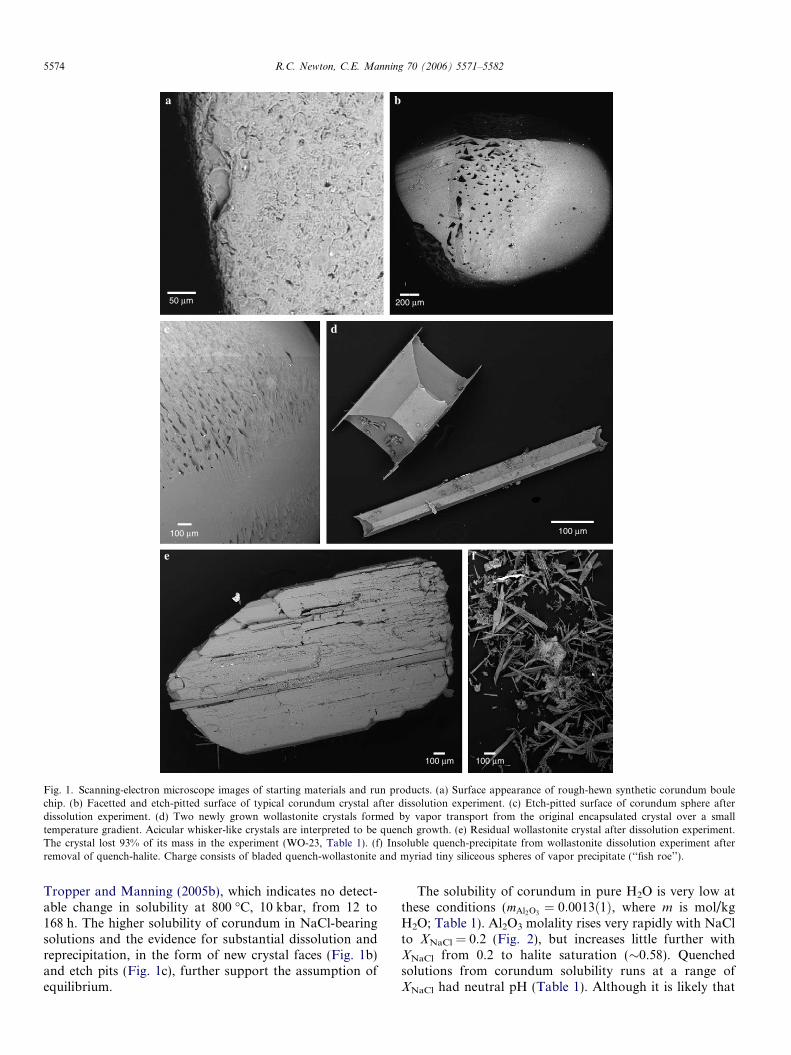
Starting materials were single crystals of high-puritysynthetic corundum and natural wollastonite and quartz,reagent NaCl and doubly distilled, deionized H2O. Twotypes of corundum were used. Chips of 1–7 mg weight froma large corundum boule were shaped into ellipsoids with adiamond file and smoothed with 600-mesh alundum paperand 15 lm diamond paper. Fig. 1a shows the appearanceof a typical corundum starting crystal. A few solutionexperiments were made with synthetic corundum spheresof about 32 mg, obtained from P. Tropper (U. Innsbruck)and used in the study of Tropper and Manning (2005b).The wollastonite starting material was a very pure naturalsample used in the solution calorimetry study of Charluet al. (1978). Quartz starting material was the natural sam-ple used by Newton and Manning (2000).
Experimental materials were encapsulated in weldedsegments of Pt tubing of 3.5 mm diameter and 0.15 mmwall thickness. It was necessary to encapsulate the some-what fragile wollastonite crystals in inner Pt capsules of1.5 mm diameter, perforated with 3–7 small holes to allowaccess of the fluid. Materials were loaded into the large Ptcapsules in the order: crystal (or inner capsule), NaCl,H2O, with weighing at each step. The capsule was thensealed by arc welding.
All experiments were performed in the 3/4-in. (1.91-cm)diameter piston-cylinder apparatus with NaCl pressuremedium and graphite heater sleeve. Pressure was measuredwith a Heise Bourdon-tube gauge which was calibratedagainst a highly accurate standard gauge. All experimentswere made in the piston-out mode: first, an assembly wasbrought to a nominal pressure of 7 kbar, then heated to800 �C. Thermal expansion of the assembly carried thepressure to 10 kbar; some bleeding of oil pressure wasneeded to prevent overshooting. Pressures are consideredaccurate to ±300 bars. Temperatures were measured andcontrolled automatically with calibrated matched pairs ofW97Re3 vs. W75Re25 thermocouples in contact with thesample capsules and are considered accurate to ±3 �C.
Experiments were quenched by cutting power to theapparatus. Temperature fell below 200 �C in �10 s. Afterextraction of the capsule from the assembly, the H2O con-tents were in most cases checked by drying weight loss andfound to agree with the initial H2O within 0.6 wt%. In sev-eral experiments, the pH of the quench fluid was deter-mined using pH paper calibrated in integer increments.The paper strip was placed face-down on a cleanedquenched capsule and the puncturing needle penetratedboth paper and capsule. The indicator squares were thor-oughly wetted as the capsule fluid oozed out, and the
color-code was read while still wet. When pH of quenchfluid was determined it was not possible to determine theH2O weight after an experiment. For consistency, we there-fore used H2O-in weight in solubility calculations wherepossible.
Solubilities were determined by weight losses of the crys-tals, or, for wollastonite, by weighing both inner capsuleand residual crystal from a quenched experiment. Massesof corundum before and after most experiments, as wellas H2O and NaCl in all runs, were determined on a MettlerM3 microbalance, for which 1r = 2 lg for each reportedweight based on repeated weighings of a standard. Massesso determined are reported in Table 1 to three decimalplaces; i.e., to the nearest microgram. During the courseof this study we switched to a Mettler UMX2 ultramicro-balance (1r = 0.2 lg) for crystal and inner-capsule weigh-ings. Table 1 gives these higher precision weights to fourdecimal places. Concentrations are reported on the molal-ity scale (moles solute per kg H2O) assuming that any H2Oremoved from the bulk solvent to form hydrous solutes isnegligible.
In the wollastonite experiments, the quenched and driedNaCl precipitate was removed from an inner capsule bysoaking in H2O at 80 �C for 10-min periods, followed bydrying, until constant weight was attained. A small amountof insoluble quench residue in the inner capsule consistedof myriad tiny siliceous spheres and thin, tapered wollas-tonite blades precipitated from the fluid during the quench.For this reason the weight losses of the inner capsules gavelower limits to wollastonite solubility. In most quenchedcharges, essentially intact wollastonite crystals could be re-trieved from the inner capsules. Small breakage losses fromthe irregularly dissolved crystals could give spuriously highsolubility indication; for this reason the weights losses ofthe residual wollastonite crystals are regarded as givingupper solubility limits.
Some definitive runs on wollastonite solubility were onunencapsulated single crystals of the natural materialwhose initial weight was chosen to be close to the wollas-tonite solubility at a given NaCl concentration, as deter-mined by the experiments on encapsulated crystals. Thepresence or absence of any residual crystals, as determinedby observation of the quenched and dried charge with abinocular microscope, indicated whether the equilibriumfluid was wollastonite-saturated. In some experiments, itwas possible to retrieve and weigh very small residual crys-tals, thus yielding a highly precise solubility value.
3. Results
3.1. Corundum
Measurements of the solubility of corundum in NaClsolutions at 10 kbar and 800 �C are listed in Table 1.The experiments were conducted for 3–7 days. This wasdeemed adequate for equilibrium based on comparisonof our data in pure H2O with the 12 h experiment of
50 μm 200 μm
100 μm100 μm
100 μm 100 μm
a
c d
e f
b
Fig. 1. Scanning-electron microscope images of starting materials and run products. (a) Surface appearance of rough-hewn synthetic corundum boulechip. (b) Facetted and etch-pitted surface of typical corundum crystal after dissolution experiment. (c) Etch-pitted surface of corundum sphere afterdissolution experiment. (d) Two newly grown wollastonite crystals formed by vapor transport from the original encapsulated crystal over a smalltemperature gradient. Acicular whisker-like crystals are interpreted to be quench growth. (e) Residual wollastonite crystal after dissolution experiment.The crystal lost 93% of its mass in the experiment (WO-23, Table 1). (f) Insoluble quench-precipitate from wollastonite dissolution experiment afterremoval of quench-halite. Charge consists of bladed quench-wollastonite and myriad tiny siliceous spheres of vapor precipitate (‘‘fish roe’’).
5574 R.C. Newton, C.E. Manning 70 (2006) 5571–5582
Tropper and Manning (2005b), which indicates no detect-able change in solubility at 800 �C, 10 kbar, from 12 to168 h. The higher solubility of corundum in NaCl-bearingsolutions and the evidence for substantial dissolution andreprecipitation, in the form of new crystal faces (Fig. 1b)and etch pits (Fig. 1c), further support the assumption ofequilibrium.
The solubility of corundum in pure H2O is very low atthese conditions (mAl2O3
¼ 0:0013ð1Þ, where m is mol/kgH2O; Table 1). Al2O3 molality rises very rapidly with NaClto XNaCl = 0.2 (Fig. 2), but increases little further withXNaCl from 0.2 to halite saturation (�0.58). Quenchedsolutions from corundum solubility runs at a range ofXNaCl had neutral pH (Table 1). Although it is likely that
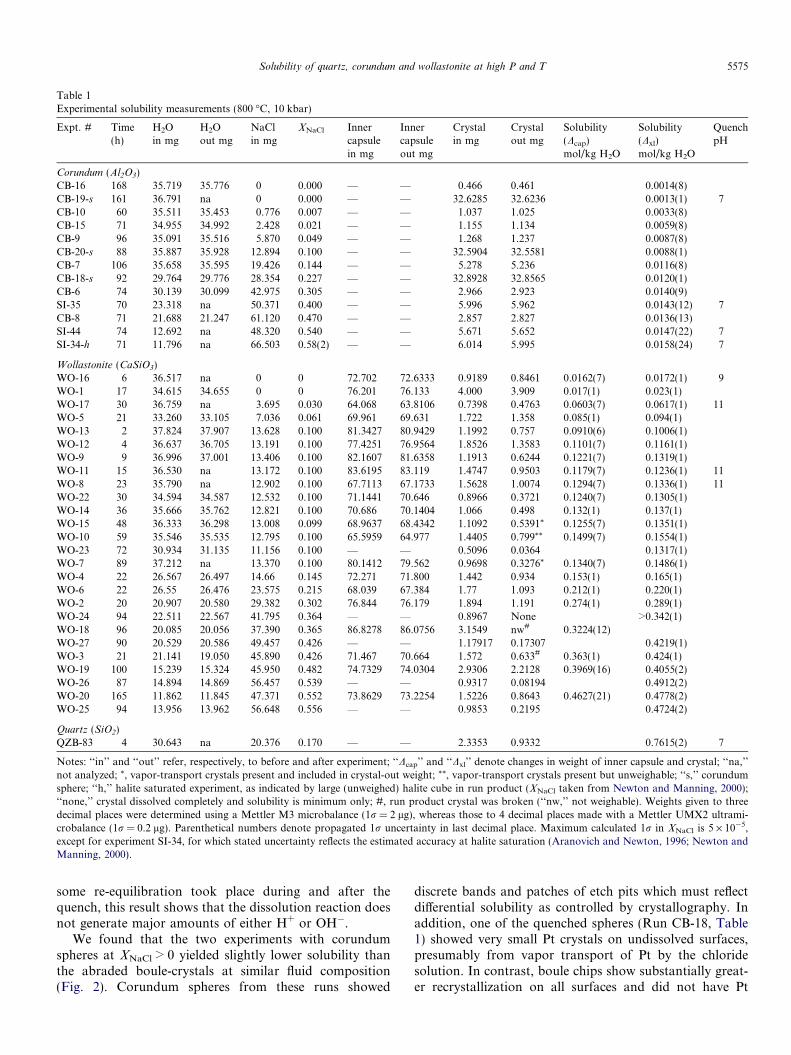
Table 1Experimental solubility measurements (800 �C, 10 kbar)
Expt. # Time(h)
H2Oin mg
H2Oout mg
NaClin mg
XNaCl Innercapsulein mg
Innercapsuleout mg
Crystalin mg
Crystalout mg
Solubility(Dcap)mol/kg H2O
Solubility(Dxl)mol/kg H2O
QuenchpH
Corundum (Al2O3)CB-16 168 35.719 35.776 0 0.000 — — 0.466 0.461 0.0014(8)CB-19-s 161 36.791 na 0 0.000 — — 32.6285 32.6236 0.0013(1) 7CB-10 60 35.511 35.453 0.776 0.007 — — 1.037 1.025 0.0033(8)CB-15 71 34.955 34.992 2.428 0.021 — — 1.155 1.134 0.0059(8)CB-9 96 35.091 35.516 5.870 0.049 — — 1.268 1.237 0.0087(8)CB-20-s 88 35.887 35.928 12.894 0.100 — — 32.5904 32.5581 0.0088(1)CB-7 106 35.658 35.595 19.426 0.144 — — 5.278 5.236 0.0116(8)CB-18-s 92 29.764 29.776 28.354 0.227 — — 32.8928 32.8565 0.0120(1)CB-6 74 30.139 30.099 42.975 0.305 — — 2.966 2.923 0.0140(9)SI-35 70 23.318 na 50.371 0.400 — — 5.996 5.962 0.0143(12) 7CB-8 71 21.688 21.247 61.120 0.470 — — 2.857 2.827 0.0136(13)SI-44 74 12.692 na 48.320 0.540 — — 5.671 5.652 0.0147(22) 7SI-34-h 71 11.796 na 66.503 0.58(2) — — 6.014 5.995 0.0158(24) 7
Wollastonite (CaSiO3)WO-16 6 36.517 na 0 0 72.702 72.6333 0.9189 0.8461 0.0162(7) 0.0172(1) 9WO-1 17 34.615 34.655 0 0 76.201 76.133 4.000 3.909 0.017(1) 0.023(1)WO-17 30 36.759 na 3.695 0.030 64.068 63.8106 0.7398 0.4763 0.0603(7) 0.0617(1) 11WO-5 21 33.260 33.105 7.036 0.061 69.961 69.631 1.722 1.358 0.085(1) 0.094(1)WO-13 2 37.824 37.907 13.628 0.100 81.3427 80.9429 1.1992 0.757 0.0910(6) 0.1006(1)WO-12 4 36.637 36.705 13.191 0.100 77.4251 76.9564 1.8526 1.3583 0.1101(7) 0.1161(1)WO-9 9 36.996 37.001 13.406 0.100 82.1607 81.6358 1.1913 0.6244 0.1221(7) 0.1319(1)WO-11 15 36.530 na 13.172 0.100 83.6195 83.119 1.4747 0.9503 0.1179(7) 0.1236(1) 11WO-8 23 35.790 na 12.902 0.100 67.7113 67.1733 1.5628 1.0074 0.1294(7) 0.1336(1) 11WO-22 30 34.594 34.587 12.532 0.100 71.1441 70.646 0.8966 0.3721 0.1240(7) 0.1305(1)WO-14 36 35.666 35.762 12.821 0.100 70.686 70.1404 1.066 0.498 0.132(1) 0.137(1)WO-15 48 36.333 36.298 13.008 0.099 68.9637 68.4342 1.1092 0.5391* 0.1255(7) 0.1351(1)WO-10 59 35.546 35.535 12.795 0.100 65.5959 64.977 1.4405 0.799** 0.1499(7) 0.1554(1)WO-23 72 30.934 31.135 11.156 0.100 — — 0.5096 0.0364 0.1317(1)WO-7 89 37.212 na 13.370 0.100 80.1412 79.562 0.9698 0.3276* 0.1340(7) 0.1486(1)WO-4 22 26.567 26.497 14.66 0.145 72.271 71.800 1.442 0.934 0.153(1) 0.165(1)WO-6 22 26.55 26.476 23.575 0.215 68.039 67.384 1.77 1.093 0.212(1) 0.220(1)WO-2 20 20.907 20.580 29.382 0.302 76.844 76.179 1.894 1.191 0.274(1) 0.289(1)WO-24 94 22.511 22.567 41.795 0.364 — — 0.8967 None >0.342(1)WO-18 96 20.085 20.056 37.390 0.365 86.8278 86.0756 3.1549 nw# 0.3224(12)WO-27 90 20.529 20.586 49.457 0.426 — — 1.17917 0.17307 0.4219(1)WO-3 21 21.141 19.050 45.890 0.426 71.467 70.664 1.572 0.633# 0.363(1) 0.424(1)WO-19 100 15.239 15.324 45.950 0.482 74.7329 74.0304 2.9306 2.2128 0.3969(16) 0.4055(2)WO-26 87 14.894 14.869 56.457 0.539 — — 0.9317 0.08194 0.4912(2)WO-20 165 11.862 11.845 47.371 0.552 73.8629 73.2254 1.5226 0.8643 0.4627(21) 0.4778(2)WO-25 94 13.956 13.962 56.648 0.556 — — 0.9853 0.2195 0.4724(2)
Quartz (SiO2)QZB-83 4 30.643 na 20.376 0.170 — — 2.3353 0.9332 0.7615(2) 7
Notes: ‘‘in’’ and ‘‘out’’ refer, respectively, to before and after experiment; ‘‘Dcap’’ and ‘‘Dxl’’ denote changes in weight of inner capsule and crystal; ‘‘na,’’not analyzed; *, vapor-transport crystals present and included in crystal-out weight; **, vapor-transport crystals present but unweighable; ‘‘s,’’ corundumsphere; ‘‘h,’’ halite saturated experiment, as indicated by large (unweighed) halite cube in run product (XNaCl taken from Newton and Manning, 2000);‘‘none,’’ crystal dissolved completely and solubility is minimum only; #, run product crystal was broken (‘‘nw,’’ not weighable). Weights given to threedecimal places were determined using a Mettler M3 microbalance (1r = 2 lg), whereas those to 4 decimal places made with a Mettler UMX2 ultrami-crobalance (1r = 0.2 lg). Parenthetical numbers denote propagated 1r uncertainty in last decimal place. Maximum calculated 1r in XNaCl is 5 · 10�5,except for experiment SI-34, for which stated uncertainty reflects the estimated accuracy at halite saturation (Aranovich and Newton, 1996; Newton andManning, 2000).
Solubility of quartz, corundum and wollastonite at high P and T 5575
some re-equilibration took place during and after thequench, this result shows that the dissolution reaction doesnot generate major amounts of either H+ or OH�.
We found that the two experiments with corundumspheres at XNaCl > 0 yielded slightly lower solubility thanthe abraded boule-crystals at similar fluid composition(Fig. 2). Corundum spheres from these runs showed
discrete bands and patches of etch pits which must reflectdifferential solubility as controlled by crystallography. Inaddition, one of the quenched spheres (Run CB-18, Table1) showed very small Pt crystals on undissolved surfaces,presumably from vapor transport of Pt by the chloridesolution. In contrast, boule chips show substantially great-er recrystallization on all surfaces and did not have Pt
0
5
10
15
20
0 0.1 0.2 0.3 0.4 0.5 0.6 0.7
Corundum800 ˚C, 10 kbar
Boule chipsSpheres
103 m
Al2
O3
XNaCl
Equation 3
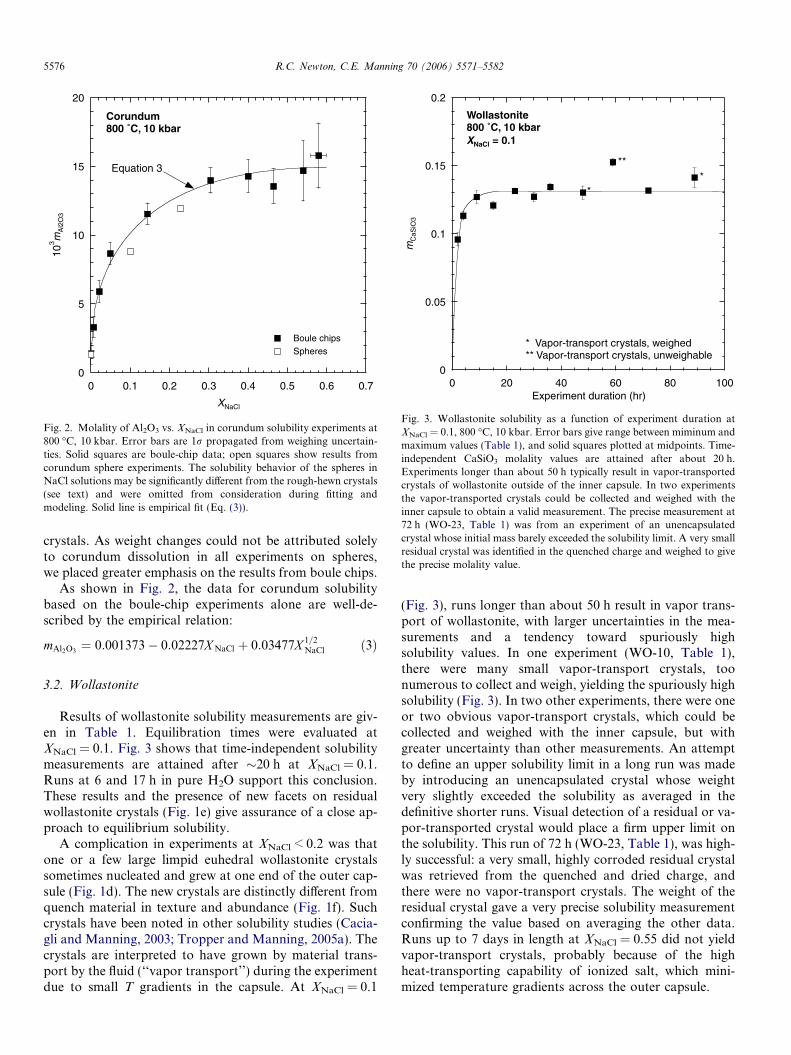
Fig. 2. Molality of Al2O3 vs. XNaCl in corundum solubility experiments at800 �C, 10 kbar. Error bars are 1r propagated from weighing uncertain-ties. Solid squares are boule-chip data; open squares show results fromcorundum sphere experiments. The solubility behavior of the spheres inNaCl solutions may be significantly different from the rough-hewn crystals(see text) and were omitted from consideration during fitting andmodeling. Solid line is empirical fit (Eq. (3)).
0
0.05
0.1
0.15
0.2
0 20 40 60 80 100
Wollastonite800 ˚C, 10 kbarXNaCl = 0.1
mC
aSiO
3
Experiment duration (hr)
**
**
* Vapor-transport crystals, weighed** Vapor-transport crystals, unweighable
Fig. 3. Wollastonite solubility as a function of experiment duration atXNaCl = 0.1, 800 �C, 10 kbar. Error bars give range between miminum andmaximum values (Table 1), and solid squares plotted at midpoints. Time-independent CaSiO3 molality values are attained after about 20 h.Experiments longer than about 50 h typically result in vapor-transportedcrystals of wollastonite outside of the inner capsule. In two experimentsthe vapor-transported crystals could be collected and weighed with theinner capsule to obtain a valid measurement. The precise measurement at72 h (WO-23, Table 1) was from an experiment of an unencapsulatedcrystal whose initial mass barely exceeded the solubility limit. A very smallresidual crystal was identified in the quenched charge and weighed to givethe precise molality value.
5576 R.C. Newton, C.E. Manning 70 (2006) 5571–5582
crystals. As weight changes could not be attributed solelyto corundum dissolution in all experiments on spheres,we placed greater emphasis on the results from boule chips.
As shown in Fig. 2, the data for corundum solubilitybased on the boule-chip experiments alone are well-de-scribed by the empirical relation:
mAl2O3¼ 0:001373� 0:02227X NaCl þ 0:03477X 1=2
NaCl ð3Þ
3.2. Wollastonite
Results of wollastonite solubility measurements are giv-en in Table 1. Equilibration times were evaluated atXNaCl = 0.1. Fig. 3 shows that time-independent solubilitymeasurements are attained after �20 h at XNaCl = 0.1.Runs at 6 and 17 h in pure H2O support this conclusion.These results and the presence of new facets on residualwollastonite crystals (Fig. 1e) give assurance of a close ap-proach to equilibrium solubility.
A complication in experiments at XNaCl < 0.2 was thatone or a few large limpid euhedral wollastonite crystalssometimes nucleated and grew at one end of the outer cap-sule (Fig. 1d). The new crystals are distinctly different fromquench material in texture and abundance (Fig. 1f). Suchcrystals have been noted in other solubility studies (Cacia-gli and Manning, 2003; Tropper and Manning, 2005a). Thecrystals are interpreted to have grown by material trans-port by the fluid (‘‘vapor transport’’) during the experimentdue to small T gradients in the capsule. At XNaCl = 0.1
(Fig. 3), runs longer than about 50 h result in vapor trans-port of wollastonite, with larger uncertainties in the mea-surements and a tendency toward spuriously highsolubility values. In one experiment (WO-10, Table 1),there were many small vapor-transport crystals, toonumerous to collect and weigh, yielding the spuriously highsolubility (Fig. 3). In two other experiments, there were oneor two obvious vapor-transport crystals, which could becollected and weighed with the inner capsule, but withgreater uncertainty than other measurements. An attemptto define an upper solubility limit in a long run was madeby introducing an unencapsulated crystal whose weightvery slightly exceeded the solubility as averaged in thedefinitive shorter runs. Visual detection of a residual or va-por-transported crystal would place a firm upper limit onthe solubility. This run of 72 h (WO-23, Table 1), was high-ly successful: a very small, highly corroded residual crystalwas retrieved from the quenched and dried charge, andthere were no vapor-transport crystals. The weight of theresidual crystal gave a very precise solubility measurementconfirming the value based on averaging the other data.Runs up to 7 days in length at XNaCl = 0.55 did not yieldvapor-transport crystals, probably because of the highheat-transporting capability of ionized salt, which mini-mized temperature gradients across the outer capsule.

1.4
Solubility of quartz, corundum and wollastonite at high P and T 5577
Our results indicate that wollastonite is much less solu-ble than enstatite (MgSiO3) in pure H2O at 800 �C and10 kbar (Newton and Manning, 2002) and, unlike enstatite,dissolves congruently. Fig. 4 shows that the wollastonitemolality determined in the present study (0.0167 ±0.005 molal) is significantly lower than the value of0.0871 of by Fockenberg et al. (2006). We speculate thatthe higher value might be explained by vapor-transportcrystals in the experiments of Fockenberg et al. (2006).Wollastonite solubility increases strongly with XNaCl, risingnearly 40-fold between pure H2O and halite saturation(Fig. 4). At high NaCl concentration, the silica concentra-tions are 2.5 times greater than at quartz saturation in thesystem H2O–NaCl–SiO2 at the same P and T (Newton andManning, 2000). The solubility data can be described withhigh fidelity by:
mCaSiO3¼ 0:0204þ 0:6734X NaCl þ 0:1183X 1=2
NaCl ð4Þ(Fig. 4). The data appear to be more scattered atXNaCl > 0.3, possibly from greater difficulty of equilibra-tion in the high-NaCl, low-H2O fluids, but moreprobably because of the very high solubilities, and hencecongestion of the recovered charges with quenched fluidprecipitate.
Measurements of pH of fluids quenched from wollaston-ite solubility experiments were strongly basic. The pureH2O runs gave a pH of about 9, whereas all NaCl-bearingcharges yielded a pH of 11. This result indicates that OH�
is a major product of the dissolution reaction and is en-hanced by the presence of NaCl.
0
0.1
0.2
0.3
0.4
0.5
0 0.1 0.2 0.3 0.4 0.5 0.6
This study
Fockenberg et al. (2006)
mC
aSiO
3
XNaCl
Equation 4
Fig. 4. Molality of CaSiO3 vs. XNaCl in wollastonite solubility experimentsat 800 �C, 10 kbar. Data (solid squares) and error bars plotted as in Fig. 3,except datum at XNaCl = 0.1, which is the weighted average of experiments>20 h and lacking vapor-transport crystals (Table 1; Fig. 3). Solid curve isEq. (4). Open square shows measurement of Fockenberg et al. (2006).
3.3. Quartz
Newton and Manning (2000) measured quartz solubilityin H2O–NaCl solutions at 10 kbar and 800 �C in H2O–NaCl (Fig. 5). We conducted an additional experiment atXNaCl = 0.17 to evaluate quench pH, which is 7 (Table1). This suggests that any solvent interaction similar to thatof Eq. (1) is quite negligible at these elevated P–T
conditions.The effect of NaCl on quartz solubility at high pressures
and temperatures (Fig. 5) contrasts with that on corundumand wollastonite: the monotonic decline in quartz solubilitywith XNaCl indicates that decrease of H2O activity is agreater factor in solubility than solvent interaction. As dis-cussed above, quartz shows different behavior at low P,where an initial enhancement of quartz solubility withincreasing XNaCl at 62 kbar indicates substantial interac-tion between the solvent and dissolved silica.
4. Discussion
The contrasting dependence of solubility of corundum,wollastonite and quartz on XNaCl can be explored using asimple ideal-fused-salt model. It is useful as a first step toconvert concentrations from molality (Table 1) to the molefraction scale, the formulation of which depends on thestate of the solvent. Aranovich and Newton (1996) showed
0
0.2
0.4
0.6
0.8
1
1.2
0 0.1 0.2 0.3 0.4 0.5 0.6
Quartz800 ˚C, 10 kbar
Newton & Manning (2000)
This study
mS
iO2
XNaCl
n = 2
Fig. 5. Molality of SiO2 vs. XNaCl in quartz solubility experiments at800 �C, 10 kbar. Filled squares are from Newton and Manning (2000);open square, this study. Solid line is a theoretical curve using the SiO2
polymerization theory of Newton and Manning (2003) with a monomerhydration number (n) of 2 and Kmd = 118 (see text). The good agreementbetween the experimental data and the prediction with n = 2 implies thatSiO2 species in NaCl solutions at 800 �C and 10 kbar have negligiblehydrogen-bonded H2O of solvation at high temperature and pressure.
5578 R.C. Newton, C.E. Manning 70 (2006) 5571–5582
experimentally that H2O and NaCl mix in all proportionsat 800 �C and 10 kbar as if these solutions were ideal mix-tures of Na+ and Cl� ions and H2O molecules. FollowingBradley (1962), the mole fraction of species i among j totalspecies (ions or molecules) is X i ¼ ni=
Pjnj, where n is num-
ber of moles and electrical neutrality is maintained (see alsoPitzer, 1980; Pabalan and Pitzer, 1990). Thus, X H2O ¼ 0:33in an equimolar mixture of H2O and fully dissociated NaCl(ions produced by minor H2O dissociation are clearly neg-ligible). Implicit in Bradley’s treatment are standard statesof unit activity at any P and T of pure solids (halite), liq-uids (H2O) and fully dissociated fused salts (liquid NaCl),which leads directly to Eqs. (2a) and (2b). Assuming thatsolute concentrations derived from congruently dissolvingmineral r (quartz, corundum or wollastonite) are small,their unknown extent of dissociation and degree of interac-tion with Na, Cl, and H2O can be ignored, and mole frac-tion can be calculated from molality from
X r ¼mr
mr þ 55:51 1þ 2X NaCl
1�X NaCl
� � ð5Þ
where XNaCl is the mole fraction of NaCl in the H2O–NaClsubsystem.
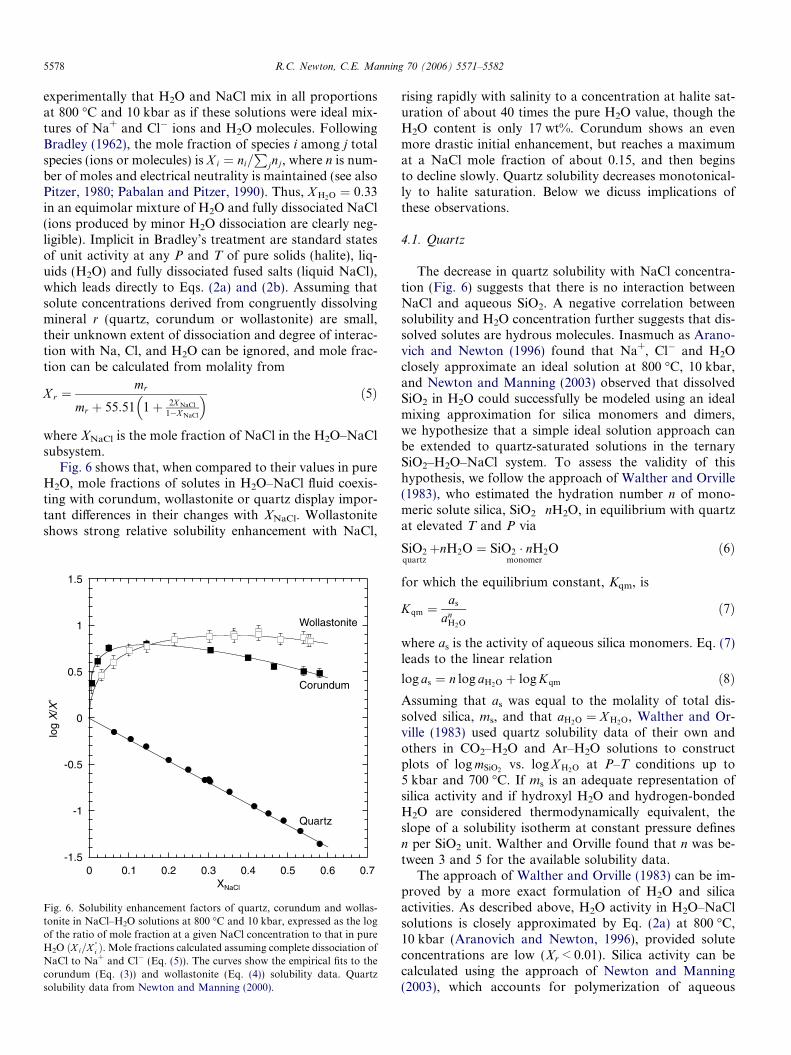
Fig. 6 shows that, when compared to their values in pureH2O, mole fractions of solutes in H2O–NaCl fluid coexis-ting with corundum, wollastonite or quartz display impor-tant differences in their changes with XNaCl. Wollastoniteshows strong relative solubility enhancement with NaCl,
-1.5
-1
-0.5
0
0.5
1
1.5
0 0.1 0.2 0.3 0.4 0.5 0.6 0.7
log
X/X
˚
XNaCl
Corundum
Wollastonite
Quartz
Fig. 6. Solubility enhancement factors of quartz, corundum and wollas-tonite in NaCl–H2O solutions at 800 �C and 10 kbar, expressed as the logof the ratio of mole fraction at a given NaCl concentration to that in pureH2O ðX i=X
�
i Þ. Mole fractions calculated assuming complete dissociation ofNaCl to Na+ and Cl� (Eq. (5)). The curves show the empirical fits to thecorundum (Eq. (3)) and wollastonite (Eq. (4)) solubility data. Quartzsolubility data from Newton and Manning (2000).
rising rapidly with salinity to a concentration at halite sat-uration of about 40 times the pure H2O value, though theH2O content is only 17 wt%. Corundum shows an evenmore drastic initial enhancement, but reaches a maximumat a NaCl mole fraction of about 0.15, and then beginsto decline slowly. Quartz solubility decreases monotonical-ly to halite saturation. Below we dicuss implications ofthese observations.
4.1. Quartz
The decrease in quartz solubility with NaCl concentra-tion (Fig. 6) suggests that there is no interaction betweenNaCl and aqueous SiO2. A negative correlation betweensolubility and H2O concentration further suggests that dis-solved solutes are hydrous molecules. Inasmuch as Arano-vich and Newton (1996) found that Na+, Cl� and H2Oclosely approximate an ideal solution at 800 �C, 10 kbar,and Newton and Manning (2003) observed that dissolvedSiO2 in H2O could successfully be modeled using an idealmixing approximation for silica monomers and dimers,we hypothesize that a simple ideal solution approach canbe extended to quartz-saturated solutions in the ternarySiO2–H2O–NaCl system. To assess the validity of thishypothesis, we follow the approach of Walther and Orville(1983), who estimated the hydration number n of mono-meric solute silica, SiO2 Æ nH2O, in equilibrium with quartzat elevated T and P via
SiO2quartz
þnH2O ¼ SiO2 � nH2Omonomer
ð6Þ
for which the equilibrium constant, Kqm, is
Kqm ¼as
anH2O
ð7Þ
where as is the activity of aqueous silica monomers. Eq. (7)leads to the linear relation
log as ¼ n log aH2O þ log Kqm ð8ÞAssuming that as was equal to the molality of total dis-solved silica, ms, and that aH2O ¼ X H2O, Walther and Or-ville (1983) used quartz solubility data of their own andothers in CO2–H2O and Ar–H2O solutions to constructplots of log mSiO2
vs. log X H2O at P–T conditions up to5 kbar and 700 �C. If ms is an adequate representation ofsilica activity and if hydroxyl H2O and hydrogen-bondedH2O are considered thermodynamically equivalent, theslope of a solubility isotherm at constant pressure definesn per SiO2 unit. Walther and Orville found that n was be-tween 3 and 5 for the available solubility data.
The approach of Walther and Orville (1983) can be im-proved by a more exact formulation of H2O and silicaactivities. As described above, H2O activity in H2O–NaClsolutions is closely approximated by Eq. (2a) at 800 �C,10 kbar (Aranovich and Newton, 1996), provided soluteconcentrations are low (Xr < 0.01). Silica activity can becalculated using the approach of Newton and Manning(2003), which accounts for polymerization of aqueous

Fig. 7. Variation in SiO2 activity with aH2O at 800 �C, 10 kbar. Silicaactivity calculated from quartz solubility data (Newton and Manning,2000; Table 1) by Eq. (12) (see text). A linear fit gives R = 0.9995) with aslope of 1.88, which gives the hydration number n (Eq. (8)). Also shownare a range in integer hydration numbers, illustrating the close approachto n = 2. The result indicates that the hydrogen-bonded H2O per SiO2 unitis negligible; that is, that the monomer and dimer have forumulas,respectively, of H4SiO4 and H6Si2O7. In contrast, Walther and Orville(1983) found that solute silica in H2O–CO2 and H2O–Ar fluids atpressures to 4 kbar and temperatures to 700 �C has 1–3 hydrogen-bondedH2O per SiO2 unit.
Solubility of quartz, corundum and wollastonite at high P and T 5579
silica. At the conditions of the present study, dissolved sil-ica in pure H2O occurs primarily as two hydrous species,monomers and dimers (Zhang and Frantz, 2000; Zotovand Keppler, 2000, 2002; Newton and Manning, 2002,2003). Other species likely occur as well, but these evidentlycontribute negligibly to the total Gibbs free energy of sol-ute silica. The equilibrium governing formation of a dimermolecule (H6Si2O7) from two monomers (H4SiO4) can bewritten as
2SiO2 � nH2Omonomer
¼ Si2O4 � ð2n� 1ÞH2Odimer
þH2O ð9Þ
where n is the number of moles of H2O per mole of mono-meric silica, including both hydroxyls and solvated molec-ular H2O. If some of the bound H2O are indeed solvated(hydrogen-bonded rather than hydroxyl), the assumptionis implicit that the solvation per SiO2 molecule is the samein both monomer and dimer. Following Newton and Man-ning (2002, 2003), we adopt a standard state for aqueoussilica of unit activity of the pure hypothetical solution ofsilica monomers referenced to infinite dilution, and assumeideal mixing of monomers and dimers. This leads to expres-sion of the equilibrium constant for Eq. (9) as
Kmd ¼X daH2O
X 2m
ð10Þ
where subscripts m, d and md denote, respectively, mono-mer, dimer and monomer–dimer equilibrium, and molefractions are calculated as in Eq. (5). In this approach,the total solute silica activity, as, is equal to the mole frac-tion of monomers.
as ¼ csX s ¼ X m ð11Þwhere cs, is the activity coefficient of solute silica. Combi-nation of Eqs. (10) and (11) leads to
as ¼ð1þ 8X sKmd=aH2OÞ1=2 � 1
4Kmd=aH2O
ð12Þ
(Newton and Manning, 2002, 2003). Eq. (12) permits directassessment of the change in the activity of silica in quartz-saturated H2O–NaCl solutions with aH2O (Eq. (8)).
Fig. 7 shows that there is strong, linear correlation be-tween the logarithm of silica activity on aH2O, usingKmd = 118 (Zotov and Keppler, 2002). Linear regressionyields n = 1.88 (R = 0.9995), very close to 2. Given thatn = 2 corresponds to H4SiO4 and H6Si2O7, this result sug-gests that solvated molecular H2O is thermodynamicallynegligible at 800 �C,10 kbar, in H2O–NaCl, and that inter-action energies between molecules and ions of the bulk sol-vent (H2O, Na+, and Cl�) and the silica species are verysmall; i.e., the solution closely approaches ideality. Possiblesources of error include uncertainty in Kmd, as well as theassumption of complete dissociation of NaCl.
The utility of the observation of n � 2 is that it permitsprediction of quartz solubility in H2O–NaCl solutionswithout any additional fit parameters. Fig. 5 gives predict-ed quartz solubility derived by rearranging Eq. (12), with
(1) quartz solubility in pure H2O (Table 1), (2) Kmd = 118(Zotov and Keppler, 2002), and (3) H2O activity calculatedfrom Eq. (2). It can be seen that adopting n = 2 closelyreproduces the experimental data.
The foregoing suggests that, to a first approximation,dissolution of quartz in H2O–NaCl mixtures behaves as ifthere were ideal solution of all neutral molecules and ions,consonant with the findings of Aranovich and Newton(1996) for the system NaCl–H2O and of Newton and Man-ning (2003) for SiO2 solutions of various activities in H2Oat high temperature and pressure. It is not clear whyhydrogen bonding of H2O to silica should be inhibited inNaCl–H2O, while it is significant in CO2–H2O andAr–H2O solutions at high P and T. Apparently, the pres-ence of dissociated Na+ and Cl� ions alters the electricalenvironment of the fluid in a way that is inimical tohydrogen bonding.
4.2. Corundum
In contrast to H2O–NaCl solutions in equilibrium withquartz, the identities and number of dominant solute spe-cies coexisting with corundum and wollastonite are uncon-strained. This precludes direct application of the simplemodel described above. However, Fig. 6 nevertheless offerssome insight into the nature of the dominant species. If one

5580 R.C. Newton, C.E. Manning 70 (2006) 5571–5582
mole of corundum reacts with A moles of NaCl and B mo-les of H2O to produce k moles of solutes, then we can write
Al2O3corundum
þANaClþ BH2O ¼ k solutes ð13Þ
If corundum solubility decreased with XNaCl, as doesquartz, then Al solutes would likely be hydrous species,and there would be no interaction with Na+ and/or Cl�.Similarly, monotonic increase with XNaCl would imply nointeraction with H2O. However, Fig. 6 shows that corun-dum solubility increases to a maximum and then declines.This behavior strongly implies that Al solutes include bothhydrates and Na- and/or Cl complexes: the enhancementeffect of complex formation is eventually overtaken by pro-gressive destabilization of hydrous species as H2O activitydecreases. The solubility maximum near XNaCl � 0.15 sug-gests that the ratio of H2O to NaCl absorbed in the disso-lution reaction is about 6; that is, B:A in Eq. (13) is about6:1.
Reaction (13) with parameters A and B set at 1 and 6,respectively, may be tentatively interpreted in terms ofactual dissolution reactions. It may be supposed that anNa–Al interaction product is the neutral hydrous molecule,NaAl(OH)4 (Anderson and Burnham, 1967; Walther,2001). A model reaction which satisfies the above choiceof parameters is
2Al2O3corundum
þNaClþ 6H2O ¼NaAlðOHÞ4 þAlðOHÞ2Cl
þ 2AlðOHÞ3 ð14Þ
An equally consistent reaction in terms of ions is:
Al2O3corundum
þNaþ þ 3H2O ¼ NaAlðOHÞ4 þAlðOHÞ2þ ð15Þ
Both postulated reactions satisfy the inferred stoichiome-tric parameters and the experimental finding that H+ andOH� are not major products.
4.3. Wollastonite
Fig. 6 shows that wollastonite solubility displays abroad maximum near XNaCl � 0.33, implying that dissolu-tion consumes H2O and NaCl in the ratio 2:1. The greatsolubility enhancement of wollastonite by NaCl impliesthat a solute Ca chloride species is formed, and the very ba-sic nature of the quenched fluids requires that OH� is a ma-jor product of the dissolution reaction. A simple—thoughnonunique—dissolution reaction which satisfies the abovecriteria is:
CaSiO3wollastonite
þNaClþ 2H2O ¼ CaClþ þOH� þH3NaSiO4
ð16Þ
The neutral silicate species, originally proposed by Ander-son and Burnham (1967), is required to preserve chargebalance and accommodate the H, Na and SiO2 left overfrom the formation of CaCl+ and OH�. Formation of sig-nificant H3NaSiO4 in the wollastonite experiments but not
in the quartz experiments could result from the stronginteractions of Ca+2 and Cl�, and explain our observationthat, near halite saturation, the silica content of brinescoexisting with wollastonite is higher than those withquartz.
5. Conclusions
Interaction of crustal and upper mantle rocks with fluidsof magmatic or metamorphic origin are complex, involvingpolymerization, hydration and dehydration, ionization,acid/base relations, etc. These complexities are compound-ed by the inevitable tendency of deep-seated fluids to rise,with attendant decrease of temperature and pressure, thuswith continuous alteration of the fluids and their host rocksas they ascend. In the present limited assessment of interac-tion of saline fluids with three congruently soluble simpleminerals, we have found greatly diverse behavior, as shownin Fig. 6. Wollastonite shows strong relative solubilityenhancement with NaCl, with a concentration at halite sat-uration of about 40 times the pure H2O value, though theH2O content is only 17 wt%. The solubility relative to pureH2O shows a broad maximum at XNaCl � 0.33. Corundumshows an even more drastic initial enhancement, but reach-es a maximum at a NaCl mole fraction of about 0.15, andthen begins to decline slowly. Quartz solubility decreasesmonotonically to halite saturation.
In spite of the diverse behavior shown by Fig. 6, the sol-ubilities of quartz, corundum and wollastonite can perhapsbe understood with a simple model in which solute prod-ucts mix ideally with all ions and neutral molecules. Theseaspects include solvent interactions, the role of H2O activ-ity, hydration and ionization states of solute products, andacid/base relationships. Interpretation of the shapes of thesalinity–solubility curves, together with the pH ofquenched solutions, yields the following preliminaryconclusions:
1. Quartz dissolves to mixtures of silica monomers,H4SiO4, and dimers, H6Si2O7, their relative proportionsdepending on T, P, and XNaCl. Additional H2O of solva-tion is probably negligible at 800 �C and 10 kbar, as areNa-silicate species. Quenched experimental solutionswere pH-neutral. At upper crustal pressures of 1–2 kbar,however, Na-silicate species are likely, and H2O solva-tion is greater.
2. Corundum dissolves to a hydrous Na–aluminate complex,possibly NaAl(OH)4. Certain amounts of other Al spe-cies, probably hydroxides, must be yielded in order to bal-ance a dissolution reaction without major H+ or OH�. Itis probable that addition of SiO2 to the system H2O–NaCl–Al2O3 would yield Na–aluminosilicate complexes,as advocated by Anderson and Burnham (1983), and thuswould generate strongly acid solutions.
3. Wollastonite dissolves to a Ca chloride, probably CaCl+,with equal amounts of OH� for charge balance. TheSiO2 may be accommodated as a neutral Na-silicate

Solubility of quartz, corundum and wollastonite at high P and T 5581
complex, such as H3NaSiO4. The NaCl enhancementeffect on CaSiO3 solubility is so great at 10 kbar and800 �C that, at NaCl conditions near halite saturation,the silica concentration is more than double that ofquartz saturation in the system SiO2–NaCl–H2O.
An important project for further investigation would beto add SiO2 to the system CaSiO3–NaCl–H2O, in order todetermine whether relative amounts of the postulated spe-cies H4SiO4, H6Si2O7, CaCl+, OH�, and H3NaSiO4 arepredictable in the larger system. A similarly pertinent inves-tigation concerns addition of quartz to the Al2O3–NaCl–H2O system, in the attempt to define Na–aluminosilicatespecies and acid-base relationships. According to Andersonand Burnham (1983), Al2O3 is very soluble in quartzofelds-pathic compositions as feldspar-like vapor species.Solubility studies in the combined system CaSiO3-Al2O3–NaCl–H2O, with special reference to grossular garnet(Ca3Al2Si3O12) would be a logical continuation of thepresent study. These extended studies could provide aframework for analysis of the solubility behavior of morecomplex systems, emulating common rocks. It mighthappen that the simple solution behavior found in the pres-ent study on individual minerals could be extended toassemblages of several minerals in more tractable waysthan have been previously recognized.
Acknowledgments
This research was supported by National Science Foun-dation grant EAR-0337170 to CEM. Bruce Yardley, JohnWalther and Dimitri Sverjensky provided helpful reviewsof an earlier version of the manuscript. Walther’s detailedcomments in particular resulted in substantial changes inthe paper. We thank Jeremy Wykes and Peter Tropperfor assistance with SEM imaging.
Associate editor: Dimitri A. Sverjensky
References
Ague, J.J., 1994. Mass-transfer during Barrovian metamorphism ofpelites, south-central Connecticut. I: evidence for changes in compo-sition and volume. American Journal of Science 294, 989–1057.
Anderson, G.M., Burnham, C.W., 1967. Reaction of quartz and corun-dum with aqueous chloride and hydroxide solutions at high temper-atures and pressures. American Journal of Science 265, 12–27.
Anderson, G.M., Burnham, C.W., 1983. Feldspar solubility and thetransport of aluminum under metamorphic conditions. American
Journal of Science 283-A, 283–297.Aranovich, L.Y., Newton, R.C., 1996. H2O activity in concentrated NaCl
solutions at high pressures and temperatures measured by the brucite–periclase equilibrium. Contributions to Mineralogy and Petrology 125,200–212.
Aranovich, L.Y., Newton, R.C., 1997. H2O activity in concentrated KCland KCl–NaCl solutions at high temperatures and pressures measuredby the brucite–periclase equilibrium. Contributions to Mineralogy and
Petrology 127, 261–271.Aranovich, L.Y., Newton, R.C., 1998. Reversed determination of the
reaction: phlogopite + quartz = enstatite + potassium feldspar + H2O
in the range 750–875 �C and 2–12 kbar at low H2O activity withconcentrated KCl solutions. American Mineralogist 83, 193–204.
Aranovich, L.Y., Shmulovich, K.I., Fedkin, V.V., 1987. The H2O andCO2 regime in regional metamorphism. International Geology Review
29, 1379–1401.Bowers, T.S., Helgeson, H.C., 1983. Calculation of the geochemical
consequences of non-ideal mixing in the system H2O–CO2–NaCl ingeologic systems: equation of state of H2O–CO2–NaCl fluids at highpressures and temperatures. Geochimica et Cosmochimica Acta 47,1247–1275.
Bradley, R.S., 1962. Thermodynamic calculations on phase equilibriainvolving fused salts. Part I. General theory and application toequilibria involving calcium carbonate at high pressure. American
Journal of Science 260, 374–382.Caciagli, N.C., Manning, C.E., 2003. The solubility of calcite in water at
5–16 kbar and 500–800 �C. Contributions to Mineralogy and Petrology
146, 275–285.Cameron, E.M., Hattori, K., 1994. Highly oxidized deep metamorphic
zones: occurrence and origin. Mineralogical Magazine 58A, 142–143.Charlu, T.V., Newton, R.C., Kleppa, O.J., 1978. Enthalpy of formation of
some lime silicates by high-temperature solution calorimetry, withdiscussion of high pressure phase equilibria. Geochimica et Cosmochi-
mica Acta 42, 367–375.Crawford, M.L., Hollister, L.S., 1986. Metamorphic fluids, the evidence
from fluid inclusions. In: Walther, J.V., Wood, B.J. (Eds.), Fluid–rock
Interactions During Metamorphism. Springer, New York, pp. 1–35.Fockenberg, T., Burchard, M., Maresch, W.V., 2006. Experimental
determination of the solubility of natural wollastonite in pure waterup to pressures of 5 GPa and at temperatures of 400–800 �C.
Geochimica et Cosmochimica Acta 70, 1796–1806.Gibert, F., Guillaume, D., LaPorte, D., 1998. Importance of fluid
immiscibility in the H2O–NaCl–CO2 system and selective CO2
entrapment in granulites: experimental phase diagram at 5–7 kbar,900 �C and wetting textures. European Journal of Mineralogy 10,1109–1123.
Johnson, E.L., 1991. Experimentally determined limits for H2O–CO2–NaCl immiscibility in granulites. Geology 19, 925–928.
Kennedy, G.C., 1950. A portion of the system silica–water. Economic
Geology 45, 629–653.Lamb, W., Valley, J.W., 1984. Metamorphism of reduced granulites in
low-CO2 vapour-free environment. Nature 312, 56–58.Manning, C.E., Ingebritsen, S.E., 1999. Permeability of the continental
crust: constraints from heat flow models and metamorphic systems.
Reviews in Geophysics 37, 127–150.Newton, R.C., Manning, C.E., 2000. Quartz solubility in H2O–NaCl and
H2O–CO2 solutions at deep crust-upper mantle pressures and temper-atures: 2–15 kbar and 500–900 �C. Geochimica et Cosmochimica Acta
64, 2993–3005.Newton, R.C., Manning, C.E., 2002. Solubility of enstatite + forsterite in
H2O at deep crust/upper mantle conditions: 4 to 15 kbar and 700 to900 �C. Geochimica et Cosmochimica Acta 23, 4165–4176.
Newton, R.C., Manning, C.E., 2003. Activity coefficient and polymeriza-tion of aqueous silica at 800 �C, 12 kbar, from solubility measurementson SiO2-buffered mineral assemblages. Contributions to Mineralogy and
Petrology 146, 135–143.Newton, R.C., Manning, C.E., 2005. Solubility of anhydrite, CaSO4, in
NaCl–H2O solutions at high pressures and temperatures: applicationsto fluid–rock interaction. Journal of Petrology 46, 701–716.
Newton, R.C., Aranovich, L.Y., Hansen, E.C., Vandenheuvel, B.A., 1998.Hypersaline fluids in Precambrian deep-crustal metamorphism. Pre-
cambrian Research 91, 41–63.Novgorodov, P.G., 1977. On the solubility of quartz in H2O + CO2 and
H2O + NaCl at 700 �C and 1.5 kb pressure. Geochemistry International
14 (4), 191–193.Pabalan, R.T., Pitzer, K.S., 1990. Models for aqueous electrolyte mixtures
for systems extending from dilute solutions to fused salts. In: Melchior,D.C., Bassett, R.L. (Eds.), Chemical Modeling of Aqueous Systems II,416. American Chemical Society Series, pp. 44–57.
5582 R.C. Newton, C.E. Manning 70 (2006) 5571–5582
Philippot, P., Selverstone, J., 1991. Trace-element-rich brines in eclogiticveins: implications for fluid composition and transport duringsubduction. Contributions to Mineralogy and Petrology 106, 417–430.
Pitzer, K.S., 1980. Electrolytes. From dilute solutions to fused salts.
Journal of the American Chemical Society 102, 2902–2906.Roedder, E., 1972. The composition of fluid inclusions. U.S. Geological
Survey Professional Paper 440JJ, 1–64.Shmulovich, K.I., Graham, C.M., 2004. An experimental study of phase
equilibria in the systems H2O–CO2–CaCl2 and H2O–CO2–NaCl athigh pressures and temperatures (500–800 �C, 0.5–0.9 GPa): geologicaland geophysical applications. Contributions to Mineralogy and Petrol-
ogy 146, 450–462.Shmulovich, K., Graham, C., Yardley, B., 2001. Quartz, albite and
diopside solubilities in H2O–NaCl and H2O–CO2 fluids at0.5–0.9 GPa. Contributions to Mineralogy and Petrology 141, 95–108.
Shmulovich, K.I., Yardley, B.W.D., Graham, C.M., 2006. Solubility ofquartz in crustal fluids: experiments and general equations for saltsolutions and H2O–CO2 mixtures at 400–800 �C and 0.1–0.9 GPa.
Geofluids 6, 154–167.Smit, C.A., Van Reenen, D.D., 1997. Deep crustal shear zones, high-grade
tectonites, and associated metasomatic alteration in the Limpopo Belt,South Africa. Journal of Geology 105, 37–58.
Touret, J.L.R., 1971. Le facies granulite en Norwege Meridionale. Lithos
4, 239–249, see also pages 423–436.Touret, J.L.R., 1985. Fluid regime in southern Norway, the record of fluid
inclusions. In: Tobi, A.C., Touret, J.L.R. (Eds.), The Deep Proterozoic
Crust in the North Atlantic Provinces. Reidel, Dordrecht, pp. 517–549.Tropper, P., Manning, C.E., 2004. Paragonite stability at 700 �C in the
presence of H2O–NaCl fluids: constraints from H2O activity and
implications for high pressure metamorphism. Contributions to Min-
eralogy and Petrology 147, 740–749.Tropper, P., Manning, C.E., 2005a. Very low solubility of rutile in
H2O at high pressure and temperature, and its implications forTi mobility in subduction zones. American Mineralogist 90, 502–505.
Tropper, P., Manning, C.E., 2005b. The solubility of corundum in H2O athigh temperature and pressure, and its consequences for Al mobility insubduction zone environments. Geophysical Research Abstracts 7,03991.
Valley, J.W., McLelland, J., Essene, E.J., Lamb, W., 1983. Metamorphicfluids in the deep crust: evidence from the Adirondacks. Nature 301,226–228.
Valley, J.W., Bohlen, S.R., Essene, E.J., Lamb, W., 1990. Metamorphismin the Adirondacks: II: the role of fluids. Journal of Petrology 31, 555–596.
Walther, J.V., 2001. Experimental determination and analysis of thesolubility of corundum in 0.1 and 0.5 m NaCl solutions between 400and 600 �C from 0.5 to 2.0 kbar. Geochimica et Cosmochimica Acta 65,2843–2851.
Walther, J.V., Orville, P.M., 1983. The extraction-quench technique fordetermination of the thermodynamic properties of solute complexes.Application to quartz solubility in fluid mixtures. American Mineral-
ogist 68, 731–741.Xie, Z., Walther, J.V., 1993. Quartz solubilities in NaCl solutions with and
without wollastonite at elevated temperatures and pressures. Geochi-
mica et Cosmochimica Acta 57, 1947–1955.Zotov, N., Keppler, H., 2002. Silica speciation in aqueous fluids at high
pressures and temperatures. Chemical Geology 184, 71–82.


![Investigation of hydrothermal synthesis of wollastonite ...jcpr.kbs-lab.co.kr/file/JCPR_vol.11_2010/JCPR11-3/14[1].348-353.pdf · Investigation of hydrothermal synthesis of wollastonite](https://static.fdocuments.us/doc/165x107/5adae79a7f8b9ae1768dce91/investigation-of-hydrothermal-synthesis-of-wollastonite-jcprkbs-labcokrfilejcprvol112010jcpr11-3141348-353pdfinvestigation.jpg)