Sol Group Annual Report 2002Directors’ report 5 Sol Group Net sales for 2002 were equal to Euro...
60
Sol Group Annual Report 2002
Transcript of Sol Group Annual Report 2002Directors’ report 5 Sol Group Net sales for 2002 were equal to Euro...

Sol Group Annual Report
2002

Index
3 Directors’ report 2002 Sol Group
15 Consolidated financial statements 2002 Sol Group
16 Consolidated balance sheet
20 Consolidated profit and loss account
22 Notes to the consolidated financial statements
54 Consolidated cash flow statement
56 Report of the independent auditors Sol Group
Sol SpaRegistered officePiazza Diaz, 120052 Monza (MI) Italy
Share CapitalEuro 47.164.000,00 fully paid up.
C.F and company register of Milann° 04127270157R.E.A. n° 991655C.C.I.A.A. Milan

1Relazione sulla gestione
Sol Spa
Board of Directors Chairman and Managing Director
Aldo Fumagalli Romario
Vice Chairman and Managing Director
Marco Annoni
Director with special duties
Ugo Marco Fumagalli Romario
Director with special duties
Giovanni Annoni
Directors
Maria Cristina Annoni
Stefano Bruscagli
Alberto Maria Savini
Alberto Enrico Tronconi
General manager
Giulio Bottes
Board of Statutory Auditors Chairman
Enrico Aliboni
Statutory Auditors
Alessandro Danovi
Gianfranco Graziadei
Alternate Auditors
Vincenzo Maria Marzuillo
Vittorio Terrenghi
External Auditing Company Deloitte & Touche S.p.a.
Palazzo Carducci
Via Olona, 2
20123 Milan
Italy
Powers of attorney assigned to the Directors(CONSOB Communication No. 97001574
dated 20 February 1997)
To the Chairman and to the Vice Chairman:
legal representation towards third parties and
before the Court of Law, ordinary administration
powers, in separate form from each other;
extraordinary administration powers, jointly
with each other, excepting for a number of
specific acts of particular significance reserved
to the jurisdiction of the Board.
To the Directors with special duties: ordinary
administration powers as regards
Administration and Finance (Ugo Marco
Fumagalli Romario) and as regards the
Organisation of Information Technology Systems
(Giovanni Annoni) with single signature.
Sol Spa

2
AIRSOL B.V.Amsterdam (NL)
TMG GmbHKrefeld (D)
Vivisol H. GmbH Wien (A)
Vivisol France Sarl Vaux le Penil (F)
FRANCE OXYGENE SarlAnnoeullin (F)
Vivisol Deutschland GmbH Mauern (D)
Vivisol S.r.l.Monza (I)
Vivisol Brescia S.r.l.Brescia (I)
Vivisol Umbria S.r.l.Perugia (I)
Vivisol Napoli S.r.l.Marcianise (I)
Vivisol Silarus S.r.l.Battipaglia (I)
BEHRINGER S.r.l.Genoa (I)
Zeus S.A. Piraeus (GR)
HGT S.A. Thessaloniki (GR)
Ionia Oxigono e.p.e.Thessaloniki (GR) *
CryoMed S.r.l. Milan (I)
Cryo-Cell Italia S.r.l. Milan (I)
C.T.S. S.p.A.Monza (I)
N.T.G. B.V.Tilburg (NL)
B.T.G. BVBALessines (B)
SOL France SasCergy Pontoise (F)
SOL T. G. GmbHWiener Neustadt (A)
G.T.E. S.L.Barcelona (E)
GTS Sh.p.k.Tirana (AL)
TGB e.o.o.d.Sofia (BG)
TGS A.D. (2)
Skopje (MK)
TGK Sofia A.D.Sofia (BG)
MEDICAL SYSTEM S.r.l. Pavia (I) *
IMG d.o.o.Belgrade (Yu)
Vivisol B Sprl Lessines (B)
I.C.O.A. S.r.l.Vibo Valentia (I)
Vivisol Calabria S.r.l.Vibo Valentia (I)
Vivisol d. Stretto S.r.l. Villa S.Giovanni (I)
Consorgas S.r.l.Milan (I)*
T.G.T. A.D.Trn (BiH)
TGP A.D.Petrovo (BiH)
SOL-INA d.o.o.(3)
Sisak (HR)
UTP d.o.o.Pula (HR)
Kisikana d.o.oSisak (HR)
Energetika Z.J.d.o.o.Jesenice (SLO)
SPG - SOL
Plin Gorenjska d.o.o.(4)
Jesenice (SLO)
T.P.J. d.o.o.Jesenice (SLO)
SOL WELDING S.r.l.Costabissara (I)
Esseti Deutschland GmbHHeilbronn (D)
S.A.T. Commerciale S.r.l.Carrè (I) *
SALDO SERVIS S.r.l.Trento (I) *
Eurobot Welding S.r.l.Carrè (I)
SOL Spa(1)
100%
100%
100%
100%
100%
100%
51%
89.4%
90%
50.10%
70%
70%
70%
100%
100%
100%
100%
100%
100%
100%
100%
88.60%
51%
30%
0.08%
97.60%
98%
100%
80%
40%
100%
60%
25.79%
30%
47.61%
52.79%
80%
49.45%
64.11%
51%
10%
10%
10%
70%
99.92%
30%
70%
34%
51%
95.61%
70%
45,15%
35,89%
* Company not included in the consolidation basis. (1)
SOL has established the following foreign branches: Vaux le Penil (F), Lugano (CH), Feluy- Seneffe (B), Oisterwijk (NL).(2)
The share pertaining to minority interests includes a 7.75% equity investment in SIMEST S.p.A. Under agreements stipulated between SOL andSIMEST on 27 March 1996 and 2 August 2001, SOL S.p.A. is under obligation to repurchase the entire SIMEST share by 30 June 2003 (4.10%)and 30 June 2004 (remaining 3.45%)
(3)The share pertaining to minority interests includes a 10% equity investment in SIMEST S.p.A. Under agreements stipulated between SOL andSIMEST on 17 May 1999, SOL S.p.A. is under obligation to repurchase the entire SIMEST share by 30 June 2004.
(4)The share pertaining to minority interests includes a 5.4% equity investment in SIMEST S.p.A. Under agreements stipulated between SOL andSIMEST on 23.12.02, SOL S.p.A. is under obligation to repurchase the entire SIMEST share by 30 June 2007.
(5)B.T.G. has established a foreign branch at Dainville (France).
100%

Directors’ report Sol Group
2002

4 Directors’ report
Sol Group
To the Shareholders,
The SOL Group is engaged in production, applied research and distribution activities pertaining to
industrial, pure and medicinal gases, in home care, as well as in the sector for related medical equip-
ment in Italy, presently active in seven other Western European countries and in eight Central-East-
ern European countries.The products and services of companies belonging to the Group are used
in the chemical, electronic, iron and steel, engineering and foodstuff industries, as well as in sectors
such as environment protection, research and health.
The year 2002 was marked by uncertainty, with a general negative climate of confidence that pe-
nalised the consumption of durable goods while also slowing down consumable goods purchases.
In 2002, the international economy witnessed a number of notable events, including financial scan-
dals and a continuous reduction in share lists, high inflation, the risk of war against Iraq and a rise
in the price of oil, which together progressively accented the climate of uncertainty.
All of this led to a slowdown in spending and industrial activities.
The risk of war caused the price of oil to rise, with a bullish trend, which in the event of a long,
drawn-out war could push it up to extremely high levels.
At the same time, the expansionary economic policies of the USA could constitute a springboard
for Europe and Japan (where domestic demand is still stagnant). However, the potential macroeco-
nomic benefit will be reduced by the depreciation undergone by the US dollar against the euro,
which in Europe will cause the trade balance to worsen and also lead to a possible downturn in in-
vestment activities, following a falloff in the competitiveness of European companies in foreign mar-
kets. On the other hand, the positive impact on imported inflation could enable real disposal in-
come to grow at a higher rate.
The strengthening of the euro against the US dollar should also influence not only economic
growth but also consumer price trends in the Eurozone and help to bring the average annual rate
of inflation back to around 2%, even if the crucial factors for inflation will (among other things) be
movements in the price of oil and adjustments to taxes and tariffs.
Forecasts for the year 2003 generally point to a weak European economy only undergoing slight
improvement, with spending still on hold and investments recovering during the second half of the
year, boosted by a lesser degree of uncertainty and favourable interest rates.
The Italian economy experienced a similar trend, even though final demand made moderate re-
covery during the second half of the year, mainly spurred on by incentives introduced to encour-
age investments (Law “Tremonti II”) and consumption (environment-friendly incentives for car
purchases). Industrial production was down 2.1% on 2001, while GDP increased by 0.4%.
The end of the effects of the Law “Tremonti II” and the negative impact that the strengthening of the
euro has had on exports could invalidate economic recovery in 2003, as could the indicator for con-
sumer confidence, which dropped to extremely low levels. It is therefore believed that private con-
sumption trends will only be able to make a comeback in the second half of 2003, as will investments.
Given this scenario, the results achieved by the SOL Group may be considered more than satisfactory.

5Directors’ report
Sol Group
Net sales for 2002 were equal to Euro 267.2 million, representing growth of 13.3 % on 2001 (Eu-
ro 235.7 million).
The net operating margin amounted to Euro 28.4 million (equal to 10.6% of sales), up by 20.9%
on the Euro 23.5 million registered in 2001.
Net profit attributable to the Group amounted to Euro 15.5 million (equal to 5.8% of sales), up
18.8% on the Euro 13.1 million registered in 2001.
Cash flow amounted to Euro 49.3 million (equal to 18.5% of sales), representing growth of 15.7%
on 2001 (Euro 42.6 million).
Investments computed in the year 2002 totalled Euro 48 billion (equal to 18% of sales): substantially
the same level as that seen in 2001.
The average number of staff employed by the Group totalled 1,224 (1,135 in 2001).
The Group’s net financial indebtedness was equal to Euro 69.3 million (Euro 42.9 million at the
end of 2001).
PerformanceCompared with the previous year, the technical gases sector grew at a moderate pace, thanks in
part to the services market. Of the various target markets, the iron and steel sector bore the brunt
of the crisis afflicting the auto industry, while the shipbuilding sector showed signs of recovery.Also
in decline were sales to the electronic sector, which is still struggling.
Sales to the environmental and food sectors picked up, as did sales of pure gases and special gases.
Medicinal gas sales were in line, with average growth.
The Group’s home care business enjoyed considerable growth in 2002 as well, both in Italy and
foreign countries, as the positive trends witnessed over the last few years continued to prevail.
On the cost front, the year 2002 again saw the cost of electricity (the main raw material) under-
go a notable rise of more than 20%, thereby having an increasing impact on production costs.
These increased costs cannot always be immediately recovered by passing them on to selling prices,
meaning that some of them triggered a decrease in margins.
The year 2002 was also witness to a hefty lengthening of the time taken by the public sector to
pay its debts, which led to a similar increase in working capital supported by the Group, which –
together with the considerable amount of investments made – led to a rise in net indebtedness,
which has however remained at physiological levels.
During the course of the year 2002, technical gas reserves remained within the safety levels pre-
scribed while sites continued to operate properly.
Production plants in Italy also continued to operate normally.
The Feluy site in Belgium operated on a continual basis, keeping its production levels at the lev-
els already attained in 2001.
The new air separation and liquefaction plant in Mantua was brought on-stream during the sec-
ond half of 2002.This plant, realised within the petrochemicals business Polimeri Europa, is one

6 Directors’ report
Sol Group
of the most modern and technologically advanced around, producing both cryogenic liquid gas for
the market and the gaseous products needed for the Polimeri Europa factory to which they are
supplied by way of a gas pipeline.
August 2002 saw a new carbon-dioxide production plant come on-stream at Bitola (Macedonia).
Products supplied via gas pipelines to glassworks and steelworks benefited from the upturn enjoyed
by consumption during the second half of the year.
The SOL Group continued with its expansion activities during 2002 through new initiatives
undertaken both in Italy and abroad (Slovenia and Bosnia).
The SOL Group’s work force increased during 2002, also further to the new initiatives, and the
staff training and qualifying programmes continued in order to maintain and improve profession-
al skills, to ensure the staff are capable of achieving the Group’s growth objectives.
Environment, quality and safetyThe commitment to maintain and enhance third party certifications as regards quality, safety and
environment continued during 2002. Specifically, the production of a new manual marked the
switchover to Vision 2000 for the Group quality system, which - integrated with the issues regard-
ing safety and the environment - constitutes a System for the Management of Quality, Safety and
the Environment for all Group activities.The ISO 9000 and ISO 14000 certification obtained in
previous years was all confirmed in outstanding fashion, and enhanced with the new certification
obtained by associated company ICOA S.r.l.
The prestigious European environmental registration EMAS,obtained in previous years for the San
Martino Buon Albergo plant in Verona province was renewed and presented during an important
Symposium organised on “European Quality Day”.
Other significant achievements include the extension of EN 46001 certification with the EC mark
for medical devices to anaesthetic gas production plants, which thus completed certification for
medical systems used within hospitals.
With regard to the home care business, an extension of ISO 9002 certification was obtained by the
associate company VIVISOL Deutschland, for its Krefeld site following that obtained for its Ger-
sthofen and Mauern sites (certified during 2001).
The year 2002 also saw the quality, security and environment policies of SOL Group companies re-
viewed and updated further, as part of a plan for greater integration, in strict conformity to new
European legislation for the correct management of industrial risks. Furthermore, SOL S.p.A. con-
tinued to take part in the Responsible Care programme,with the participation of all sites with prod-
ucts being initially transformed in preparation of Environmental Report issued by Federchimica.
Safety indicators continued to be constantly monitored for both internal production activities and
transportation activities, on a domestic and European scale.The most significant indicators for risk
frequency and seriousness continue to remain under control.
To end this section, we should mention the special significance that renewed participation in Fed-

7Directors’ report
Sol Group
erchimica’s annual initiative known as “Open Factories”,organised by SOL in conjunction with the
Gonzaga exhibition “La Celeste Galeria” (The Blue Gallery”) and dedicated to Mantua’s high-
school community.
The success of this initiative is reflected by the fact that more than 1,000 students and teachers vis-
ited the exhibition about the Gonzagas first, before going on to visit the new Mantua factory.
SOL Group investments During the year under review, investments in the technical gases sector amounted to Euro 40.5 mil-
lion, with Euro 23.8 million of this being invested by the Parent Company SOL S.p.A. and Euro
7.5 million being invested in the home care sector.These investments are broken down below:
• Work to construct a new air separation and liquefaction plant for the production of high-purity
liquefied oxygen, nitrogen and argon and the supply of gaseous nitrogen and compressed air via
gas pipelines to the Polimeri Europa petrochemical business (formerly EniChem) was completed
at the Mantua factory.The site covers an area of more than 33,000 square metres.The factory was
brought on-stream in July 2002,while supplies via the gas pipeline commenced in September 2002.
• The Piombino factory saw the completion of a new storage facility for liquid nitrogen that will
provide added flexibility in the operating of liquefaction plants as well as enable a product reserve
to be established for nitrogen supplies via the pipeline that provides nearby steelworks.
• In September 2002, at Radici Chimica (within the Novara factory) a new facility for the produc-
tion of liquid carbon dioxide was realised further to the reclamation of a hydrogen production plant
owned by Radici Chimica.
• The Cremona factory saw the realisation of a liquid carbon dioxide storage facility along with var-
ious related infrastructures, enabling a strategic product reserve to be established to meet the peaks
in consumption of seasonal customers.
• A new line for the production of special NO- and N2-based mixes got off the ground at the Pure
Gases factory in Monza.
• A production line for the bottling of high-purity oxygen-used in laser applications was realised at
the Pavia factory.
• The Bologna factory’s plant for the filling and warehousing of base units for the distribution of liq-
uid oxygen (used in home-based therapies) underwent expansion.
• The company TGS successfully realised an LPG supply facility for vehicles in Skopje (Macedonia)
while in Bitola it completed a new liquid carbon dioxide production plant.This plant came on-
stream during August 2002.
• At Thessaloniki in Greece, the company HGT realised a new secondary bottling production plant
for compressed gases.
• At Pula in Croatia, the company UTP embarked upon work to build a new secondary bottling pro-
duction plant for compressed gases.Work is expected to be completed during the year 2003.

8 Directors’ report
Sol Group
• Several on-site industrial and medical facilities were also realised and brought on-stream during
the year.
• Means for the transport, distribution and sale of products were all upgraded by purchasing tanks
and gas cylinder trucks, cryogenic liquid delivery tanks, gas cylinders, dewars and medical appa-
ratus. All such measures were taken to support and develop the significant commercial growth
achieved in all business sectors and geographical areas.
Information regarding investments in financial assets follows below.
• SOL S.p.A. raised its equity investment in Croatian company SOL-INA d.o.o. 46.56% to 52.79%.
• SOL S.p.A. acquired a 47.61% stake in the capital of Bosnian company Tehnogas Kakmuz A.D.,
which produces and sells carbon dioxide.
• VIVISOL S.r.l. beefed up its activities within the nutrition sector by acquiring a business unit from
the firm Hospital Service S.r.l.
• SOL S.p.A. acquired an 80% stake in the Slovenian company Energetika d.o.o., which is based in
Jesenice and is involved in the production of utilities, thereby strengthening its presence in Slovenia.
• AIRSOL B.V. acquired a 51% stake in the Genoa-based company Behringer S.r.l,which produces
and sells appliances used to measure and control medical gases as well as welding and cutting
equipment.
• We should also mention that in the year 2002, Bartolo Ossigeno S.r.l. was merged by incorpora-
tion into SOL S.p.A. , while VIVISOL CENTRO ADRIATICA S.r.l. was merged by incorpora-
tion into VIVISOL S.r.l.
These deals will help to improve geographical organisation in Italy as well as boost economies of cost.
Research and Development Activities
Our research activities, which have traditionally characterised, justified and supported the Group’s
development, continued during the financial period; these activities comprise mainly in applied re-
search, currently associated with the development of new production technologies in Europe, with
the promotion of new applications for technical gases and with the development of new welding
machines.
SOL S.p.A. dealings with subsidiaries, associated companies and related parties.
As regards the dealings with subsidiaries and associated companies, transactions with the said com-
panies are deemed to be within the normal course of Company business,which has given rise to such
transactions in its role as Parent Company.The transactions were all intended and designed to foster
the development in a synergic framework,which makes for beneficial integration within the Group.
No transactions of an extraordinary or unusual nature in respect of the normal course of business
have been carried out. Reference should be made to the information included in the Explanatory
Notes to the Consolidated Financial Statements of SOL S.p.A. as at 31.12.02 for additional details,
including the dealings of SOL S.p.A. with Group companies and other related parties.

9Directors’ report
Sol Group
Shares of the Parent Company held by Group Companies
We confirm that as at 31.12.02 the Parent Company SOL S.p.A. held No. 1,525,000 own ordinary
shares, representing 1.68% of the share capital and carried in the Financial Statements for a value
equal to Euro 2.97 million.
These shares were purchased to execute the resolution approved by the Shareholders' Meeting held
on 28 April 2000, after which a stock option scheme was implemented reserved for employees of
the Italian companies of the Group that had subscribed to SOL S.p.A. shares at the time of the ini-
tial offer (IPO) utilising the portion reserved for them.The stock option scheme foresees the right
to purchase the same number of shares as those already subscribed, at a price of Euro 2,024 and may
be exercised until 30 April 2003.We would mention that as at 31st December 2002, 126 benefici-
aries had exercised said right, acquiring 275,000 shares.
Equity investments of Directors, Statutory Auditors and the General Manager
Full name Company Number of Number of Number of Number ofin which shares held shares shares sold shares held
participating at the close purchased at the closeinterest is held of the preceding of the financial
financial year year at 31.12.02
Aldo Fumagalli Romario SOL S.p.A. 5,000 0 0 5,000
Marco Annoni SOL S.p.A. 1,000 0 0 1,000
Ugo Fumagalli Romario SOL S.p.A. 6,000 0 0 6,000
Giovanni Annoni SOL S.p.A. 2,000 0 2,000 0
Alberto Enrico Tronconi SOL S.p.A. 2,720,000 * 0 0 2,720,000 *
Stefano Bruscagli SOL S.p.A. 6,800,000 ** 0 0 6,800,000 **
Alberto Maria Savini SOL S.p.A. 0 0 0
Maria Cristina Annoni SOL S.p.A. 40,000 **** 0 0 40,000 ****
Enrico Aliboni SOL S.p.A. 4,000 *** 0 0 4,000 ***
Giulio Bottes SOL S.p.A. 4,000 4,000 4,000 4,000
* bare ownership rights and with voting rights.** bare ownership rights.
*** held by spouse.**** 20,000 held by spouse
The remaining Directors and Statutory Auditors do not hold nor have held any equity investments
in Group Companies during 2002.
In order to gain a better understanding of the results we enclose the reclassified: Profit and Loss Ac-
count and Balance Sheet, as well as the net financial position statement and the essential data as re-
gards the industrial gases and the home care sector for the SOL Group.

10 Directors’ report
Sol Group
Reclassified profit and loss account SOL Group
Incidence on Incidence on (thousands of Euro) 31/12/2002 net sales 31/12/2001 net sales
Pipelines / on-site facilities 33,069 12,4 27,870 11,8
Merchant 171,087 64,0 155,856 66,1
Vivisol 63,004 23,6 52,004 22,1
NET SALES 267,160 100,0 235,731 100,0
Other revenues and income 2,745 1,0 1,888 0,8
Work performed for own purposes and capitalised 5,514 2,1 4,326 1,8
REVENUES 275,419 103,1 241,945 102,6
Purchase of materials 83,206 31,1 74,434 31,6
Services rendered 76,983 28,8 69,598 29,5
Change in stock (2,454) (0,9) (3,410) (1,4)
Other costs 6,280 2,4 5,644 2,4
TOTAL COSTS FOR PURCHASES AND SERVICES 164,015 61,4 146,266 62,0
VALUE ADDED 111,404 41,7 95,679 40,6
Total cost of production 45,844 17,2 41,076 17,4
GROSS OPERATING MARGIN 65,561 24,5 54,603 23,2
Depreciation and amortisation 33,558 12,6 29,385 12,5
Other provisions 3,610 1,4 1,741 0,7
OPERATING PROFIT 28,392 10,6 23,477 10,0
Financial income 1,192 0,4 1,539 0,7
Financial charges 5,180 1,9 4,662 2,0
Total financial income and charges (3,988) (1,5) (3,122) (1,3)
PROFIT ON ORDINARY ACTIVITIES 24,404 9,1 20,355 8,6
Extraordinary income and charges 96 0,0 (78) (0,0)
PROFIT (LOSS) BEFORE INCOME TAXES 24,500 9,2 20,277 8,6
Income tax 8,766 3,3 7,093 3,0
PROFIT (LOSS) FOR THE YEAR 15,734 5,9 13,185 5,6
Profit (Loss) pertaining to minority interests 207 0,1 121 0,1
NET PROFIT (LOSS) FOR THE YEAR 15,527 5,8 13,064 5,5
11Directors’ report
Sol Group
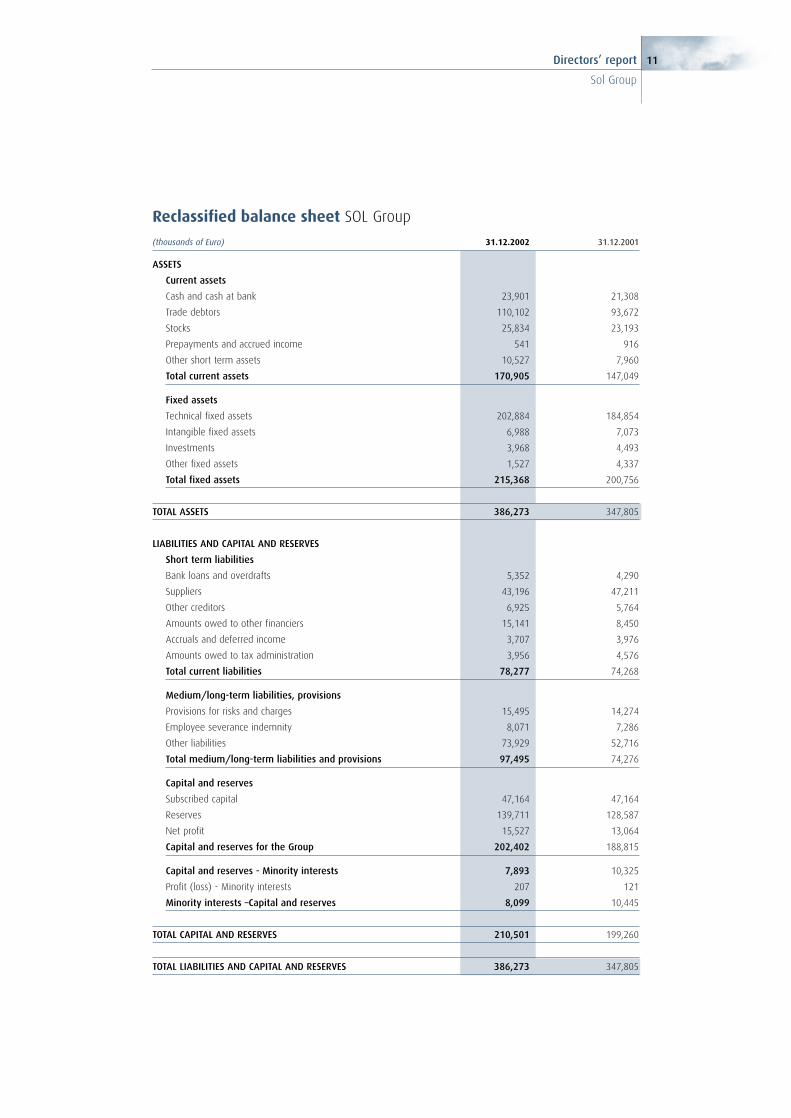
Reclassified balance sheet SOL Group
(thousands of Euro) 31.12.2002 31.12.2001
ASSETS
Current assets
Cash and cash at bank 23,901 21,308
Trade debtors 110,102 93,672
Stocks 25,834 23,193
Prepayments and accrued income 541 916
Other short term assets 10,527 7,960
Total current assets 170,905 147,049
Fixed assets
Technical fixed assets 202,884 184,854
Intangible fixed assets 6,988 7,073
Investments 3,968 4,493
Other fixed assets 1,527 4,337
Total fixed assets 215,368 200,756
TOTAL ASSETS 386,273 347,805
LIABILITIES AND CAPITAL AND RESERVES
Short term liabilities
Bank loans and overdrafts 5,352 4,290
Suppliers 43,196 47,211
Other creditors 6,925 5,764
Amounts owed to other financiers 15,141 8,450
Accruals and deferred income 3,707 3,976
Amounts owed to tax administration 3,956 4,576
Total current liabilities 78,277 74,268
Medium/long-term liabilities, provisions
Provisions for risks and charges 15,495 14,274
Employee severance indemnity 8,071 7,286
Other liabilities 73,929 52,716
Total medium/long-term liabilities and provisions 97,495 74,276
Capital and reserves
Subscribed capital 47,164 47,164
Reserves 139,711 128,587
Net profit 15,527 13,064
Capital and reserves for the Group 202,402 188,815
Capital and reserves - Minority interests 7,893 10,325
Profit (loss) - Minority interests 207 121
Minority interests –Capital and reserves 8,099 10,445
TOTAL CAPITAL AND RESERVES 210,501 199,260
TOTAL LIABILITIES AND CAPITAL AND RESERVES 386,273 347,805

12 Directors’ report
Sol Group
Net financial position SOL Group
(thousands of Euro) 31.12.2002 31.12.2001
Cash and cash at bank 23,901 21,308
Securities 340 410
Loans – short term portion (13,905) (7,518)
Leases – short term portion (1,236) (932)
Short-term amounts owed to bank (5,352) (4,290)
Short-term Liquidity, Net 3,748 8,978
Permanent investments 561 563
Loans – long-term portion (69,167) (49,630)
Long-term amounts owed to banks (31) (157)
Amounts owed to Financiers for Leasing (2,644) (1,334)
Amounts owed to Shareholders for the purchase of equity investments (1,785) (1,372)
Medium/Long-Term Net indebtedness (73,066) (51,930)
Total Net Liquidity/Indebtedness (69,318) (42,952)
Information by business sector
31.12.2002 31.12.2001Technical Home care Write- Consolidated Technical Home care Write- Consolidated
(thousands of Euro) gas sector service downs figures gas sector service downs figures
Pipelines/on-site facilities 33,069 - - 33.069 27.870 - - 27.870
Merchant 176,702 - (5.615) 171.087 160.638 - (4.781) 155.856
Vivisol - -63,202 (198) 63.004 - 52.271 (267) 52.004
Net Sales 209,771 63,202 (5.814) 267.160 188.508 52.271 (5.048) 235.731
Other revenues and income 2,832 224 (311) 2.745 1.996 171 (278) 1.888
Work performed for own
purposes and capitalised 3,190 2,325 (0) 5.514 1.616 2.648 63 4.326
Revenues 215,792 65,751 (6.124) 275.419 192.120 55.090 (5.264) 241.945
Purchase of materials 69,209 17,944 (3.946) 83.206 60.953 16.935 (3.454) 74.434
Services rendered 60,298 18,406 (1.721) 76.983 54.768 16.212 (1.381) 69.598
Change in stock (1,385) (1,069) (0) (2.454) (2.539) (871) - (3.410)
Other costs 4,901 1,836 (457) 6.280 4.498 1.576 (430) 5.644
Total costs for
purchases and services 133,023 37,117 (6.124) 164.015 117.680 33.851 (5.264) 146.266
Value added 82,770 28,635 - 111.404 74.440 21.239 - 95.679
Total cost of production 36,659 9,184 - 45.844 33.442 7.633 - 41.076
Gross operating margin 46,111 19,450 - 65.561 40.998 13.605 - 54.603
31.12.2002 31.12.2001
Total assets 357.103 90.586 (61.416) 386.273 330.890 79.008 (62.093) 347.805
Total liabilities 153.884 51.868 (29.981) 175.772 136.583 45.778 (33.817) 148.545
Investments 40.506 7.486 - 47.992 38.026 9.703 - 47.728
Depreciation
and amortisation 25.989 7.569 - 33.558 22.978 6.407 - 29.385

13Directors’ report
Sol Group
Significant events taking place after the end of financial year 2002and foreseeable business developmentsThe most significant event witnessed during the opening months of the year 2003 has been the
outbreak of war against Iraq.
As events presently stand, we are unable to say how long the conflict will last for or what the short-
term and medium-term consequences will be on the economic performance of those countries
in which the SOL Group operates.
In addition to what has already been reported, we should also mention that in February 2003, the
subsidiary company VIVISOL Deutschland GmbH acquired the home care business of the
German company Elomed GmbH, thereby expanding its presence in Germany around the Baden
Württemberg region.
We should also add that, as at 26 March 2003, the company held 1,257,000 of its own shares in
Treasury, and that 250 beneficiaries exercised the previously mentioned stock option, acquiring
543,000 shares.
To end, our aim for the year 2003 is to improve both turnover and profitability within the Group,
even though the current scenario, dominated by the war in the Middle East, does not allow us to
come up with detailed projections that are sufficiently reliable.
Monza, 27.03.2003
Chairman of the Board of Directors
(Aldo Fumagalli Romario)


Consolidated financial statements Sol Group
2002

16 Consolidated financial statements
Sol Group
Consolidated balance sheet SOL Group
ASSETS (thousands of Euro) 31.12.2002 31.12.2001
A) SUBSCRIBED CAPITAL UNPAID BY SHAREHOLDERS
called part 481 929
part not called 26,040
TOTAL 481 26,969
B) FIXED ASSETS
I - Intangible fixed assets
1) Start-up and expansion costs 684,318 1,276,694
2) Costs for research, development and advertising 298,344 118,640
3) Industrial patents and intellectual property rights 459,396 599,268
4) Concessions, licences, trademarks and similar rights 345,523 443,935
5) Goodwill 1,005,928 70,651
6) Fixed assets in course of construction and payments on account 14,263
7) Other 1,583,216 1,587,085
8) Consolidation difference 2,597,287 2,976,571
Total 6,988,275 7,072,844
II - Tangible fixed assets:
1) Land and buildings 40,018,848 32,427,183
2) Plants and machinery 81,225,444 50,937,404
3) Other fixtures and fittings, tools and equipment 74,214,091 70,502,224
4) Other assets 5,377,898 4,982,432
5) Fixed assets in course of construction and payments on account 2,047,929 26,004,267
Total 202,884,210 184,853,510
III - Financial investments:
1) Equity investments in:
a) non-consolidated Group companies
b) associated companies 370,645 375,462
c) parent companies
d) other companies 60,783 41,709
2) Debtors
a) amounts owed bynon-consolidated group companies
b) amounts owed by associated companies 144,000 180,000
c) amounts owed by parent companies
d) amounts owed by other debtors 1,241,946 4,025,615
3) Other investments 561,199 563,333
4) Own shares 2,975,235 3,512,310
Total 5,353,808 8,698,429
TOTAL FIXED ASSETS 215,226,293 200,624,783
Amounts receivable withinthe following financial year31.12.02 31.12.01
66,634 48,734
66,634 48,734

17Consolidated financial statements
Sol Group
ASSETS (thousands of Euro) 31.12.2002 31.12.2001
C) CURRENT ASSETS
I - Stocks:
1) raw materials, subsidiary materials and consumables 2,016,687 1,973,340
2) work in progress and components 800,568 639,170
3) contracts in progress 7,395,238 6,873,098
4) finished goods and goods for resale 15,621,855 13,695,807
5) advances received 12,043
Total 25,834,348 23,193,458
II - Debtors:
1) amounts owed by trade debtors 110,011,246 93,548,709
2) amounts owed by non-consolidated group companies
3) amounts owed by associated companies 90,389 123,501
4) amounts owed by parent companies
5) amounts owed by other debtors 10,327,590 7,654,162
Total 120,429,225 101,326,372
III - Financial investments which are not permanent:
1) in subsidiary companies
2) in associated companies
3) in parent companies
4) in other companies 39,029 39,686
5) own shares
6) other investments 300,805 370,213
Total 339,834 409,899
IV - Cash at bank and in hand:
1) banks and postal current accounts 23,632,166 21,089,466
2) bank cheques 3,557 5,211
3) cash and cash equivalents in hand 265,767 213,187
Total 23,901,490 21,307,864
TOTAL CURRENT ASSETS 170,504,897 146,237,593
D) PREPAYMENTS AND ACCRUED INCOME
Prepayments and accrued income 541,255 915,613
Premium on loans
TOTAL 541,255 915,613
TOTAL ASSETS 386,272,926 347,804,958
Amounts receivable withinthe following financial year31.12.02 31.12.01
61,994 229,971
141,283 130,914
203,277 360,885

18 Consolidated financial statements
Sol Group
Consolidated balance sheet SOL Group
LIABILITIES (thousands of Euro) 31.12.2002 31.12.2001
A) CAPITAL AND RESERVES:Pertaining to the Group:
I Subscribed capital 47,164,000 47,164,000II Share premium account 62,676,766 62,139,691III Revaluation reserveIV Legal reserve 2,530,970 2,012,957V Reserve for own shares 2,975,235 3,512,310VI Reserves provided for by the Articles of AssociationVII Other reserves
a) Extraordinary reserve 25,656,022 21,471,953b) Reserves not taxable until use or liquidation 4,106,867 3,799,031c) Reserve for payments to cover lossesd) Capital and reserves of aggregated companiese) Reserve for capital account grantsf) Reserve for differences arising from application of the equity methodg) Reserve for translation differences -1,972,192 -2,531,778h) Subsidiaries' undistributed profits and other reserves 37,825,003 36,549,038i) Consolidation reserve 4,808,164 1,046,659k) Other reserves 1,103,691 587,234
VIII Profits (losses) carried forwardIX Profit (loss) for the financial year 15,527,267 13,063,945
Total group capital and reserves 202,401,793 188,815,040
Minority interests:X Capital and reserves pertaining to minority interests 7,892,706 10,324,611XI Profit (loss) pertaining to minority interests 206,638 120,773
Total capital and reserves pertaining to minority interests 8,099,344 10,445,384
TOTAL CAPITAL AND RESERVES 210,501,137 199,260,424
B) PROVISIONS FOR RISKS AND CHARGES1) Provisions for pensions and similar obligations2) Provisions for taxation 14,211,994 13,360,2083) Others 1,283,329 913,7774) Consolidated provision for risks and charges
TOTAL 15,495,323 14,273,985
C) EMPLOYEE SEVERANCE INDEMNITY 8,070,990 7,285,885
D) CREDITORS1) Debenture loans2) Convertible debenture loans 3) Amounts owed to banks 5,383,057 4,447,2734) Amounts owed to other financiers 86,952,339 59,413,9685) Advances received 6) Amounts owed to suppliers 43,100,768 47,107,3137) Debts represented by bills of exchange 8) Amounts owed to non-consolidated group companies9) Amounts owed to associated companies 95,489 103,912
10) Amounts owed to parent companies11) Amounts owed to tax administration 3,955,998 4,576,12912) Amounts owed to Welfare Agencies and Social Security Institutions 1,756,784 1,594,81913) Other creditors 7,254,525 5,764,845
TOTAL 148,498,960 123,008,259
E) ACCRUALS AND DEFERRED INCOMEAccruals and deferred income 3,706,516 3,976,405Discount on loans
TOTAL 3,706,516 3,976,405
TOTAL LIABILITIES 386,272,926 347,804,958
amounts receivable after the endof the following financial year
31.12.02 31.12.01
30,942 157,306
71,811,060 50,963,792
59,551
2,086,660 1,595,226
73,928,662 52,775,875

19Consolidated financial statements
Sol Group
Consolidated balance sheet SOL Group
MEMORANDUM ACCOUNTS (thousands of Euro) 31.12.2002 31.12.2001
A) GUARANTEES GIVEN
1) to others:
a) bank guarantees 8,098,859 8,548,246
b) endorsements
c) other personal guarantees
d) real guarantees 129,862 129,862
Total 8,228,721 8,678,108
2) to associated companies:
a) bank guarantees
b) endorsements
c) other personal guarantees
d) real guarantees
Total
B) OTHER MEMORANDUM ACCOUNTS
1) Leasing rentals falling due
2) Bills and cash orders in circulation
3) raw materials and finished products held by others 412,287 322,986
4) Securities held by others
5) Assets owned by others at our premises 7,894 15,174
6) Foreign currency repurchase commitments
TOTAL 420,181 338,160
C) GUARANTEES RECEIVED
a) bank guarantees 46,799 46,799
b) endorsements
c) other personal guarantees
d) real guarantees
TOTAL 46,799 46,799
TOTAL MEMORANDUM ACCOUNTS 8,695,701 9,063,067

20 Consolidated financial statements
Sol Group
Consolidated profit and loss account SOL Group (thousands of Euro) 31.12.2002 31.12.2001
A) (+) VALUE OF PRODUCTION
1) Net turnover from sales and services 267,159,880 235,730,982
2) Variation in stocks of finished,
semi-processed goods and work in progress 668,433 643,323
3) Variation in contracts in progress 522,140 2,086,351
4) Work performed for own purposes and capitalised 5,514,311 4,326,490
5) Other revenues and income:
- Other revenues and income 2,163,110 1,127,759
- Grants pertaining to the financial period 582,199 759.997
TOTAL 276,610,073 244,674,902
B) (-) COSTS OF PRODUCTION
6) for raw materials, subsidiary materials, consumables and goods -83,206,102 -74,434,153
7) for services -76,983,029 -69,598,193
8) for use of assets owned by others -3,803,224 -3,909,813
9) for staff costs
a) wages and salaries -33,150,264 -29,873,104
b) Social Security costs -11,391,816 -9,953,843
c) provision for employee severance indemnity -1,301,531 -1,248,912
d) pension costs and similar obligations
e) other costs
10) amortisation and write-downs:
a) amortisation of intangible fixed assets -3,690,330 -3,451,351
b) depreciation of tangible fixed assets -29,867,781 -25,933,218
c) other reductions in value of fixed assets -4,053 -6,050
d) allowance for doubtful debtors included in current
assets and other accounts included in cash at bank and in hand -3,163,054 -2,090,664
11) movement in stocks of raw materials,
subsidiary materials, consumables and goods 1,263,206 680,120
12) amounts provided for risk provisions -239,354 -53,996
13) other provisions -203,790 -340,565
14) other operating charges -2,476,679 -1,733,948
TOTAL -248,217,801 -221,947,690
(A - B) DIFFERENCE BETWEEN VALUE AND COSTS OF PRODUCTION 28,392,272 22,727,212

21Consolidated financial statements
Sol Group
(continue) Consolidated profit and loss account SOL Group (thousands of Euro) 31.12.2002 31.12.2001
C) FINANCIAL INCOME AND CHARGES
15) (+) Income from equity investments:
in non-consolidated group companies
deriving from associated companies 8,823
from other companies 1,692 1,601
16) (+) other financial income
a) from loans forming part of fixed assets:
from others 64,121
from associated companies 9,163
from subsidiary companies
b) from permanent investments other than equity investments 20,172 33,316
c) from other investments which are not permanent 15,324 51,816
d) other income not included above
from others 1,136,799 1,388,474
from associated companies
from parent companies
17) (-) Interest payable and other financial charges:
payable to others -5,180,059 -4,661,670
payable to associated companies
payable to parent companies
TOTAL -3,988,086 -3,122,342
D) VALUE ADJUSTMENTS IN RESPECT OF INVESTMENTS
18) (+) Revaluation:
of equity investments 348 2,510
of permanent investments which are not equity investments 6,399
of non-permanent investments which are not equity investments
19) (-) write-downs:
of equity investments -222,609
of permanent investments which are not equity investments
of non-permanent investments which are not equity investments
TOTAL VALUE ADJUSTMENTS 6,747 -220,099
E) EXTRAORDINARY INCOME
20) (+) extraordinary income:
income 421,731 748,803
capital gains from disposal of fixed assets 109,832 808,394
21) (-) extraordinary charges:
charges -260,110 -500,807
capital losses from disposal of fixed assets -178,448 -20,699
taxes pertaining to previous financial periods -4,236 -143,096
TOTAL EXTRAORDINARY INCOME AND CHARGES 88,769 892,595
PROFIT OR LOSS BEFORE INCOME TAXES 24,499,702 20,277,366
22) (-) income taxes on the income of the period
current -8,507,480 -8,025,135
deferred -258,317 932,487
23) Aggregate net profit or loss 15,733,905 13,184,718
(PROFIT) LOSS FOR THE FINANCIAL YEAR ACCRUING TO OTHERS -206,638 -120,773
PROFIT (LOSS) FOR THE FINANCIAL YEAR ACCRUING TO THE GROUP 15,527,267 13,063,945
Chairman of the Board of Directors
(Aldo Fumagalli Romario)

22 Notes to the consolidated financial statements 31st december 2002
Sol Group
General criteriaThe Balance Sheet and Profit and Loss Account as at 31st December 2002 have been prepared and
presented in accordance with the provisions of Article 25 and subsequent articles of Legislative De-
cree No. 127/91; the accounting principles comply with those recommended by the Italian Secu-
rities and Investments Board (CONSOB) and prescribed by the National Boards for Accountants
and Book-keepers.The Balance Sheet and the Profit and Loss Account are integrated by the rele-
vant Explanatory Notes, which were prepared in accordance with the provisions of Article 38 of
the above-mentioned Legislative Decree.
These Explanatory Notes include a reconciliation of the Parent Company’s profit and sharehold-
ers’ equity and the consolidated profit and shareholders’ equity for the reporting period.
We have enclosed the cash flow statement to these Explanatory Notes for a better understanding
of the Financial Statements.
The reclassified Balance Sheet and Profit and Loss Account are attached to the Directors’ Report.
Accounting reference date
The Consolidated Financial Statements have been prepared and presented on the basis of the Finan-
cial Statements as at 31st December 2002 of each consolidated company duly approved by the Gen-
eral Shareholders’ Meetings and prepared in accordance with to the Group’s accounting principles.
Group composition and consolidation basis
The Consolidated Financial Statements comprise the Financial Statements as at 31st December
2002 of the Parent Company SOL SpA and of the following companies, which are, pursuant to Ar-
ticle 38, paragraph 2 of Legislative Decree No. 127/91:

23Notes to the consolidated financial statements 31st december 2002
Sol Group
a) which are directly or indirectly controlled subsidiaries, consolidated on a line-by-line basis:
Company Name and Registered Office Notes Share capital Ownership PercentageDirectly Indirectly Total
AIRSOL BV – Amsterdam Euro 7,724,246.84 100% 100%
BEHRINGER Srl – Genoa Euro 102,000 51% 51%
B.T.G. Bvba – Lessines Euro 3,558,000 100% 100%
Cryo-Cell Italia Srl – Milan Euro 52,653 25.55% 25.55%
CryoMed Srl –Milan Euro 10,000 50.10% 50.10%
C.T.S. S.p.A. – Monza Euro 156,000 100% 100%
ENERGETIKA Z.J. d.o.o. – Jesenice SIT 239,544,630 80% 80%
Eurobot Welding Srl – Carrè Euro 93,000 30.60% 30.60%
ESSETI DEUTSCHLAND GmbH - Heilbronn Euro 25,000 51% 51%
FRANCE OXYGENE Sarl – Annoeullin Euro 208,000 100% 100%
G.T.E. S.L. – Barcelona Euro 12,020.24 100% 100%
G.T.S. Sh.P.K. – Tirana LEK 5,000,000 100% 100%
HGT S.A. – Thesalonniki Euro 469,600 90% 90%
I.C.O.A. Srl – Vibo Valentia Euro 45,760 97.60% 97.60%
IMG D.o.o. – Belgrade YUD 15,819,857 30% 70% 100%
KISIKANA d.o.o – Sisak KUNE 28,721,300 62.79% 62.79%
N.T.G. Bv – Tilburg Euro 2,268,946,46 100% 100%
SOL France Sas – Cergy Pontoise Euro 3,000,000 100% 100%
SOL T.G. GmbH – Wiener Neustadt Euro 726,728.34 100% 100%
SOL Welding Srl – Costabissara Euro 1,325,000 51% 51%
SOL-INA D.o.o. – Sisak 1 KUNE 58,766,000 62.79% 62.79%
SPG – SOL Plin Gorenjska D.o.o. – Jesenice 2 SIT 1,970,000,000 54.85% 36.12% 90.97%
T.G.B. e.o.o.d. – Sofia LEVA 3,750,000 100% 100%
T.G.K. Sofia AD – Sofia LEVA 200,000 51% 51%
T.G.P. AD – Petrovo KM 1,177,999 47.61% 47.61%
T.G.S. AD – Skopje 3 DEN 413,001,941 96.15% 96.15%
T.G.T. AD – Trn KM 670,081 30% 30%
T.M.G. GmbH – Krefeld Euro 2,045,167.52 100% 100%
T.P.J. D.o.o. – Jesenice SIT 633,485,260 64.11% 32.65% 96.76%
U.T.P. D.o.o – Pula KUNE 12,433,000 61.53% 61.53%
VIVISOL B S.p.r.l. – Lessines Euro 162,500 0.08% 99.92% 100%
VIVISOL Brescia Srl – Brescia Euro 41,600 70% 70%
VIVISOL Calabria Srl – Vibo Valentia Euro 10,400 98.32% 98.32%
VIVISOL Deutschland GmbH – Mauern Euro 2,500,000 100% 100%
VIVISOL dello Stretto Srl – Villa S. Giovanni Euro 213,200 94.00% 94.00%
VIVISOL France Sarl – Vaux Le Penil Euro 500,000 100% 100%
VIVISOL Heimbehandlungsgeräte GmbH – Wien Euro 726,728.34 100% 100%
VIVISOL Napoli Srl – Marcianise Euro 98,800 70% 70%
VIVISOL Srl – Monza Euro 2,600,000 100% 100%
VIVISOL Silarus Srl – Battipaglia Euro 18,200 49% 49%
VIVISOL Umbria Srl – Perugia Euro 67,600 70% 70%
ZEUS S.A. – Piraeus Euro 740,574 89.40% 89.40%
1) The Group’s share as at 31st December 2002 includes a 10% equity investment in Simest S.p.A.; under an agreement stipulated between SOLS.p.A. and Simest on 17 May 1999, SOL SpA. is under obligation to repurchase the entire Simest share by 30 June 2004.
2) The Group’s share as at 31st December 2002 includes a 5.4% equity investment in Simest S.p.A.; under an agreement stipulated between SOLS.p.A. and Simest on 23 December 2002, SOL SpA is under obligation to repurchase the entire Simest share by 30 June 2007.
3) The Group’s share as at 31st December 2002 includes a 7.55% equity investment in Simest S.p.A.; under agreements stipulated between SOLS.p.A. and Simest on 27 March 1996 and 2 August 2001, SOL S.p.A. is under obligation to repurchase the entire Simest share by 30 June 2003(4.1%) and 30 June 2004 (remaining 3.45%).

24 Notes to the consolidated financial statements 31st december 2002
Sol Group
b) associated companies, consolidated by adopting the equity method:
Company Name and Registered Office Subscribed capital Ownership percentage
CONSORGAS Srl - Milan Euro 500,000 25.79 %
Ionia Oxigono e.p.e. - Thessaloniki Euro 24,944.98 34.00 %
c) associated companies, valued at cost
Company Name and Registered Office Subscribed capital Ownership percentage
S.A.T. Commerciale Srl Euro 41,500 10.00 %
SALDO SERVIS Srl Euro 41,500 10.00 %
S.A.T. Commerciale Srl and SALDO SERVIS Srl have been considered to be among the associat-
ed companies since they are related by exclusive relationships of a commercial nature.
The equity investments in other companies were valued at cost, as they cannot be included among
subsidiary and associated companies.
Compared with that recorded as at 31st December 2001, the Group’s consolidation structure on 31st
December 2002 was modified as a result of the balance sheets of the companies Behringer Srl and
Energetika Z.J. d.o.o. (acquired on 5 December 2002 and 6 December 2002 respectively) and the
financial statements of T.G.P.AD being included for the first time, and the equity investments held
in T.P.J. d.o.o. and SPG-SOL d.o.o. increasing further to the acquisition of an investment in Ener-
getika. Furthermore, as a result of the share capital increase undergone by SOL-INA D.o.o. on 19
March 2002, following the waiver of option rights by certain shareholders, the investments held in
said company as well as in its subsidiaries Kisikana D.o.o. e U.T.P. D.o.o. have remained unchanged.
Please also note that during the second half of the year under review, the companies Bartolo Os-
sigeno Srl and VIVISOL Centro Adriatica Srl were also incorporated, which did not however have
any effect on the Consolidated Balance Sheet or Profit and Loss Account.
Principles of consolidation and accounting policies
Consolidation principles
The Financial Statements utilised for consolidation purposes are those as at 31st December 2002
pertaining to individual companies.These Financial Statements have been suitably reclassified and
adjusted in order to harmonise group accounting policies and standards with those of the Parent
Company, which are in accordance with the provisions of Article 2423 and following articles of the
Italian Civil Code, and with the provisions as recommended by CONSOB.
The consolidation principles used and applied are as follows:
• assets and liabilities, as well as income and expenses of consolidated companies are recorded in full;
whereas accounts receivable and payable, income and expenses, profits and losses for material
amounts deriving from transactions of a significant value, executed among companies included in
the consolidation basis, taking possible deferred taxation into due account, are eliminated;

25Notes to the consolidated financial statements 31st december 2002
Sol Group
• the book value of investments in consolidated companies is set off against the corresponding shares
of subsidiaries’ net assets; and the possible difference between purchase price and relevant net as-
sets at the book value at the date of acquisition is added to the assets or liabilities items of the con-
solidated companies; the possible residual difference, if negative, is entered in a balance sheet item
denominated consolidation reserve; if positive, it is entered in an assets item denominated differ-
ence arising on consolidation, and is amortised over a period of 5 years.The shares of net assets
and of profit belonging to third party shareholders, calculated on the basis of Financial Statements
adjusted in accordance with the Group’s accounting policies, are stated in the items “Minority in-
terests - equity” of the Balance Sheet and “Minority interests - share of profit (loss)” of the Prof-
it and Loss Account, respectively;
• taxation on undistributed profits of the consolidated companies are not accounted for, as it is pre-
sumed that profits will be distributed taking advantage of tax credits for the parent company or
be permanently reinvested within the Group.
Conversion of Financial Statements denominated in foreign currency
The items under Capital and Reserves were converted into Euro by adopting the historical ex-
change rates for the financial periods in which they were generated. Balance-sheet items are con-
verted into euros by adopting the exchange rates prevailing on 31st December 2002, whereas P&L
items are converted into euros at the average exchange rates recorded in the year 2002.The differ-
ence between the result for the financial period generated by converting at the average exchange
rates and the result emerging further to conversion at the exchange rates prevailing on 31st De-
cember 2002 and the effects on assets and liabilities arising from exchange-rate fluctuations between
the beginning of the financial period and 31st December are carried as part of capital and reserves
under the heading “Reserve for translation differences”. In the case of those companies that have
adopted the euro as the reporting currency, the “Reserve for translation differences”has been trans-
ferred to the item “Undistributed earnings of subsidiaries and other reserves”.
The rates of exchange utilised to convert the Financial Statements not expressed in Euro are de-
tailed in the table below:
Currency Rate of Average Rate of Average exchange on exchange rate exchange on exchange rate 31.12.2002 for 2002 31.12.2001 for 2001
Albanian Lek Euro 0.00717 Euro 0.00759 Euro 0.00838 Euro 0.00782
Macedonian Dinar Euro 0.01627 Euro 0.01655 Euro 0.01660 Euro 0.01716
Bulgarian Lev Euro 0.51161 Euro 0.51303 Euro 0.51379 Euro 0.51330
Croatian Kuna Euro 0.13419 Euro 0.13522 Euro 0.13645 Euro 0.13412
Serbian Dinar Euro 0.01608 Euro 0.01654 Euro 0.01706 Euro 0.01805
Slovenian Taller Euro 0.00434 Euro 0.00443 Euro 0.00456 Euro 0.00459
Convertible Mark Euro 0.51129 Euro 0.51129 Euro 0.51129 Euro 0.51129

26 Notes to the consolidated financial statements 31st december 2002
Sol Group
Valuation criteria
The accounting policies and valuation criteria applied by all consolidated companies are substan-
tially the same.The valuation criteria adopted in the consolidated economic and equity position
were those utilised by the Parent Company SOL SpA and are in accordance with the applicable leg-
islative provisions as mentioned above, supplemented and construed by the Accounting Principles
set out by the Italian Accounting Profession.The valuation of the items carried in the consolidated
economic and equity position have been based on the general accounting principles of prudence
and accrual, and on the basis of a going concern.For the purposes of accounting, emphasis has been
laid on the economic substance of transactions rather than to their legal form; as regards financial
assets they were accounted for on the day of settlement. Income is recognised only if realised with-
in the closing date of the Financial Statements, whereas risks and losses are taken into account even
if acknowledged at a later date. Heterogeneous entries included in the single items of the Financial
Statements have been valued separately.Balance-sheet items that have a useful economic life of more
than one year have been stated among fixed assets.
Write-downs and write-ups
The value of tangible and intangible fixed assets the useful economic life of which is limited in time
is systematically depreciated or amortised.The said assets along with other asset items are written
down whenever a permanent decrease in value is recognised; the prior value is reinstated as long as
the reasons for the preceding write-down are deemed no longer to apply.The detailed methods
adopted for depreciation, amortisation and write-downs are illustrated below.
Revaluations
No revaluation has ever been made except for those provided for by specific laws regarding tangi-
ble assets and those arising from mergers.
Exceptions
There are no departures from the valuation criteria provided for by the legislation in force con-
cerning the preparation of Financial Statements and consolidated Financial Statements in these and
prior Financial Statements.
Entries recorded solely for fiscal purposes
The economic and equity positions for the Parent Company and for a number of subsidiary com-
panies as at 31.12.02 include entries made exclusively to comply with taxation regulations, in par-
ticular accelerated depreciation exceeding the amounts necessary to distribute the cost of the fixed
assets over the estimated useful working life thereof and assets with a unit value of less than Euro
516 were charged directly to the Profit and Loss Account.
Such entries are eliminated in the consolidated economic and equity position.

27Notes to the consolidated financial statements 31st december 2002
Sol Group
Valuation criteria of single itemsIntangible fixed assets
Intangible assets represent costs and expenditures having a useful economic life of more than one
year and are stated at purchase price increased by the expenses incidental thereto and are amortised
on a straight-line basis. In this regard we point out that:
• Start-up and capital increase costs are stated in the specific asset item, and amortised over their
useful economic life, however for a period not exceeding five years.
• Research, development and advertising costs are totally charged to the Profit and Loss Account
for the year in which they were incurred.An exception is represented by costs related to the de-
velopment of new products, provided they are associated with projects in the company’s interests
offering reasonable profitability prospects.
• Industrial patents and rights to use intellectual property are amortised over their estimated useful
economic life, however for a period not exceeding that set out in the relevant license agreements.
• Concessions, licenses, trade marks and similar rights stated among assets are amortised on the ba-
sis of the estimated period of utilisation, in any case not exceeding that set out in the relevant pur-
chase agreements; if the period of utilisation cannot be determined, it is established over five years.
• Goodwill is only carried as part of assets where actually paid for, and for no more than the cost
incurred in this regard or following a merger, and is amortised over a period not exceeding its
useful life, which is determined as ten years maximum.
• Differences arising from consolidation are amortised over a period of five years.
• Improvements to third party assets are amortised on the basis of the contract’s residual life.
Assets, whose economic value appears to be permanently lower than their cost amortised in accor-
dance with the criteria mentioned above, at the close of the financial year, are adjusted to their ac-
tual economic value. If the reasons that determined the said write-down subsequently appear no
longer to apply, the appropriate write-up is then calculated.
Tangible fixed assets
Tangible assets are stated at purchase price or cost of construction, increased by the expenses inci-
dental thereto.The cost value is only increased in compliance with specific national legal provisions
which allow fixed assets to be revalued following merger deals or assignment of the possible differ-
ence between the value paid to acquire the equity investment and the accruing capital and reserves.
Depreciation is systematically calculated on the cost of assets, increased by any possible revaluation,
dependent upon the residual period of their use.Tangible assets, the economic value of which ap-
pears to be permanently lower than their cost depreciated in accordance with the criteria mentioned
above, at the close of the financial year, are adjusted to their actual economic value.
Costs of ordinary maintenance are charged to the Profit and Loss Account in full.Maintenance costs

28 Notes to the consolidated financial statements 31st december 2002
Sol Group
including a capital increase element are added to the asset to which they refer and depreciated ac-
cording to the residual period of utilisation of the relevant asset.
The annualised depreciation rates generally adopted are as follows:
Land and buildings
- land -
- residential buildings -
- industrial buildings 4%
- light buildings 10%
Plants and machinery
- plants and machinery - general 7.5%
- plants and machinery - specific 10%
Fixtures and fittings, tools and equipment
- other small equipment 25%
- cylinders 9%
- distribution plants 9%
- treatment plants 15%
- base units 17,5%
- remote-measurements 20%
Other assets
- motor vehicles 20%
- motor cars 25%
- furniture and furnishings 12%
- electronic office machines 20%
The depreciation rate of an asset is reduced by 50% in the financial year in which it is purchased,
since we deem this is a method that reasonably approximates the temporal distribution of purchased
assets during the financial year.
Assets that are the subject of finance lease contracts are stated among industrial fixed assets in con-
formity with their class and are systematically depreciated, just as the proprietary assets, according
to their residual useful life.A balancing entry is made against the relevant short and medium term
obligation in respect of the lessor; rentals are transferred from the costs for use of assets owned by
others and the interest share concerning the reporting year is charged to financial expense. In this
way finance lease transactions are reported in accordance with the so-called “financial method” set
out by the International Accounting Standard I.A.S. 17 that represents the economic substance of
the outstanding finance lease contracts more correctly.

29Notes to the consolidated financial statements 31st december 2002
Sol Group
Financial investments
Shares in non-consolidated companies
Fixed investments comprising equity investments in non-consolidated companies are valued at
cost, written down to account for long-term losses in value.
Equity investments in associated companies
Shares in associated companies are valued according to the equity accounting method, i.e. for an
amount equal to the net assets’ share resulting from the last Balance Sheet of the said companies, af-
ter deducting dividends and making the adjustments required by the accounting principles regard-
ing the preparation of consolidated Financial Statements.
Other financial investments held as fixed assets
Other equity investments and securities are valued at cost. Proper adjustments are made in the case
of a permanent decrease in value, also arising from market quotations as far as listed securities are
concerned, and the prior value is reinstated, in the financial year in which there is no further rea-
son for such a write-down.
Other financial investments representing loans are reported at their estimated realisation value.
Own shares
Own Shares have been valued at cost based on the LIFO method, possibly adjusted to reflect long-
term losses in value.
Stocks
Stocks held in the warehouse are entered at the lower value between the purchase or cost of pro-
duction, including accessory changes and the presumed realisation value inferable on the basis of
the market trend.The cost structure generally adopted is denominated as the LIFO method with
annual steps (last-in, first-out).The net realisation value is calculated on the basis of the net sale price
less both possible costs of production to be further incurred and direct sales costs.
Work in progress on contracts is reported on the basis of the accumulated costs incurred at the end
of the financial year.
Stocks regarding obsolete or slow-moving items are written down to take account of actual possi-
bilities of utilisation and realisation.
Debtors
Debtors are stated at their estimated realisation value, taking into account the degree of solvency of
each debtor, maturity, outstanding doubtful accounts and enforceable guarantees.
Adjustment of the nominal value of amounts receivable to that of their estimated realisation is made
through specific provisions for doubtful accounts,directly deducted from the corresponding asset item.
Long-term debtors are stated in the Balance Sheet among financial fixed assets and reported at their
estimated realisation value.

30 Notes to the consolidated financial statements 31st december 2002
Sol Group
Financial investments which are not permanent
Securities not held as fixed assets are reported at the lower value between the purchase price or es-
timated realisation value as per market quotations.The said lower value is not maintained if the rea-
sons thereof no longer apply.
Cash and cash at bank
Liquid assets are stated at their nominal value.
Prepayments and accrued income
These items include the reporting year’s share of assets and liabilities affecting two or more finan-
cial years, whose amount is dependent upon time.
Provisions for risks and charges
Provisions for risks and charges are made to cover specific losses or amounts payable, certain or like-
ly to be incurred, but for which the amount or the date on which they will arise is uncertain at the
closing date for the financial year.
The risks for which there is only a possibility of a liability occurring are shown in the Explanato-
ry Notes or in the Directors’ Report enclosed to this statement.
Provisions for risks and charges include the item provisions for deferred taxation.
Employee severance indemnity
The employee severance indemnity represents the whole accumulated liability to employees, net of
advances paid up to the Balance Sheet date, calculated in accordance with legislation, the collective
labour agreements and possible company employment agreements in force.
Creditors
Creditors are reported at their nominal value, adjusted for returns or invoicing modifications.
Contingent liabilities, commitments and guarantees
The guarantees included in the memorandum items represent guarantees stated at the value corre-
sponding to the amount still due as regards loans in respect of which such guarantees were issued.
Real guarantees on proprietary assets are detailed in the Explanatory Notes.
Possible commitments undertaken to purchase and sell foreign currencies are reported in the mem-
orandum accounts at their notional amount, converted at the contractual rate of exchange in the
case of options and at the forward rate of exchange as regards forward foreign exchange contracts.

31Notes to the consolidated financial statements 31st december 2002
Sol Group
Conversion criteria for items denominated in currencies other than those adhering to the Euro
Assets and liabilities denominated in currencies other than those adhering to the Euro are stated at
the rates of exchange current on the day they were accounted.Adjustments to take account of pos-
sible losses arising on the valuation of assets and liabilities in foreign currencies at the rate of ex-
change ruling on the Balance Sheet date are charged to a specific risk fund and entered in the Prof-
it and Loss Account.
Recording of revenues and income, costs and charges
Revenues and income, costs and charges are entered net of returns, discounts, allowances and pre-
miums, as well as taxes directly associated with the sale of goods and the services rendered. Rev-
enues from the sale of goods are recorded when the right of ownership on the relevant goods is
transferred, which normally occurs at the time they are delivered or shipped. Financial revenues are
recorded on an accrual basis.
Income tax
Income tax is determined on the basis of the taxable income of each consolidated company pur-
suant to the tax provisions in force in each country.Amounts owed to tax authorities are reported
net of advances paid and tax withheld in the item “taxation”.Fiscal benefits deriving from fiscal loss-
es are recorded in the Profit and Loss Account of the year in which such losses are used to offset
profits.
Provisions for deferred and pre-paid taxes have been provided for on significant differences of a tem-
porary nature between the value of a given asset or liability based on statutory criteria and the val-
ue assigned to that given asset or liability for tax reporting purposes, by adopting the presume tax
rate in force at the time the temporary differences will be reversed.
Grants on capital account
Capital contributions received from the 1998 financial year, entered in the profit and loss account
as “other operating income”, are recorded over more financial years in accordance with the accru-
al accounting method. Contributions received in previous financial years have been charged to an
equity reserve at 50%; the remaining 50% has been recorded in the Profit and Loss Account over 5
or 10 years according to the time of their disbursement.

32 Notes to the consolidated financial statements 31st december 2002
Sol Group
ASSETSA) Capital payments due from shareholders
Balance as at 31.12.2002 481
Balance as at 31.12.2001 26,969
Movement (26,488)
Description 31.12.2002 31.12.2001 Movement
Called part 481 929 (448)
Part not called - 26,040 (26,040)
Totale 481 26,969 (26.,488)
B) Fixed Assets
I - Intangible fixed assets
Balance as at 31.12.2002 6,988,275
Balance as at 31.12.2001 7,072,844
Movement (84,569)
Analysis of intangible assets
Movements in intangible fixed assets were as follows:
Items Balance Increases Revaluation Other (Amor- Balance31.12.2001 (Write-downs) movements tisation) 31.12.2002
Start-up and expansion costs 1,276,694 686,743 - 18,607 (1.297,726) 684,318
Costs of research, development and advertising 118,640 316,633 - 4,435 (141,364) 298,344
Industrial patents and rights to use intellectual property 599,268 235,280 (253) 5,994 (380,893) 459,396
Concessions, licenses, trade marks and similar rights 443,935 127,965 - 2,585 (228,962) 345,523
Goodwill 70,651 609,000 - 399,288 (73,011) 1,005,928
Assets in course of construction and advances - 14,263 - - - 14,263
Other 1,587,085 408,947 - 11,474 (424,290) 1,583,216
Consolidation difference 2,976,571 764,800 - - (1,144,084) 2,597,287
Total 7,072,844 3,163,631 (253) 442,383 (3,690,330) 6,988,275
The item “Start-up and expansion costs” is for the most part made up of costs incurred in transac-
tions involving changes in the share capital of consolidated companies and expenses pertaining to
the start-up of a number of sites within the Parent Company.
The item “Research,development and advertising costs” refers mainly to costs incurred to enter Eu-
ropean markets.The increase recorded was due to investments made in research for new products
by the subsidiary company SOL Welding Srl (Euro 310,333) and the subsidiary company Eurobot
Welding Srl (Euro 6,300).
The item “Rights, industrial patents” refers almost exclusively to costs incurred for the acquisition
of software.The increases for the period are mainly due to charges relating to implementation of

33Notes to the consolidated financial statements 31st december 2002
Sol Group
the new software, amortised over 3 years.
The item “Concessions, licenses and trade marks”comprises almost exclusively costs incurred to ob-
tain user licenses for new software, amortised over 5 years.
The item “Goodwill” mainly includes positive differences generated by mergers concerning com-
panies taken over in prior years.The subsidiary company VIVISOL Srl was responsible for the in-
crease recorded during the year (Euro 609,000), which was in respect of its acquisition of a busi-
ness unit from Hospital Service Srl.This is being amortised over a period of ten years, which is re-
garded to be the period of economic return for the investment concerned, in consideration of the
particular sector in which the business unit acquired operates.
The item “Other” primarily includes costs with a useful working life of more than one year which
are being amortised over the same period as that estimated for the income related thereto.They
mainly comprise costs incurred in connection with:
• notary public fees and miscellaneous expenses on medium-term loans
• restructuring works carried out on leased premises
• costs incurred for the construction of the aqueduct owned by the Consortium CIGRI, which
supplies industrial water to the Piombino factory. These costs are amortised over 15 years ac-
cording to the relevant agreement’s maturity terms of the agreement
• initial leasing charges amortised over the duration of the related contracts.
The item “Difference arising on consolidation” refers to:
• the difference between the purchase price of the equity investment in the subsidiary SOL Weld-
ing Srl and the adjusted capital and reserves thereof as at 31.12.1997, equal to Euro 422,462 (cur-
rent net value Euro 0)
• the difference between the purchase price of the equity investment in the subsidiary BARTOLO
OSSIGENO Srl (merged with SOL SpA during the second half of the year) and the adjusted cap-
ital and reserves of the same company as at 31.12.1998, equal to Euro 403,547 (current net val-
ue Euro 80,709).
• the difference between the purchase price of the equity investment in the subsidiary VIVISOL
Deutschland GmbH and the capital and reserves thereof as at 31.12.1999, equal to Euro 115,170
(current net value Euro 46,068).
• the difference between the purchase price of the remaining 15.77% of the equity investment in
the subsidiary VIVISOL Deutschland GmbH and the capital and reserves thereof as at 31.12.2000,
equal to Euro 48,058 (current net value Euro 28,835)
• the difference between the purchase price of the equity investment in the subsidiary HGT S.A.
and the capital and reserves thereof as at 31.12.1999 increased by the share premium accruing on
the increase in share capital for the financial period deriving from the waiver of option rights by
the previous shareholders, equal to Euro 436,408 (current net value Euro 174,562).
• the difference between the purchase price of a further 15.55% stake in the subsidiary VIVISOL
Centro Adriatica Srl (merged with VIVISOL Srl during the second half of the year) and the ad-
justed capital and reserves of the same company as at 31.12.1999, equal to Euro 311,785 (current
net value Euro 124,714).

34 Notes to the consolidated financial statements 31st december 2002
Sol Group
• the difference between the purchase price of the remaining 14.45% investment in the subsidiary
VIVISOL Centro Adriatica Srl (merged with VIVISOL Srl during the second half of the year) and
the adjusted capital and reserves of the same company as at 31.12.2000, equal to Euro 268,336
(current net value Euro 161,002).
• the difference between the purchase price of the equity investment in the subsidiary France Oxy-
gene Sarl and the adjusted capital and reserves thereof as at 31.07.2000, equal to Euro 1,583,973
(current net value Euro 633,589).
• the difference between the purchase price of the equity investment in the subsidiary ZEUS S.A.
and the adjusted capital and reserves thereof as at 31.12.2000, decreased by the value of the reval-
ued assets equal to Euro 905,380 (current net value Euro 543,228) as indicated hereafter.
• the difference between the purchase price of the equity investment in the subsidiary T.G.T. A.D.
and the capital and reserves thereof as at 31.12.2001, equal to Euro 66,300 (current net value Eu-
ro 39,780).
• the difference between the purchase price of the equity investment in the subsidiary Cryo-Cell
Italia Srl and the capital and reserves of the same company as at 31.12.2001,equal to Euro 231,800
(current net value Euro 0, given that it was completely written off during the year under review).
• the difference between the purchase price of the equity investment in the subsidiary Behringer
Srl and the adjusted capital and reserves of the same company as at 31.12.2002, equal to Euro
764,800 (current net value Euro 764,800).This difference has not been amortised since, with the
investment in question having been acquired in December, only the company’s balance sheet has
been consolidated.
As for the amortization for the period broken down by class of assets, please see the detail given in
the notes concerning the Profit and Loss Account.
Revaluation executed during the financial period refers to I.M.G. D.o.o.
II - Tangible fixed assets
Balance as at 31.12.2002 202,884,210
Balance as at 31.12.2001 184,853,510
Movement 18,030,700
Analysis of tangible assets
Movements in tangible assets during the year, with reference to their historical cost, depreciation
and net value are as follows:
Movements in tangible assets Balance Increases Revalu- Other BalanceCost 31.12.2001 ations movements (Disposals) 31.12.2002
Land and buildings 51,742,900 8,691,641 - 4,826,135 (501,898) 64,758,778
Plants and machinery 149,049,401 41,181,582 - (686,421) (253,276) 189,291,286
Fixtures and fittings, tools and equipment 190,383,397 19,776,120 4,181 667,834 (875,627) 209,955,905
Other assets 17,041,083 2,260,340 4,045 241,935 (585,606) 18,961,797
Assets in course of construction and advances 26,004,267 3,333,635 - (27,289,973) - 2,047,929
Total 434,221,048 75,243,318 8,226 (22,240,490) (2,216,407) 485,015,695

35Notes to the consolidated financial statements 31st december 2002
Sol Group
Movement in accumulated Balance Depreciation Write-downs Other (Disposals) Balancedepreciation 31.12.2001 (amortisation) movements 31.12.2002
Land and buildings 19,315,717 2,000,554 - 3,652,232 (228,573) 24,739,930
Plants and machinery 98,111,997 10,121,826 - 35,184 (203,165) 108,065,842
Fixtures and fittings, tools and equipment 119,881,173 15,783,287 1,594 761,002 (685,242) 135,741,814
Other assets 12,058,651 1,962,114 2,206 102,379 (541,451) 13,583,899
Assets in course of construction and advances - - - - - -
Total 249,367,538 29,867,781 3,800 4,550,797 (1,658,431) 282,131,485
Movements in tangible assets Balance Increases (Amortisation Other BalanceNet value 31.12.2001 & write-downs) movements (Disposals) 31.12.2002
Land and buildings 32,427,183 8,691,641 (2,000,554) 1,173,903 (273,325) 40,018,848
Plants and machinery 50,937,404 41,181,582 (10,121,826) (721,605) (50,111) 81,225,444
Fixtures and fittings, tools and equipment 70,502,224 19,780,301 (15,784,881) (93,168) (190,385) 74,214,091
Other assets 4,982,432 2,264,385 (1,964,320) 139,556 (44,155) 5,377,898
Assets in course of construction and advances 26,004,267 3,333,635 - (27,289,973) - 2,047,929
Total 184,853,510 75,251,544 (29,871,581) (26,791,287) (557,976) 202,884,210
• The investments made during the financial year in respect of the item “Land and buildings” are
mainly investments effected by the Parent Company (Euro 6,891 thousand) and the subsidiary
company TGS A.D. (Euro 1,567 thousand).
• Acquisitions effected during the financial year under review in respect of “Plant and machinery”
were mainly the result of plant being purchased for the Parent Company’s factories (Euro 36,840
thousand) – due especially to its Mantua site being brought on-stream - the subsidiary company
TGS A.D. (Euro 1,680 thousand) and, to a lesser extent, other investments made by all other
Group companies.
• The item “Other industrial and commercial equipment” comprises commercial equipment (sup-
plying devices, cylinders, base units, concentrators and medical appliances) as well as other small
equipment.The increase recorded for the financial year was due to investments in commercial
equipment in the form of cylinders, dispensing devices and tanks,made by companies of the tech-
nical gases sector (Euro 12,741 thousand, including Euro 3,015 thousand by the Parent Compa-
ny) and to investments made by companies operating in the home care sector (Euro 7,035 thou-
sand, including Euro 2,518 thousand by the company VIVISOL S.r.l), in respect of base units and
other medical appliances.
• The item “Other assets” includes amounts for motor vehicles and motor cars, electric office
equipment, furniture and fixtures, and electronic accounting systems.The increase recorded the
financial year relates to investments made in motor vehicles, laboratory equipment, hardware, fur-
niture and furnishings, with Euro 866 thousand of the total reported pertaining to the Parent
Company and the subsidiary companies C.T.S.SpA (Euro 259 thousand),VIVISOL Srl (Euro 217
thousand) and TGS A.D. (Euro 287 thousand).

36 Notes to the consolidated financial statements 31st december 2002
Sol Group
• The item “Assets in course of construction” mainly refers to amounts relating to investments in
progress made by the Parent Company (Euro 344 thousand) and the subsidiaries C.T.S. SpA (Eu-
ro 113 thousand), SOL France (Euro 956 thousand), SOL Technische Gase (Euro 151 thousand)
and UTP d.o.o. (Euro 254 thousand).
Revaluations carried out during the year, totalling Euro 8,226, relate to monetary revaluations ef-
fected by I.M.G. D.o.o. in accordance with local legislation.
As for the amortization for the period broken down by class of assets, please see the detail given in
the notes concerning the Profit and Loss Account.
Please note that the sites located in Monza, Marcianise, Padua, Piombino, Cuneo, Salerno,Verona,
Vibo Valentia, Zola Predosa, Pavia, Pisa, Sesto San Giovanni, Ravenna, Pomezia, Catania and Ger-
sthofen are encumbered with mortgages and liens pertaining to medium-term loan agreements en-
tered into by a number of Group companies with banks.
As at 31st December 2002, mortgages amounted to Euro 145,505 thousand.
As at 31st December 2002, liens amounted to Euro 128,083 thousand.
Reference should be made to the reconciliation between the Parent Company’s profit and share-
holders’ equity and the consolidated profits and shareholders’ equity given below as regards the ef-
fects of eliminating accelerated depreciation and of accounting for leases in accordance with the In-
ternational Accounting Standard I.A.S. 17.
The item “Other movements” comprises Euro 529,881 relating to the inclusion of T.G.P. A.D. in
the consolidated accounts and Euro 851,007 relating to the inclusion of the company Energetika Z.J.
d.o.o. in the consolidated accounts, whilst the amounts for Behringer Srl are completely negligible.
III - Financial investments
Balance as at 31.12.2002 5,353,808
Balance as at 31.12.2001 8,698,429
Movement (3,344,621)
Equity investments
Balance as at 31.12.2002 431,428
Balance as at 31.12.2001 417,171
Movement 14,257
The item is broken down as follows:
Description 31.12.2002 31.12.2001
CONSORGAS S.r.l. 292,367 292,367
FABER S.r.l. - 5,164
S.A.T. Commerciale Srl 59,000 59,000
SALDO SERVIS Srl 10,000 10,000
Ionia Oxigono e.p.e. 9,278 8,931
Associated companies 370,645 375,462
Other equity investments 60,783 41,709
Other companies 60,783 41,709

With the exception of the Euro 9,278 reported as equity investments in associated companies (per-
taining to the subsidiary company HGT S.A.) and Euro 47,692 reported for other minority equi-
ty investments (of which Euro 24,648 relates to investments held in local companies by the sub-
sidiary company T.G.S.A.D. and Euro 18,075 relates to investments held by the subsidiary AIRSOL
B.V.), all the above investments are owned by the Parent Company.
The equity investment held in Consorgas S.r.l. has been valued on the basis of the value of capital
and reserves as at 31st December 2001, given that the financial statements as at 31st December 2002
will be approved within six months.
The equity investments in other companies were valued at cost.
Debtors
Balance as at 31.12.2002 1,385,946
Balance as at 31.12.2001 4,205,615
Movement (2,819,669)
The breakdown for the above item is as follows:
Description 31.12.2002 31.12.2001 Movement
Amounts owed by non-consolidated group - - -
Amounts owed by associated companies 144,000 180,000 (36,000)
Amounts owed by parent companies - - -
Other debtors 1,241,946 4,025,615 (2,783,669)
Total 1,385,946 4,205,615 (2,819,669)
Amounts owed by associated companies refer to the Parent Company in respect of S.A.T. Com-
merciale Srl.
The breakdown for the item “Others debtors” is as follows:
Description 31.12.2002 31.12.2001 Movement
Guarantee deposits 340,875 3,297,816 (2,956,941)
Tax credit pertaining to Employee Severance Indemnity 630,904 665,174 (34,270)
Other 270,167 62,625 207,542
Total 1,241,946 4,025,615 (2,783,669)
The above-mentioned amounts refer almost exclusively to the Parent Company.
The change undergone by the item “Guarantee deposits” relates to the utilisation of guarantee mon-
ey paid in the year 2001 in order to take part in a tender bid for an industrial development, com-
pleted during the course of the year under review.
None of the above amounts has a maturity exceeding 5 years.
37Notes to the consolidated financial statements 31st december 2002
Sol Group

38 Notes to the consolidated financial statements 31st december 2002
Sol Group
Other securities
Balance as at 31.12.2002 561,199
Balance as at 31.12.2001 563,333
Movement (2,134)
The breakdown for the item “Other securities” is as follows:
Description 31.12.2002 31.12.2001 Movement
Pledged securities – SOL Tecnische Gase 5,573 5,573 -
VIVISOL Heimbehand securities 2,381 604 1,777
Pledged securities - ICOA S.r.l. - 67,116 (67,116)
Other securities - ICOA S.r.l. 553,245 490,040 63,205
Total 561,199 563,333 (2,134)
Other securities held by ICOA S.r.l. are represented by bonds issued by Ambroveneto (Euro
203,245) and bonds issued by Interbanca (Euro 350,000).
The above-mentioned securities have the following characteristics:
Book Par value Maturity Currency Rate of Market value Description value interest
AMBROVENETO 203,245 216,912 01.01.2005 Euro Variable 216,370
INTERBANCA 350,000 350,000 21.10.2006 Euro Variable 336,875
The Interbanca bonds have not been written down, since they are not expected to be liquidated
before maturity.
Own shares
Balance as at 31.12.2002 2,975,235
Balance as at 31.12.2001 3,512,310
Movement (537,075)
We hereby confirm that this portfolio, equal to 1.68% of the share capital, comprises 1,525,000 or-
dinary shares with a par value of Euro 0.52, purchased by way of implementing the resolution du-
ly approved by the Shareholders' Meeting held on 28 April 2000.
As at 31st December 2002, the share price was Euro 2.378 per share, producing a total counterval-
ue for capital of Euro 3,626,450.
A special provision of the Capital and reserves has been pledged in respect to these securities.
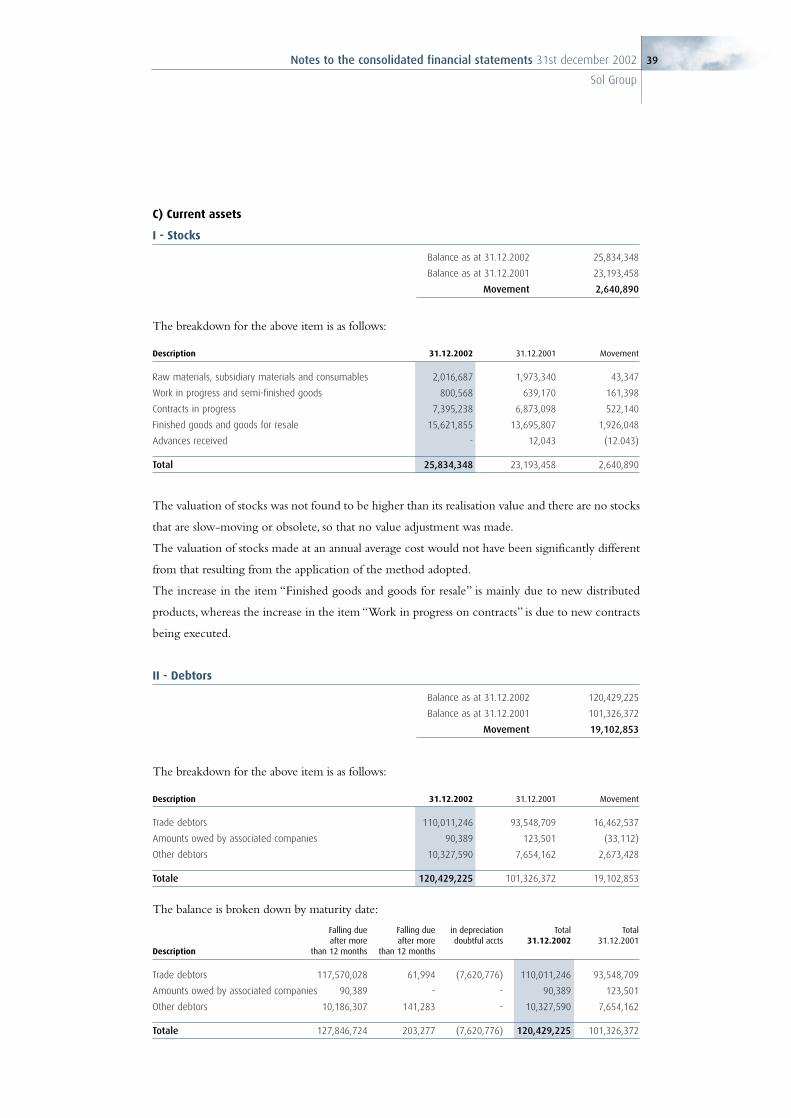
39Notes to the consolidated financial statements 31st december 2002
Sol Group
C) Current assets
I - Stocks
Balance as at 31.12.2002 25,834,348
Balance as at 31.12.2001 23,193,458
Movement 2,640,890
The breakdown for the above item is as follows:
Description 31.12.2002 31.12.2001 Movement
Raw materials, subsidiary materials and consumables 2,016,687 1,973,340 43,347
Work in progress and semi-finished goods 800,568 639,170 161,398
Contracts in progress 7,395,238 6,873,098 522,140
Finished goods and goods for resale 15,621,855 13,695,807 1,926,048
Advances received - 12,043 (12.043)
Total 25,834,348 23,193,458 2,640,890
The valuation of stocks was not found to be higher than its realisation value and there are no stocks
that are slow-moving or obsolete, so that no value adjustment was made.
The valuation of stocks made at an annual average cost would not have been significantly different
from that resulting from the application of the method adopted.
The increase in the item “Finished goods and goods for resale” is mainly due to new distributed
products, whereas the increase in the item “Work in progress on contracts” is due to new contracts
being executed.
II - Debtors
Balance as at 31.12.2002 120,429,225
Balance as at 31.12.2001 101,326,372
Movement 19,102,853
The breakdown for the above item is as follows:
Description 31.12.2002 31.12.2001 Movement
Trade debtors 110,011,246 93,548,709 16,462,537
Amounts owed by associated companies 90,389 123,501 (33,112)
Other debtors 10,327,590 7,654,162 2,673,428
Totale 120,429,225 101,326,372 19,102,853
The balance is broken down by maturity date:
Falling due Falling due in depreciation Total Total after more after more doubtful accts 31.12.2002 31.12.2001
Description than 12 months than 12 months
Trade debtors 117,570,028 61,994 (7,620,776) 110,011,246 93,548,709
Amounts owed by associated companies 90,389 - - 90,389 123,501
Other debtors 10,186,307 141,283 - 10,327,590 7,654,162
Totale 127,846,724 203,277 (7,620,776) 120,429,225 101,326,372

40 Notes to the consolidated financial statements 31st december 2002
Sol Group
There are no amounts falling due and payable after more than 5 years.
Euro 596,259 of the increase undergone by trade debtors was due to the broadening of the Group’s
consolidation structure and, with regard to the difference, to an increase in sales and to a lesser ex-
tent an increase in the number of delays taken to receive payments (especially from public bodies).
The amounts owed by associated companies are receivable from S.A.T Commerciale Srl (Euro
78,914) and SALDO SERVIS Srl (Euro 11,475).
Provisions for doubtful debtors recorded the following movements:
31.12.2001 Provisions (Uses) 31.12.2002
5,022,735 3,163,054 (565,013) 7,620,776
The detailed breakdown for the item “Other debtors” is as follows:
Description 31.12.2002 31.12.2001 Movement
Corporation income tax credit 4,214,726 1,305,311 2,909,415
VAT receivables 3,869,411 3,842,954 26,457
Other receivables 2,243,453 2,505,897 (262,444)
Total 10,327,590 7,654,162 2,673,428
All “Other debtors” are considered as collectable and therefore no value adjustment was made.
III - Financial investments which are not permanent
Balance as at 31.12.2002 339,834
Balance as at 31.12.2001 409,899
Movement (70,065)
The breakdown for this item is as follows:
Description 31.12.2002 31.12.2001 Movement
Swaps 62,959 60,426 2,533
MPS mutual fund 70,109 - 70,109
Open-end investment company (SICAV) 30 142,012 (141,982)
Genercomit funds 163,614 163,614 -
Equity shares in Arena Tourist 39,029 39,686 (657)
Other fixed-income securities 4,093 4,161 (68)
Total 339,834 409,899 (70,065)
Swaps are held by the subsidiary company VIVISOL Umbria Srl.
Shares in the MPS Mutual Fund are held by the subsidiary VIVISOL Umbria Srl.
Quotas in open-end investment companies are held by the subsidiary company SOL France Sas.
Shares in the Genercomit Tesoreria Fund are held by the subsidiary ICOA Srl.
The equity shares in “Arena Tourist” are held by the subsidiary U.T.P.
Other securities comprise private bonds held by the subsidiary company U.T.P.

41Notes to the consolidated financial statements 31st december 2002
Sol Group
IV - Cash at bank and in hand
Balance as at 31.12.2002 23,901,490
Balance as at 31.12.2001 21,307,864
Movement 2,593,626
The breakdown for this item is as follows:
Description 31.12.2002 31.12.2001 Movement
Post Office and bank deposits 23,632,166 21,089,466 2,542,700
Bank cheques 3,557 5,211 (1,654)
Cash and cash equivalents in hand 265,767 213,187 52,580
Total 23,901,490 21,307,864 2,593,626
The above balance represents the liquid assets and cash and cash equivalents existing at the close of
the financial year.
D) Prepayments and accrued income
Balance as at 31.12.2002 541,255
Balance as at 31.12.2001 915,613
Movement (374,358)
These represent the harmonising items for the financial period entered on an accrual basis.The breakdown for this item is as follows:
Description 31.12.2002 31.12.2001 Movement
Accrued income:
Interest receivable on securities 8,430 12,714 (4,284)
Other accrued income 34,265 100,363 (66,098)
Total accrued income 42,695 113,077 (70,382)
Prepayments:
Insurance premiums 67,513 443,516 (376,003)
Rents 42,821 38,651 4,170
Prepaid expenses 93,935 92,428 1,507
Other prepayments 294,291 227,941 66,350
Total prepayments 498,560 802,536 (303,976)
Total prepayments and accrued 541,255 915,613 (374,358)
The item “Other prepayments” mainly comprises invoices referred to maintenance agreements or
other agreements of a long-term nature.

42 Notes to the consolidated financial statements 31st december 2002
Sol Group
LIABILITIESA) Capital and reserves
Balance as at 31.12.2002 210,501,137
Balance as at 31.12.2001 199,260,424
Movement 11,240,713
The share capital of SOL SPA as at 31.12.02 comprised No. 90,700,000 ordinary shares with a par
value of Euro 0.52 each, fully subscribed and fully paid up.
The breakdown of and movements in capital and reserves at year-end is detailed below:
Capital and reserves: Balance Transfer Dividends Translation Other Result Balance31.12.2001 of result paid differences movements 31.12.2002
Pertaining to the Group:
Subscribed capital 47,164,000 - - - - - 47,164,000
Share premium account 62,139,691 - - - 537,075 - 62,676,766
Revaluation reserve - - - - - - -
Legal reserve 2,012,957 518,013 - - - - 2,530,970
Reserve for own shares 3,512,310 - - - (537,075) - 2,975,235
Reserves provided for by the Articles of Association - - - - - - -
Other reserves:
Extraordinary reserve 21,471,953 4,491,905 - - (307,836) - 25,656,022
Reserves not taxable until use or liquidation 3,799,031 - - - 307,836 - 4,106,867
Reserve for payments to cover losses - - - - - - -
Capital and reserves of aggregated companies - - - - - - -
Reserve for capital account grants - - - - - - -
Reserve for differences arising from application of the equity method - - - - - - -
Reserve for translation differences (2,531,778) - - (1,096,707) 1.656.293 - (1,972,192)
Undistributed earnings of subsidiaries and other reserves 36,549,038 2,703,676 - (1,656,293) 228,582 - 37,825,003
Consolidation reserve 1,046,659 - - - 3,761,505 - 4,808,164
Other reserves 587,234 516,457 - - - - 1,103,691
Profits (losses)carried forward - - - - - - -
Profit (loss) for the financial year 13,063,945 (8,230,051) (4,833,894) - - 15,527,267 15,527,267
Total group capitaland reserves 188,815,040 - (4,833,894) (2,753,000) 5,646,380 15,527,267 202,401,793
Minority interests:
Capital and reserves pertainingto minority interests 10,324,611 120,773 - - (2,552,678) - 7,892,706
Profit (loss) pertaining to minority interests 120,773 (120,773) - - - 206,638 206,638
Total capital and reserves pertaining to minorityinterests 10,445,384 - - - (2,552,678) 206,638 8,099,344
Total Capital and Reserves 199,260,424 - (4,833,894) (2,753,000) 3,093,702 15,733,905 210,501,137

43Notes to the consolidated financial statements 31st december 2002
Sol Group
The share capital, legal reserve, extraordinary reserve and the non-taxable provisions and reserves
reflect the amounts reported in the Parent Company’s Financial Statements as at 31.12.02.
The “Consolation reserve” appearing in the consolidated balance sheet as at 31st December 2002
reflects:
• the difference between the acquisition cost of the investment in AIRSOL BV and the net equi-
ty value of the group on the date of acquisition (Euro 1,046,659).
• the difference between the acquisition value of the equity investment held in TGP A.D. and the
net equity value of the same company as at 31.12.2002 (Euro 75,356).
• the difference between the acquisition value of the equity investment held in ENERGETIKA Z.J.
D.o.o. and the net equity value of the same company, the capital gains pertaining to the invest-
ments held as at 31.12.2002 (Euro 3,686,149) duly being taken into account.
The change undergone by the item “Capital and reserves pertaining to minority interests” was
mainly due to the acquisition of further equity investments in SOL-INA d.o.o., SPG d.o.o. and TPJ
d.o.o. and to the inclusion of the companies TGP A.D., ENERGETIKA Z.J. d.o.o. and Behringer
Srl in the Group’s consolidated accounts.
Harmonisation table between the capital and reserves and economic position of the Parent Com-
pany and the consolidated capital and reserves and economic position.
Net Profit Capital and reservesFor the Group Minority interests For the Group Minority interests
BALANCES AS PER THE EQUITY AND ECONOMICPOSITION FOR THE PARENT COMPANY 11,327,673 - 157,541,224 - Effect of the elimination of value adjustments and of provisions made solely for fiscal purposes, net of tax effects:- Surplus accelerated depreciation 898,805 51,724 22,205,430 102,712
Elimination of inter-company transactions, net of tax effects:- Internal profit on tangible fixed assets 16,733 (5,943) (144,016) (10,657)- Internal profit on intangible fixed assets (12,263) (46,347) (192,142) (46,347)- Reversal of adjustments to investments
in subsidiary companies 430,249 42,842 - - - Dividends paid by consolidated companies (3,230,161) (6,615) - -
Effect of changes to valuation criteria and action taken to make criteria moreconsistent within the Group, net of fiscal effects:- Adjustment of rates of exchange 121,636 - (97,865) - - Use of finance lease method for leased assets 129,579 (2,454) 2,370,474 4,985 - Valuation at equity of companies reported at cost 313 35 158,453 80
Carrying value of consolidated equity investments - - (97,715,306) -
Capital and reserves and half-yearly profit (loss) for consolidated 7,049,321 153,069 115,650,087 8,089,558
Allocation of differences to assets of consolidated companies and depreciation of same assets:- Tangible fixed assets (58,355) 18,149 (85,414) 72,596 - Goodwill on consolidation (1,030,501) (113,582) 2,710,869 (113,582)
Effect of other adjustments:- Change in consolidation basis (115,761) 115,761 - -
BALANCES AS PER THE CONSOLIDATED EQUITY AND ECONOMIC POSITION 15,527,267 206,638 202,401,793 8.099,344

44 Notes to the consolidated financial statements 31st december 2002
Sol Group
B) Provisions for risks and charges
Balance as at 31.12.2002 15,495,323
Balance as at 31.12.2001 14,273,985
Movement 1,221,338
The breakdown for the item “Provisions for liabilities and charges” is as follows:
Description 31.12.2002 31.12.2001 Movement
Provisions for pensions and similar obligations - - -
Taxation provision 14,211,994 13,360,208 851,786
Other:
- Provisions for exchange rate fluctuations 27,287 32,599 (5,312)
- Other minor provisions: 1,256,042 881,178 374,864
Total other provisions 1,283,329 913,777 369,552
Total 15,495,323 14,273,985 1,221,338
The “Provisions for Taxation” represents the net balance of deferred tax receivable and payable re-
ported in the Consolidated Financial Statements as at 31.12.02 with regard to items having a fiscal
nature carried in the Financial Statements for the period of Group companies (accelerated depre-
ciation), deferred receivable or payable tax referred to consolidation entries and deferred receivable
tax accruing to temporary tax differences (taxed provisions).
The item “other” consists of provisions for general risks that do not offset asset items.
C) Employee severance indemnity
Balance as at 31.12.2002 8,070,990
Balance as at 31.12.2001 7,285,885
Variazione 785,105
Movements in staff severance fund were as follows:
Balance Allocation (Uses) Other Balance31.12.2001 movements 31.12.2002
Movements in employee severance provision
Total 7,285,885 1,301,531 (612,339) 95,913 8,070,990
The amount set aside represents the amount actually owned by companies as at 31.12.02 to staff
employed as of said date, net of any advances paid.

45Notes to the consolidated financial statements 31st december 2002
Sol Group
D) Creditors
Balance as at 31.12.2002 148,498,960
Balance as at 31.12.2001 123,008,259
Movement 25,490,701
The detailed breakdown of the item ‘Creditors’ is as follows:
Description 31.12.2002 31.12.2001 Movement
Debenture loans - - -
Amounts owed to banks 5,383,057 4,447,273 935,784
Amounts owed to other financiers 86,952,339 59,413,968 27,538,371
Advances received - - -
Amounts owed to suppliers 43,100,768 47,107,313 (4,006,545)
Amounts owed to associated 95,489 103,912 (8,423)
Amounts owed to tax administration 3,955,998 4,576,129 (620,131)
Amounts owed to Social Security institutions 1,756,784 1,594,819 161,965
Other creditors 7,254,525 5,764,845 1,489,680
Total 148,498,960 123,008,259 25,490,701
Creditors are valued at their nominal value and are broken down according to maturity as follows:
Within 12 After 12 After 5 Total Totalmonths months years 31.12.2002 31.12.2001
Debenture loans - - - - -
Amounts owed to banks 5,352,115 30,942 - 5,383,057 4,447,273
Amounts owed to other financiers 15,141,279 56,896,416 14,914,644 86,952,339 59,413,968
Advances received - - - - -
Amounts owed to suppliers 43,100,768 - - 43,100,768 47,107,313
Amounts owed to associated companies 95,489 - - 95,489 103,912
Amounts owed to tax administration 3,955,998 - - 3,955,998 4,576,129
Amounts owed to Social Security institutions 1,756,784 - - 1,756,784 1,594,819
Other creditors 5,167,865 2,086,660 - 7,254,525 5,764,845
Total 74,570,298 59,014,018 14,914,644 148,498,960 123,008,259
The item “Amounts due to other financiers” for the most part comprises loans granted by medi-
um and long-term credit institutions. Such loans are backed by liens on movable assets and mort-
gages on real property, as already mentioned in the notes regarding tangible fixed assets. Further-
more, the same item also includes amounts owed to leasing companies equal to Euro 5,250 thou-
sand, deriving from the application of the international accounting standard IAS 17 on assets that
are the object of a finance lease.
The detailed breakdown for of the item “Amounts owed to other financiers” is as follows (with val-
ues expressed in thousands of Euro):

46 Notes to the consolidated financial statements 31st december 2002
Sol Group
Finance institute Amount Amount Rate of Maturity Value Original short-term interest amount
BFCC 4 4 5.10% 19.02.2003 FFR 400,000
Banca di Roma 5,165 5,165 3.64% 13.03.2003 Euro 5,164,569
Deutsche Bank 34 34 3.99% 02.04.2003 ITL Million 400
IMI 940 940 4.05% 30.11.2003 ITL Million 9,100
Dresdner Bank 176 176 5.95% 01.12.2003 DEM 1,500,000
Banca Popolare di Vicenza 100 100 5.65% 31.12.2003 Euro 100,000
Cassa di Risparmio di Trieste 104 69 3.96% 01.01.2004 ITL Million 850
Mediocredito Centrale 480 320 4.75% 25.02.2004 ITL Million 3,098
Banque Scalbert Dupont 14 12 6.50% 01.04.2004 FFR 260,000
Banque Scalbert Dupont 9 7 6.50% 24.06.2004 FFR 162,000
Banque Scalbert Dupont 5 3 6.50% 01.08.2004 FFR 78,000
Efibanca 1,409 704 3.56% 13.09.2004 ITL Million 7,500
Mediosud 72 35 4.65% 31.12.2004 ITL Million 460
BNL 129 52 4.09% 11.01.2005 ITL Million 300
Deutsche Bank 116 52 4.05% 19.01.2005 ITL Million 400
Mediocredito Lombardo 81 32 5.32% 31.03.2005 ITL Million 500
Centrobanca 78 25 3.70% 31.12.2005 ITL Million 286
Deutsche Bank 168 52 4.02% 16.01.2006 Euro 207,000
Mediocredito Centrale 1,654 473 3.20% 14.04.2006 ITL Million 4,575
IMI 6,190 1,211 7.66% 15.03.2007 ITL Million 19,000
IMI 250 56 5.30% 15.06.2007 Euro 250,000
Credito Italiano 10,500 1,892 5.15% 30.06.2007 Euro 10,500,000
Credito Emiliano 1,540 282 4.38% 01.08.2007 Euro 1,540,000
ERP 1,199 218 1.95% 01.01.2008 ATS 18,000,000
IMI 8,788 1,598 5.40% 15.03.2008 ITL Million 24,750
Bank Austria 833 128 3.494% 01.07.2009 ATS 15,000,000
Mediocredito Lombardo 1,831 - 5.80% 21.11.2009 Euro 1,831,000
Bank Austria 1.283 171 3.494% 01.01.2010 ATS 20,000,000
Credito Emiliano 750 - 6.05% 14.06.2010 Euro 750,000
Mediocredito Centrale 4,500 - 3.55% 30.06.2010 Euro 4,500,000
IMI 13,000 - 3.18% 15.12.2010 Euro 13,000,000
IMI 5,500 - 4.72% 15.09.2011 Euro 5,500,000
IMI 7,300 - 3.18% 15.09.2011 Euro 7,300,000
IMI 7,500 - 5.50% 15.12.2011 Euro 7,500,000
Amounts owed to leasing companies 5,250 1,332
Total 86,952 15,141
The item “Amounts owed to associated companies”, which refers to the supply of goods and serv-
ices at arm’s length conditions, is broken down as follows:
31.12.2002 31.12.2001 Movement
S.A.T. Commerciale 5,000 5,000 -
CONSORGAS Srl 90,489 98,912 (8,423)
Total 95,489 103,912 (8,423)
The breakdown for the item “Amounts owed to tax administration” comprises:

47Notes to the consolidated financial statements 31st december 2002
Sol Group
Description 31.12.2002 31.12.2001 Movement
Amounts owed in respect of income tax 2,395,476 1,951,240 444,236
Amount owed to Inland Revenue in respect of VAT 455,814 885,234 (429,420)
Amounts owed to tax administration in respect of withholding 963,379 1,085,769 (122,390)
Other amounts owed to tax administration 141,329 653,886 (512,557)
Total 3,955,998 4,576,129 (620,131)
The breakdown for the item “Other creditors” is as follows:
Description 31.12.2002 31.12.2001 Movement
Accrued holidays not taken 2,018,937 1,657,679 361,258
Guarantee deposits 284,690 303,782 (19,092)
Amount owed for acquisition of equity investments 2,702,829 1,888,698 814,131
Amounts owed to employees for wages and salaries 541,239 585,736 (44,497)
Other creditors 1,706,830 1,328,950 377,880
Total 7,254,525 5,764,845 1,489,680
The item “Amounts owed for acquisition of equity investments” includes the undertaking assumed
by the company SOL S.p.A. to repurchase shares in the companies TGS A.D. (Euro 539,004), SPG
d.o.o. (Euro 489,814) and SOL – INA (Euro 776,583), presently owned by the company SIMEST
SPA, the amount owed by SOL S.p.A. for the acquisition of shares in ENERGETIKA Z.J. d.o.o.
(Euro 659,200) and the amount owed by VIVISOL Srl for the acquisition of shares in VIVISOL
Centro Adriatica Srl (Euro 258,228).
E) Accruals and deferred income
Balance as at 31.12.2002 3,706,516
Balance as at 31.12.2001 3,976,405
Movement (269,889)
These represent the harmonising items for the financial period entered on an accrual basis.The
breakdown for this item is as follows:
Description 31.12.2002 31.12.2001 Movement
Accrued liabilities:
Interest payable on loans 686,343 502,825 183,518
Other 697,421 720,121 (22,700)
Total accrued liabilities 1,383,764 1,222,946 160,818
Deferred income:
Government grants 2,246,296 2,528,213 (281,917)
Rents receivable 35,871 - 35,871
Other 40,585 225,246 (184,661)
Total deferred income 2,322,752 2,753,459 (430,707)
Total 3,706,516 3,976,405 (269,889)
The item “Government grants” refers to capital contributions recorded in accordance with the ac-
crual accounting method.

48 Notes to the consolidated financial statements 31st december 2002
Sol Group
MEMORANDUM ACCOUNTSMemorandum accounts
Balance as at 31.12.2002 8,695,701
Balance as at 31.12.2001 9,063,067
Movement (367,366)
Description 31.12.2002 31.12.2001 Movement
Guarantees given to third parties 8,098,859 8,548,246 (449,387)
Real guarantees given 129,862 129,862 -
Other guarantees given 420,181 338,160 82,021
Guarantees received 46,799 46,799 -
Total 8,695,701 9,063,067 (367,366)
The guarantees given to third parties refer to guarantees issued in respect of loans granted to SOL
SpA and to group companies.
PROFIT AND LOSS ACCOUNTA) Value of production
Balance as at 31.12.2002 276,610,073
Balance as at 31.12.2001 244,674,902
Movement 31,935,171
The breakdown for this item is as follows:
Description 31.12.2002 31.12.2001 Movement
Net turnover from sales and services 267,159,880 235,730,982 31,428,898
Variation in stocks 668,433 643,323 25,110
Variation in contracts in progress 522,140 2,086,351 (1,564,211)
Work performed for own purposes and capitalised 5,514,311 4,326,490 1,187,821
Other revenues and income 2,163,110 1,127,759 1,035,351
Financial grants to the financial period account 582,199 759,997 (177,798)
Total 276,610,073 244,674,902 31,935,171
The variation of the consolidation basis generated a net increase in sales totalling Euro 1,763,856.
The breakdown for the item “Other revenues and income” is as follows:
Description 31.12.2002 31.12.2001 Movement
Capital gains on disposal of fixed assets 956,247 347,852 608,395
Insurance indemnities 86,452 165,705 (79,253)
Rent on real the state 25,885 8,345 17,540
Other 1,094,526 605,857 488,669
Total 2,163,110 1,127,759 1,035,351
The item “Other” comprises contingent assets relating to ordinary operations.

49Notes to the consolidated financial statements 31st december 2002
Sol Group
Geographical distribution and breakdown of revenues by type of business are detailed below:
Geographical distribution of revenues
Description 31.12.2002 31.12.2001 Movement
Sales - Italy 192,897,427 175,724,446 17,172,981
Sales - EEC (except Italy) 52,112,754 43,272,349 8,840,405
Sales outside EEC countries 22,149,699 16,734,187 5,415,512
Total 267,159,880 235,730,982 31,428,898
Breakdown of revenues by type of business
Description 31.12.2002 31.12.2001 Movement
Gas pipelines and on-site 33,069,274 27,870,409 5,198,865
Merchant 171,086,588 155,856,412 15,230,176
Home care 63,004,018 52,004,161 10,999,857
Total 267,159,880 235,730,982 31,428,898
Reference should be made to the Directors' Report for comments regarding the trend in revenues.
B) Costs of production
Balance as at 31.12.2002 248,217,801
Balance as at 31.12.2001 221,947,690
Movement 26,270,111
The breakdown for the item “Costs of production” is as follows:
Description 31.12.2002 31.12.2001 Movement
Raw materials, subsidiary materials and consumables 83,206,102 74,434,153 8,771,949
Services 76,983,029 69,598,193 7,384,836
Costs for use of assets owned by others 3,803,224 3,909,813 (106,589)
Wages and salaries 33,150,264 29,873,104 3,277,160
Social Security costs 11,391,816 9,953,843 1,437,973
Employee severance indemnity 1,301,531 1,248,912 52,619
Pensions costs - - -
Other costs relating to staff - - -
Amortisation of intangible fixed assets 3,690,330 3,451,351 238,979
Amortisation of tangible fixed assets 29,867,781 25,933,218 3,934,563
Other reductions in value of fixed assets 4,053 6,050 (1,997)
Allowance for doubtful debtors included in current assets 3,163,054 2,090,664 1,072,390
Variation in stocks of raw materials (1,263,206) (680,120) (583,086)
Amounts provided for risk provisions 239,354 53,996 185,358
Other provisions 203,790 340,565 (136,775)
Other operating charges 2,476,679 1,733,948 742,731
Total 248,217,801 221,947,690 26,270,111
The increase undergone by production costs was due substantially to an increase in revenues.

50 Notes to the consolidated financial statements 31st december 2002
Sol Group
The item “raw materials, subsidiary materials and consumables” includes power costs since, since in
view of the group’s type of business, electricity constitutes de facto the main raw material.
The percentage incidence of purchases, net of adjustments to stocks of raw materials, in respect of
the value of production is shown in the table below.
Description 31.12.2002 31.12.2001
Variation in stocks of raw materials (1,263,206) (680,120)
Purchases of raw materials, subsidiary materials and goods 83,206,102 74,434,153
Purchases of raw materials, subsidiary materials and goods - adjusted 81,942,896 73,754,033
Value of production 267,828,313 236,374,305
Percentage incidence 30,60% 31,20%
The breakdown for the item “Services” is as follows:
Description 31.12.2002 31.12.2001 Movement
Freight 36,395,919 33,045,201 3,350,718
Maintenance 9,858,189 8,735,586 1,122,603
Consulting and general services 4,806,593 4,923,527 (116,934)
Insurance premiums 2,126,853 1,665,718 461,135
Travel and related allowances 4,904,370 4,608,833 295,537
Advertising 1,005,515 819,455 186,060
Remuneration paid to Directors and fees paid to Statutory Auditors 2,026,330 2,073,439 (47,109)
Other services 15,859,260 13,726,434 2,132,826
Total 76,983,029 69,598,193 7,384,836
The breakdown of the item “Depreciation, amortisation and write-downs“ pertaining to fixed as-
sets, detailed by class of assets:
Depreciation of tangible fixed assets
Description 31.12.2002 31.12.2001 Movement
Land and buildings 2,000,554 197,713 1,802,841
Plants and machinery 10,121,826 9,263,387 858,439
Fixtures and fittings, tools and equipment 15,783,287 14,292,380 1,490,907
Other assets 1,962,114 2,179,738 (217,624)
Tangible fixed assets in course of construction - - -
Total 29,867,781 25,933,218 3,934,563
Amortisation of intangible fixed assets
Description 31.12.2002 31.12.2001 Movement
Start-up and expansion costs 1,297,726 1,078,165 219,561
Costs of research, development and advertising 141,364 327,863 (186,499)
Patents and rights to use patents of others 380,893 413,426 (32,533)
Concessions, licenses, trade marks and similar rights 228,962 213,965 14,997
Goodwill 73,011 113,464 (40,453)
Other 424,290 392,185 32,105
Consolidation difference 1,144,084 912,283 231,801
Total 3,690,330 3,451,351 238,979

51Notes to the consolidated financial statements 31st december 2002
Sol Group
The breakdown for the item “Other operating charges” is as follows:
Description 31.12.2002 31.12.2001 Movement
Taxes other than income tax 1,774,258 1,419,783 354,475
Capital losses related to ordinary activities 92,823 19,039 73,784
Losses on amounts receivable not covered by provisions 1,002 93,200 (92,198)
Other minor charges 608,596 201,926 406,670
Total 2,476,679 1,733,948 742,731
The item “Other minor charges” comprises contingent liabilities relating to ordinary operations.
C) Financial income and charges
Balance as at 31.12.2002 (3,988,086)
Balance as at 31.12.2001 (3,122,342)
Movement (865,744)
The breakdown for the item financial income and expense is detailed in the table below:
Description 31.12.2002 31.12.2001 Movement
Income from equity investments in associated companies 8,823 - 8,823
Income from equity investments in other companies 1,692 1,601 91
Income from loans entered under fixed assets 29,335 97,437 (68,102)
Income from securities entered under current assets 15,324 51,816 (36,492)
Other income not included above 1,136,799 1,388,474 (251,675)
(Interest payable and other similar financial charges) (5,180,059) (4,661,670) (518,389)
Total (3,988,086) (3,122,342) (865,744)
The breakdown of the item “Other income not included above” is as follows:
Description 31.12.2002 31.12.2001 Movement
Interest on deposits with banks and post offices 238,651 445,757 (207,106)
Interest receivable from trade 145,832 57,309 88,523
Interest receivable on other amounts - 429 (429)
Realised gains on foreign exchange transactions 581,378 755,559 (174,181)
Other financial income 170,938 129,420 41,518
Total 1,136,799 1,388,474 (251,675)
The breakdown for the item “Interest payable and other similar financial charges” is as follows:
Description 31.12.2002 31.12.2001 Movement
Interest payable to banks 297,132 282,895 14,237
Interest payable to suppliers 37,016 70,129 (33,113)
Exchange rate losses and provisions for exchange rate fluctuations 593,823 482,289 111,534
Interest payable on loans 3,387,534 2,977,374 410,160
Total financial charges 864,554 848,983 15,571
Total 5,180,059 4,661,670 518,389
The item “Other financial charges” includes mainly expenses and banking fees and charges.

52 Notes to the consolidated financial statements 31st december 2002
Sol Group
D) Value adjustments to financial investments
Balance as at 31.12.2002 6,747
Balance as at 31.12.2001 (220,099)
Movement 226,846
The breakdown for the item “Value adjustments to financial investments” is as follows:
Description 31.12.2002 31.12.2001 Movement
Write-ups of equity investments in associated 348 2,510 (2,162)
Write-ups of long-term investments that are not equity investments 6,399 - 6,399
Write-downs of equity investments in associated companies - (222,609) 222,609
Total 6,747 (220,099) 226,846
E) Extraordinary income and charges
Balance as at 31.12.2002 88,769
Balance as at 31.12.2001 892,595
Movement (803,826)
The breakdown for the item “Extraordinary income and charges” is as follows:
Description 31.12.2002 31.12.2001 Movement
Other extraordinary income 421,731 748,803 (327,072)
Capital gains from disposal of fixed assets 109,832 808,394 (698,562)
Capital losses from disposal of fixed assets (178,448) (20,699) (157,749)
Other extraordinary charges (264,346) (643,903) 379,557
Total 88,769 892,595 (803,826)
Income taxes on the income of the financial period
Balance as at 31.12.2002 8,765,797
Balance as at 31.12.2001 7,092,648
Movement 1,673,149
The breakdown of income taxes on the income of the financial period is as follows:
Description 31.12.2002 31.12.2001 Movement
Current income taxes for the financial period 8,507,480 8,025,135 482,345
Deferred taxation 258,317 (932,487) 1,190,804
Total 8,765,797 7,092,648 1,673,149
The total amount of current income taxes for the financial period corresponds to the sum of the
income taxes calculated by the individual companies.

53Notes to the consolidated financial statements 31st december 2002
Sol Group
Information on employees
Description 31.12.2002 31.12.2001 Movement
Managers 36 34 2
Office workers 796 745 51
Factory workers 451 401 50
Total 1,283 1,180 103
Remuneration paid to Directors and fees paid to Statutory Auditors
Description 31.12.2002 31.12.2001 Movement
Directors 1,908,796 1,933,408 (24,612)
Statutory Auditors 117,534 140,031 (22,497)
Total 2,026,330 2,073,439 (47,109)
Reference should be made to the Explanatory Notes to the Financial Statements as at 31.12.02 of
SOL SpA as regards the remuneration paid to Directors and the fees paid to Statutory Auditors.
Dealings with correlated parties
During the year 2002, the SOL Group had dealings with related parties, such as private individuals
who are relatives of certain members of the Parent Company’s Board of Directors. Such relations
consisted of employment agreements,which were remunerated at normal market rates and entailed
a cost of Euro 312,000 for the group.
Chairman of the Board of Directors
(Aldo Fumagalli Romario)

54 Notes to the consolidated financial statements 31st december 2002
Sol Group
Consolidated cash flow statement Sol Group
(In thousands of Euro) 31.12.2002 31.12.2001
CASH FLOWS PROVIDED BY OPERATING ACTIVITIES
Profit for the period 15,527 13,064
Minority interest - share of profit 207 121
Adjustments not affecting liquidity
Depreciation and amortisation 33,558 29,384
Employee severance indemnity accrued during the year 1,302 1,248
Increase (decrease) in provisions for liabilities and charges 1,221 175
Write-down of equity investments - -
Total 51,815 43,992
Changes in current assets and liabilities
Stocks (2,641) (3,335)
Debtors (19,076) (8,407)
Prepayments and accrued income 374 270
Suppliers (4,015) 7,751
Other creditors 1,652 1,020
Accruals and deferred income (270) (213)
Amounts owed to tax administration (620) 1,471
Total (24,596) (1,443)
CASH FLOWS PROVIDED BY OPERATING ACTIVITIES 27,219 42,549
CASH FLOWS PROVIDED BY INVESTING ACTIVITIES
Acquisitions, revaluation and other movements in industrial fixed assets (47,085) (48,345)
Change in the consolidation basis (1,371) (1,355)
Net book value of assets 558 2,110
Increases in intangible assets (3,606) (3,700)
(Increase) decrease in investments 3,345 (4,958)
(Increase) decrease in financial assets not held as fixed assets 70 (70)
TOTAL (48,090) (56,318)
CASH FLOWS PROVIDED BY FINANCING ACTIVITIES
Proceeds from (repayments of) new borrowings 27,538 4,673
Changes in other medium/long-term liabilities - -
Repayment of debenture loans - -
Dividends paid (4,834) (4,831)
Employee severance indemnity paid during the year net of transfersfrom Group companies (516) (748)
Other changes in capital and reserves
- increase in share capital - -
- translation differences and other movements (2,780) 3,472
- movements in capital and reserves pertaining to minority interests (2,553) 3,060
- change in the consolidation basis 5,674 (887)
TOTAL 22,529 4,739
INCREASE (DECREASE) IN CASH IN HAND AND AT BANK 1,658 (9,030)
CASH IN HAND AND AT BANK AT BEGINNING OF YEAR 16,861 25,891
CASH IN HAND AND AT BANK AT END OF YEAR 18,518 16,861

55Notes to the consolidated financial statements 31st december 2002
Sol Group

56 Report of the indipendent auditors

Design
M Studio, Milano
Printing
Grafiche Mariano, Mariano Comense

Sol SpaPiazza Diaz, 120052 Monza (MI) ItalyTelephone +39.039.23961Fax +39.039.2396371