Social Media Shakedown of Top Brands in June 2014
44
TOP US BRANDS ON SOCIAL MEDIA JUNE 2014
-
Upload
unmetric -
Category
Social Media
-
view
1.692 -
download
3
Transcript of Social Media Shakedown of Top Brands in June 2014

TOP US BRANDS ON SOCIAL MEDIA JUNE 2014

About Unmetric
We provide not-so-obvious competitive
intelligence on over 20,000 brands across 30
sectors … so you know who is outsocializing
who. And how.
We understand that while companies have
always needed competitive intelligence, it’s
never been easy to come by. The modern
digital media landscape gives marketers the
potential to study their campaign spends,
activity and decide on future spends much
more rationally than ever before.
Some of our clients
Unmetric is proud to be a
Twitter Certified Product

With the recently concluded FIFA World Cup 2014, the importance of social
media as a channel of communication has been highlighted more than ever.
FIFA sponsors like Nike and Allstate who leveraged the global sports event in
their content received great engagement. Other brands like YES Network, Royal
Caribbean Cruises and Walking Dead chose to focus on brand related content
for the most part, while brands like PetFlow – Pet Delivery, Miller Lite and
Chevrolet wove their brand related content and non brand related content
together for a broader content strategy.
In this report, Unmetric takes a look at how the social media efforts of each of
these brands paid off, while also offering insights from the best of these
sectors.
All data and insights were gathered from the month of June. Look out for July’s
report in early August.

All images in this report are hyperlinked to
their original post but if you want to find out in
detail what brands did to meet their business
objectives, grab your free Unmetric trial here.


All data for the time period: June 1st – 30th, 2014
Uncovering the best of Retail Chain sector
With a growth rate of 26%, PetFlow - Pet Food Delivery enjoyed the highest Fan Growth Rate among top 5 Retail Chain Pages.
Among all Retail Chains Pages, The Home Depot was engaging best with its Fans.
Among the top 5 Retail Chain Pages, on an average, 10% of content posted by admins was “brand related”.
Sears Optical grew its fan-base faster than all other Retail Chains Pages.
17,050 new Posts were written across ‘walls’ of the top 5 Retail Chain. That’s an average of 113.7 Posts per day - per wall!
The average Retail Chains Page added 16,995 Fans in the last month.
To discover more insights like these, send us an email and we’ll get you started on a free trial of Unmetric.

All data for the time period: June 1st – 30th, 2014
Uncovering the best of Television sector
Among the top 5 Television Pages, House was engaging best with their Fans.
Among all Television Pages, True Detective was engaging best with its Fans.
The Strain grew its fan-base faster than all other Television Pages.
With a growth rate of 1.5%, The Walking Dead enjoyed the highest Fan Growth Rate among the Top 5 Television Pages.
The average Television Page added 42,355 Fans in June.
3,620 new Posts were written across the walls of the top 5 Television Pages. That’s an average of 24.1 Posts per day - per wall!
To discover more insights like these, send us an email and we’ll get you started on a free trial of Unmetric.

Understanding Selected
Top Brands
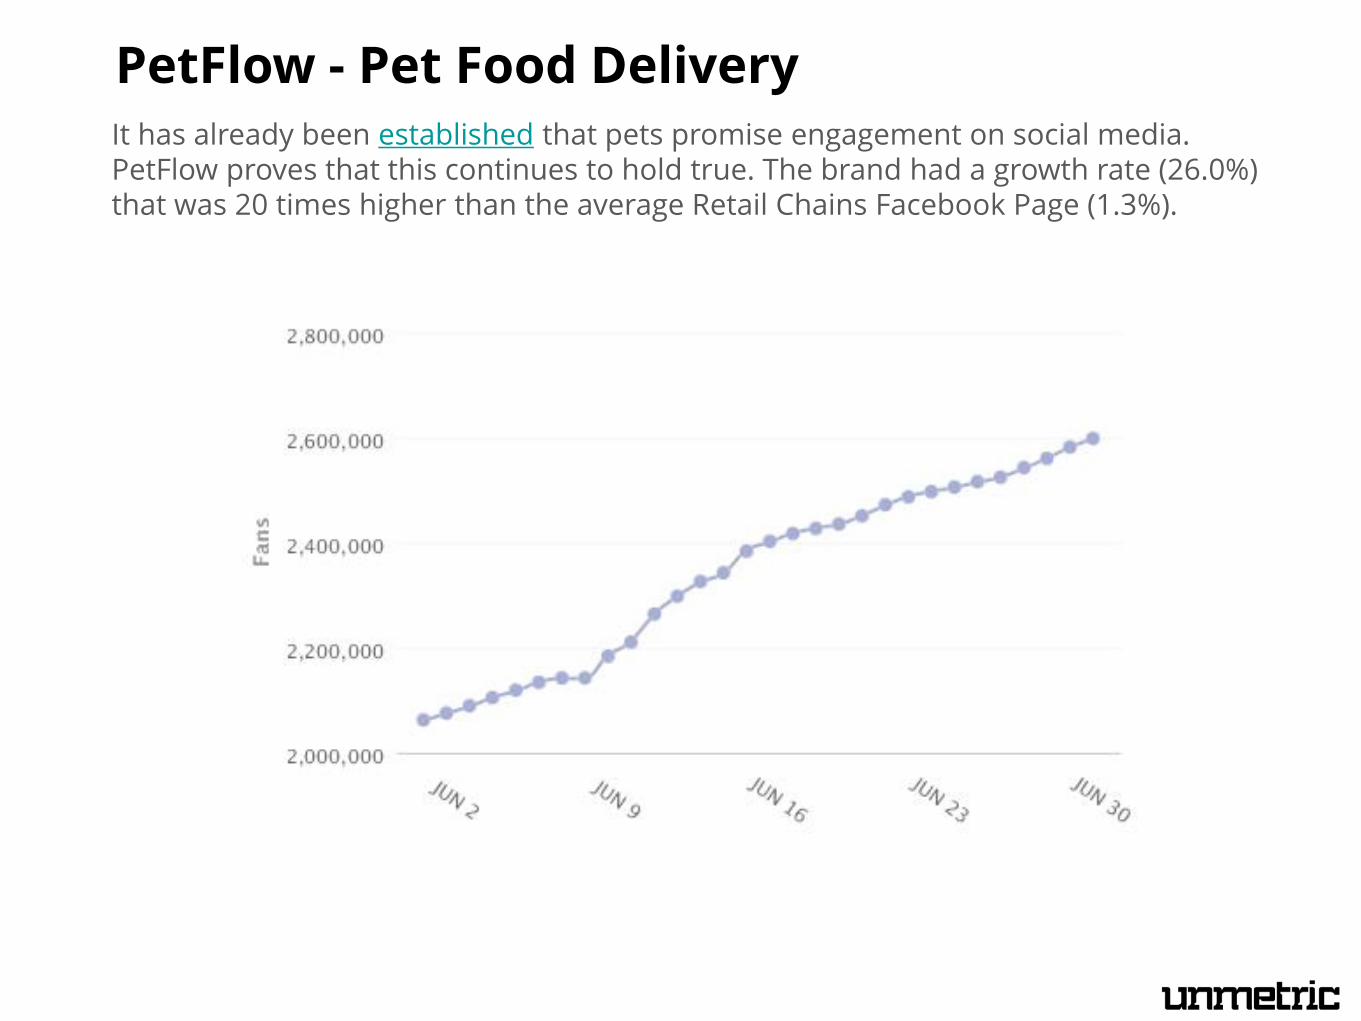
It has already been established that pets promise engagement on social media. PetFlow proves that this continues to hold true. The brand had a growth rate (26.0%) that was 20 times higher than the average Retail Chains Facebook Page (1.3%).
PetFlow - Pet Food Delivery

The popular show added 439,614 new fans in June, which was at a higher growth rate (1.5%) than the average Television Page (1.0%). The majority of these fans are from the US although a fair portion of fans are from across the world.
The Walking Dead
1
2
1
2


All data for the time period: June 1st – 30th, 2014
Uncovering the best of Alcohol sector
The average Alcohol Brand added 654 Followers in June.
@Newcastle grew its follower-base faster than all other Alcohol Brands.
Among all Alcohol brands, @Keystone_Beer Replies slowest to their Customers' Tweets.
Among all Alcohol brands, @bowmore1779 Replies fastest to their Customers' Tweets.
Among the top 10 Alcohol brands, @Budweiser Retweets the most - 62% of their Tweets are Retweets.
With a growth rate of 194%, @Newcastle enjoyed the highest Follower Growth Rate among the top 10 Alcoholic brands.
To discover more insights like these, send us an email and we’ll get you started on a free trial of Unmetric.
All data for the time period: June 1st – 30th, 2014
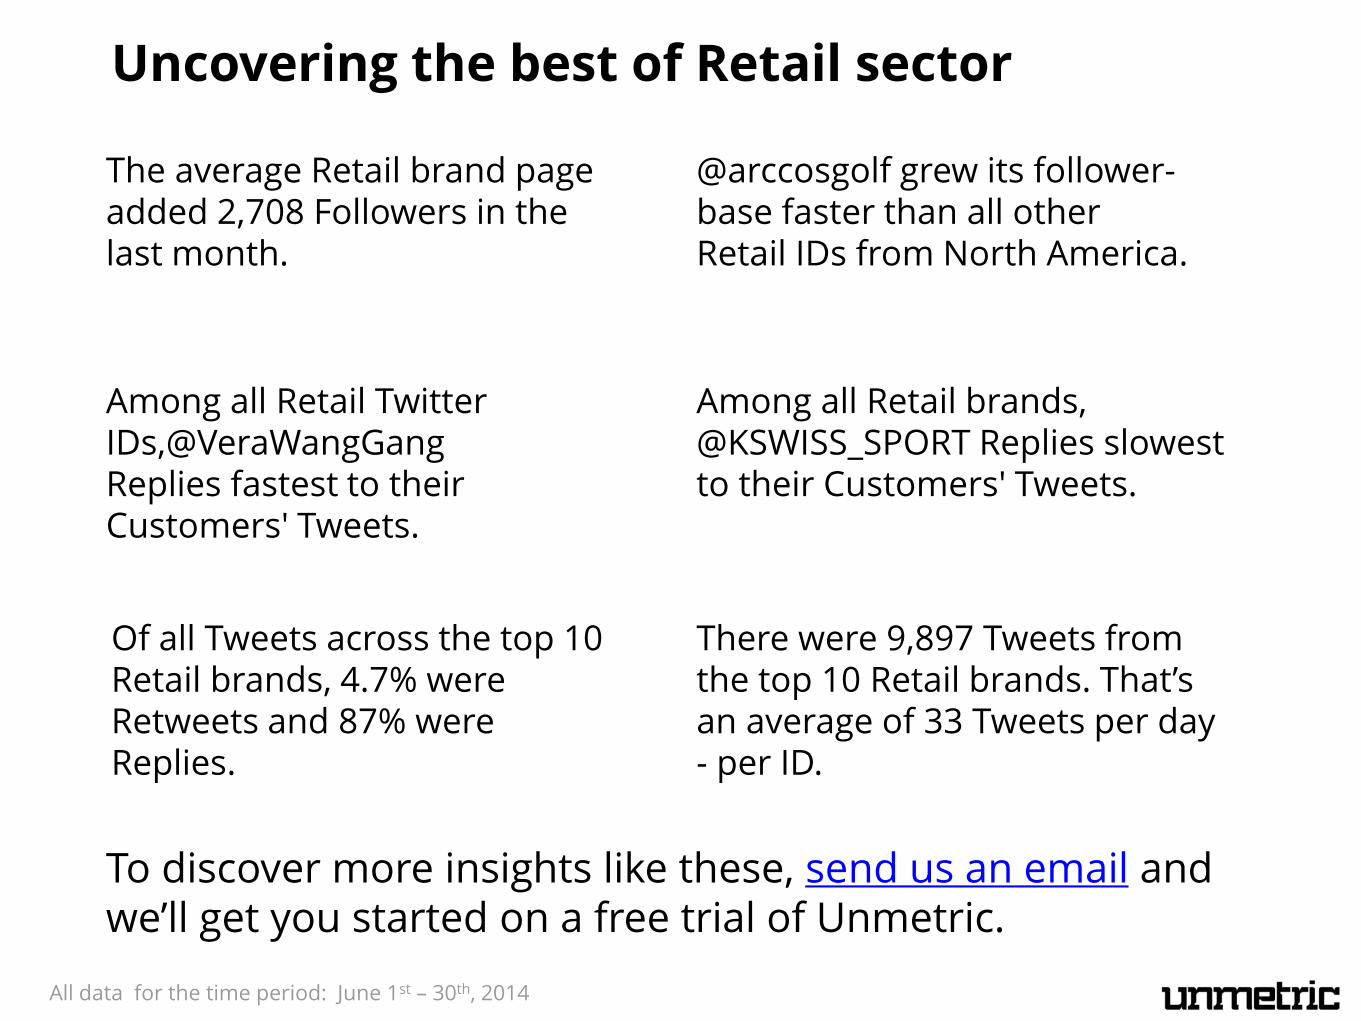
Uncovering the best of Retail sector
The average Retail brand page added 2,708 Followers in the last month.
@arccosgolf grew its follower-base faster than all other Retail IDs from North America.
Among all Retail brands, @KSWISS_SPORT Replies slowest to their Customers' Tweets.
Among all Retail Twitter IDs,@VeraWangGang Replies fastest to their Customers' Tweets.
There were 9,897 Tweets from the top 10 Retail brands. That’s an average of 33 Tweets per day - per ID.
Of all Tweets across the top 10 Retail brands, 4.7% were Retweets and 87% were Replies.
To discover more insights like these, send us an email and we’ll get you started on a free trial of Unmetric.

SO
Understanding Selected
Top Brands

Miller Lite got social with its hashtag #ItsMillerTime. With just 9 tweets, the brand got its Twitter community to use the hashtag over 127,000 times.
Miller Lite - #ItsMillerTime
Thanks to the successful hashtag, the brand’s Engagement Score* was 10 times that of the sector. Miller Lite was also able to add new followers at a rate of 35% while the rest of the sector grew at a much slower 5%.
*See appendix to understand how Engagement Scores are calculated.

What performed best for Nike Soccer was their #RiskEverything campaign. This post received the most Favorites and Retweets.
Nike Soccer - Risk Everything
Capitalizing on the World Cup was an obvious success for Nike Soccer. The brand received the highest Engagement Score* amongst the top 10 brands of the Retail Sector.
*See appendix to understand how Engagement Scores are calculated.


All data for the time period: June 1st – 30th, 2014
Uncovering the best of Insurance sector
With a growth rate of 74%, Allianz grew its View Count faster than all other Insurance brands.
Allianz grew its Subscriber Base faster than all other Insurance brands.
The average Insurance YouTube Channel added 73,035 Views in the last month.
The average Insurance YouTube Channel added 89 Subscribers in the last month.
The average length of a Video of Insurance YouTube Channels is 3mins, 38secs
To discover more insights like these, send us an email and we’ll get you started on a free trial of Unmetric.

All data for the time period: June 1st – 30th, 2014
Uncovering the best of Retail Chain sector
With a growth rate of 101%, Price Chopper grew its View Count faster than all other Retail Chains brands.
Sleep Number grew its Subscriber Base faster than all other Retail Chains brands.
The average Retail Chains YouTube Channel added 175,065 Views in the last month.
The average Retail Chains YouTube Channel added 321 Subscribers in the last month.
The average length of a Video of Retail Chains YouTube Channels is 3mins, 28secs.
To discover more insights like these, send us an email and we’ll get you started on a free trial of Unmetric.

SO
Understanding Selected
Top Brands

Allstate Insurance uploaded the most videos in June. While the average brand from the sector uploaded only 7 videos, Allstate uploaded 66. Football themed videos gained the most views.
Allstate Insurance – Uploads
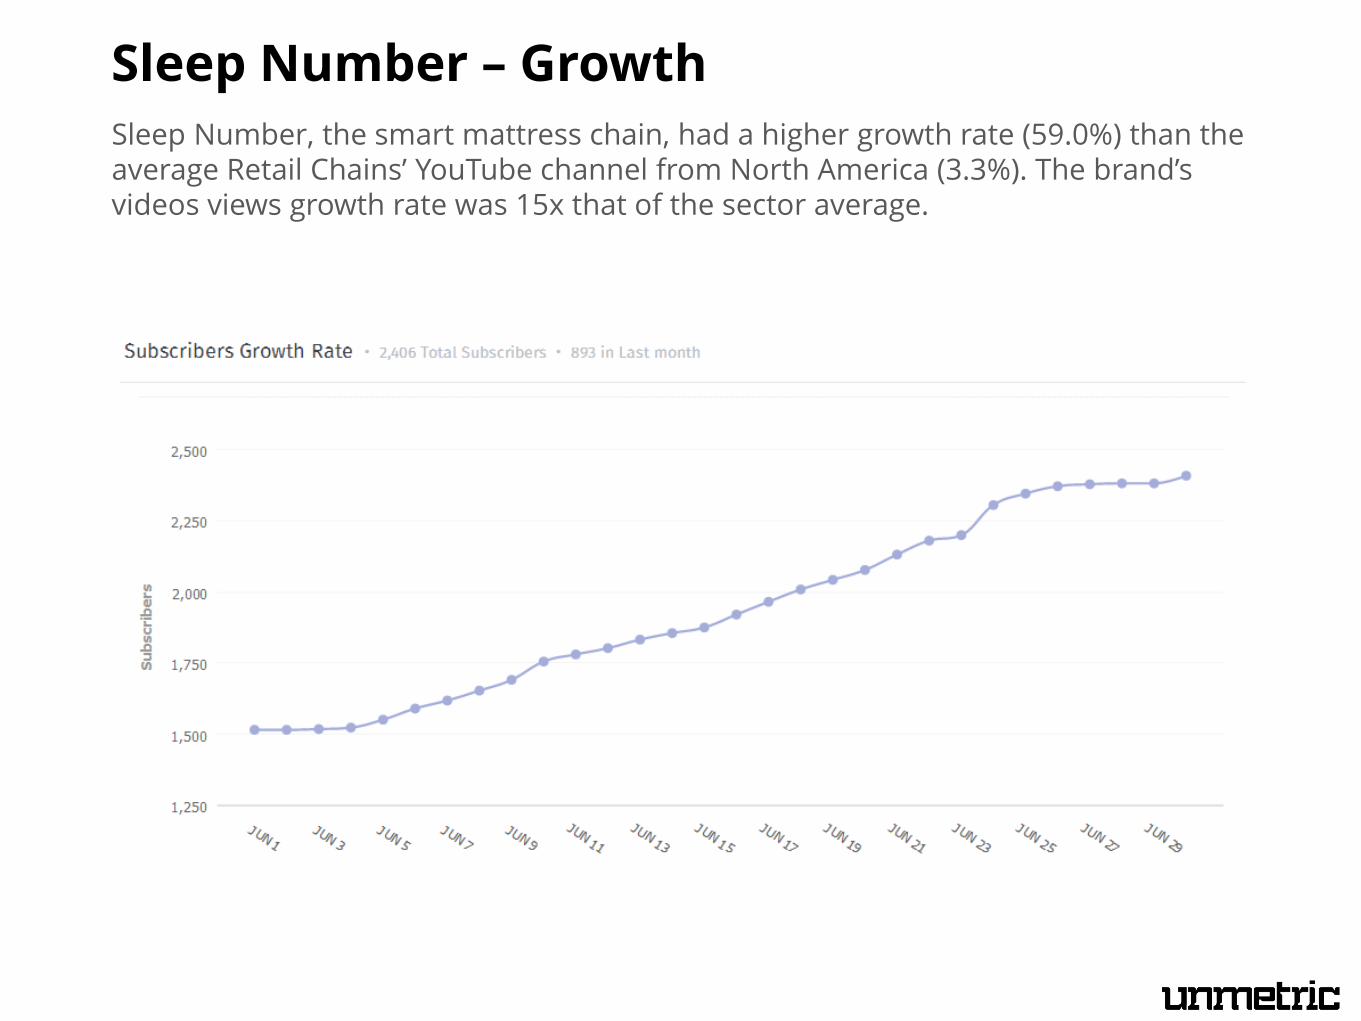
Sleep Number, the smart mattress chain, had a higher growth rate (59.0%) than the average Retail Chains’ YouTube channel from North America (3.3%). The brand’s videos views growth rate was 15x that of the sector average.
Sleep Number – Growth


Uncovering the best of the Restaurant sector
With a growth rate of 34%, Noodles & Company grew its follower-base faster than all other Restaurant brands.
With 99 Posts, Shakeshack published the most number of media among all Restaurant brands.
On an average, the brands in Restaurant Sector, posted 64 Videos and 1,574 Images.
Among the media posted by brands in Restaurant Sector, the Engagement Score of videos (893) was better than that of photos (887).
Among all the photo Posts by Restaurant Sector brands, the Lo-fi filter type was used the most.
Among all the photo Posts by Restaurant Sector brands, the Hudson filter type had the best engagement.
To discover more insights like these, send us an email and we’ll get you started on a free trial of Unmetric.
All data for the time period: June 1st – 30th , 2014
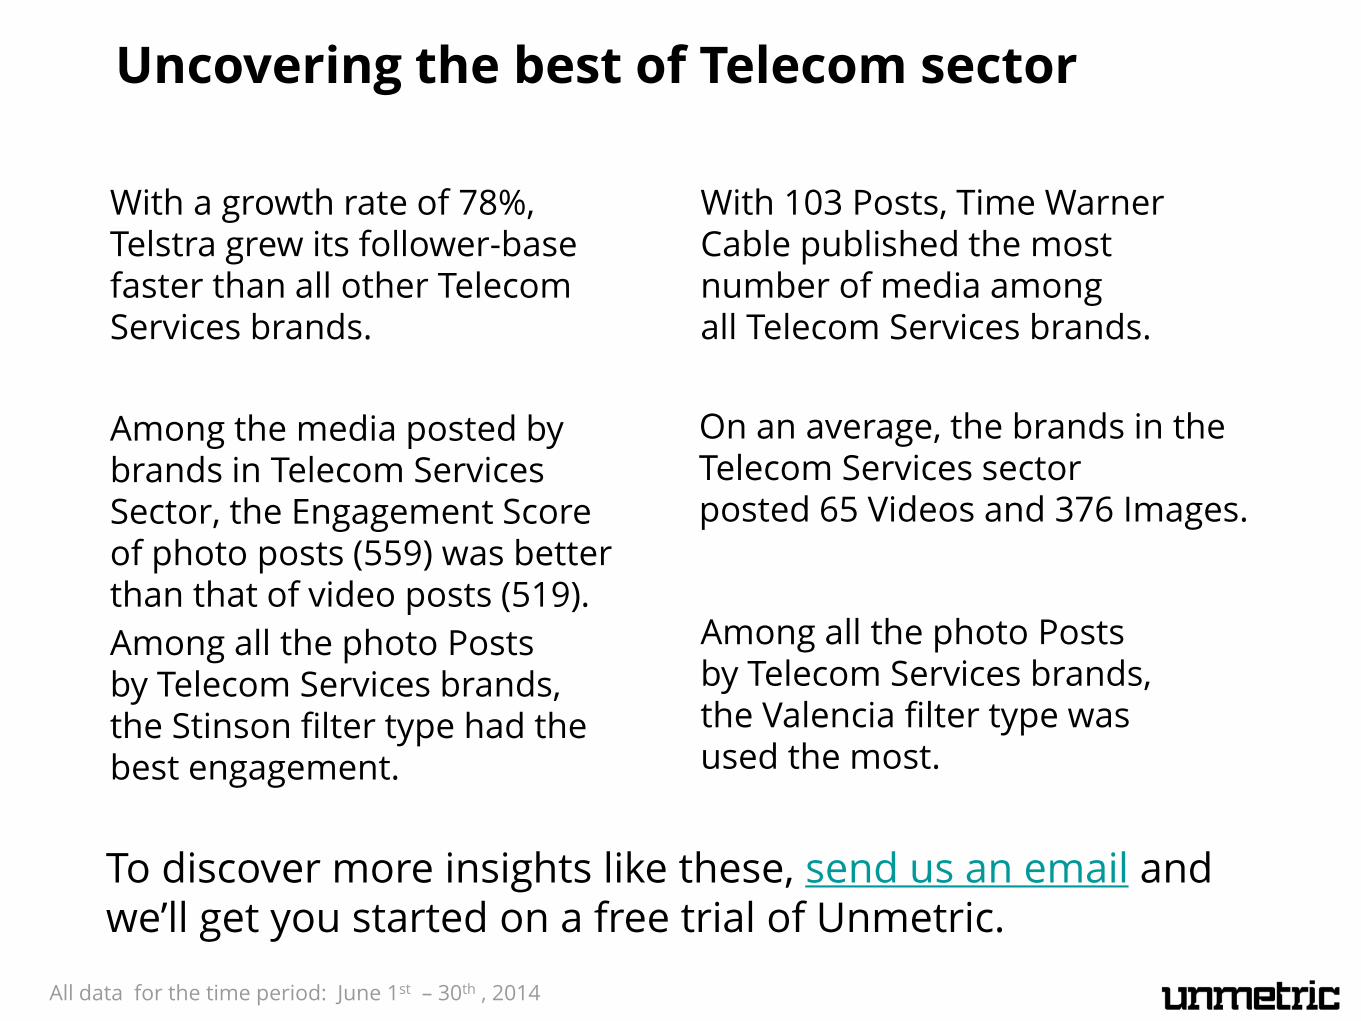
Uncovering the best of Telecom sector
With a growth rate of 78%, Telstra grew its follower-base faster than all other Telecom Services brands.
With 103 Posts, Time Warner Cable published the most number of media among all Telecom Services brands.
On an average, the brands in the Telecom Services sector posted 65 Videos and 376 Images.
Among the media posted by brands in Telecom Services Sector, the Engagement Score of photo posts (559) was better than that of video posts (519).
Among all the photo Posts by Telecom Services brands, the Valencia filter type was used the most.
Among all the photo Posts by Telecom Services brands, the Stinson filter type had the best engagement.
To discover more insights like these, send us an email and we’ll get you started on a free trial of Unmetric.
All data for the time period: June 1st – 30th , 2014

All data for the time period: April 1st – 30th, 2014
Understanding Selected
Top Brands

The QSR brand post 29 times in June and the brand’s #yum was the most engaging hashtag of the sector. Other than engaging well above sector average, the brand also experienced the second highest follower growth rate of 17%.
Krispy Kreme - #yum
This photo garnered the highest Engagement Score* of 995, which is higher than the Engagement Score of the brand (928), and of the average Restaurant and Café Instagram Account (763).
*See appendix to understand how Engagement Scores are calculated.

YES Network posted 83 times in the month of June and garnered the second highest Engagement Score of 674. With just 14 posts, Telstra received the highest Engagement Score of 997.
YES Network - Likes and Comments
The telecom brand received the most Likes and Comments in the month.


Uncovering the best of Auto sector
With a growth rate of 3%, Chevrolet enjoyed the highest Follower Growth Rate among the top 5 Automotive brands.
With a growth rate of 50%, Turtle Wax grew its follower-base fastest among all other Automotive brands.
The average Automotive brand added 72 followers in June. JEGS Performance added the highest number of Followers.
With a growth rate of 3.6%, Chevrolet added Pins at the highest rate among the top 5 Automotive brands.
The average Automotive brand added 11 pins June. Turtle Wax added the highest number of Pins.
The top 5 Automotive brands added a total of 494 Followers in June.
To discover more insights like these, send us an email and we’ll get you started on a free trial of Unmetric.
All data for the time period: June 1st – 30th , 2014
All data for the time period: June 1st – 30th , 2014
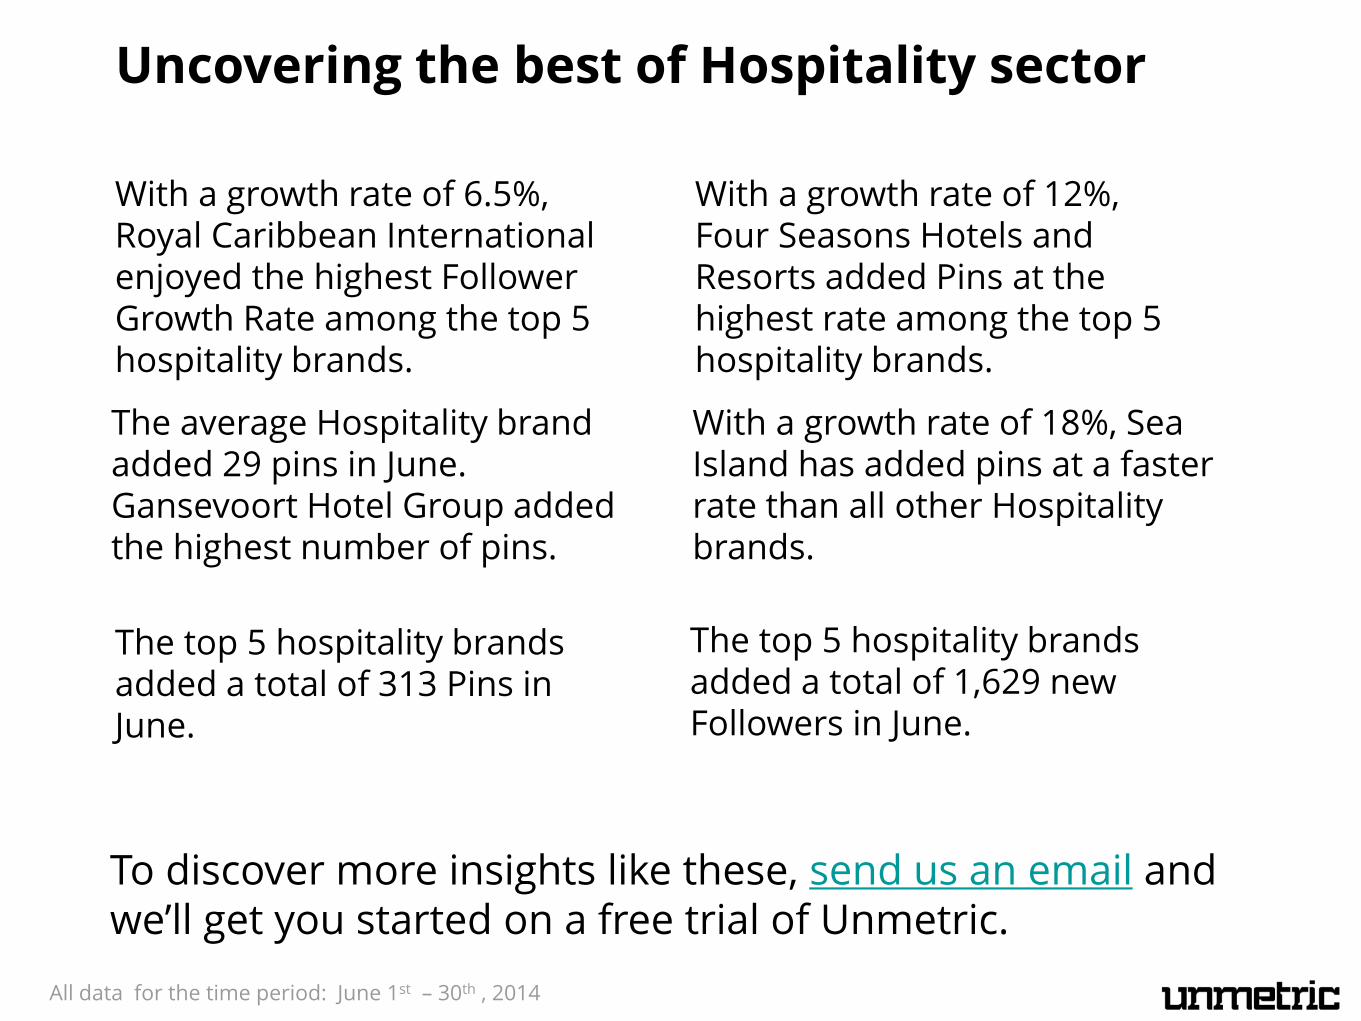
With a growth rate of 6.5%, Royal Caribbean International enjoyed the highest Follower Growth Rate among the top 5 hospitality brands.
With a growth rate of 12%, Four Seasons Hotels and Resorts added Pins at the highest rate among the top 5 hospitality brands.
With a growth rate of 18%, Sea Island has added pins at a faster rate than all other Hospitality brands.
The average Hospitality brand added 29 pins in June. Gansevoort Hotel Group added the highest number of pins.
The top 5 hospitality brands added a total of 1,629 new Followers in June.
Uncovering the best of Hospitality sector
To discover more insights like these, send us an email and we’ll get you started on a free trial of Unmetric.
The top 5 hospitality brands added a total of 313 Pins in June.

SO
Understanding Selected
Top Brands

The auto giant lets its social side shine on Pinterest with boards like ‘Chevy Memes’ and ‘Family Fun’. However it was their ‘Design’ board, which highlights Chevy vehicles, which added the highest number of Subscribers last month, and had the most number of re-pins.
Chevrolet
In June, Chevrolet had a Growth Rate which was 3.6 times higher than the average Automotive Pinterest Account.

The cruise line’s Caribbean themed board ‘Love from the Caribbean’ had the most number of Pins and the highest ratio of Re-pins to Pins in June.
Royal Caribbean International
*Owned boards are boards where only the brand has permission to upload pins
With 6,990 Re-pins in the last month on its owned Boards, Royal Caribbean International had a Growth Rate (17%) that was 5 times higher than the average Hospitality Pinterest Account (3.1%)

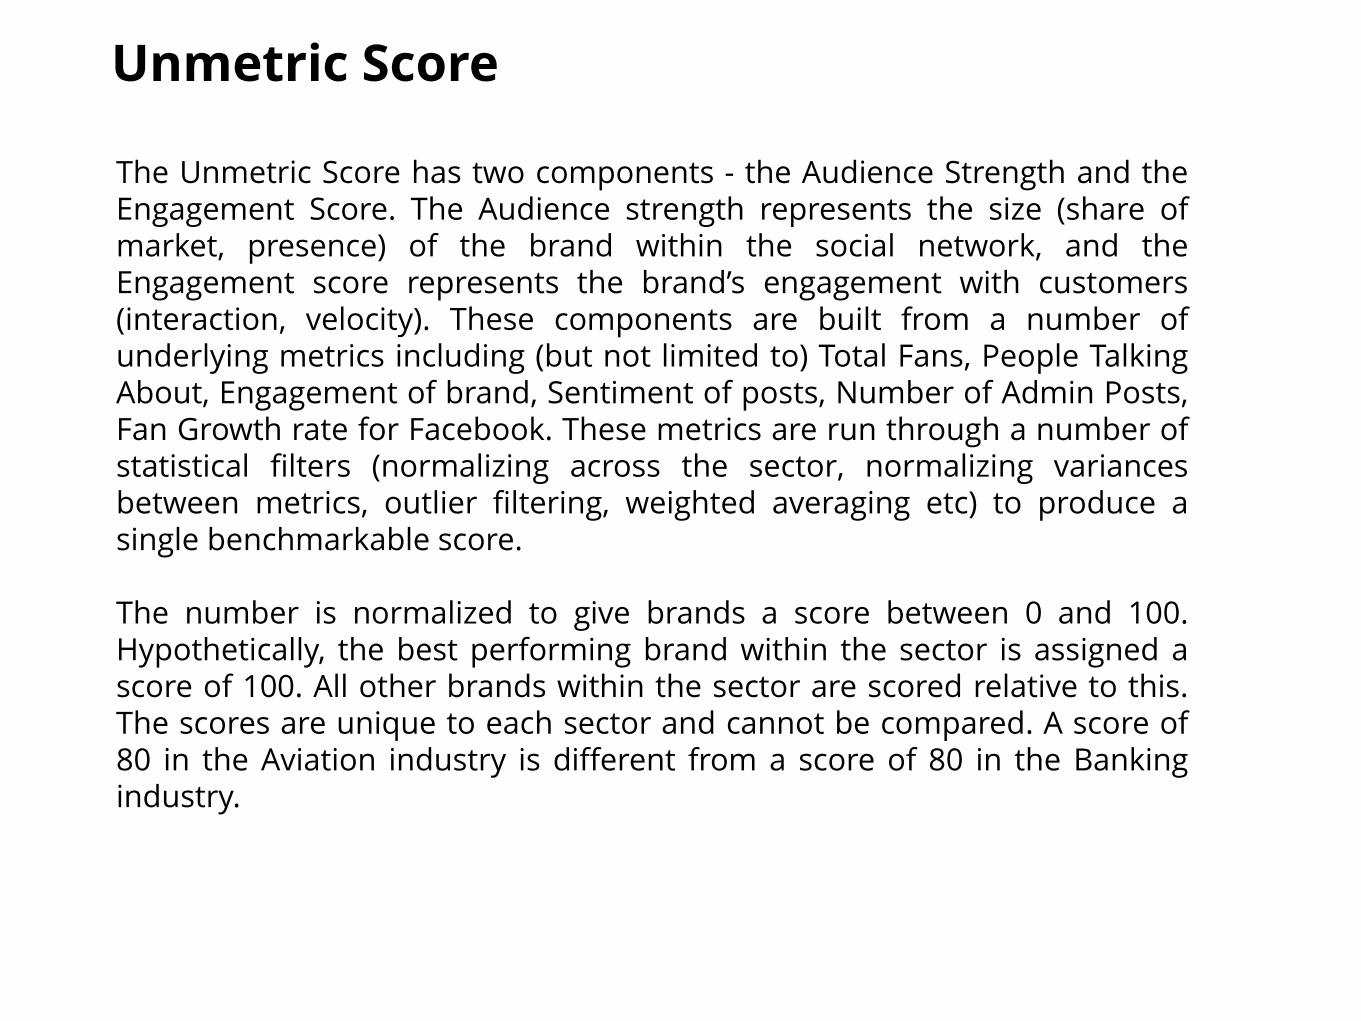
The Unmetric Score has two components - the Audience Strength and the Engagement Score. The Audience strength represents the size (share of market, presence) of the brand within the social network, and the Engagement score represents the brand’s engagement with customers (interaction, velocity). These components are built from a number of underlying metrics including (but not limited to) Total Fans, People Talking About, Engagement of brand, Sentiment of posts, Number of Admin Posts, Fan Growth rate for Facebook. These metrics are run through a number of statistical filters (normalizing across the sector, normalizing variances between metrics, outlier filtering, weighted averaging etc) to produce a single benchmarkable score. The number is normalized to give brands a score between 0 and 100. Hypothetically, the best performing brand within the sector is assigned a score of 100. All other brands within the sector are scored relative to this. The scores are unique to each sector and cannot be compared. A score of 80 in the Aviation industry is different from a score of 80 in the Banking industry.
Unmetric Score

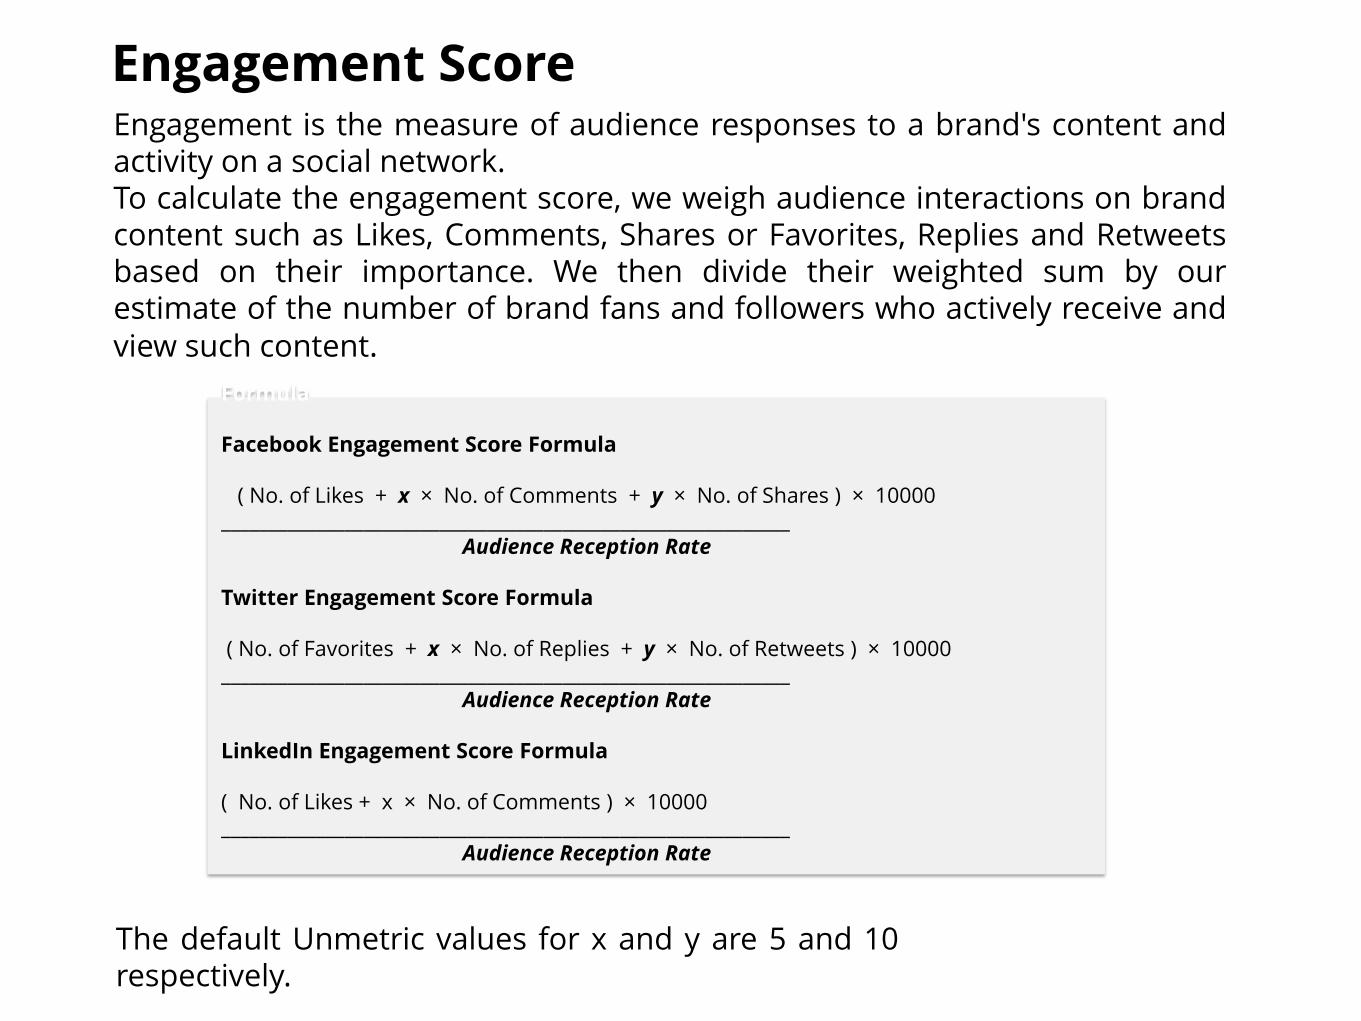
Formula Facebook Engagement Score Formula ( No. of Likes + x × No. of Comments + y × No. of Shares ) × 10000 ____________________________________________________________ Audience Reception Rate Twitter Engagement Score Formula ( No. of Favorites + x × No. of Replies + y × No. of Retweets ) × 10000 ____________________________________________________________ Audience Reception Rate LinkedIn Engagement Score Formula ( No. of Likes + x × No. of Comments ) × 10000 ____________________________________________________________ Audience Reception Rate
Engagement is the measure of audience responses to a brand's content and activity on a social network. To calculate the engagement score, we weigh audience interactions on brand content such as Likes, Comments, Shares or Favorites, Replies and Retweets based on their importance. We then divide their weighted sum by our estimate of the number of brand fans and followers who actively receive and view such content.
Engagement Score
The default Unmetric values for x and y are 5 and 10 respectively.

The Audience Reception Rate (ARR) is the Unmetric estimate of the number of brand fans/followers who stand to actively receive and view a brand's content.. The formula you see below calculates the Audience Reception Rate as a function of the number of brand fans/followers raised to a fixed power value of 0.8.
Audience Reception Rate = (Fans or Followers) 0.8
Engagement Score Audience Reception Rate

Click here if you’d like to use Unmetric to better understand what your competitors are doing, uncover compelling insights and unlock new strategies for success by claiming a free 6 day trial.

The Unmetric Score has two components - the Audience Strength and the Engagement Score. The Audience strength represents the size (share of market, presence) of the brand within the social network, and the Engagement score represents the brand’s engagement with customers (interaction, velocity). These components are built from a number of underlying metrics including (but not limited to) Total Fans, People Talking About, Engagement of brand, Sentiment of posts, Number of Admin Posts, Fan Growth rate for Facebook. These metrics are run through a number of statistical filters (normalizing across the sector, normalizing variances between metrics, outlier filtering, weighted averaging etc) to produce a single benchmarkable score. The number is normalized to give brands a score between 0 and 100. Hypothetically, the best performing brand within the sector is assigned a score of 100. All other brands within the sector are scored relative to this. The scores are unique to each sector and cannot be compared. A score of 80 in the Aviation industry is different from a score of 80 in the Banking industry.
Unmetric Score
Formula Facebook Engagement Score Formula ( No. of Likes + x × No. of Comments + y × No. of Shares ) × 10000 ____________________________________________________________ Audience Reception Rate Twitter Engagement Score Formula ( No. of Favorites + x × No. of Replies + y × No. of Retweets ) × 10000 ____________________________________________________________ Audience Reception Rate LinkedIn Engagement Score Formula ( No. of Likes + x × No. of Comments ) × 10000 ____________________________________________________________ Audience Reception Rate
Engagement is the measure of audience responses to a brand's content and activity on a social network. To calculate the engagement score, we weigh audience interactions on brand content such as Likes, Comments, Shares or Favorites, Replies and Retweets based on their importance. We then divide their weighted sum by our estimate of the number of brand fans and followers who actively receive and view such content.
Engagement Score
The default Unmetric values for x and y are 5 and 10 respectively.

The Audience Reception Rate (ARR) is the Unmetric estimate of the number of brand fans/followers who stand to actively receive and view a brand's content.. The formula you see below calculates the Audience Reception Rate as a function of the number of brand fans/followers raised to a fixed power value of 0.8.
Audience Reception Rate = (Fans or Followers) 0.8
Engagement Score Audience Reception Rate

Click here if you’d like to use Unmetric to better understand what your competitors are doing, uncover compelling insights and unlock new strategies for success by claiming a free 6 day trial.