Social analytics and dashboards
47
Social Analytics & Dahboards Social Media Week Your opportunity to be the company hero
-
Upload
ffw -
Category
Data & Analytics
-
view
212 -
download
0
Transcript of Social analytics and dashboards
Social Analytics & Dahboards Social Media Week
Your opportunity to be the company hero

Who am I?
Morten B lumensaadtDig i ta l S t ra teg is tP ropeop le /Bys ted
mor ten@propeop le .dk+45 22718969
01 Why do Dashboards Rock?
We have many questionsHow are we doing on Facebook? Is our SEO performing? Are we spending our budgets wisely? Should we focus more on paid media? Or less? Is our media agency worth the money we pay?

The answer is in your data
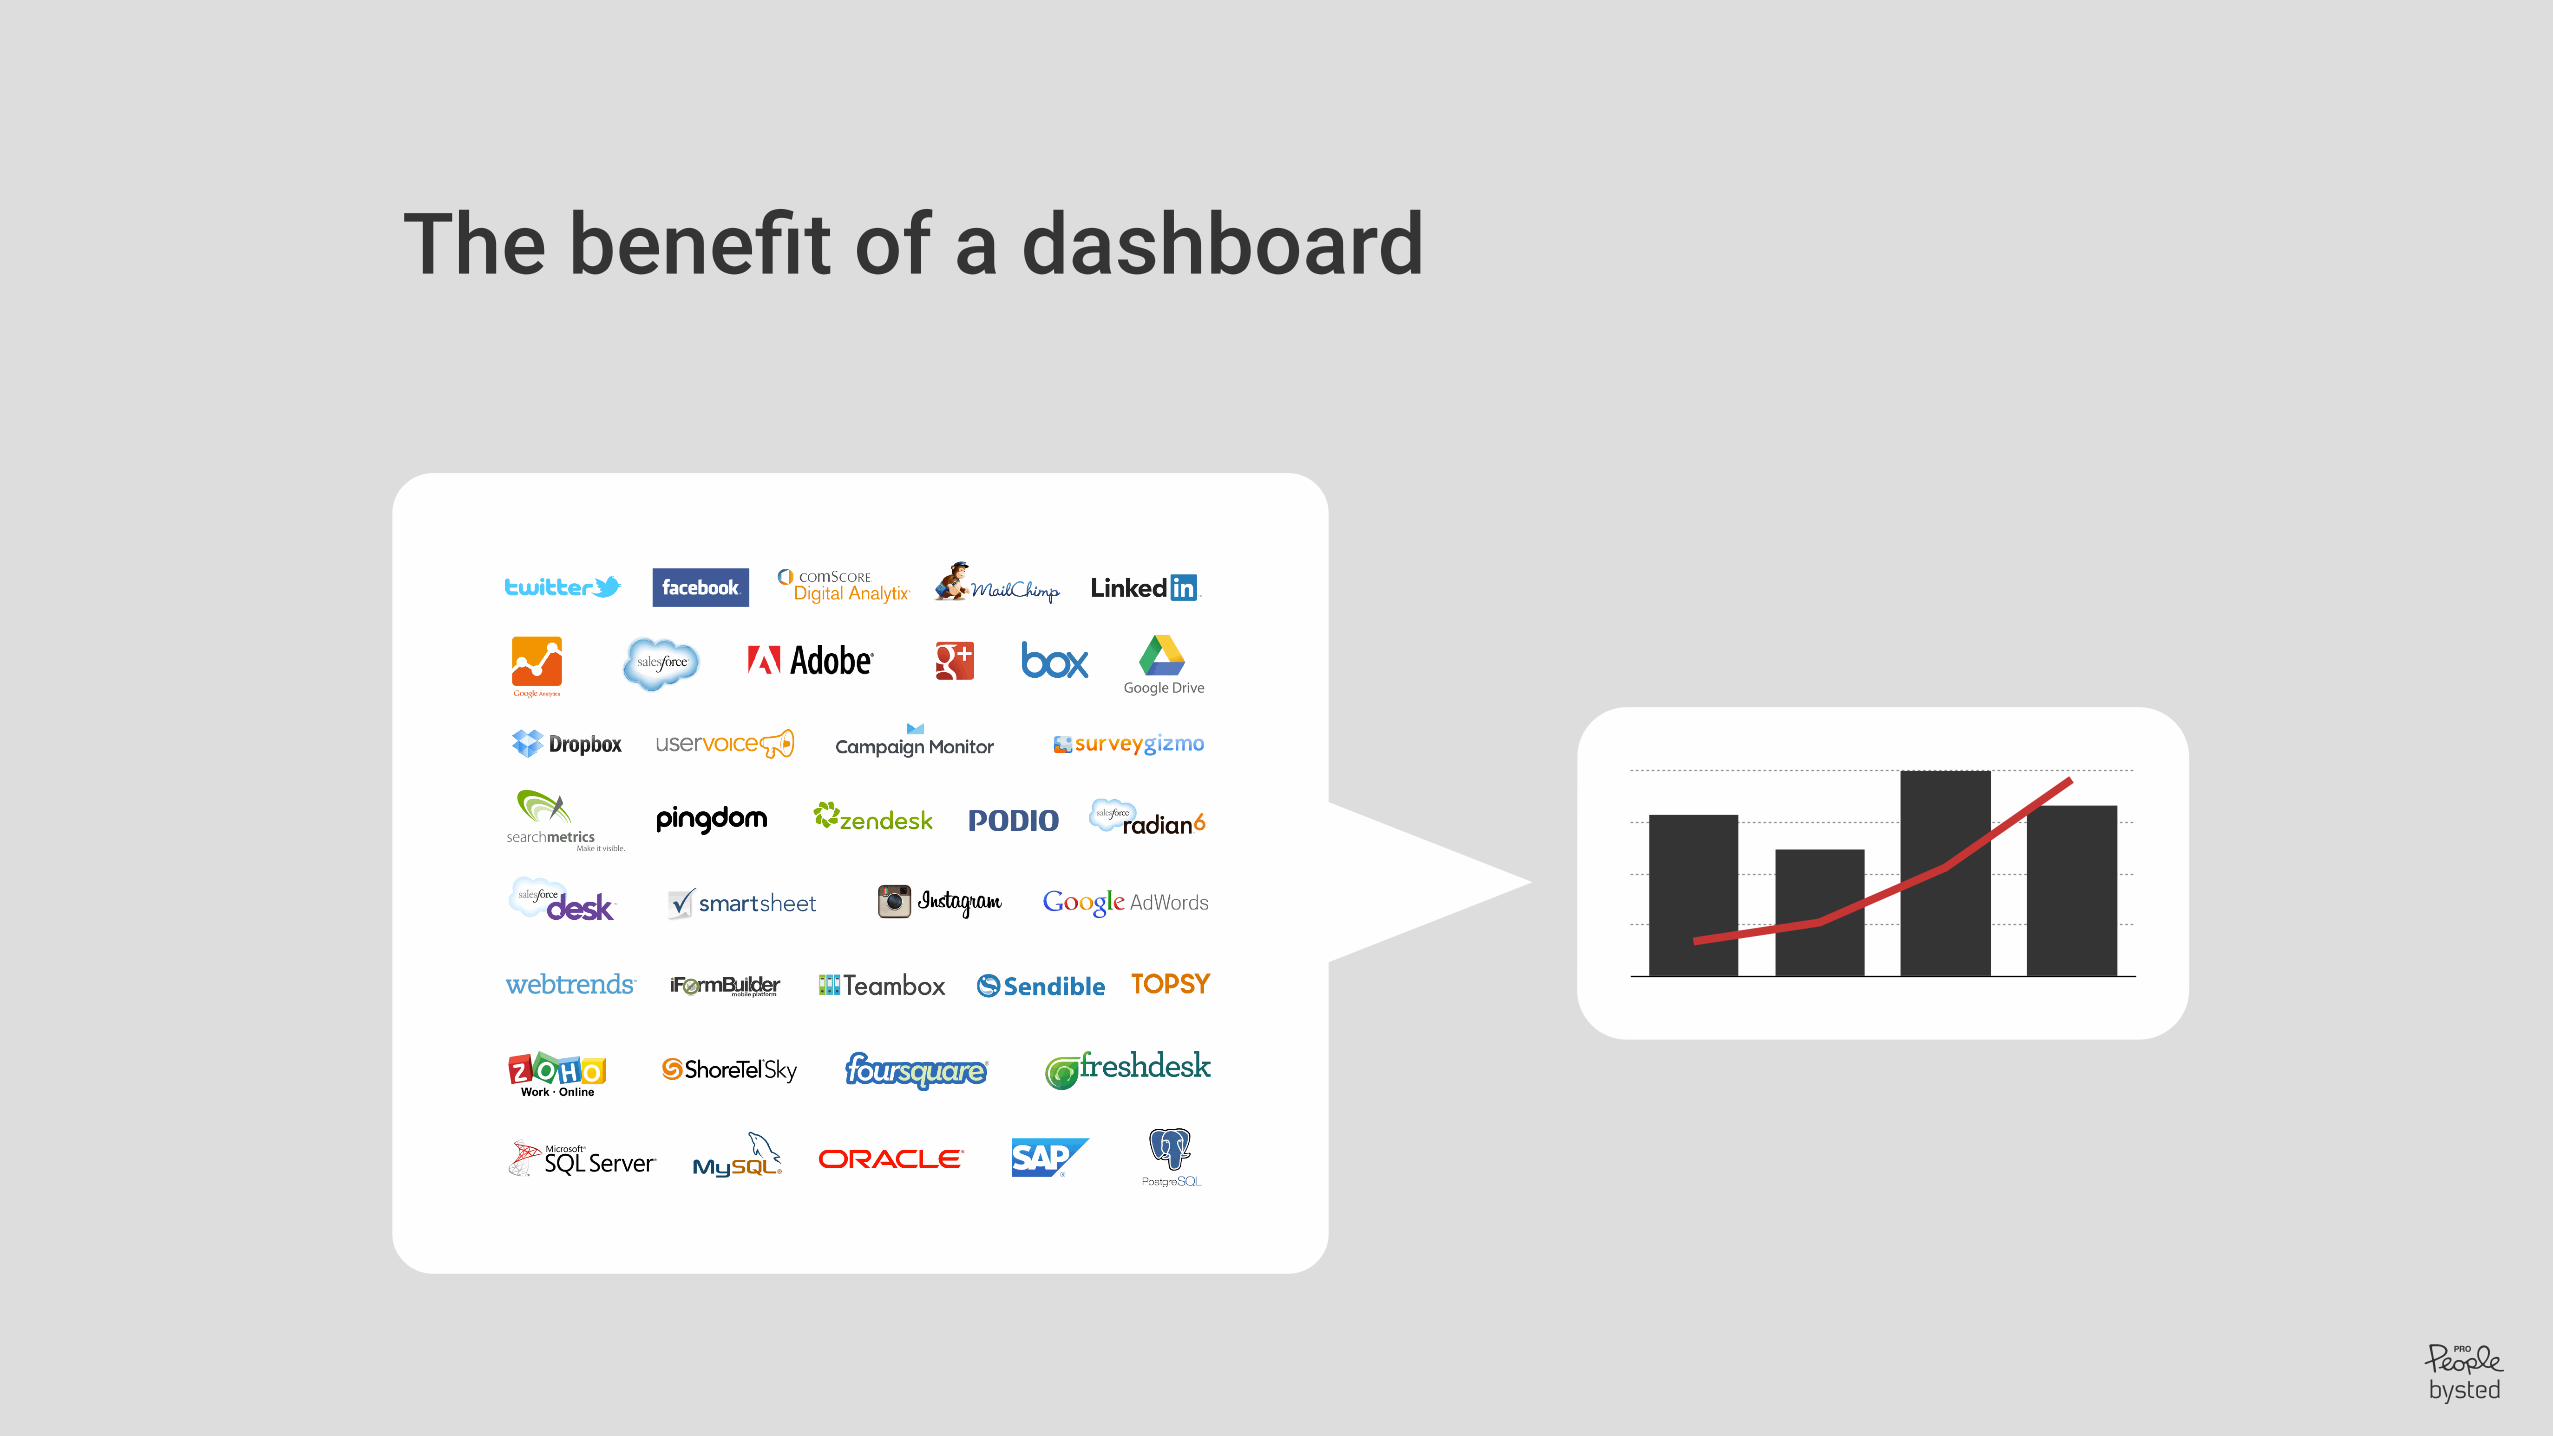
The benefit of a dashboard
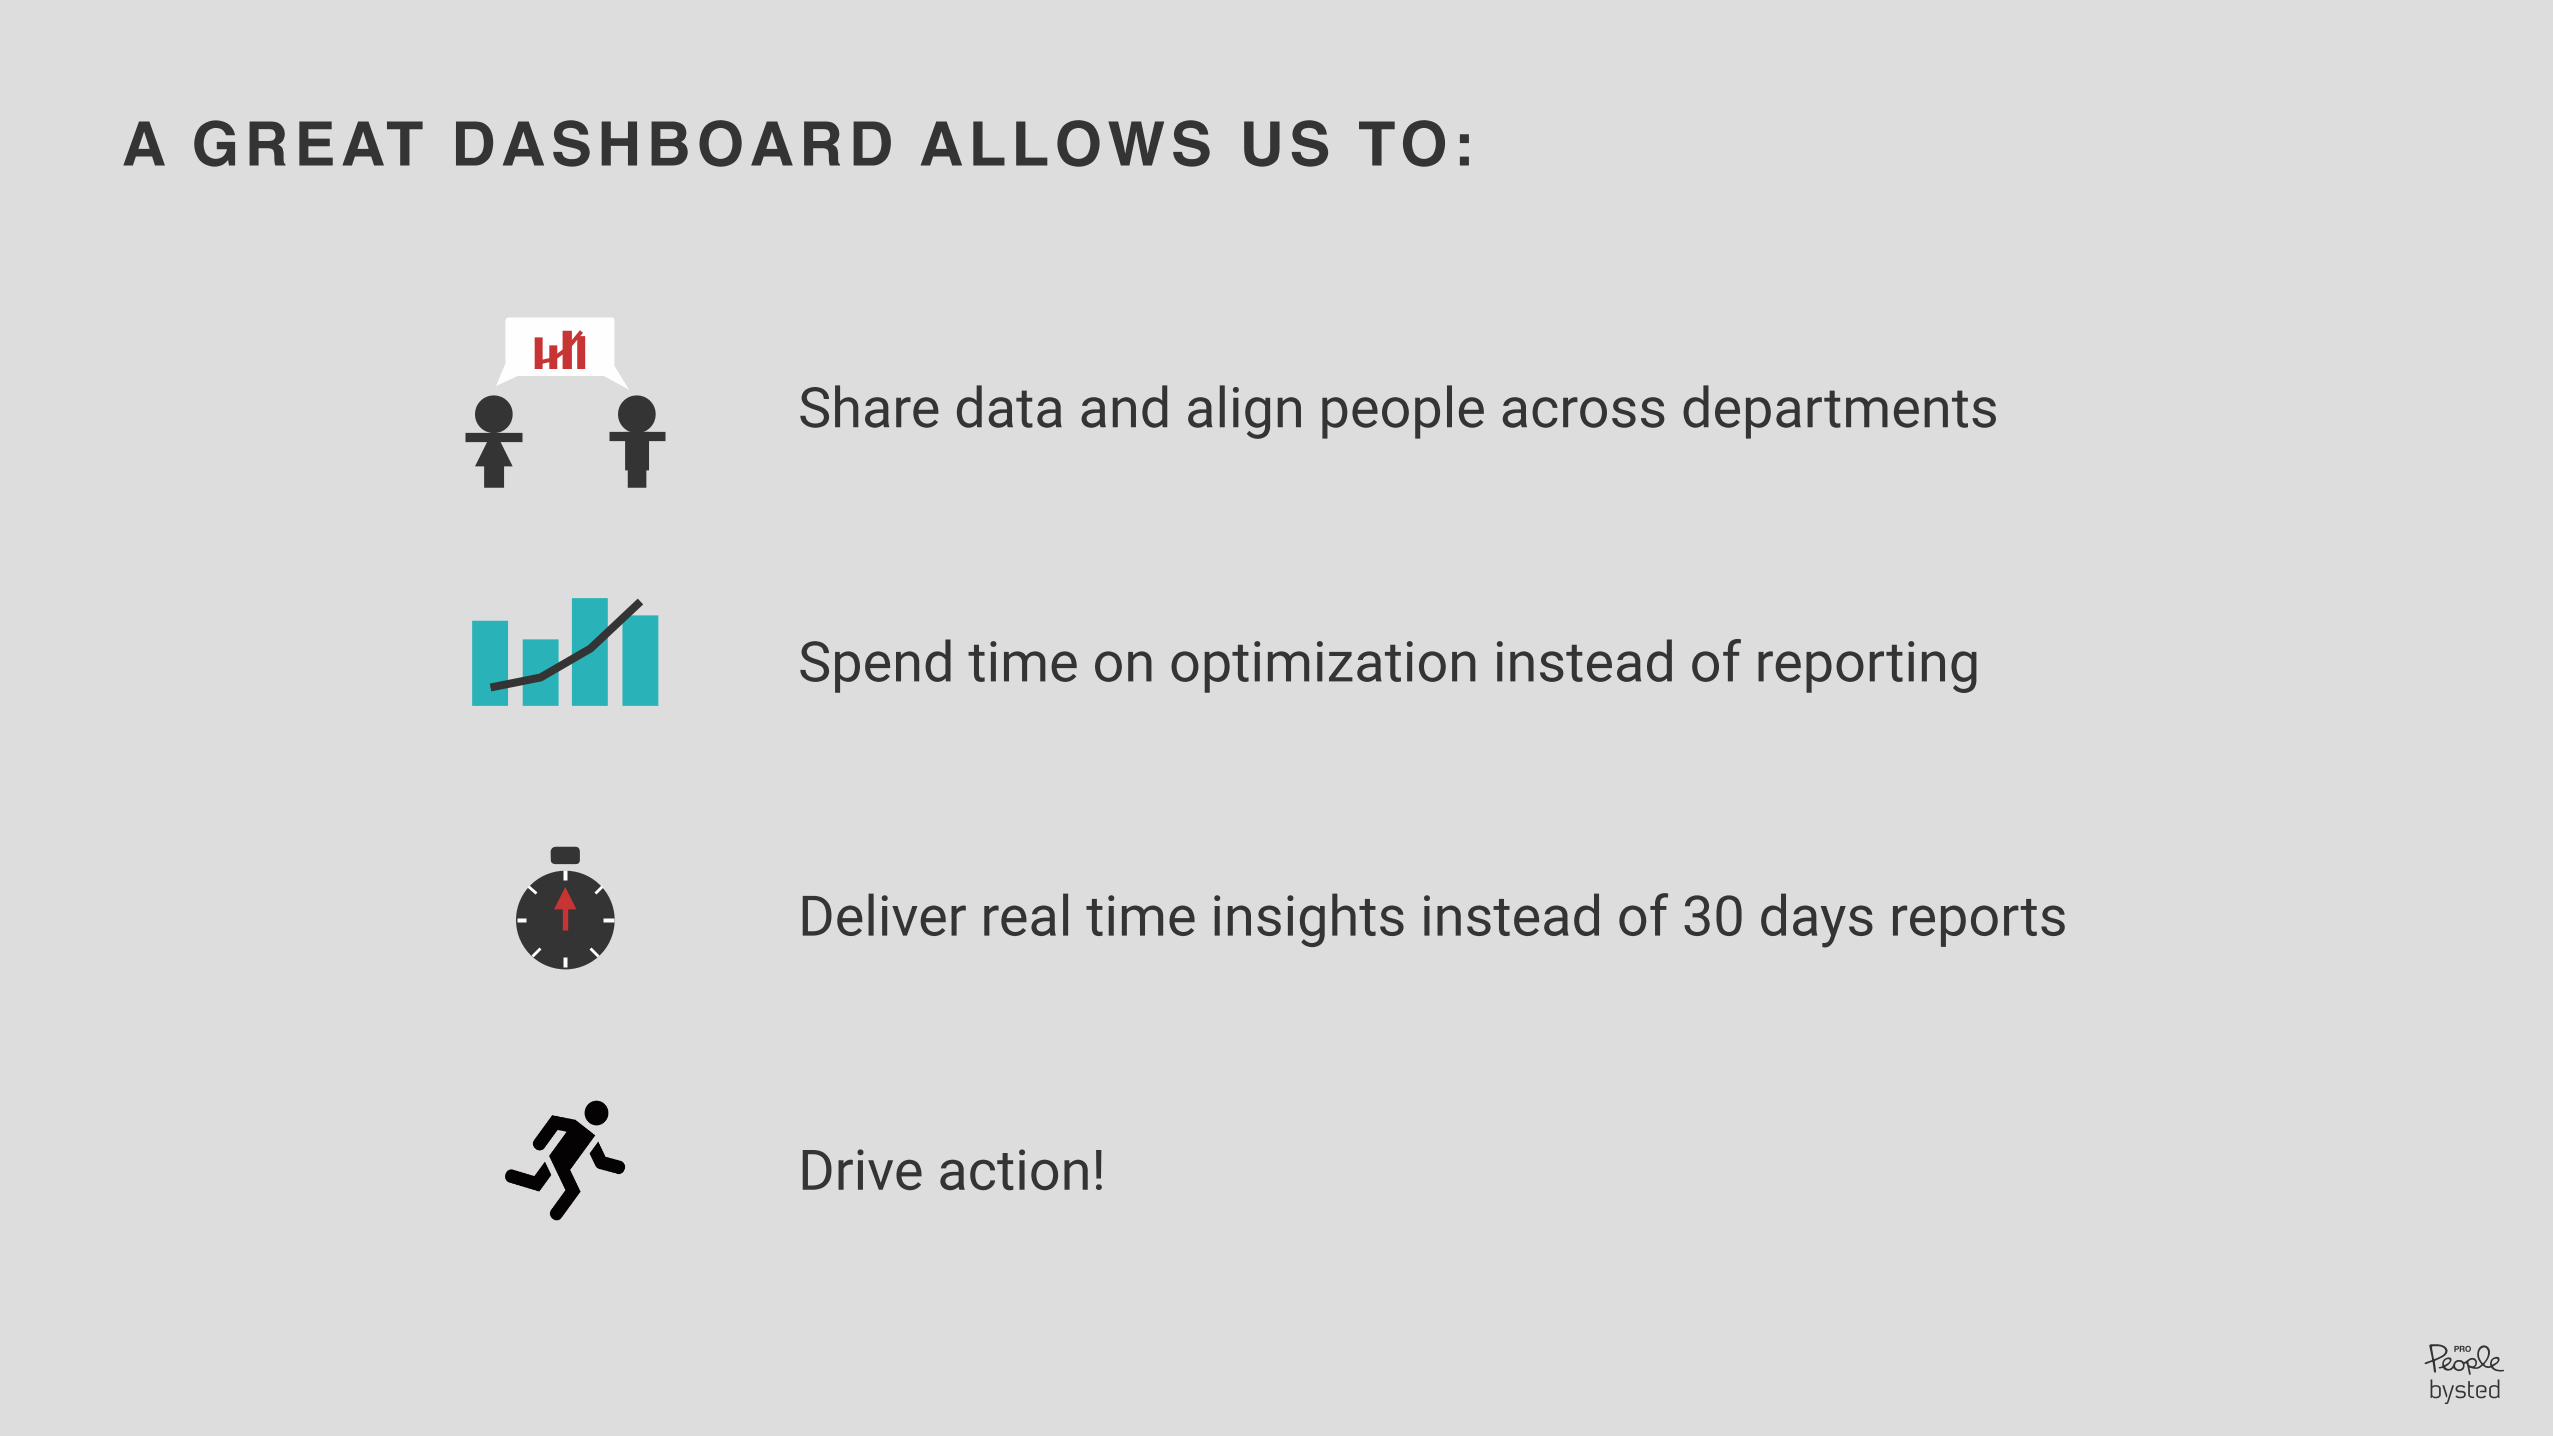
A GREAT DASHBOARD ALLOWS US TO:
Share data and align people across departments
Spend time on optimization instead of reporting
Deliver real time insights instead of 30 days reports
Drive action!
Becoming a hero - tip # 1 The primary purpose of a dashboard is not to inform, and it is not to please. The primary purpose is to drive action!
02 The path to a great dashboard
Who will use the dashboard?The CEO? Marketing? Sales? HR? Analysts? Agencies?
Becoming a hero - tip # 2 Design the dashboard to a specific target group - The CFO doesn’t need to know the bounce rate on mobile devices.

Define the use cases
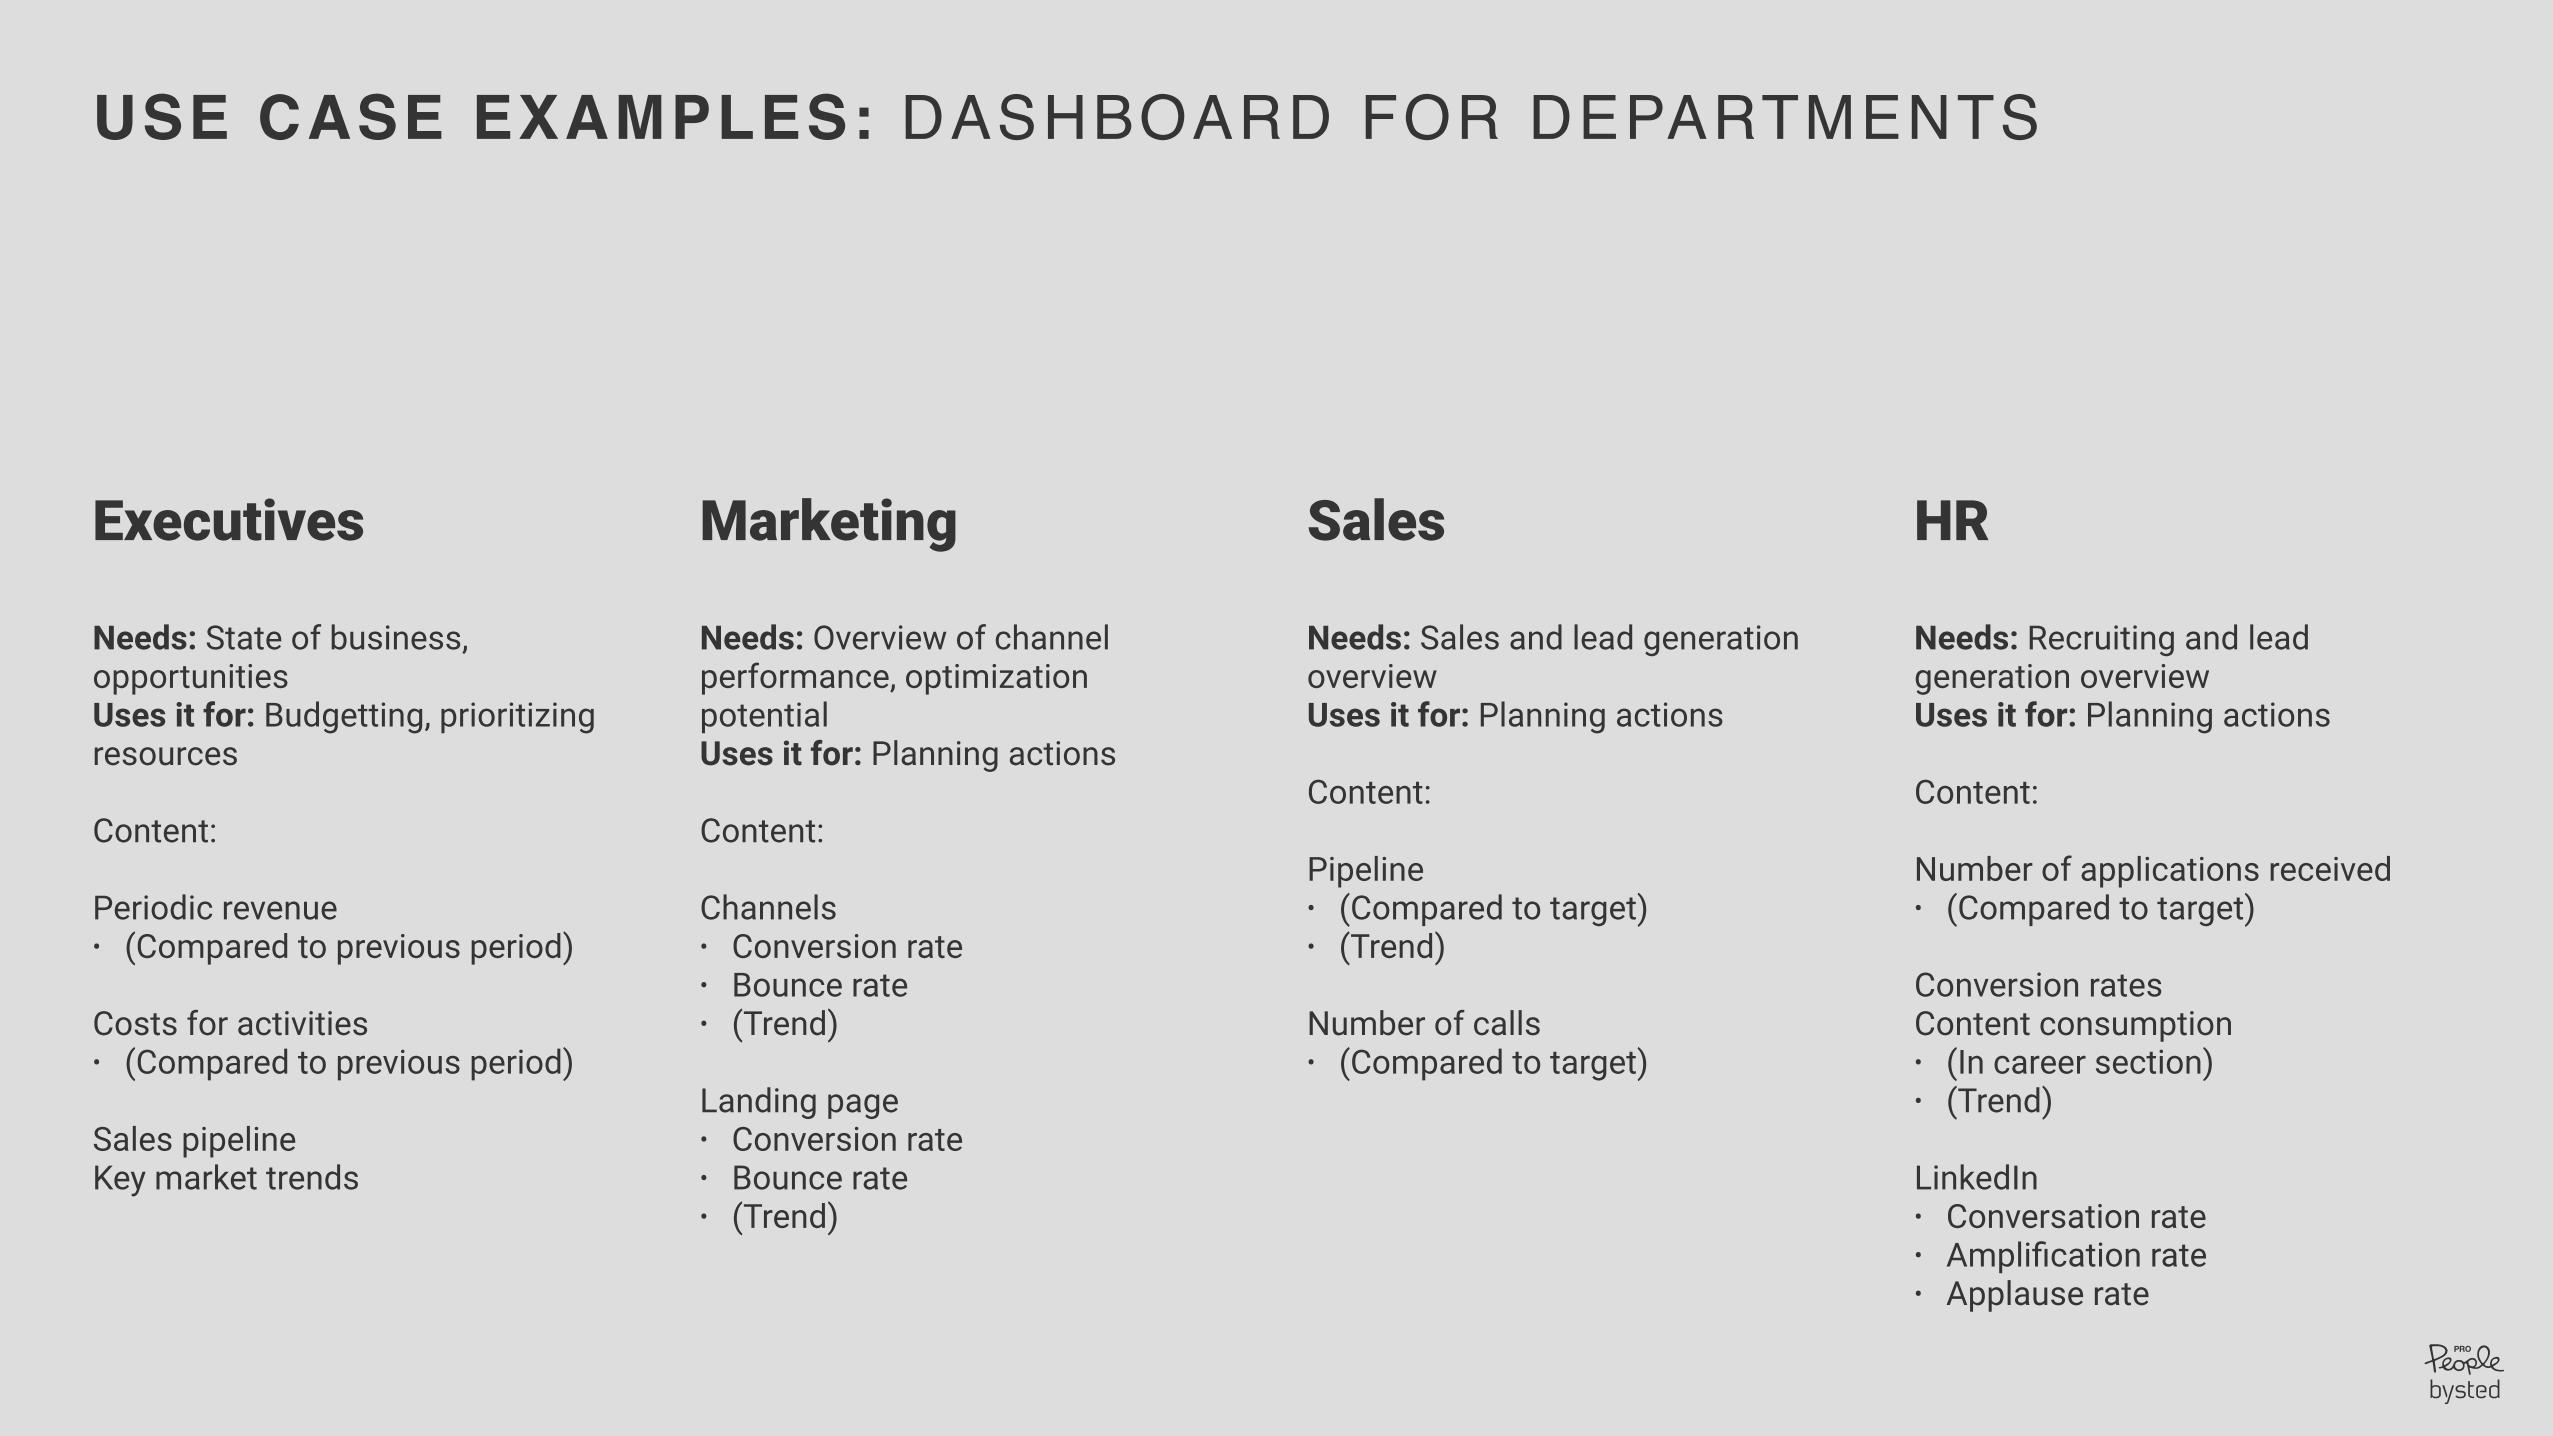
USE CASE EXAMPLES: DASHBOARD FOR DEPARTMENTS
Marketing
Needs: Overview of channel performance, optimization potential Uses it for: Planning actions
Content:
Channels • Conversion rate • Bounce rate • (Trend)
Landing page • Conversion rate • Bounce rate • (Trend)
Executives
Needs: State of business, opportunities Uses it for: Budgetting, prioritizing resources
Content:
Periodic revenue • (Compared to previous period)
Costs for activities • (Compared to previous period)
Sales pipeline Key market trends
Sales
Needs: Sales and lead generation overview Uses it for: Planning actions
Content:
Pipeline • (Compared to target) • (Trend)
Number of calls • (Compared to target)
HR
Needs: Recruiting and lead generation overview Uses it for: Planning actions
Content:
Number of applications received • (Compared to target)
Conversion rates Content consumption • (In career section) • (Trend)
LinkedIn • Conversation rate • Amplification rate • Applause rate
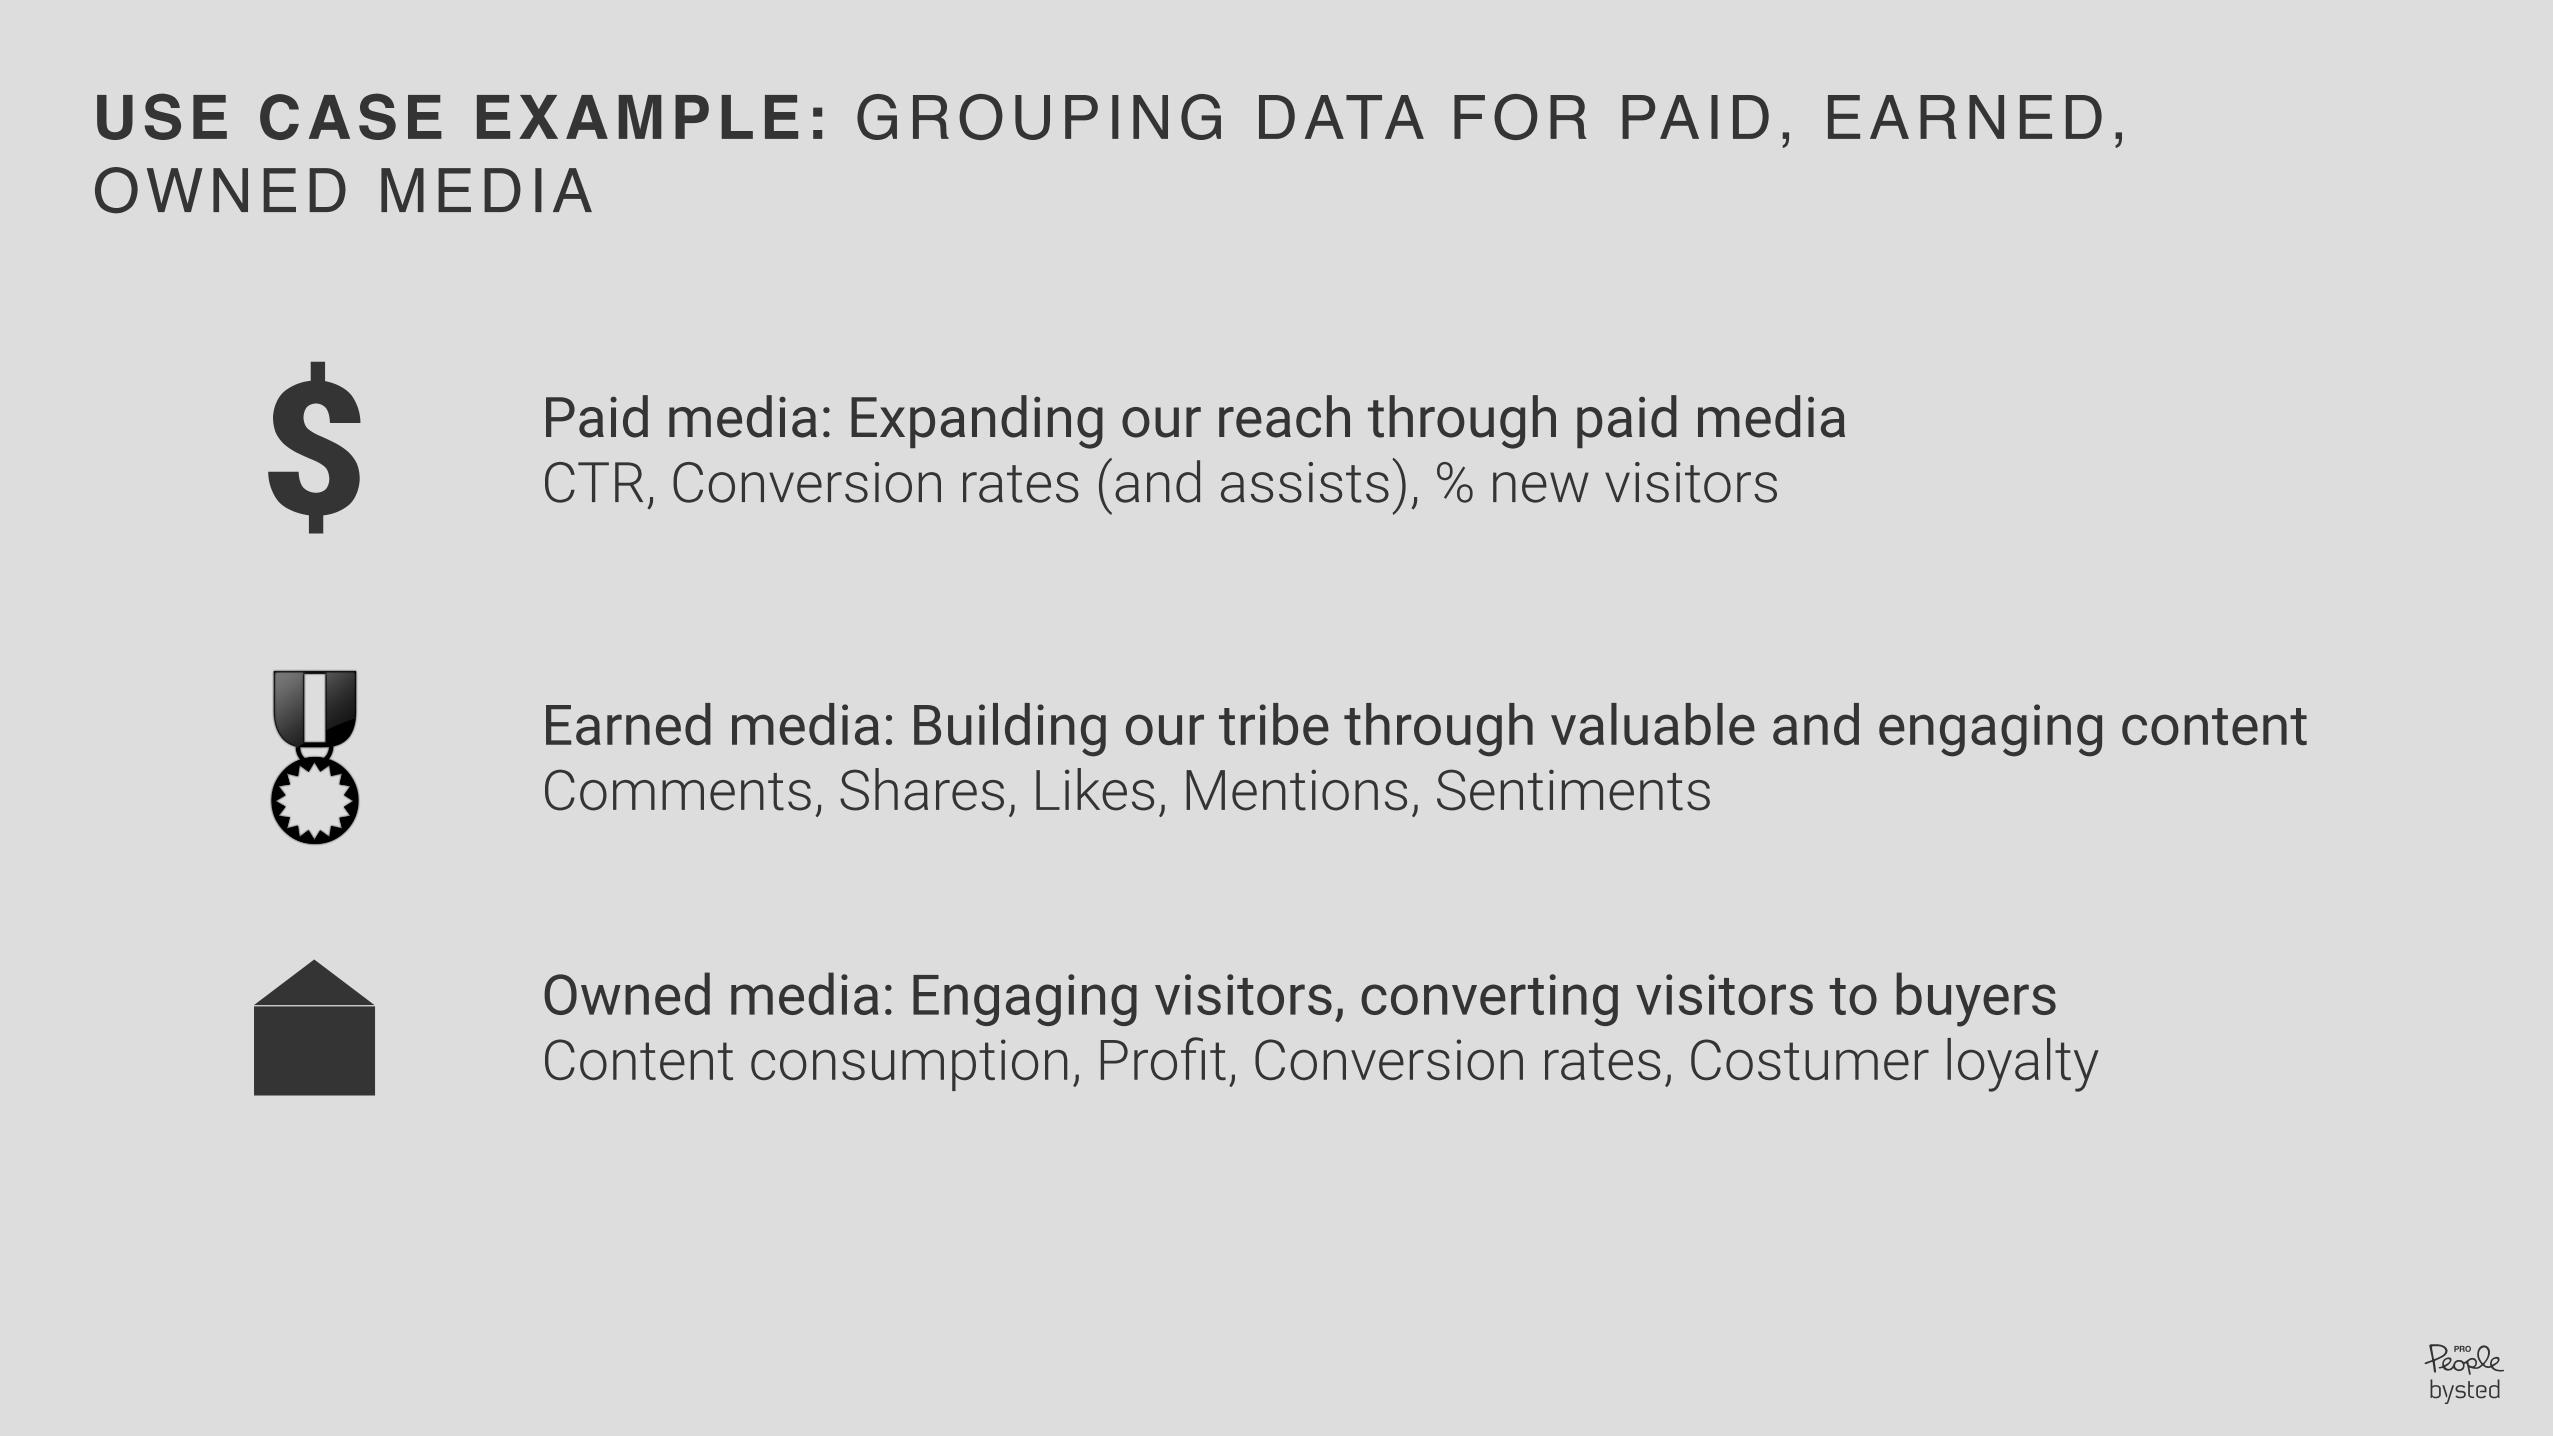
USE CASE EXAMPLE: GROUPING DATA FOR PAID, EARNED, OWNED MEDIA
$ Paid media: Expanding our reach through paid media CTR, Conversion rates (and assists), % new visitors
Earned media: Building our tribe through valuable and engaging content Comments, Shares, Likes, Mentions, Sentiments
Owned media: Engaging visitors, converting visitors to buyers Content consumption, Profit, Conversion rates, Costumer loyalty
Becoming a hero - tip # 3 Design your dashboard around a specific use case - Irrelevant information is a distraction!
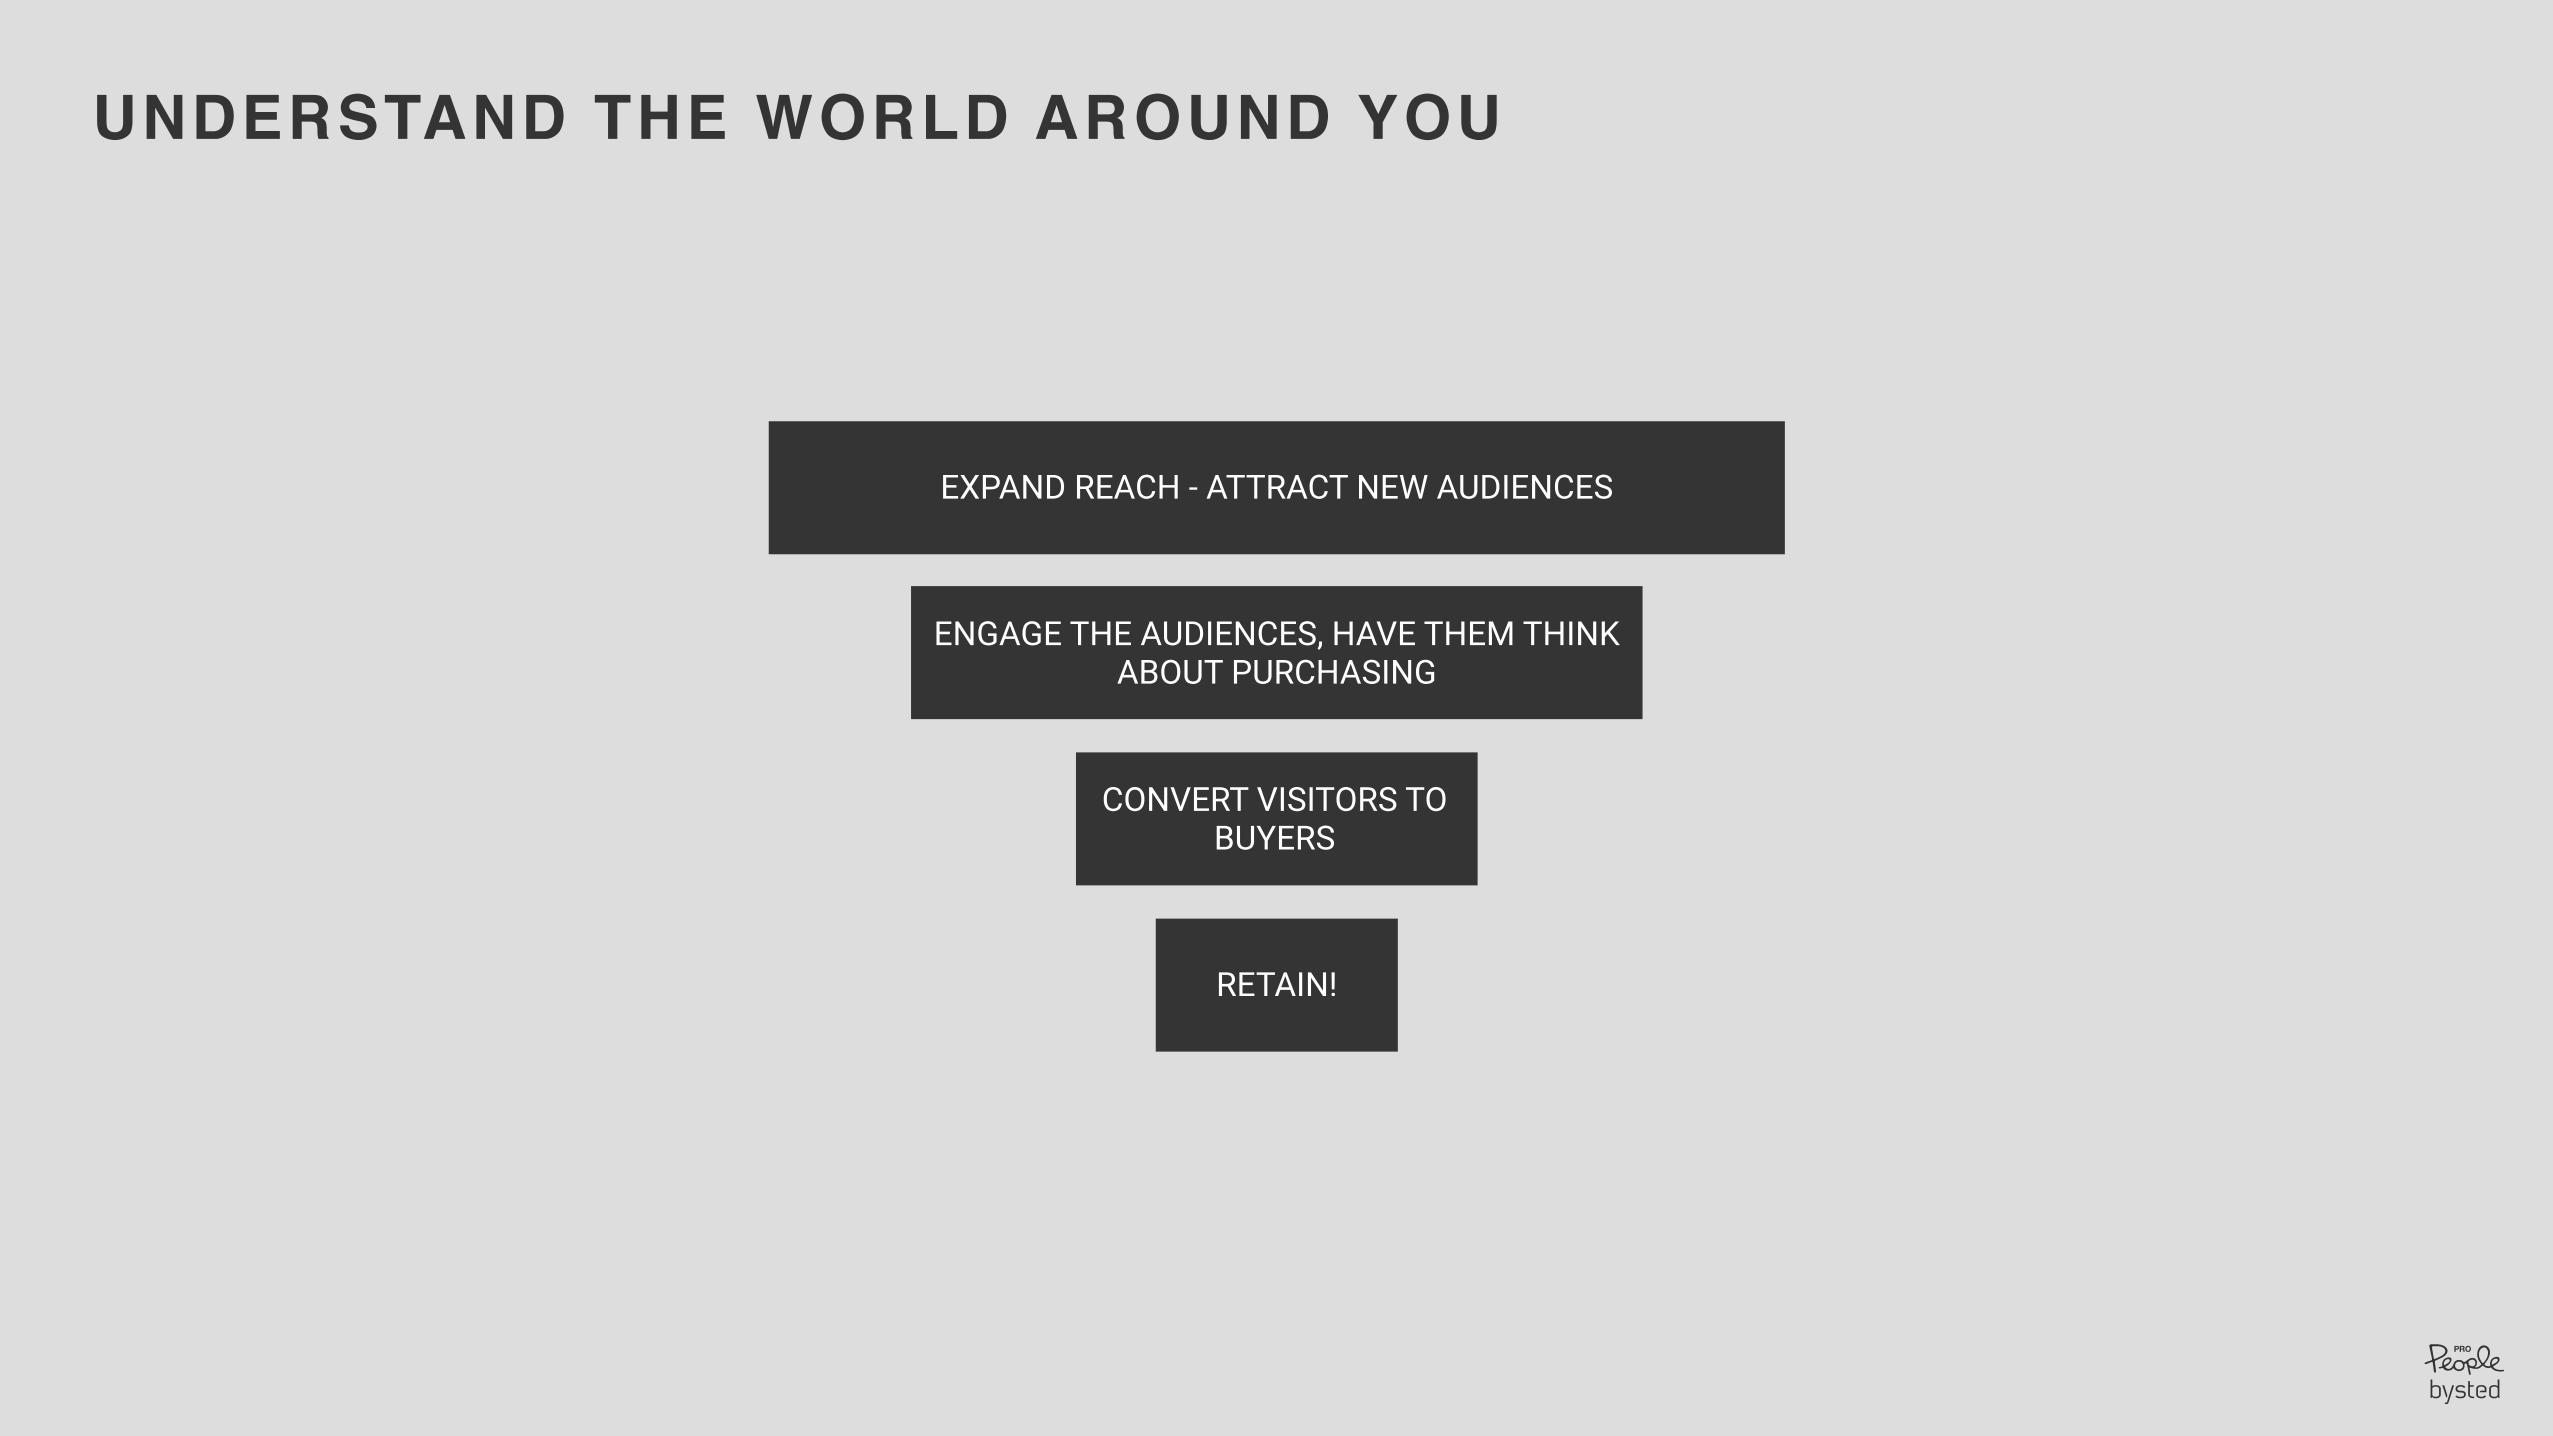
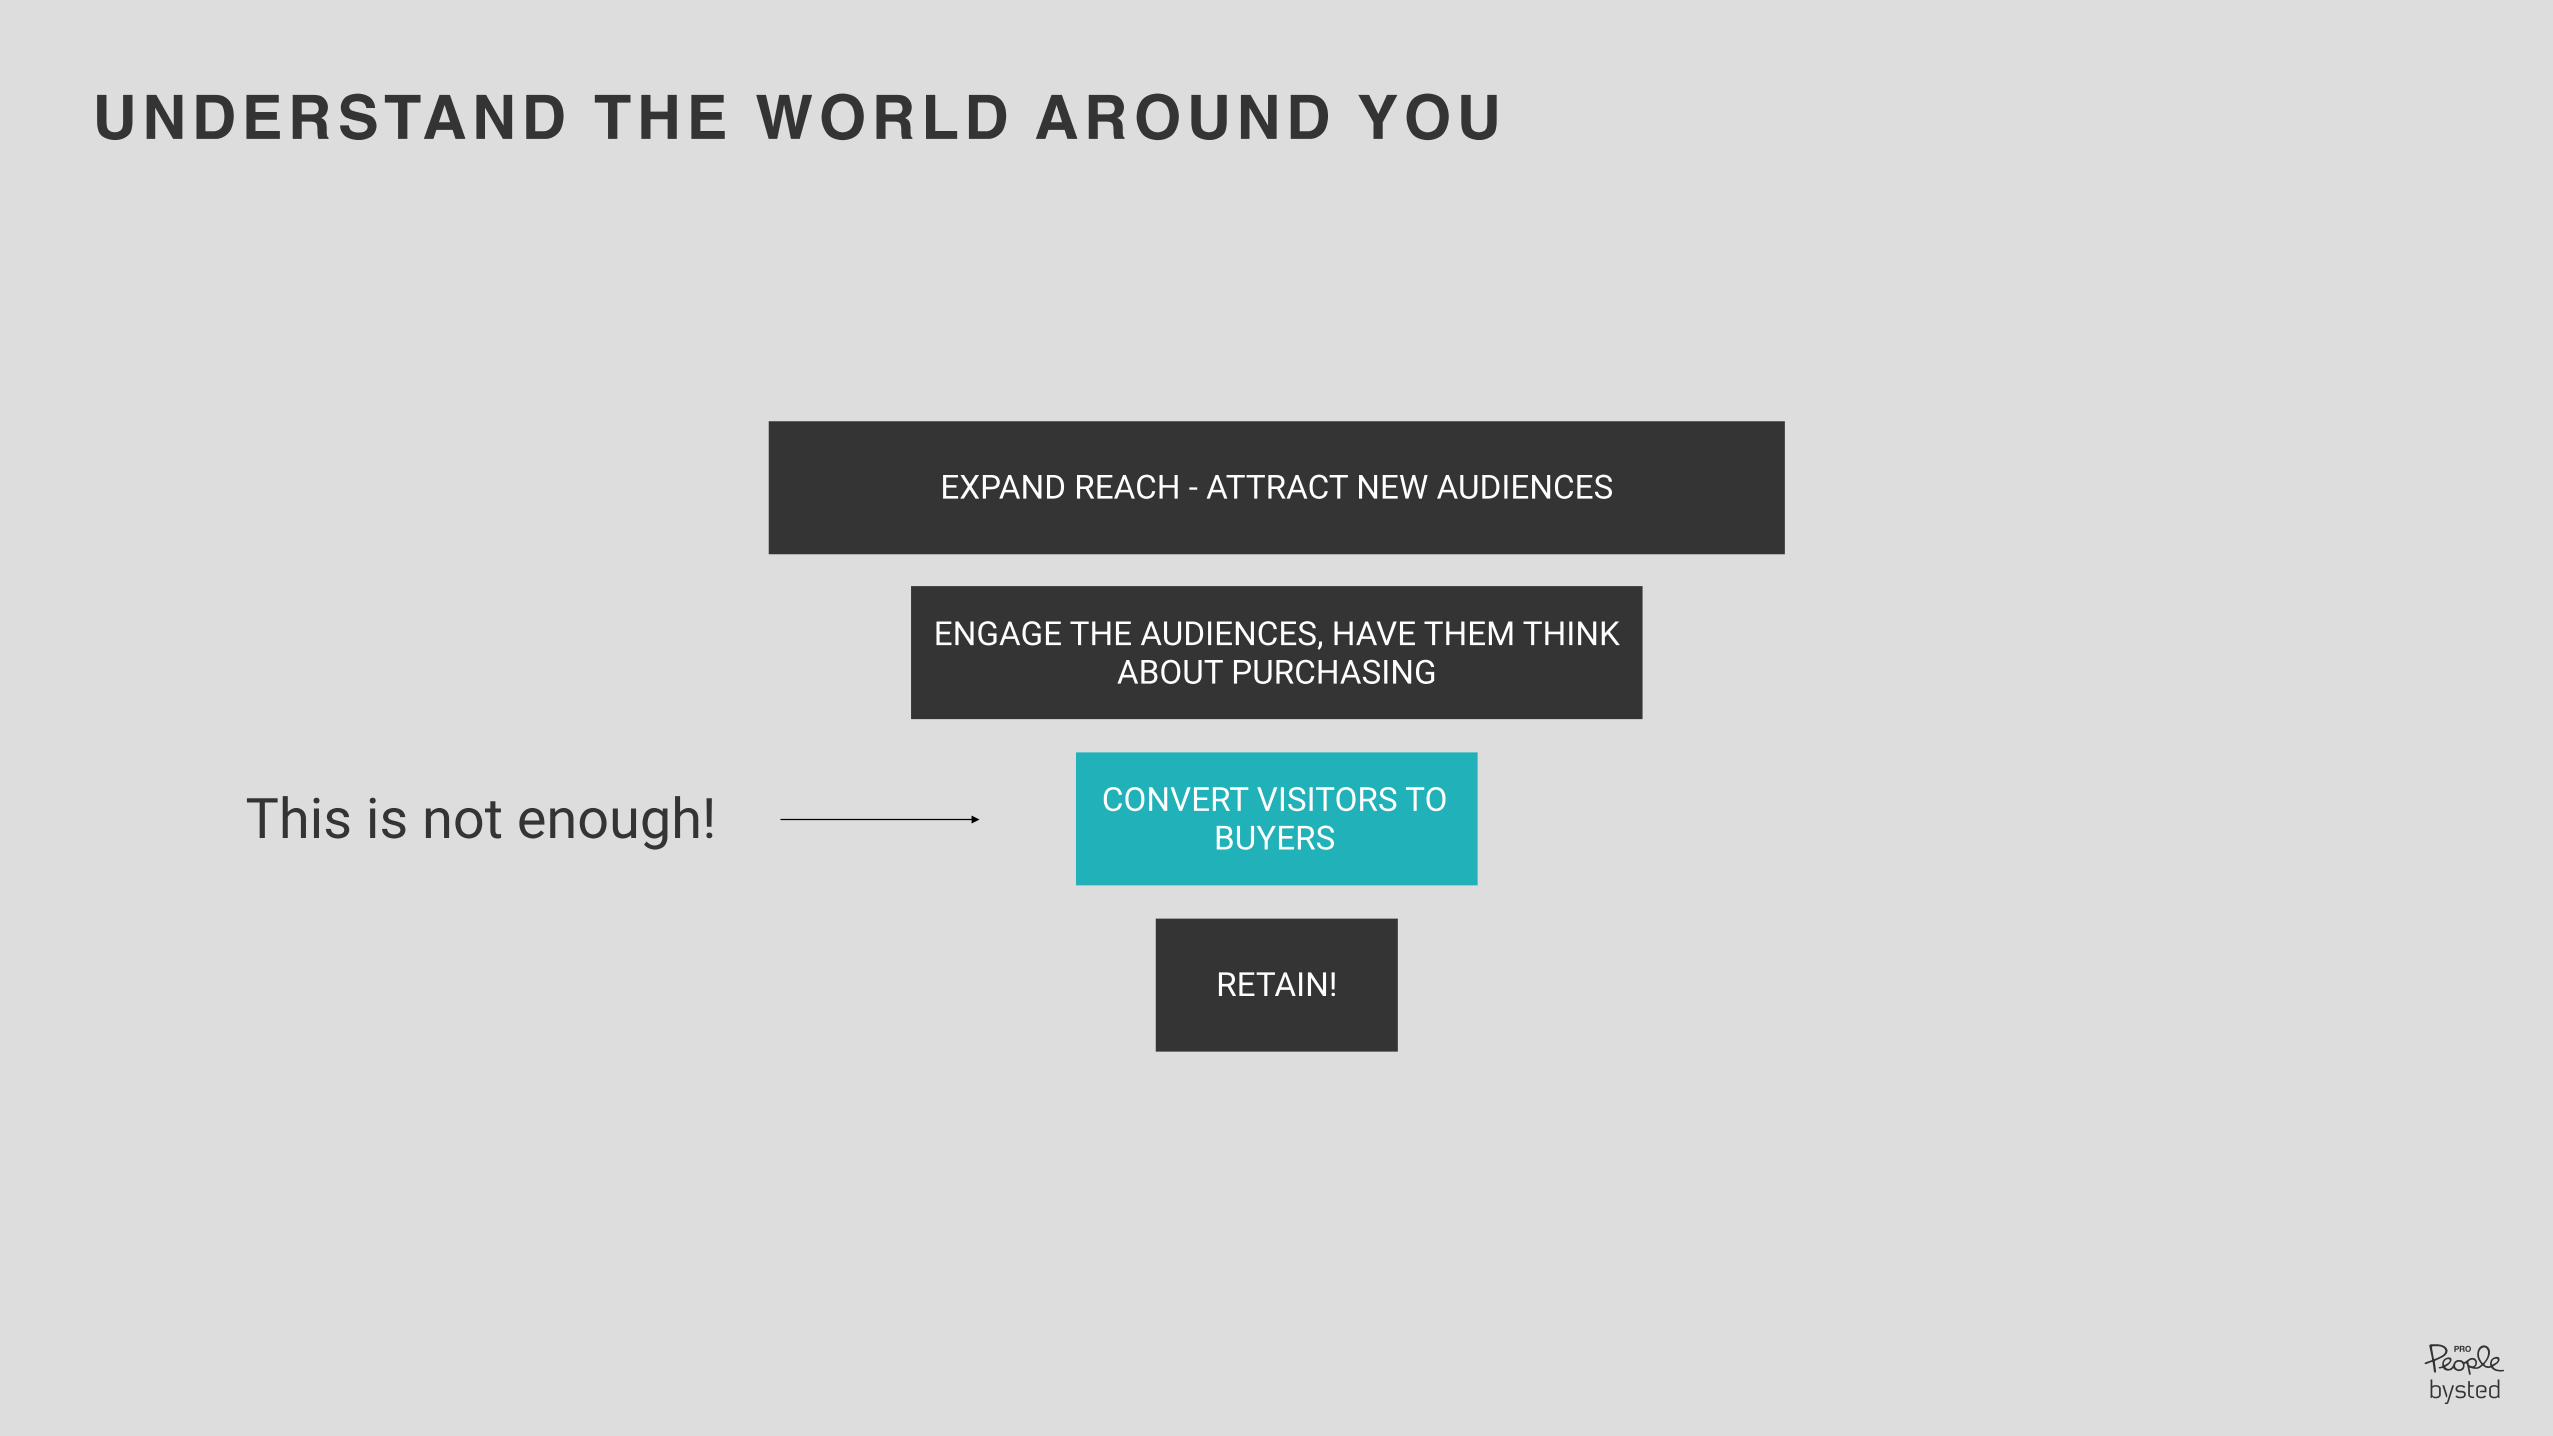
UNDERSTAND THE WORLD AROUND YOU
EXPAND REACH - ATTRACT NEW AUDIENCES
ENGAGE THE AUDIENCES, HAVE THEM THINK ABOUT PURCHASING
CONVERT VISITORS TO BUYERS
RETAIN!
UNDERSTAND THE WORLD AROUND YOU
EXPAND REACH - ATTRACT NEW AUDIENCES
ENGAGE THE AUDIENCES, HAVE THEM THINK ABOUT PURCHASING
CONVERT VISITORS TO BUYERS
RETAIN!
This is not enough!
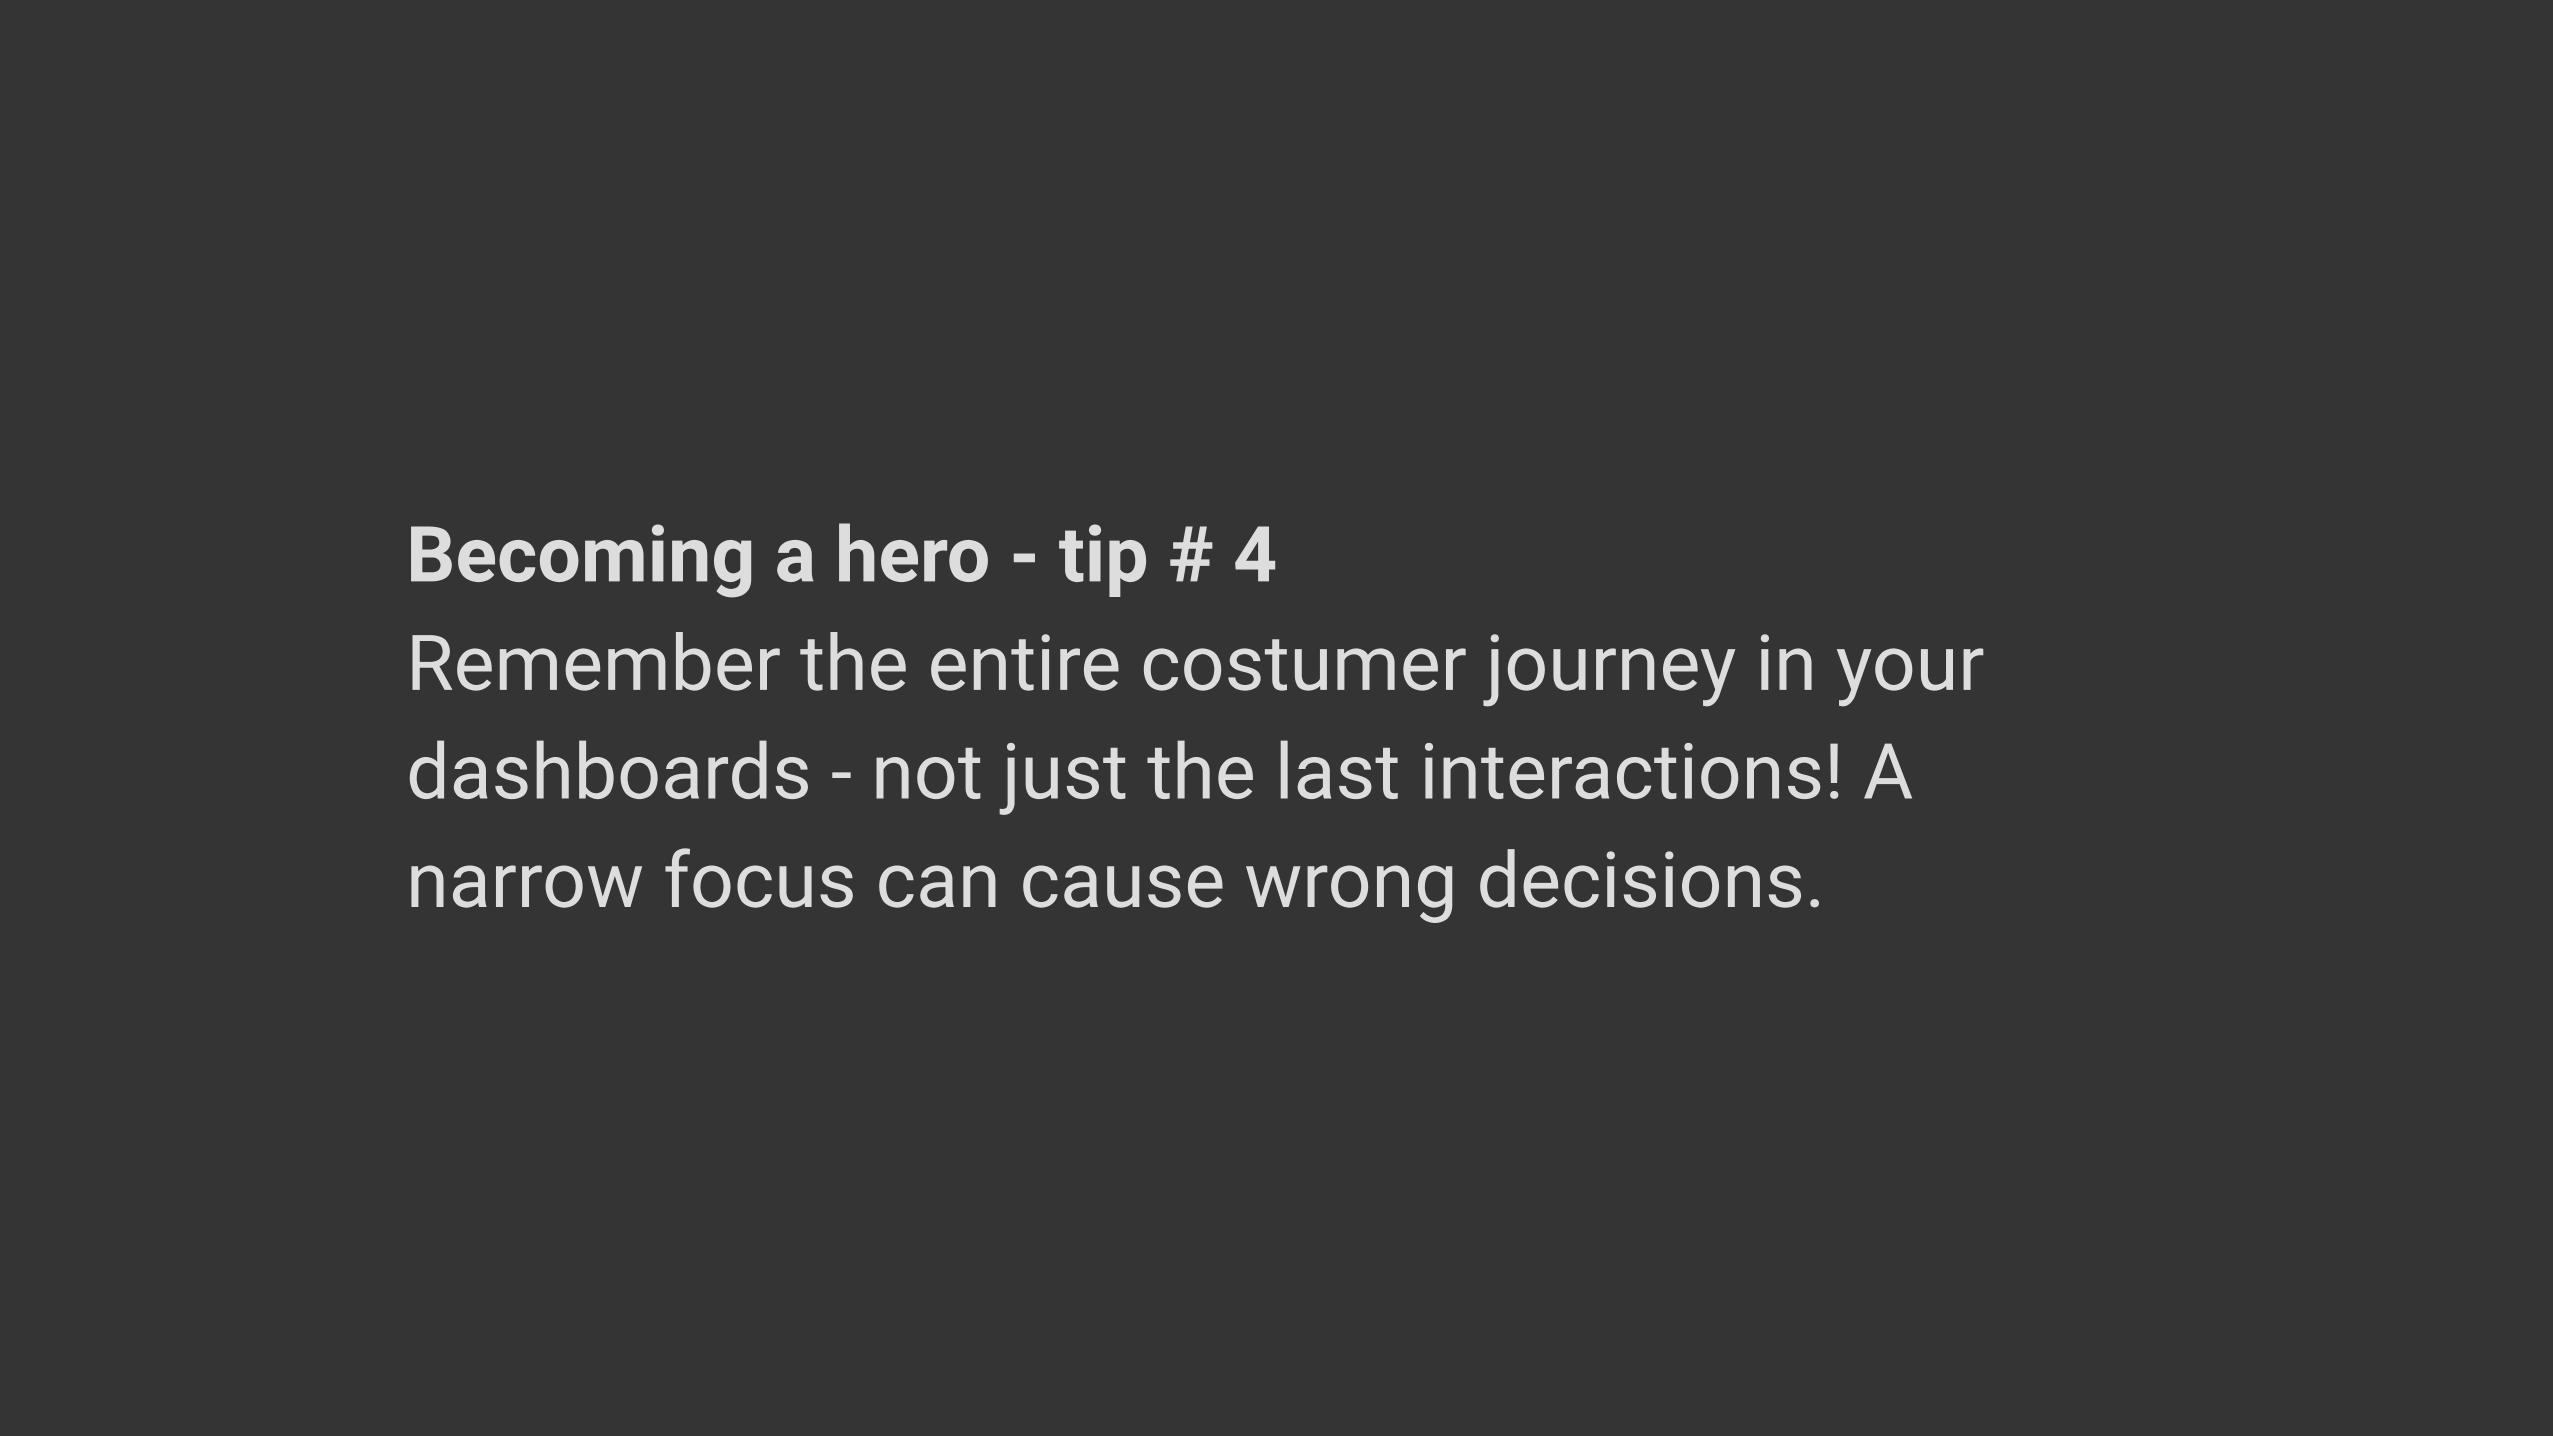
Becoming a hero - tip # 4 Remember the entire costumer journey in your dashboards - not just the last interactions! A narrow focus can cause wrong decisions.
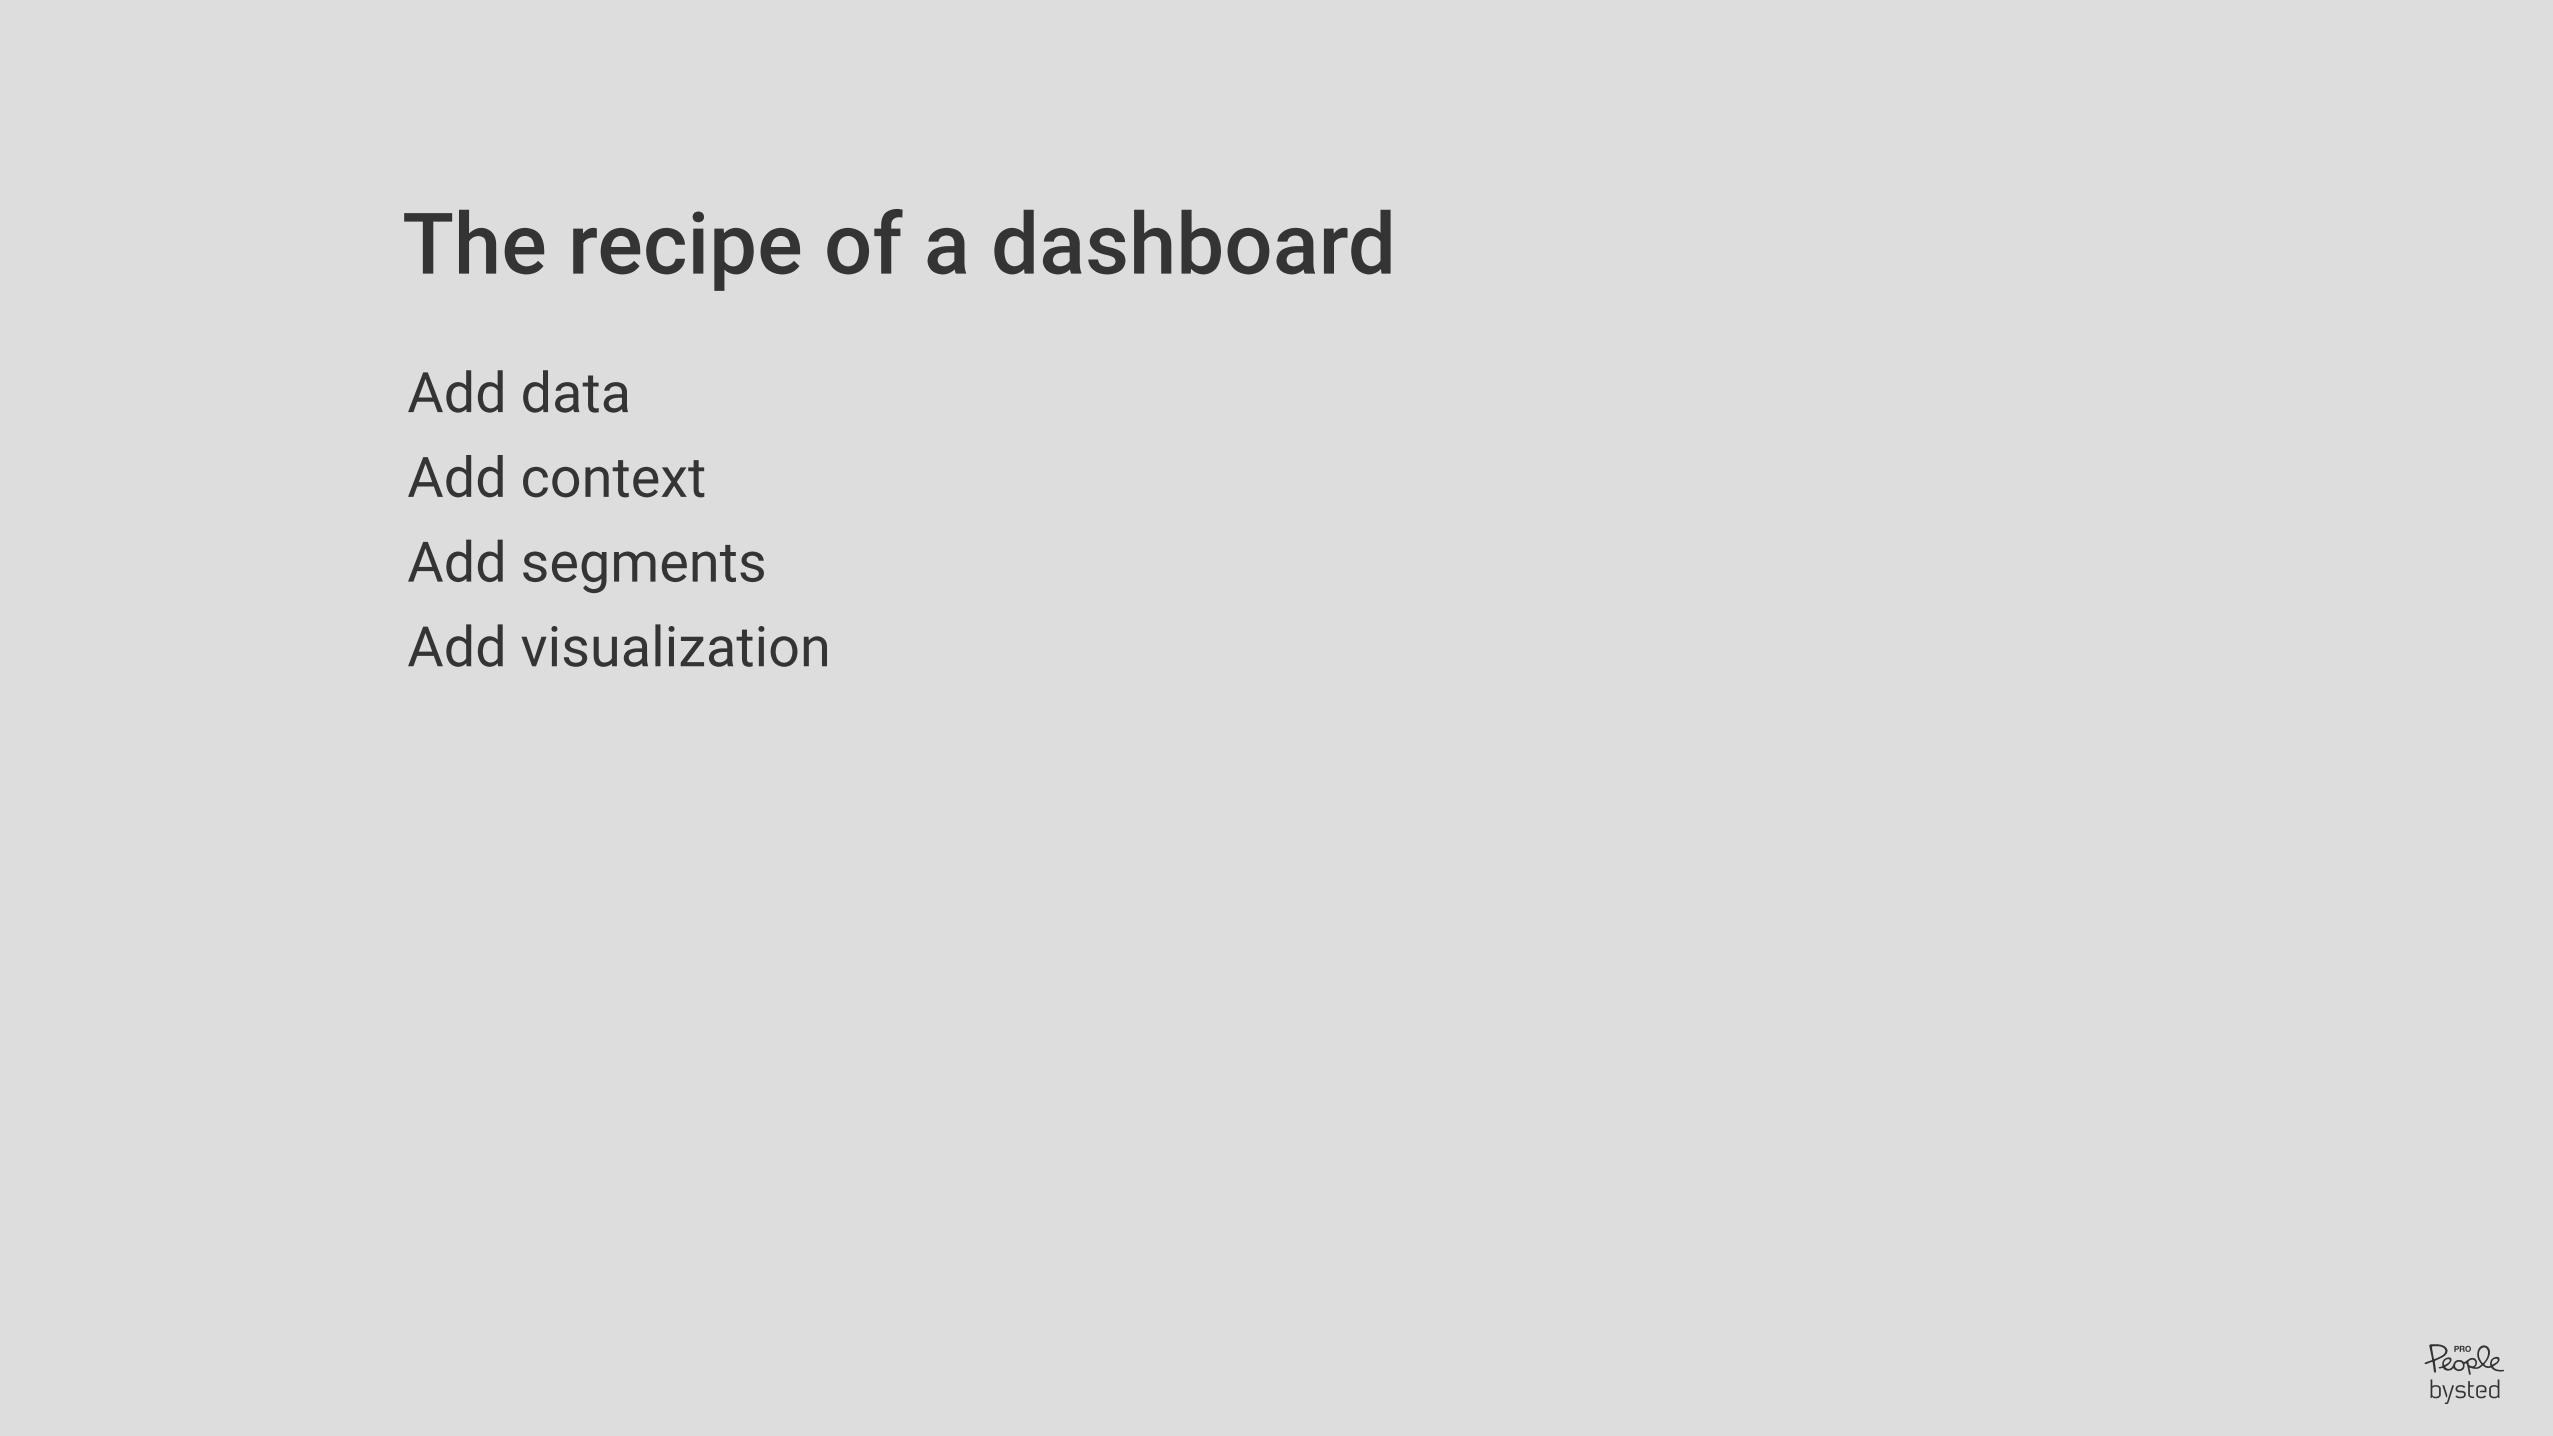
The recipe of a dashboardAdd data Add context Add segments Add visualization

03 Examples
Example # 1: Lead generation
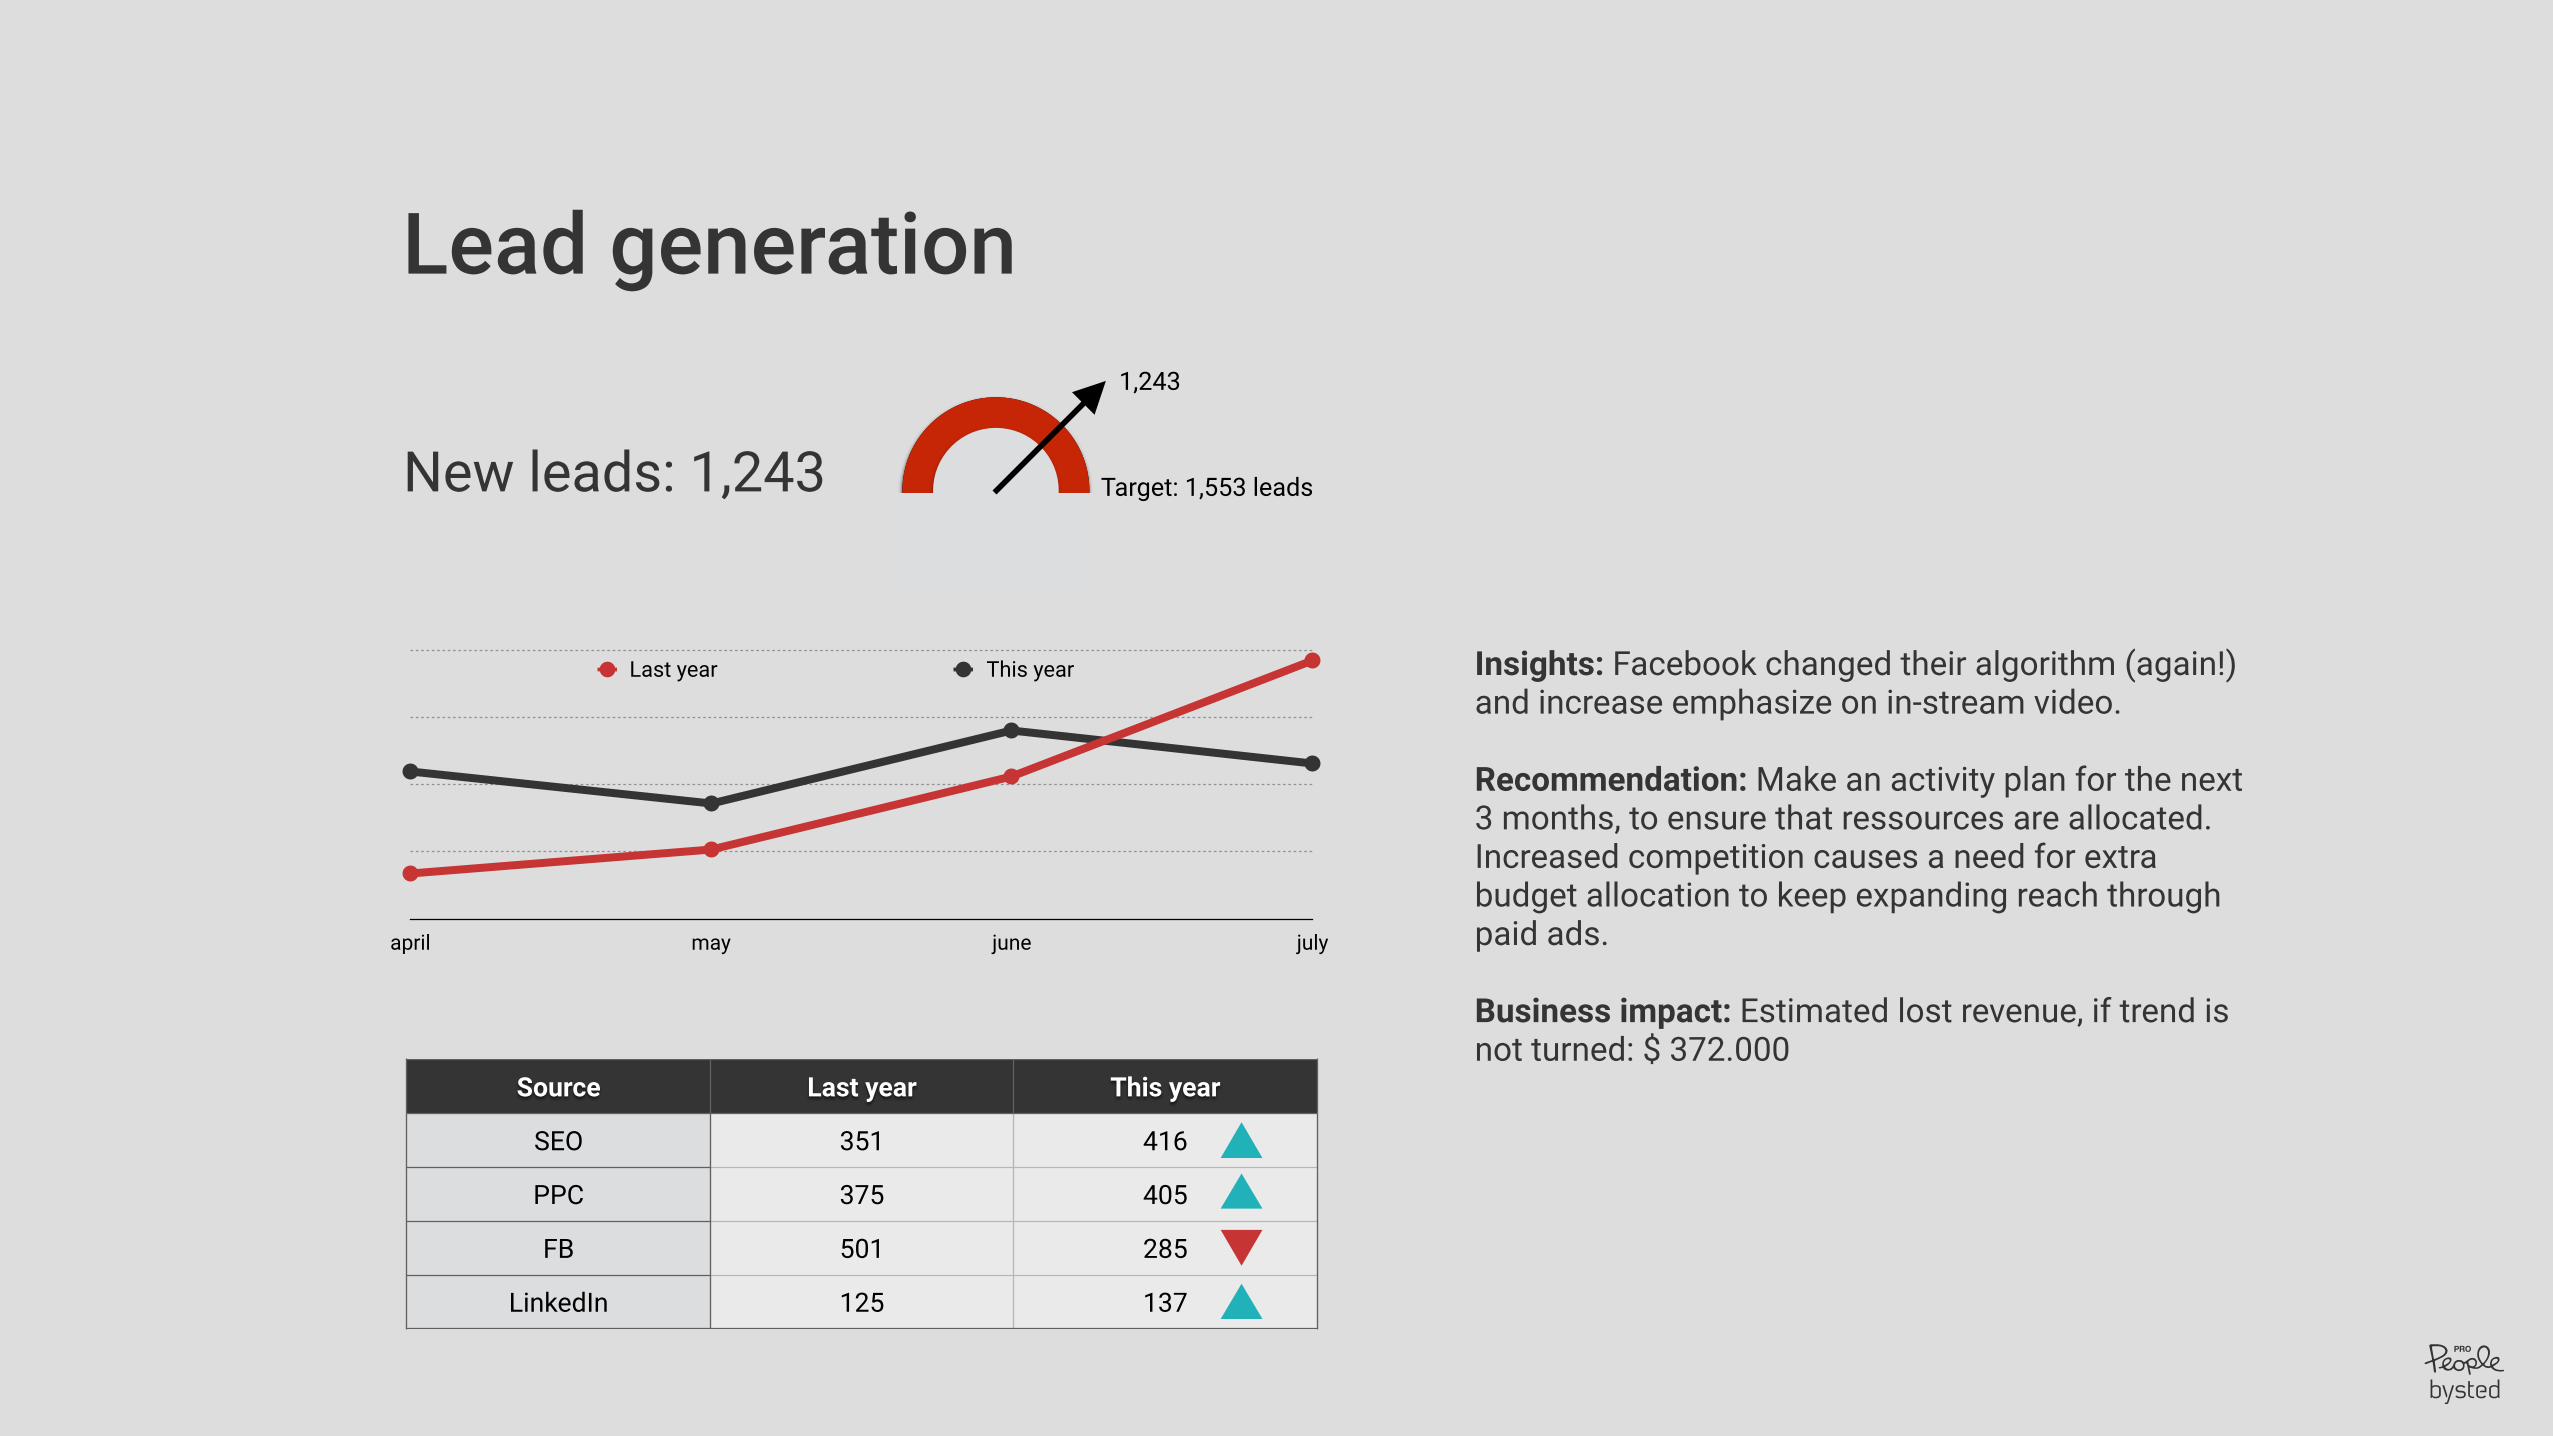
Target: 1,553 leads
1,243
Lead generation
New leads: 1,243
april may june july
Last year This year
Source Last year This year
SEO 351 416
PPC 375 405
FB 501 285
LinkedIn 125 137
Insights: Facebook changed their algorithm (again!) and increase emphasize on in-stream video.
Recommendation: Make an activity plan for the next 3 months, to ensure that ressources are allocated. Increased competition causes a need for extra budget allocation to keep expanding reach through paid ads.
Business impact: Estimated lost revenue, if trend is not turned: $ 372.000
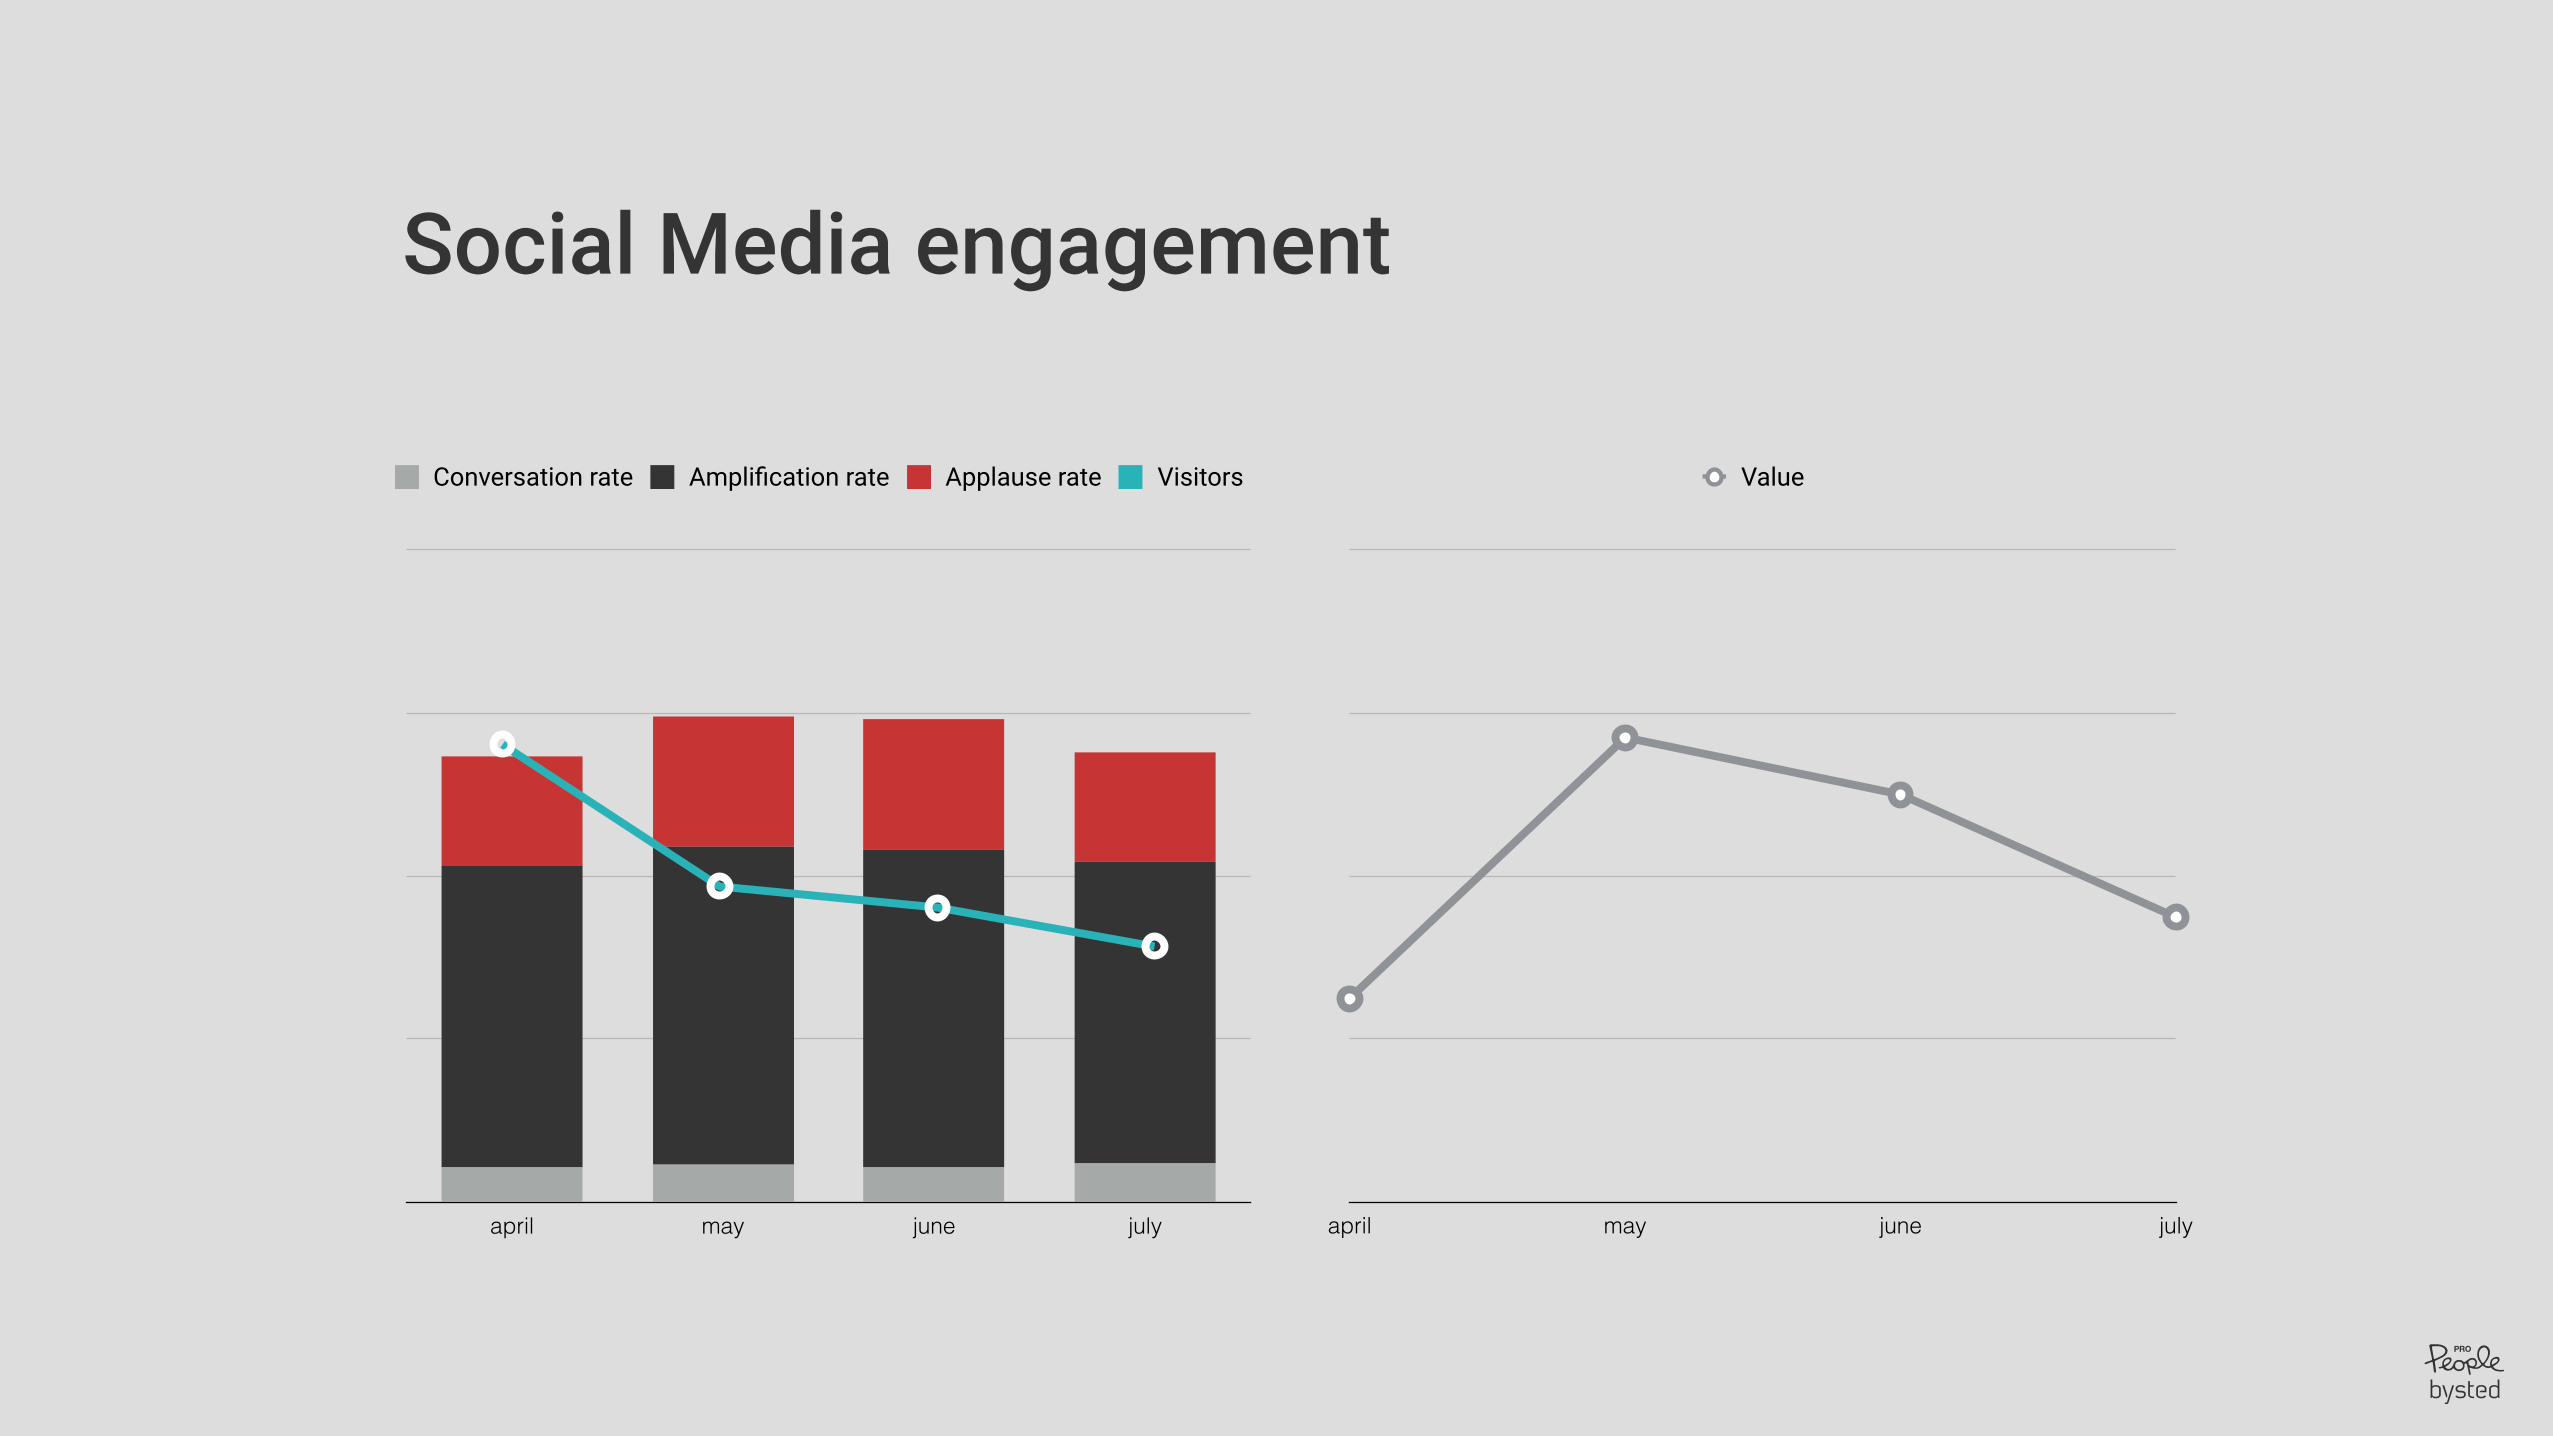
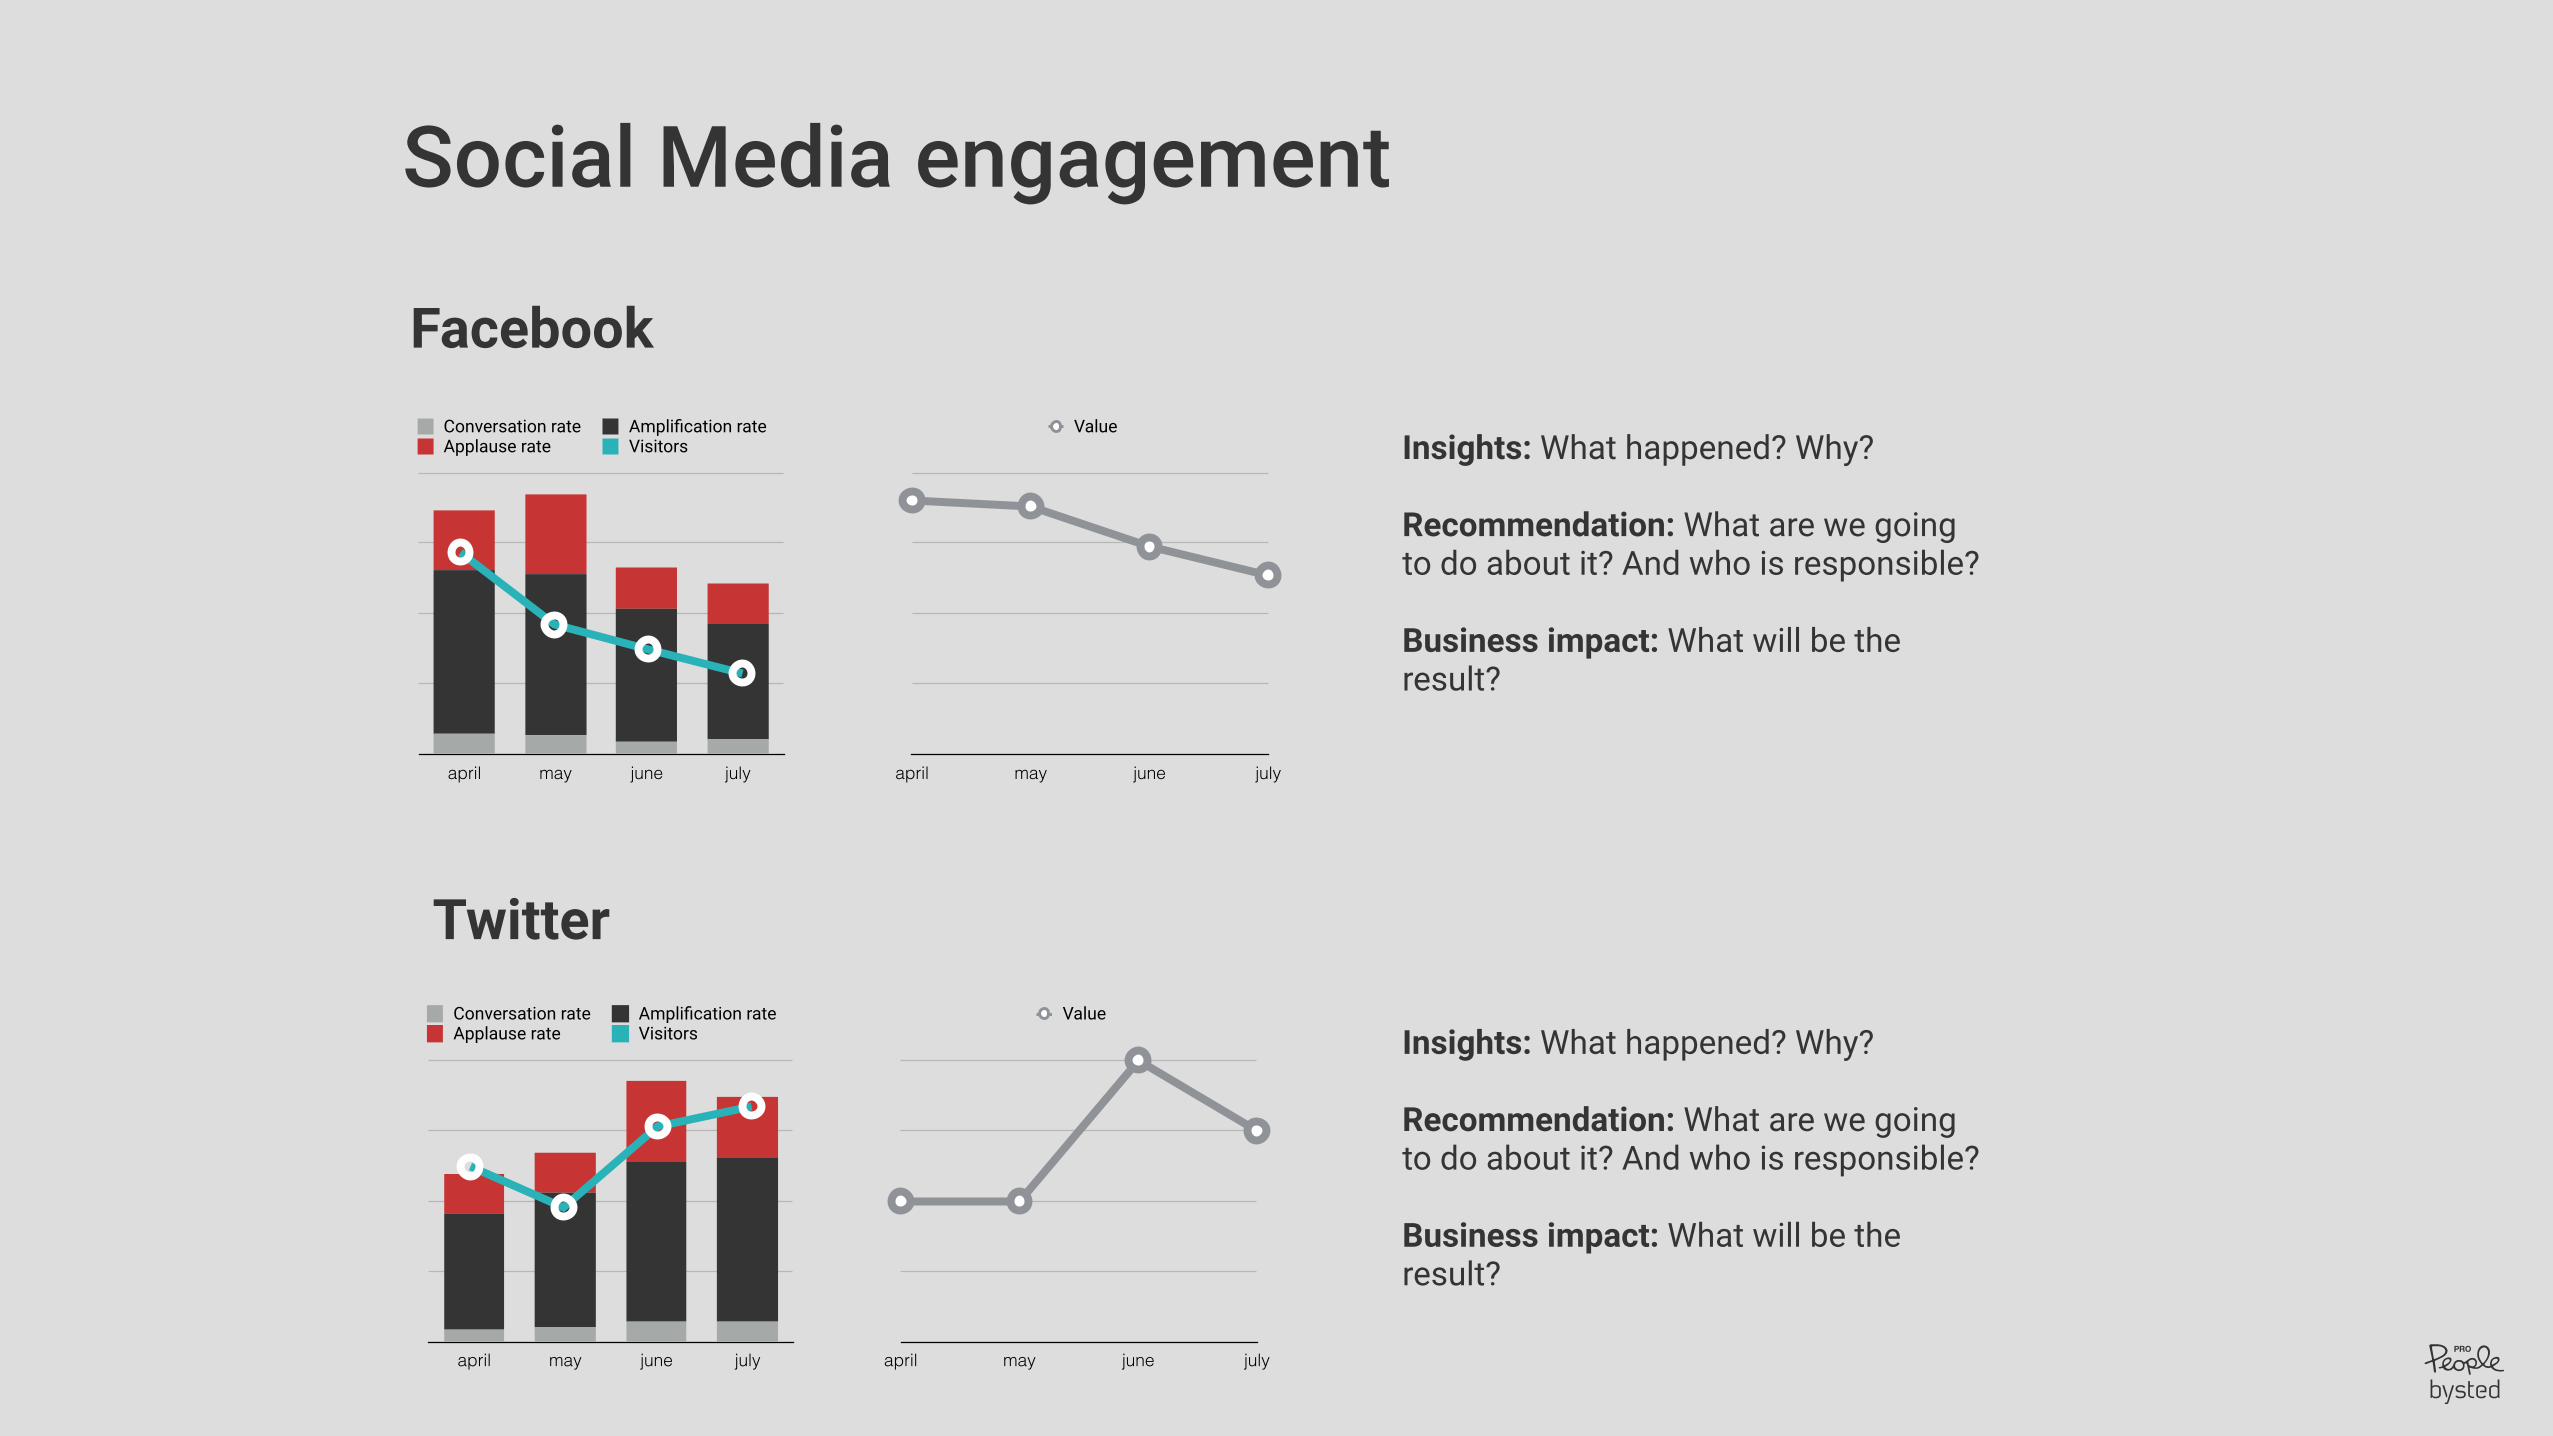
Example # 2: Social Media engagement
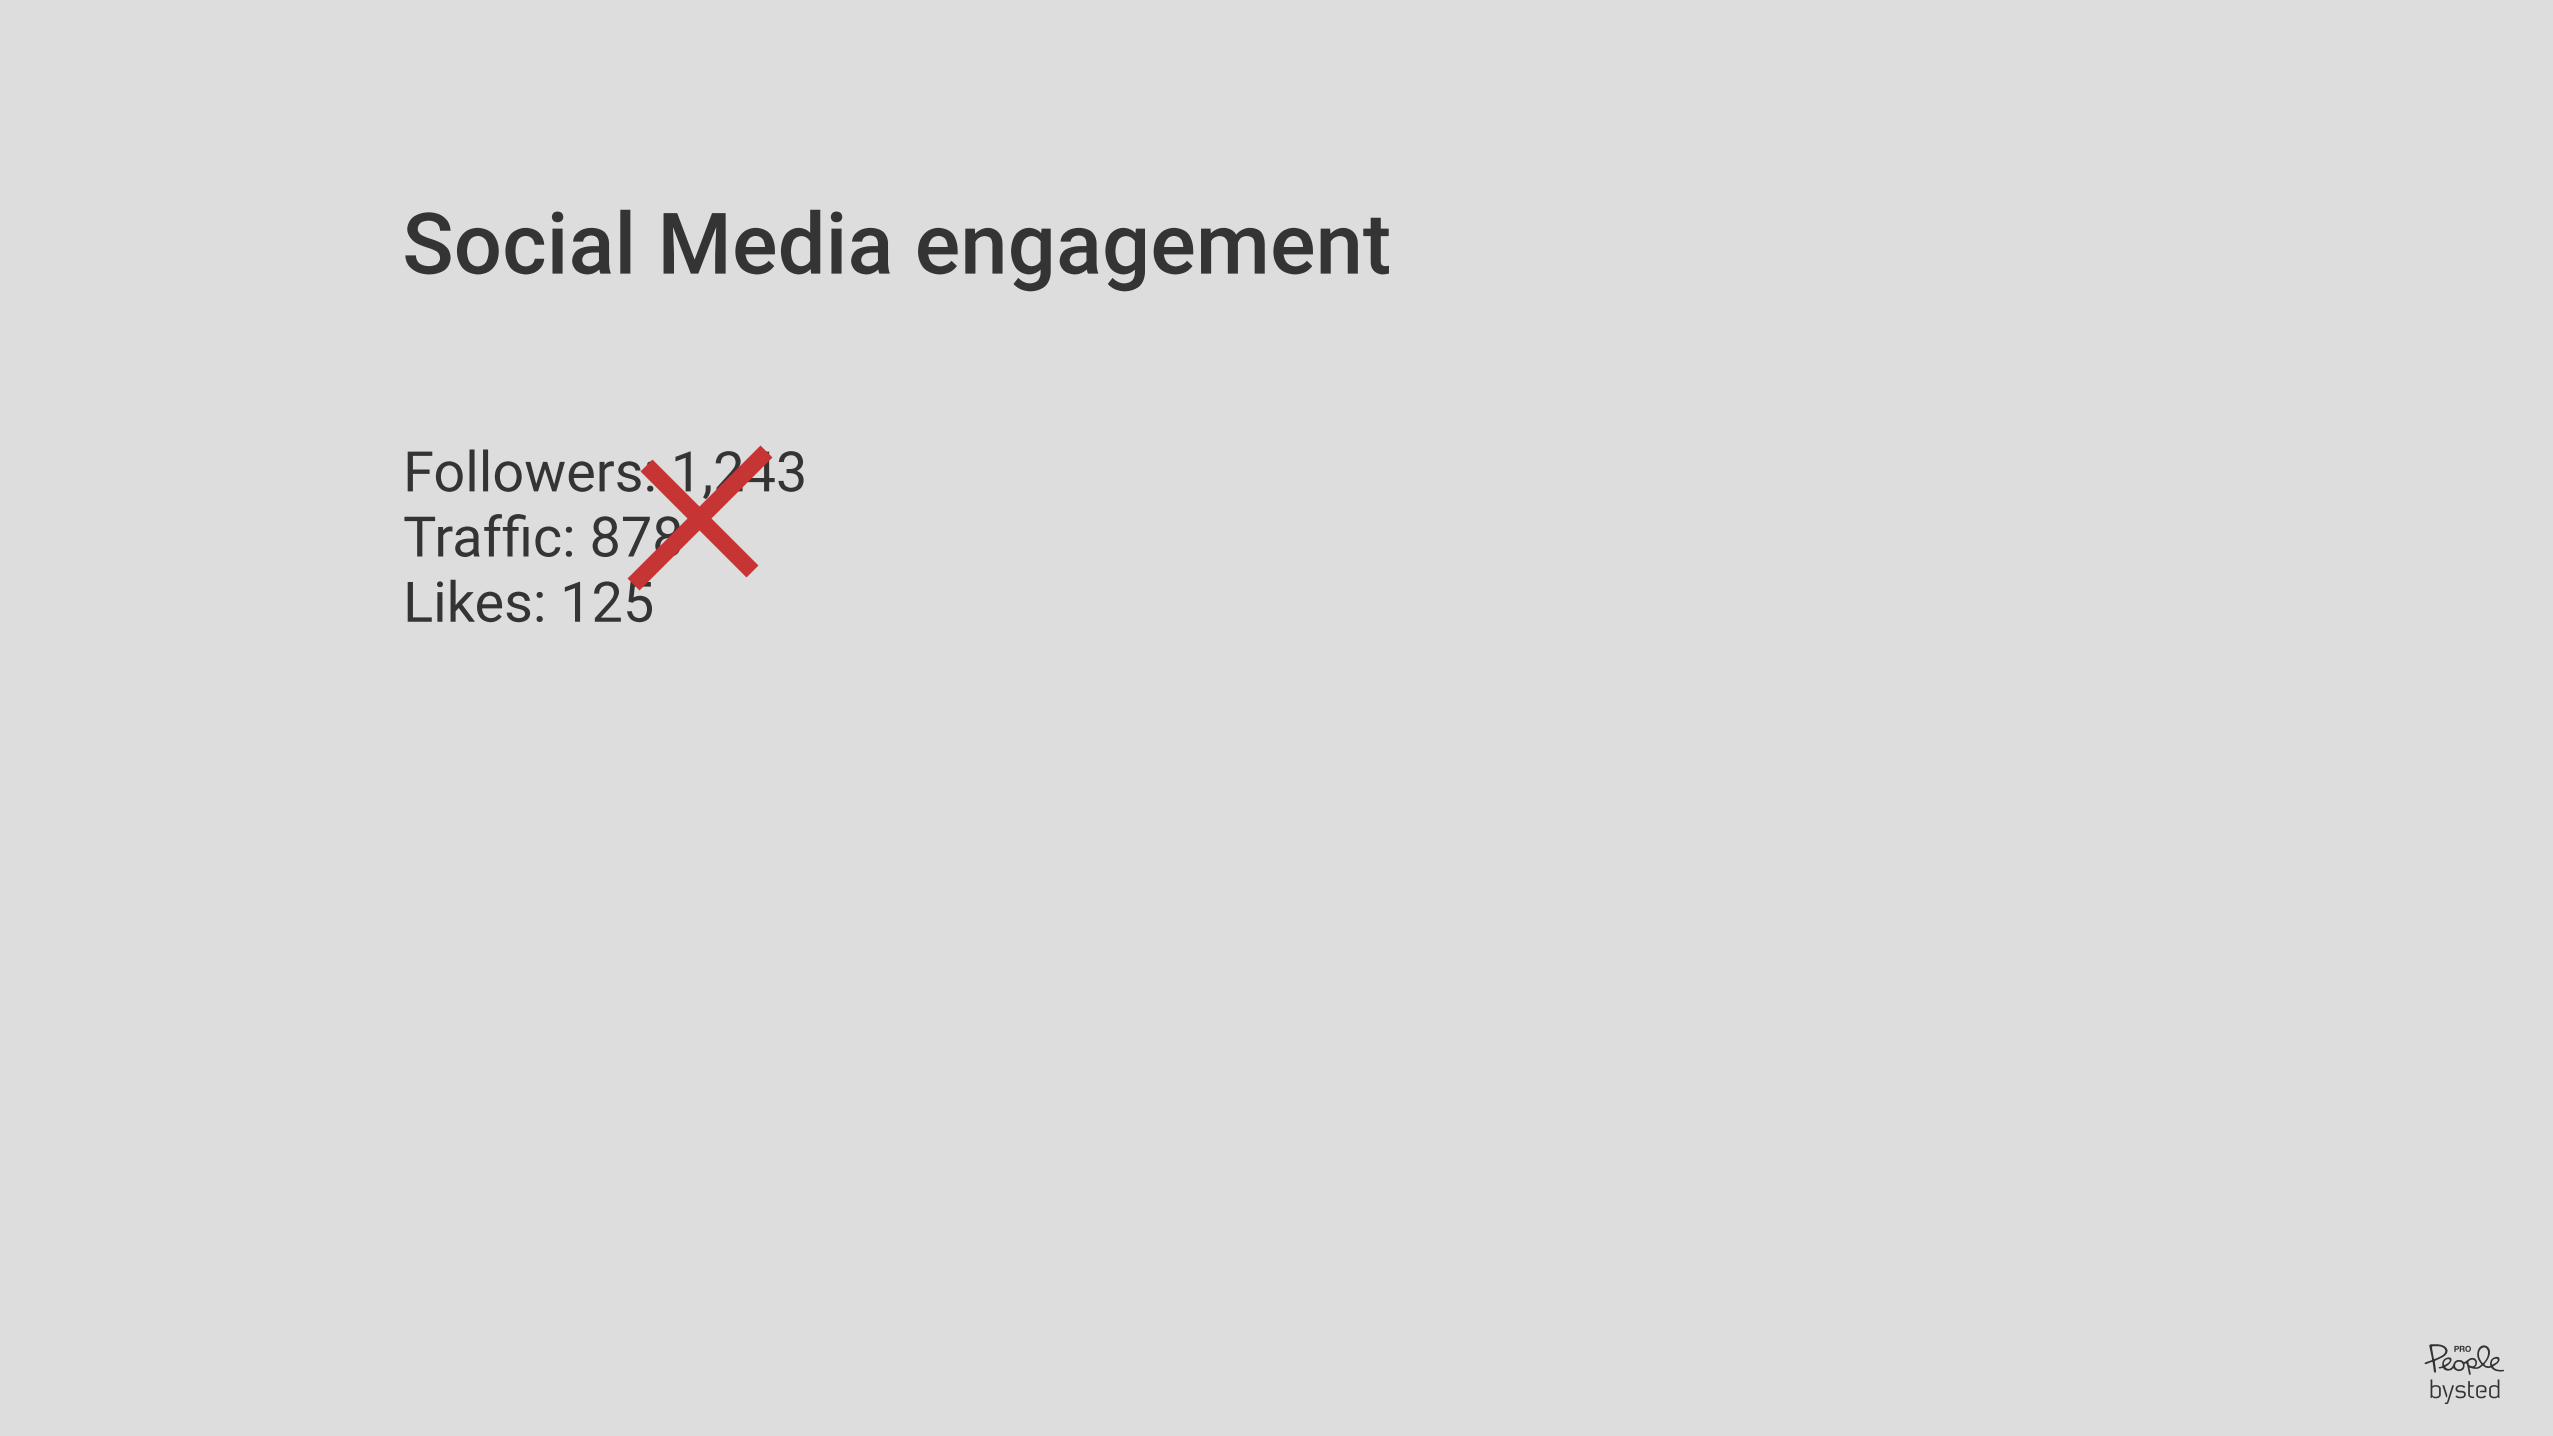
Social Media engagement
Followers: 1,243 Traffic: 878 Likes: 125
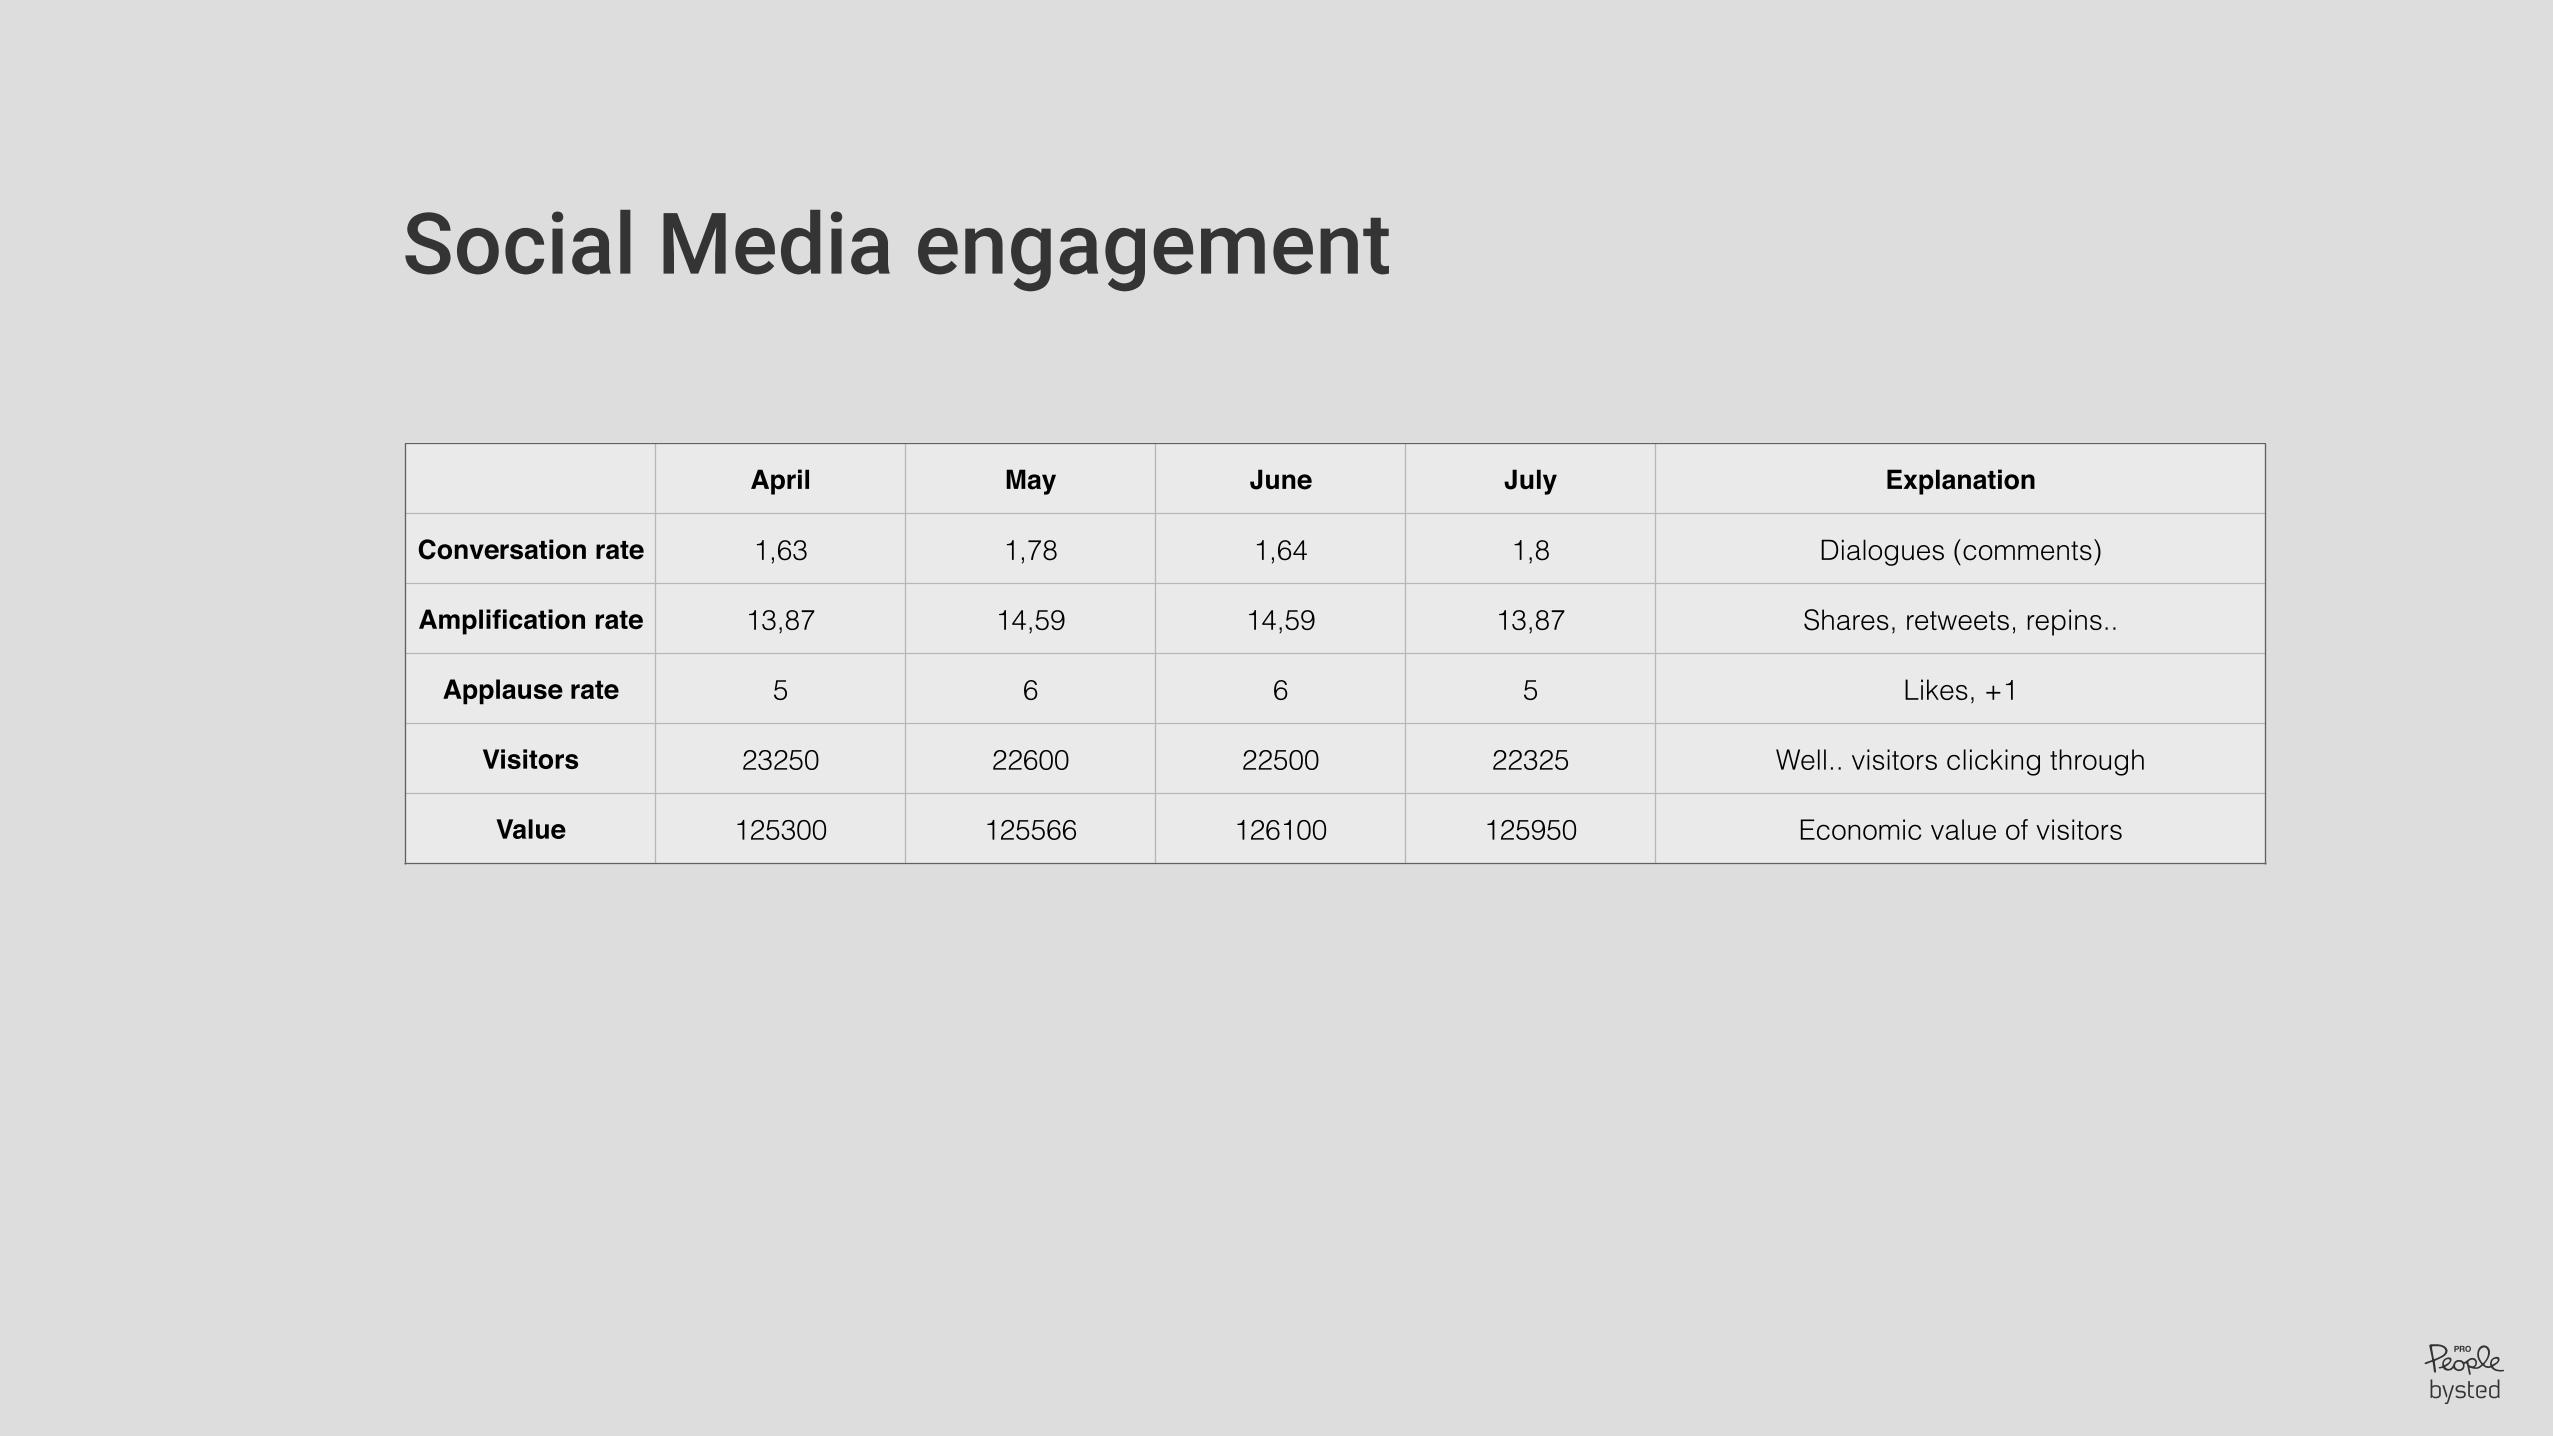
Social Media engagement
April May June July Explanation
Conversation rate 1,63 1,78 1,64 1,8 Dialogues (comments)
Amplification rate 13,87 14,59 14,59 13,87 Shares, retweets, repins..
Applause rate 5 6 6 5 Likes, +1
Visitors 23250 22600 22500 22325 Well.. visitors clicking through
Value 125300 125566 126100 125950 Economic value of visitors
april may june july
Conversation rate Amplification rate Applause rate Visitors
Social Media engagement
april may june july
Value
april may june july
Conversation rate Amplification rateApplause rate Visitors
april may june july
Conversation rate Amplification rateApplause rate Visitors
april may june july
Value
april may june july
Value
Insights: What happened? Why?
Recommendation: What are we going to do about it? And who is responsible?
Business impact: What will be the result?
Insights: What happened? Why?
Recommendation: What are we going to do about it? And who is responsible?
Business impact: What will be the result?
Social Media engagement

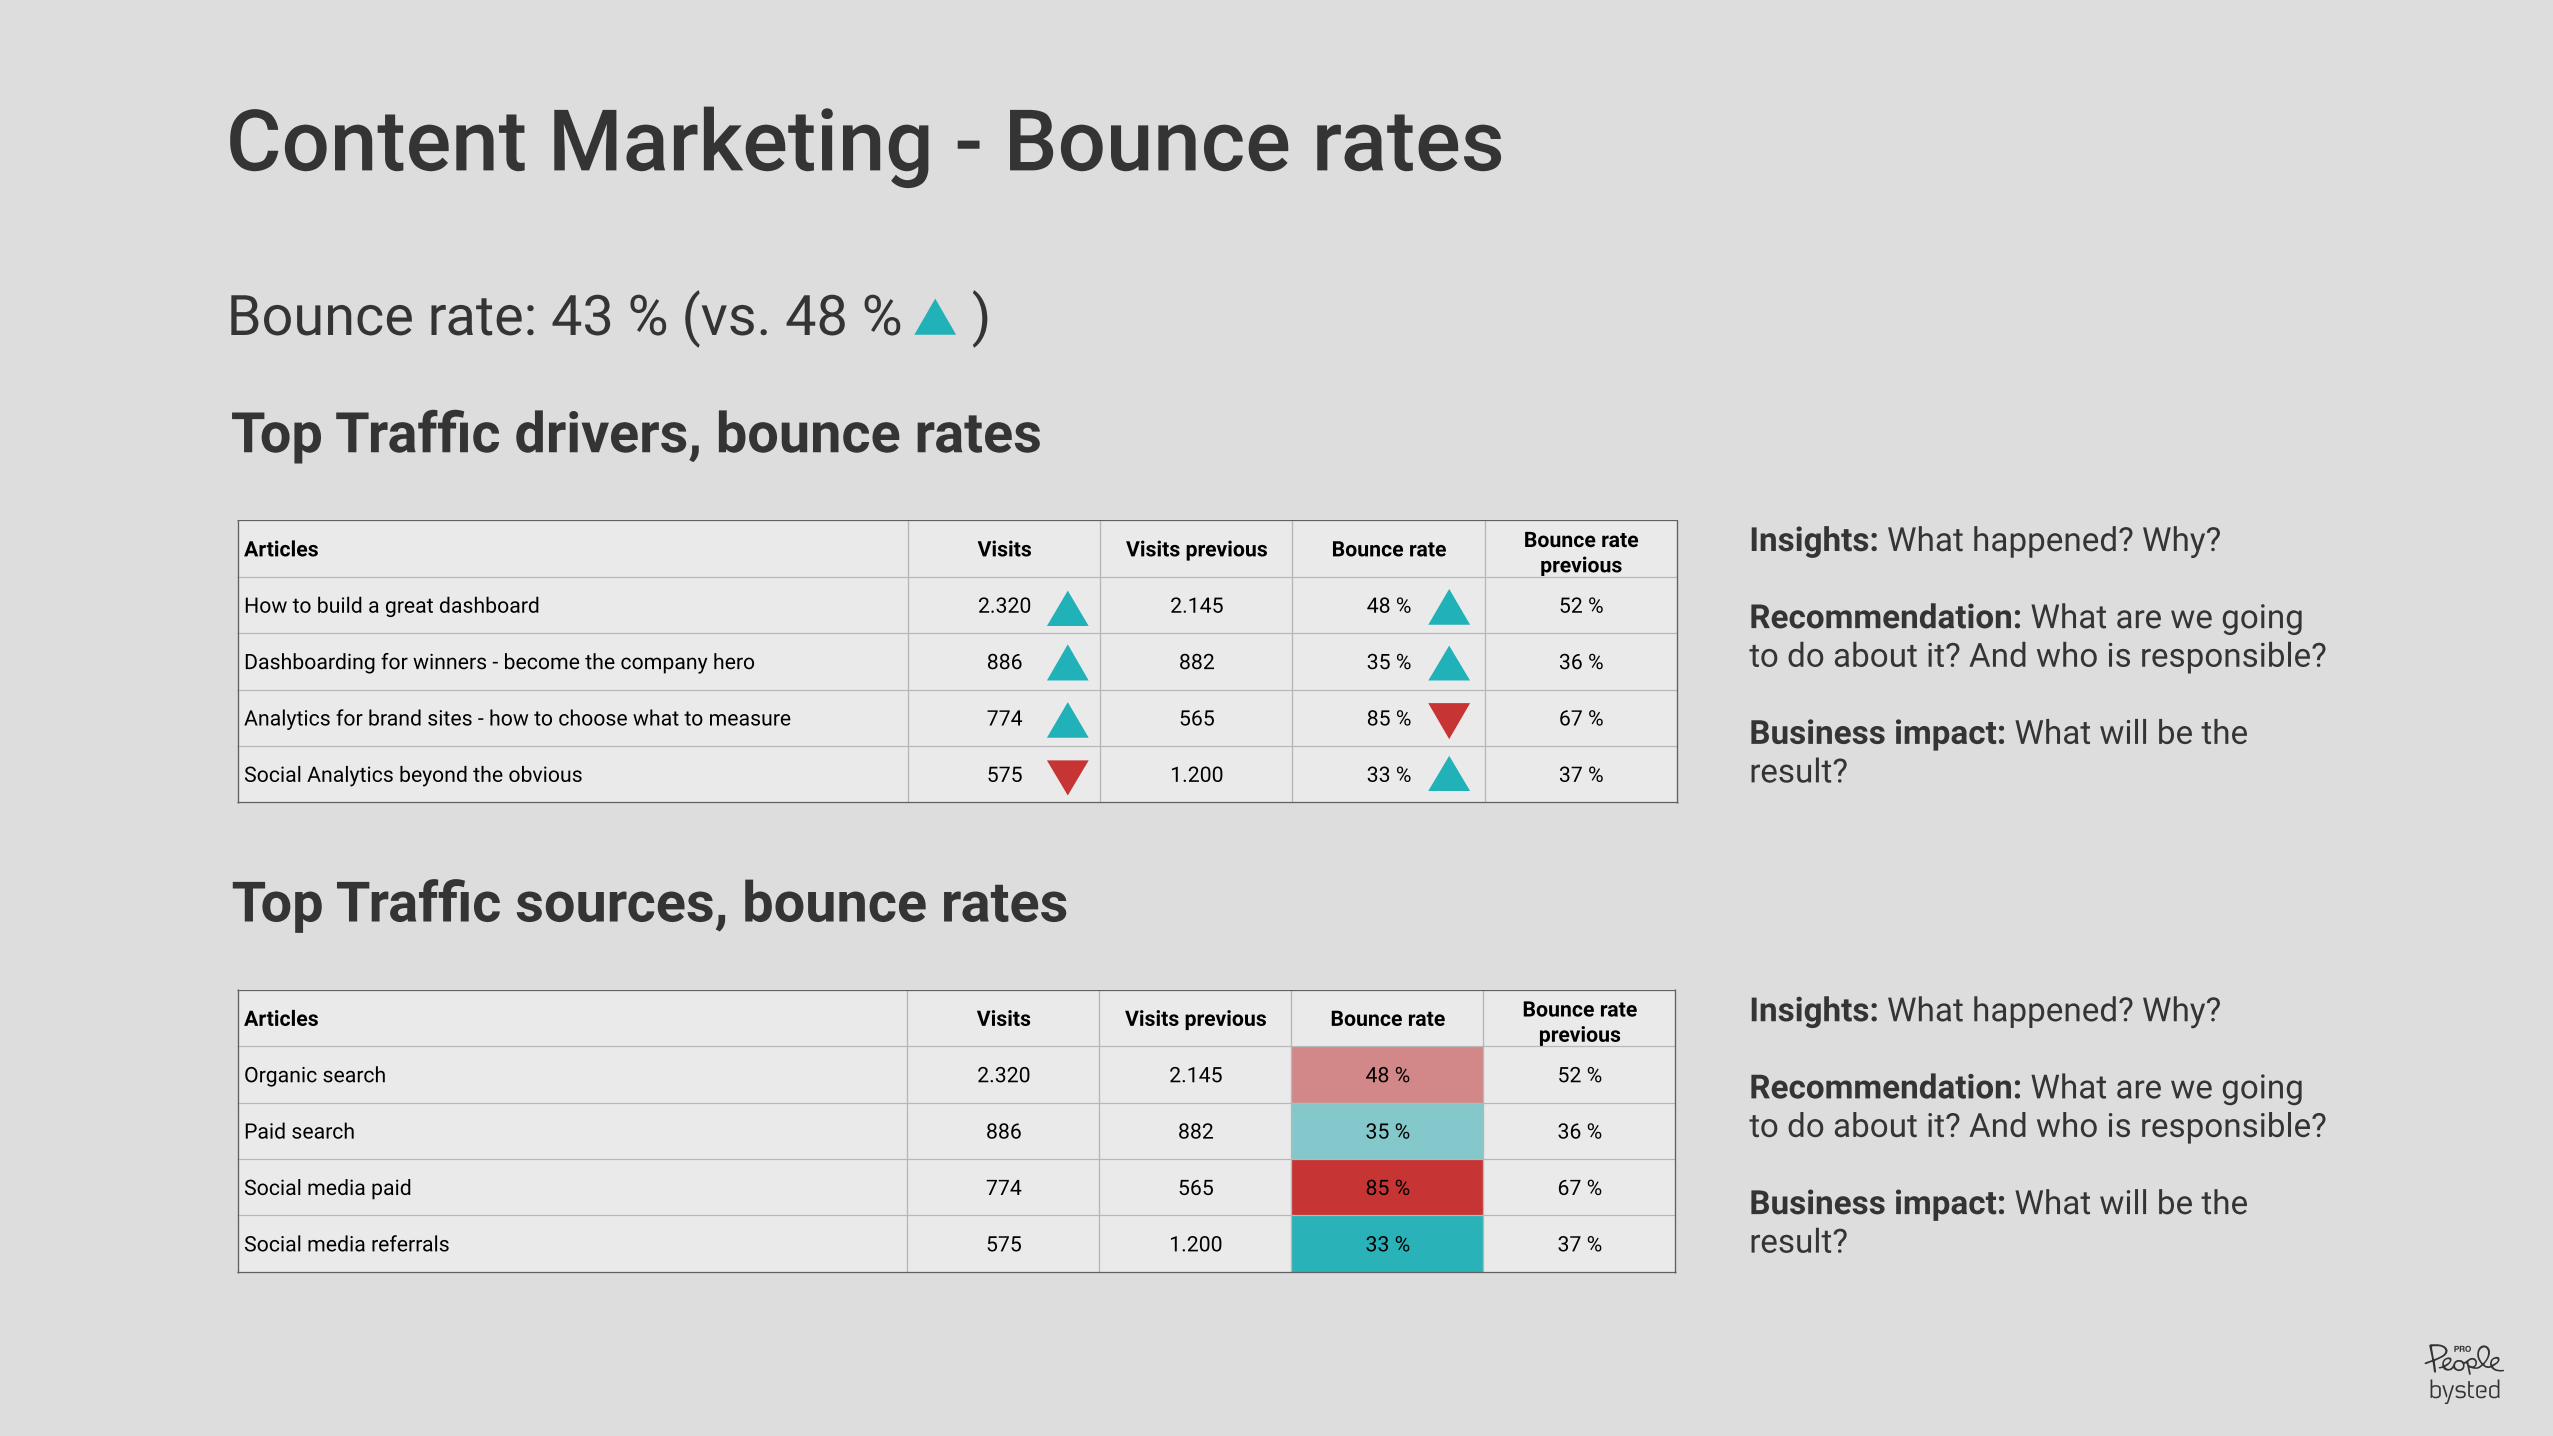
Example # 3: Content marketing

Content Marketing - Bounce rates
Articles Visits Visits previous Bounce rate Bounce rate previous
How to build a great dashboard 2.320 2.145 48 % 52 %
Dashboarding for winners - become the company hero 886 882 35 % 36 %
Analytics for brand sites - how to choose what to measure 774 565 85 % 67 %
Social Analytics beyond the obvious 575 1.200 33 % 37 %
Top Traffic drivers, bounce rates
Bounce rate: 43 %
Articles Visits Visits previous Bounce rate Bounce rate previous
Organic search 2.320 2.145 48 % 52 %
Paid search 886 882 35 % 36 %
Social media paid 774 565 85 % 67 %
Social media referrals 575 1.200 33 % 37 %
Top Traffic sources, bounce rates
(vs. 48 %)
Content Marketing - Bounce rates
Articles Visits Visits previous Bounce rate Bounce rate previous
How to build a great dashboard 2.320 2.145 48 % 52 %
Dashboarding for winners - become the company hero 886 882 35 % 36 %
Analytics for brand sites - how to choose what to measure 774 565 85 % 67 %
Social Analytics beyond the obvious 575 1.200 33 % 37 %
Top Traffic drivers, bounce rates
Bounce rate: 43 %
Articles Visits Visits previous Bounce rate Bounce rate previous
Organic search 2.320 2.145 48 % 52 %
Paid search 886 882 35 % 36 %
Social media paid 774 565 85 % 67 %
Social media referrals 575 1.200 33 % 37 %
Top Traffic sources, bounce rates
Insights: What happened? Why?
Recommendation: What are we going to do about it? And who is responsible?
Business impact: What will be the result?
Insights: What happened? Why?
Recommendation: What are we going to do about it? And who is responsible?
Business impact: What will be the result?
(vs. 48 % )
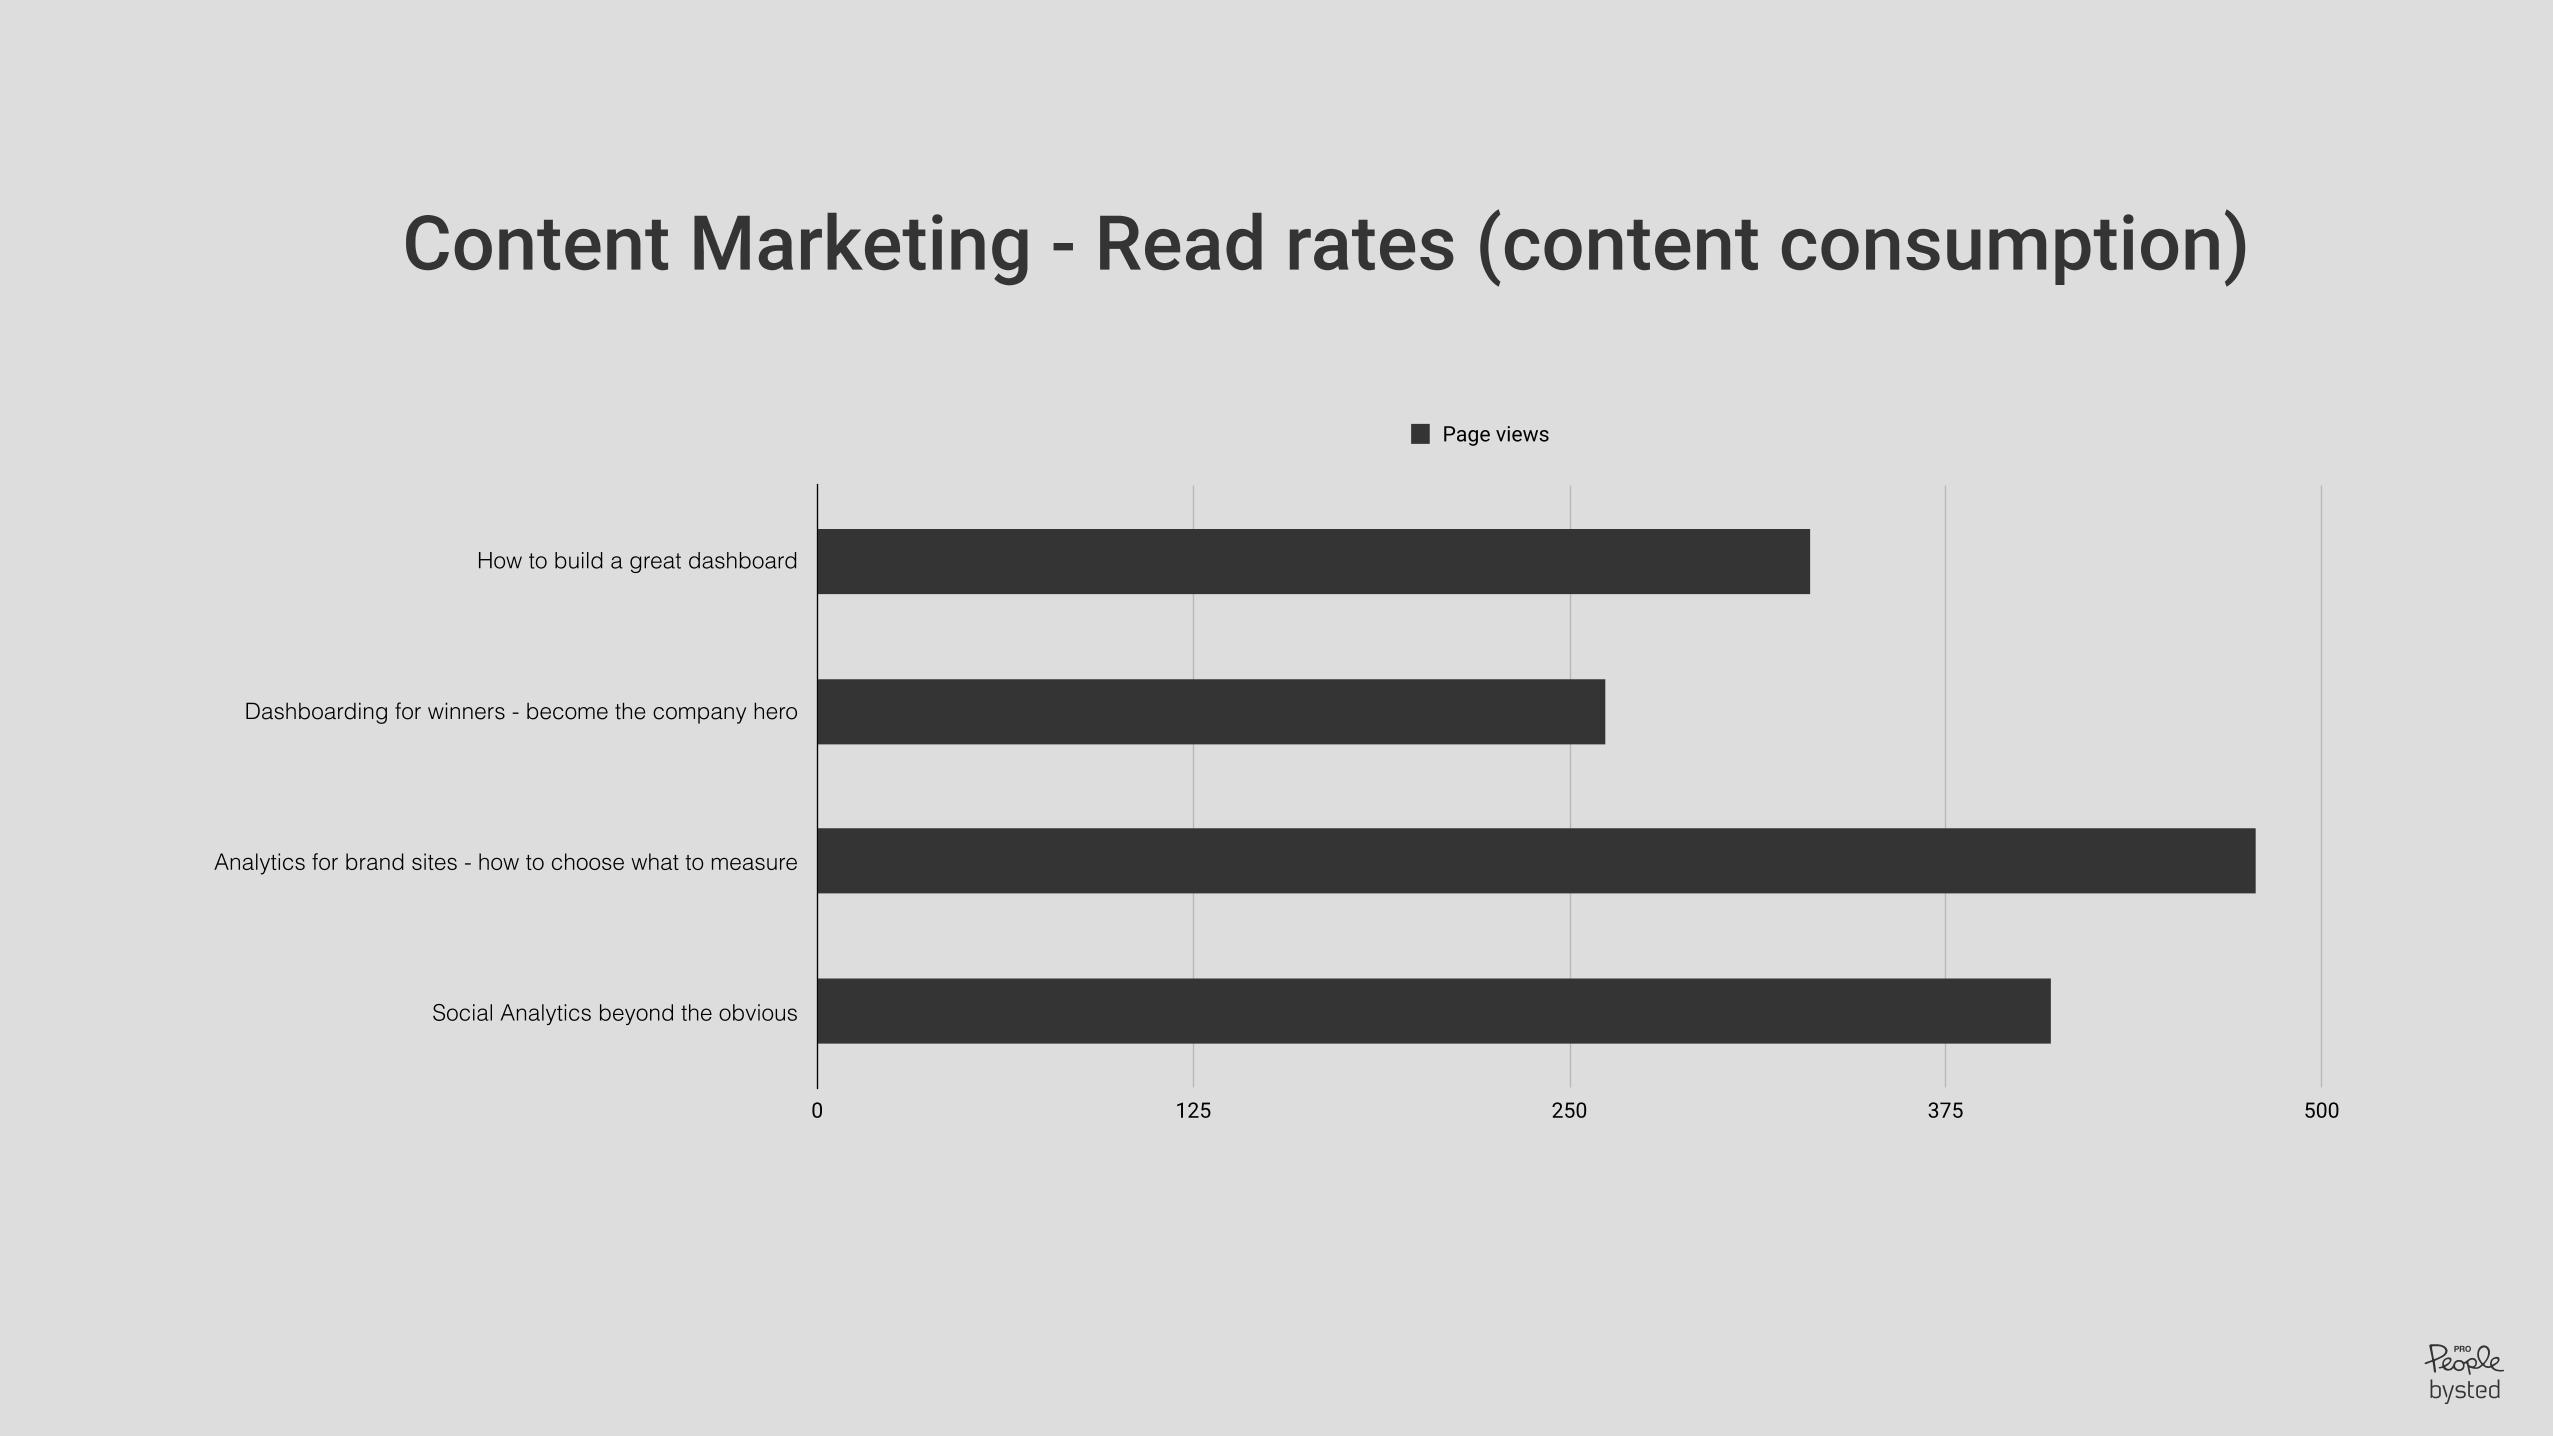
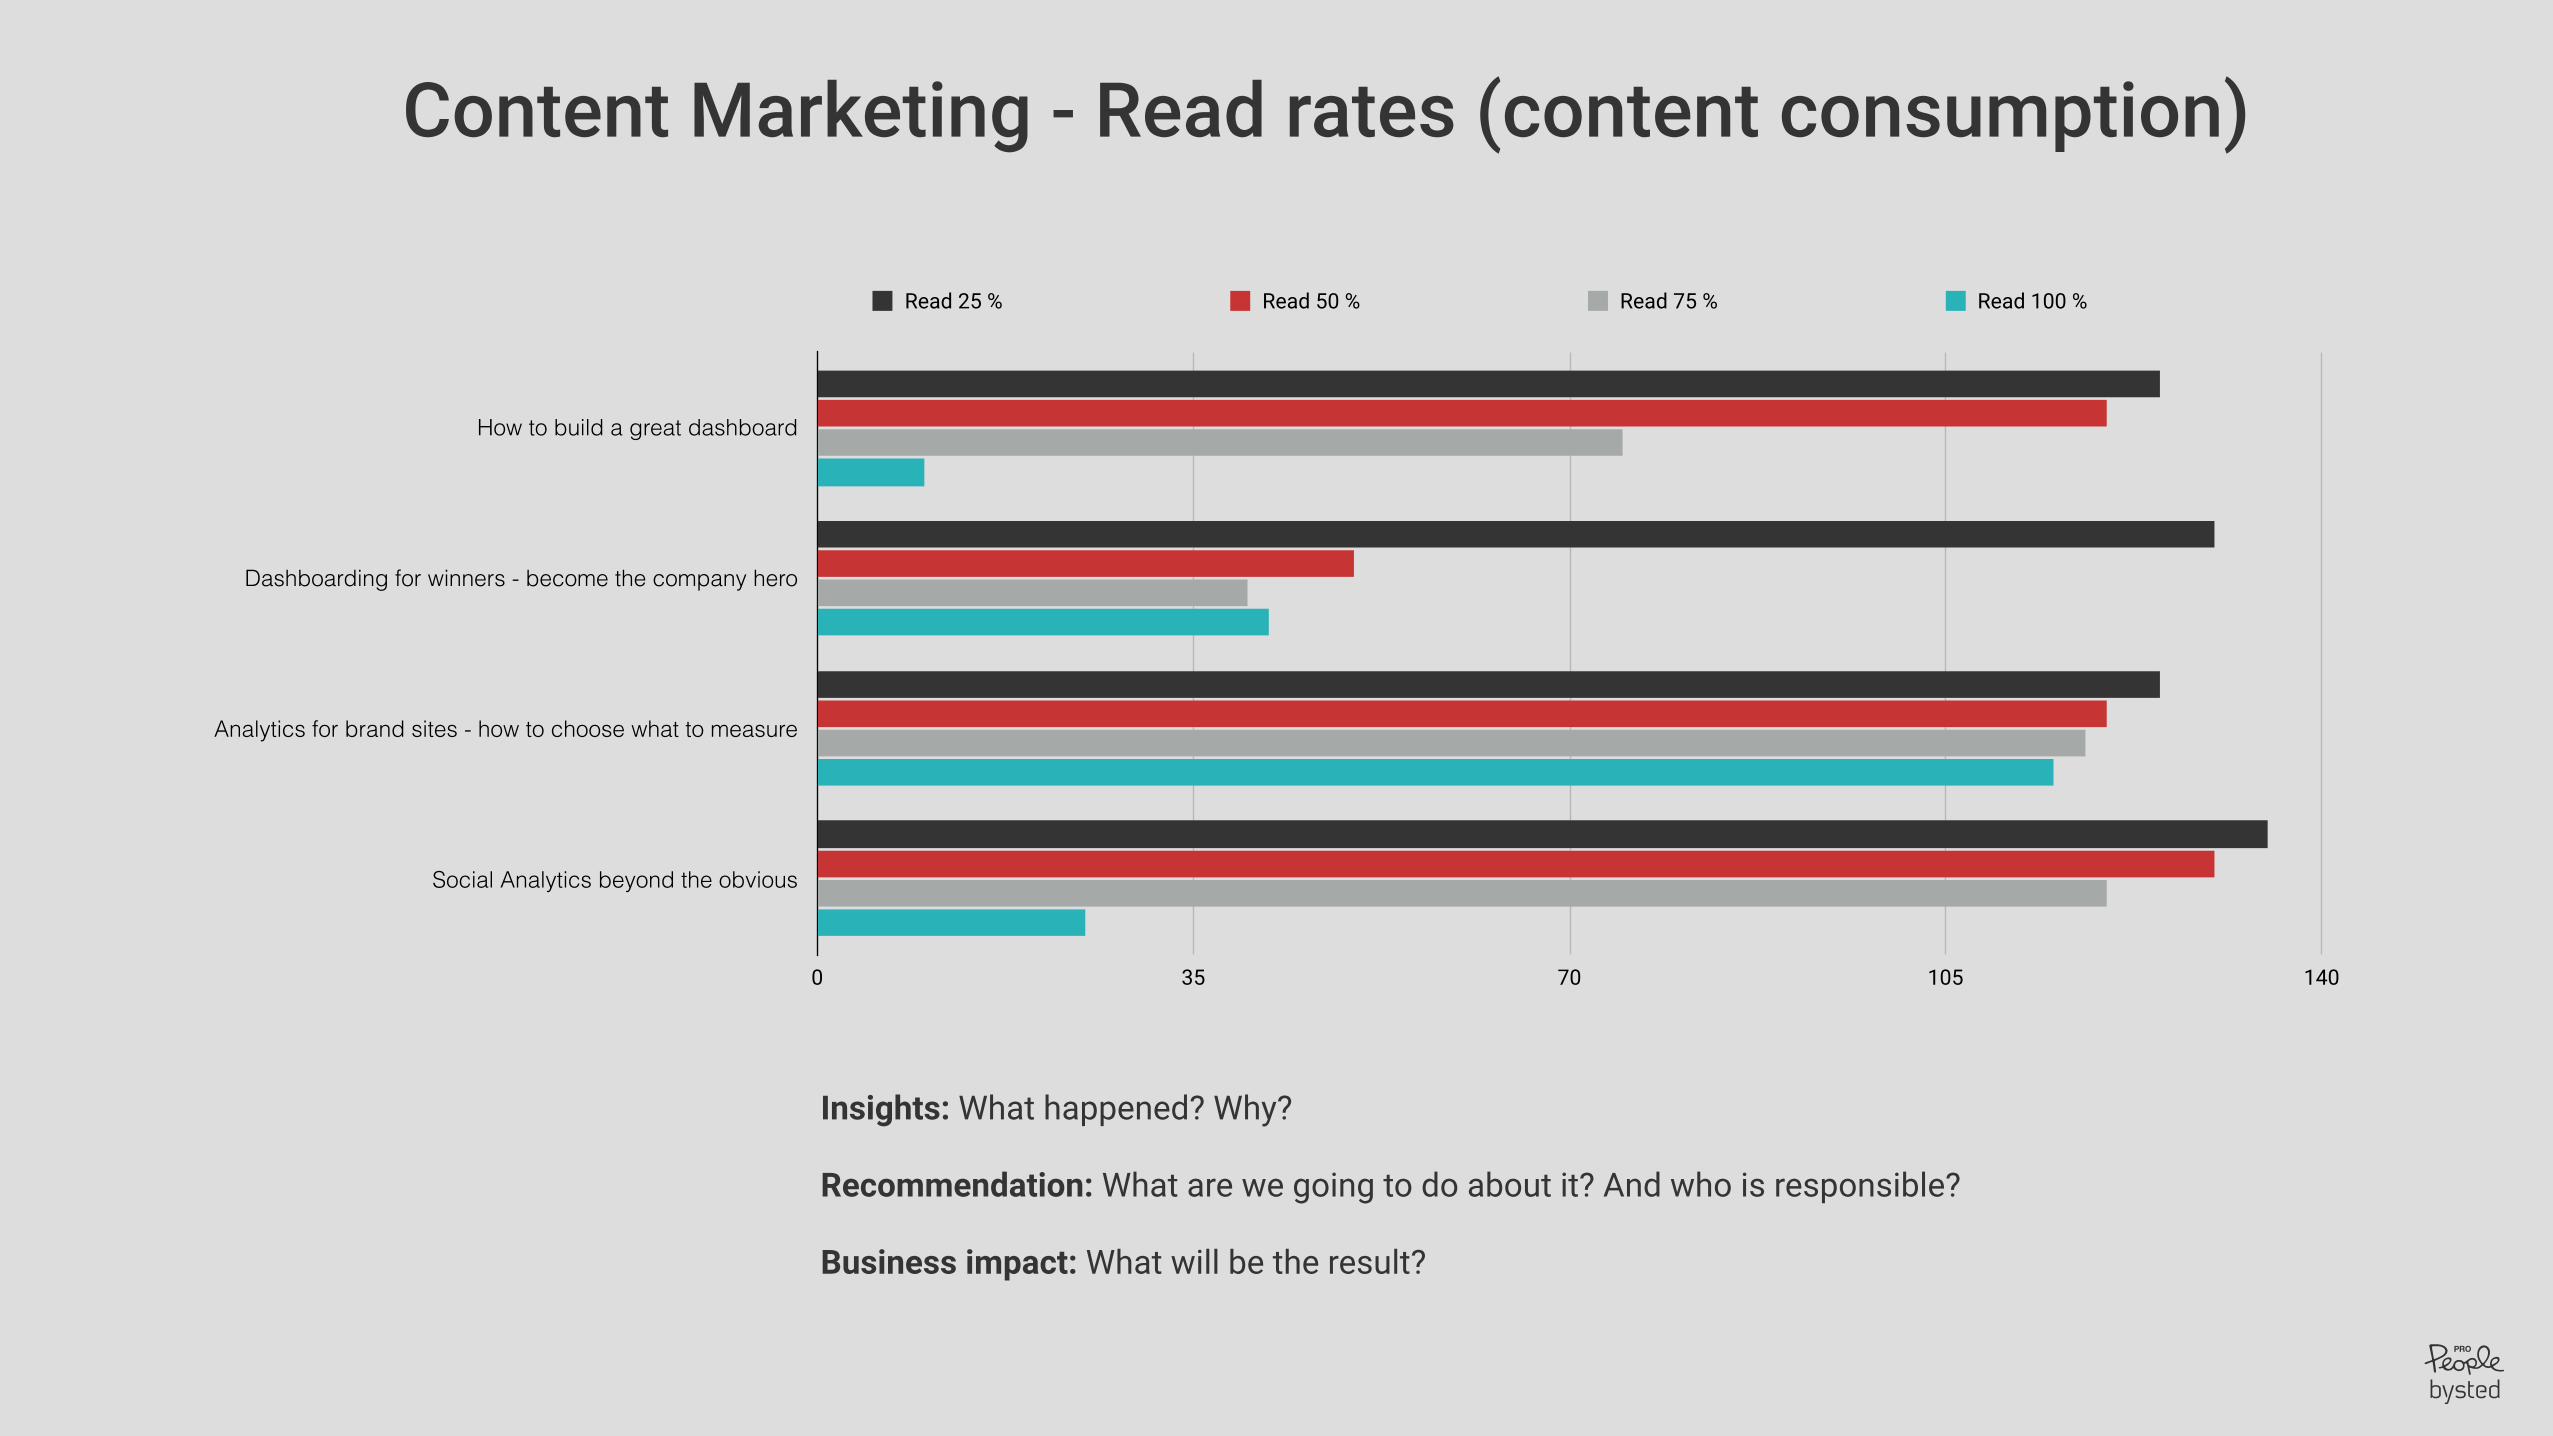
Content Marketing - Read rates (content consumption)
How to build a great dashboard
Dashboarding for winners - become the company hero
Analytics for brand sites - how to choose what to measure
Social Analytics beyond the obvious
0 125 250 375 500
Page views
Content Marketing - Read rates (content consumption)
How to build a great dashboard
Dashboarding for winners - become the company hero
Analytics for brand sites - how to choose what to measure
Social Analytics beyond the obvious
0 35 70 105 140
Read 25 % Read 50 % Read 75 % Read 100 %
Insights: What happened? Why?
Recommendation: What are we going to do about it? And who is responsible?
Business impact: What will be the result?
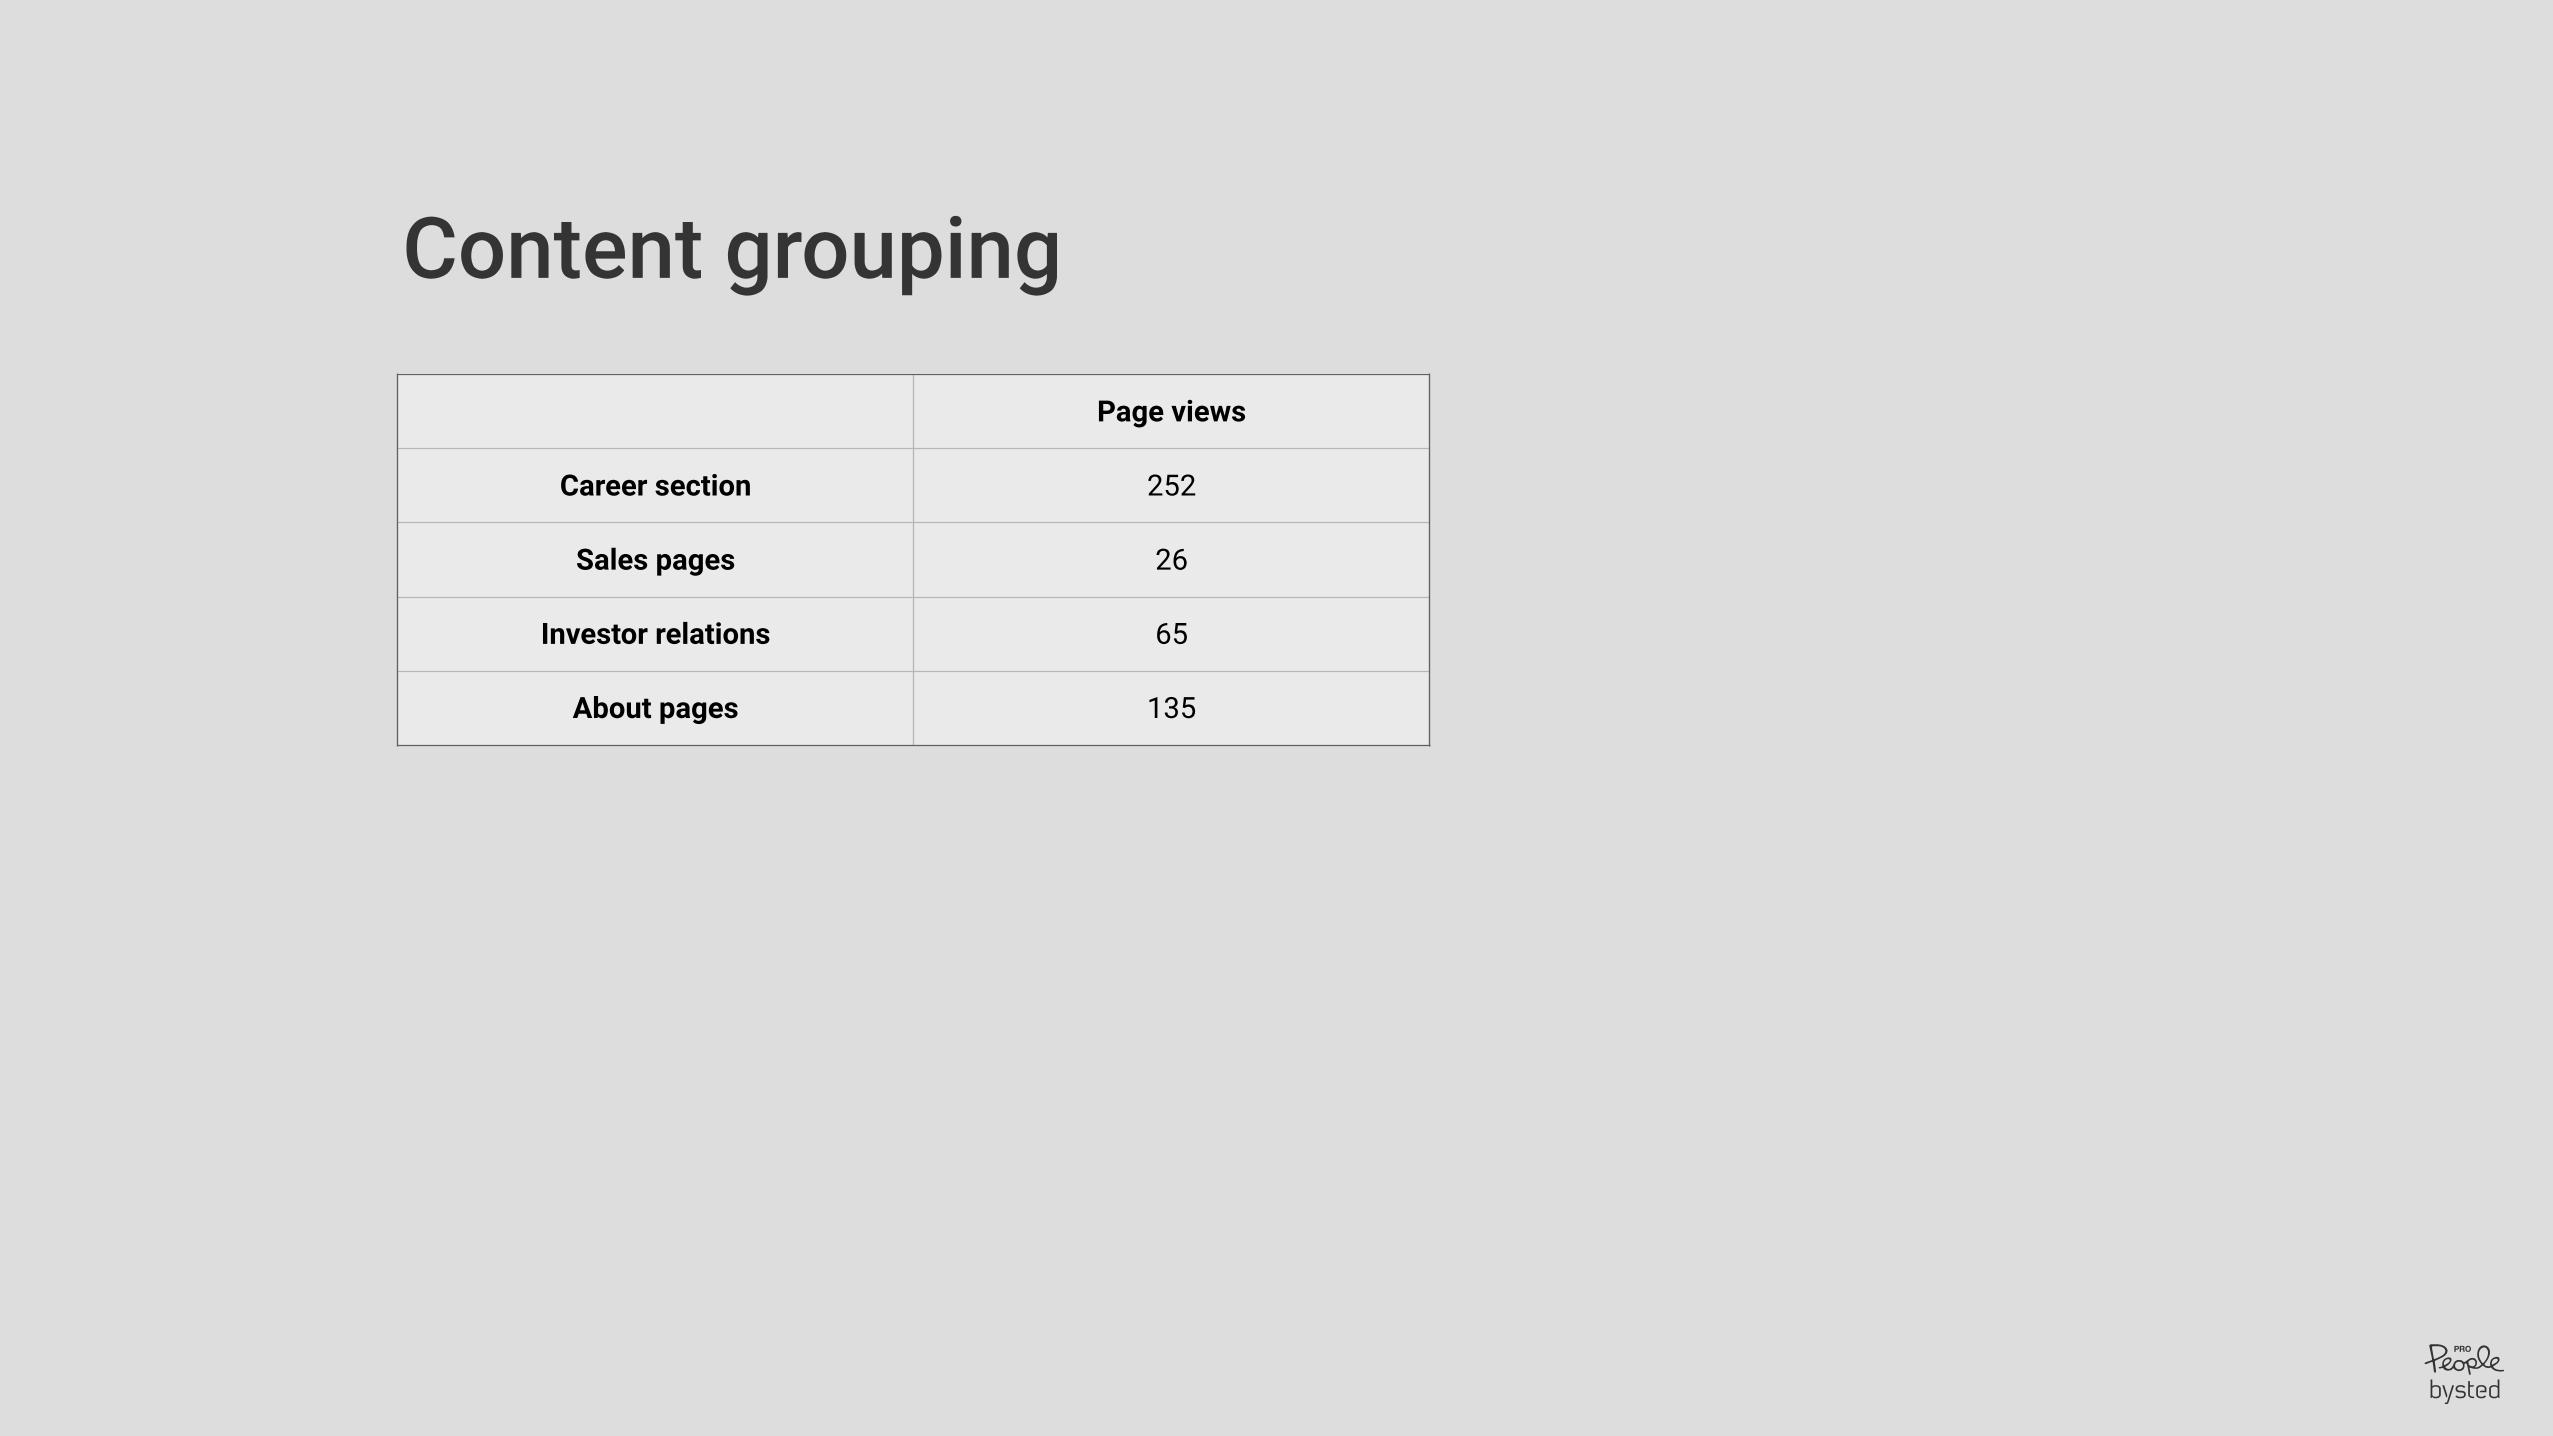
Content grouping
Page views
Career section 252
Sales pages 26
Investor relations 65
About pages 135
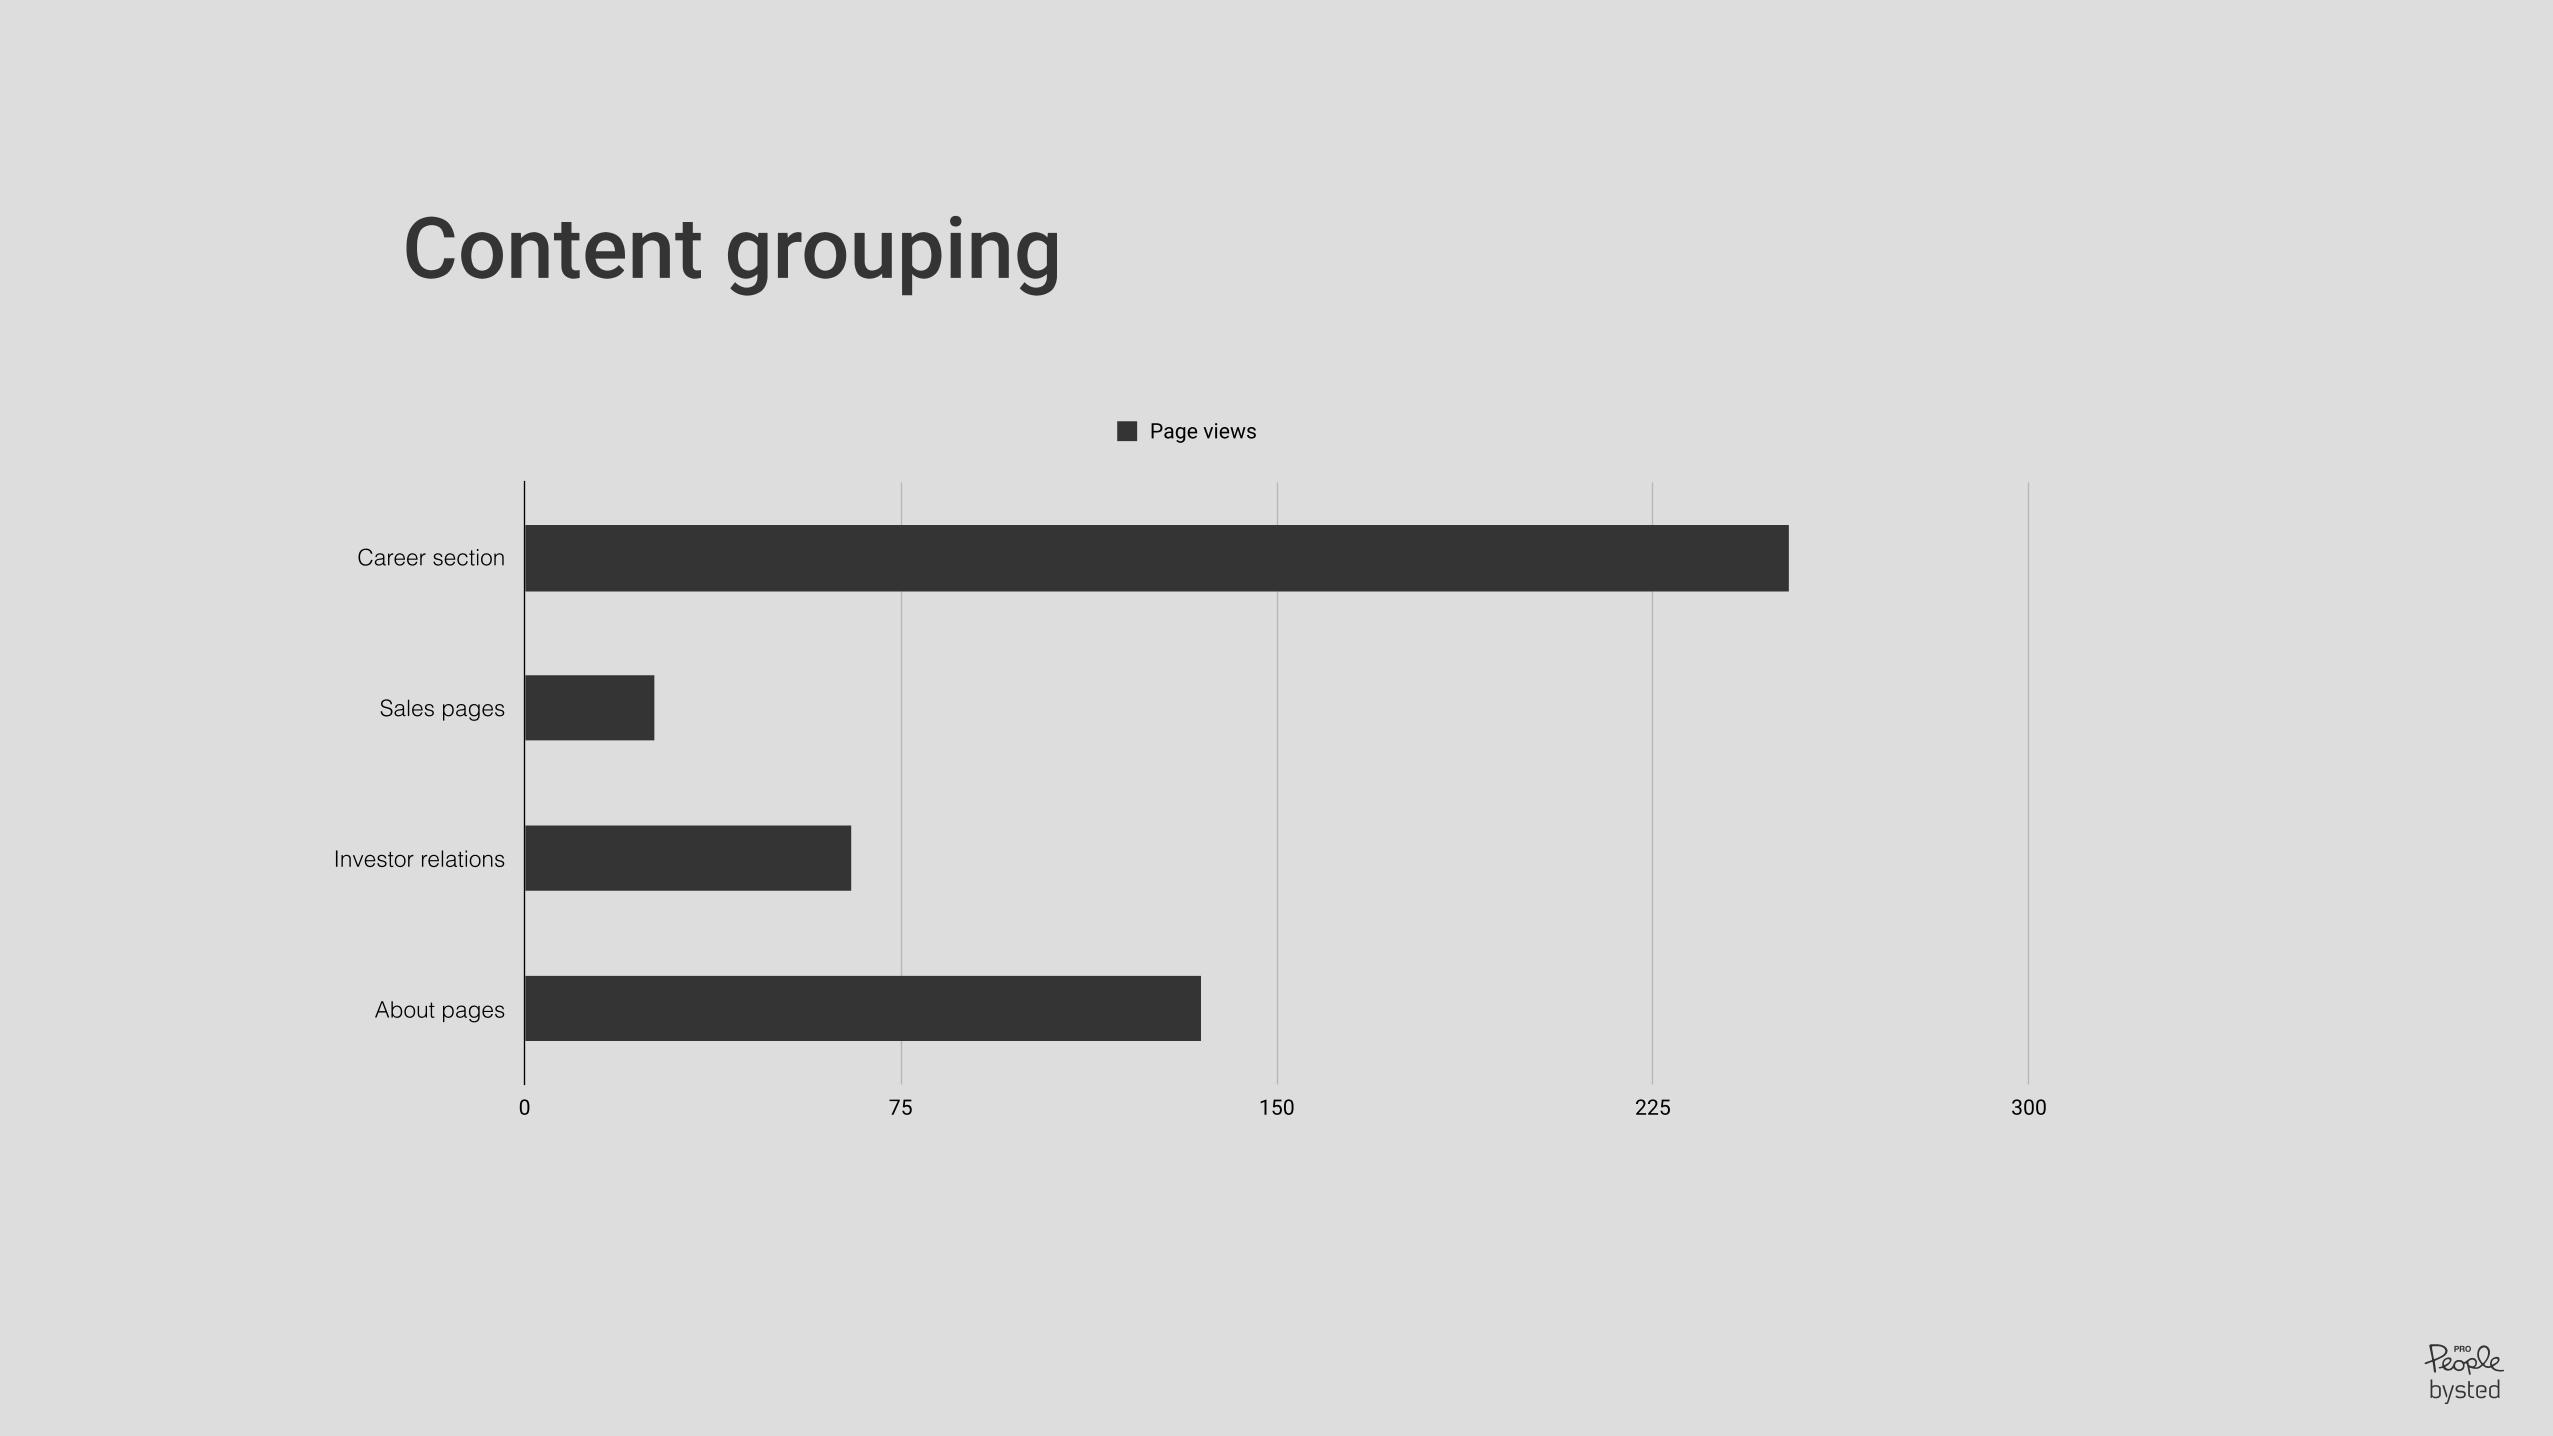
Content grouping
Career section
Sales pages
Investor relations
About pages
0 75 150 225 300
Page views
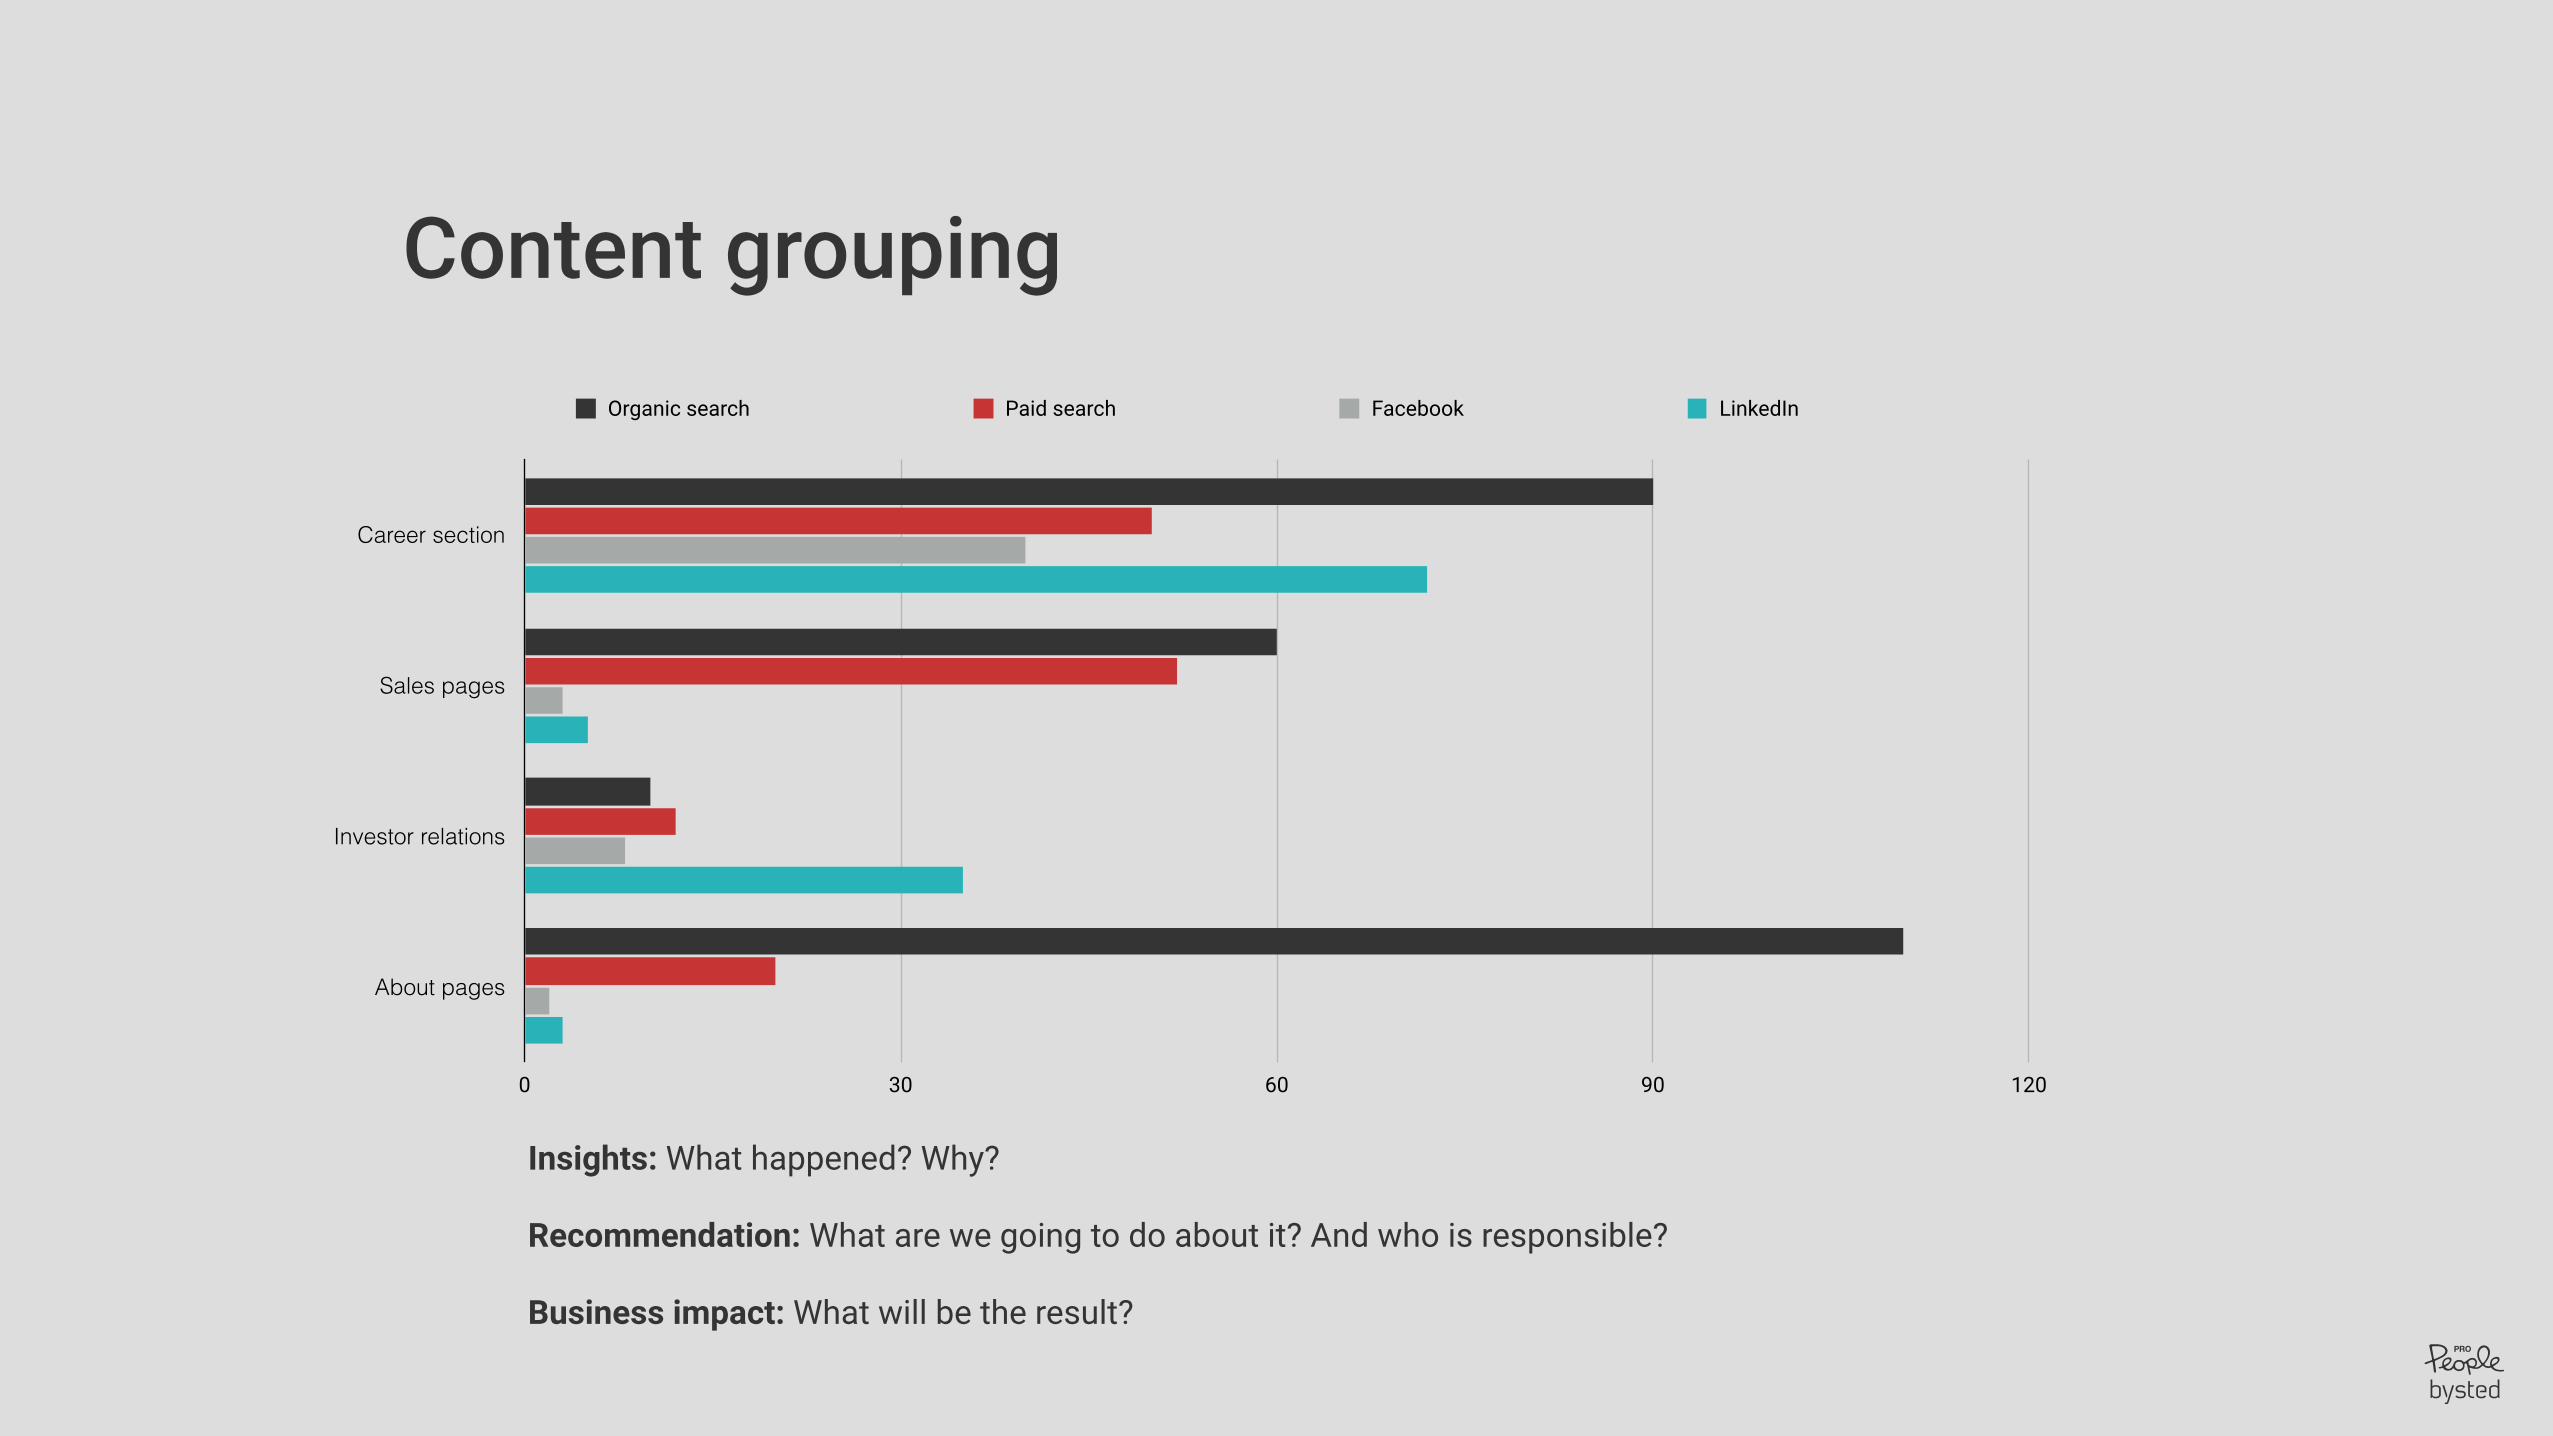
Content grouping
Career section
Sales pages
Investor relations
About pages
0 30 60 90 120
Organic search Paid search Facebook LinkedIn
Insights: What happened? Why?
Recommendation: What are we going to do about it? And who is responsible?
Business impact: What will be the result?
Becoming a hero - tip # 5 Adding context and segmentation turns data into information. YOU can turn information into insights.

04 Where to begin?
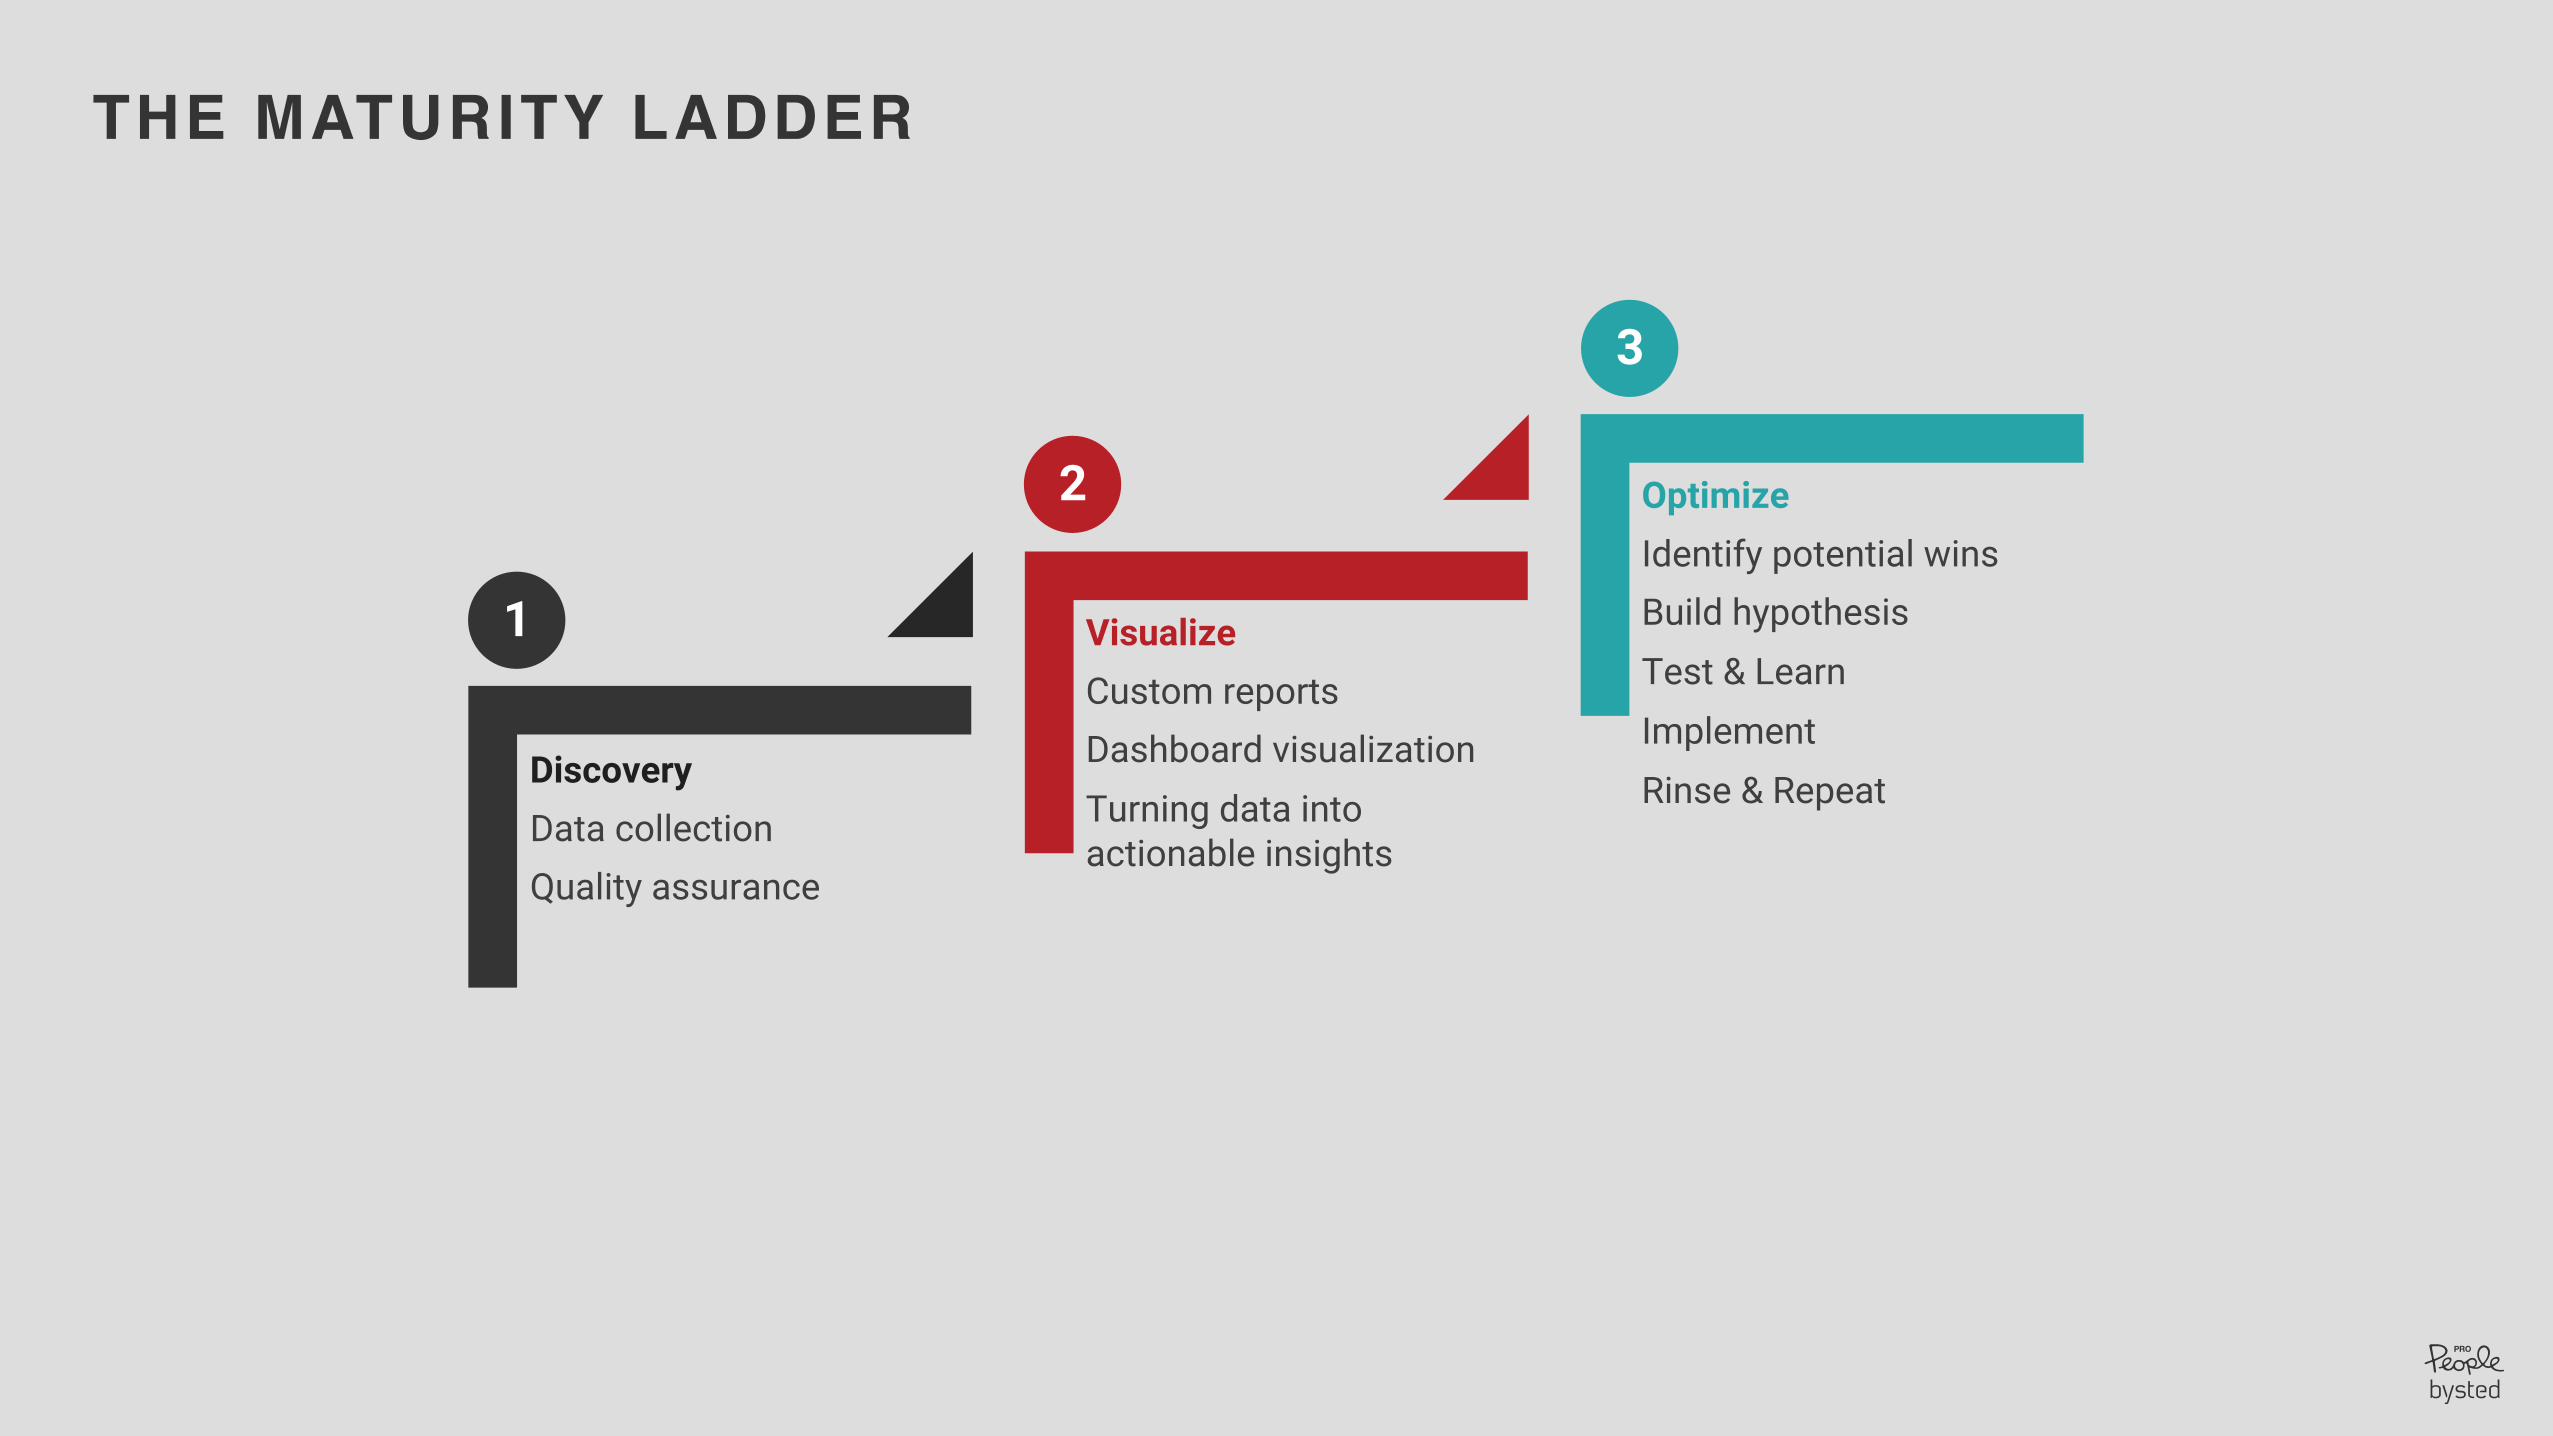
THE MATURITY LADDER
Discovery
Data collection Quality assurance
Visualize
Custom reports Dashboard visualization Turning data into actionable insights
Optimize
Identify potential wins Build hypothesis Test & Learn Implement Rinse & Repeat
1
2
3
Becoming a hero - tip # 6 Obsess about data quality. The only thing worse than not having a dashboard is having a polluted dashboard!
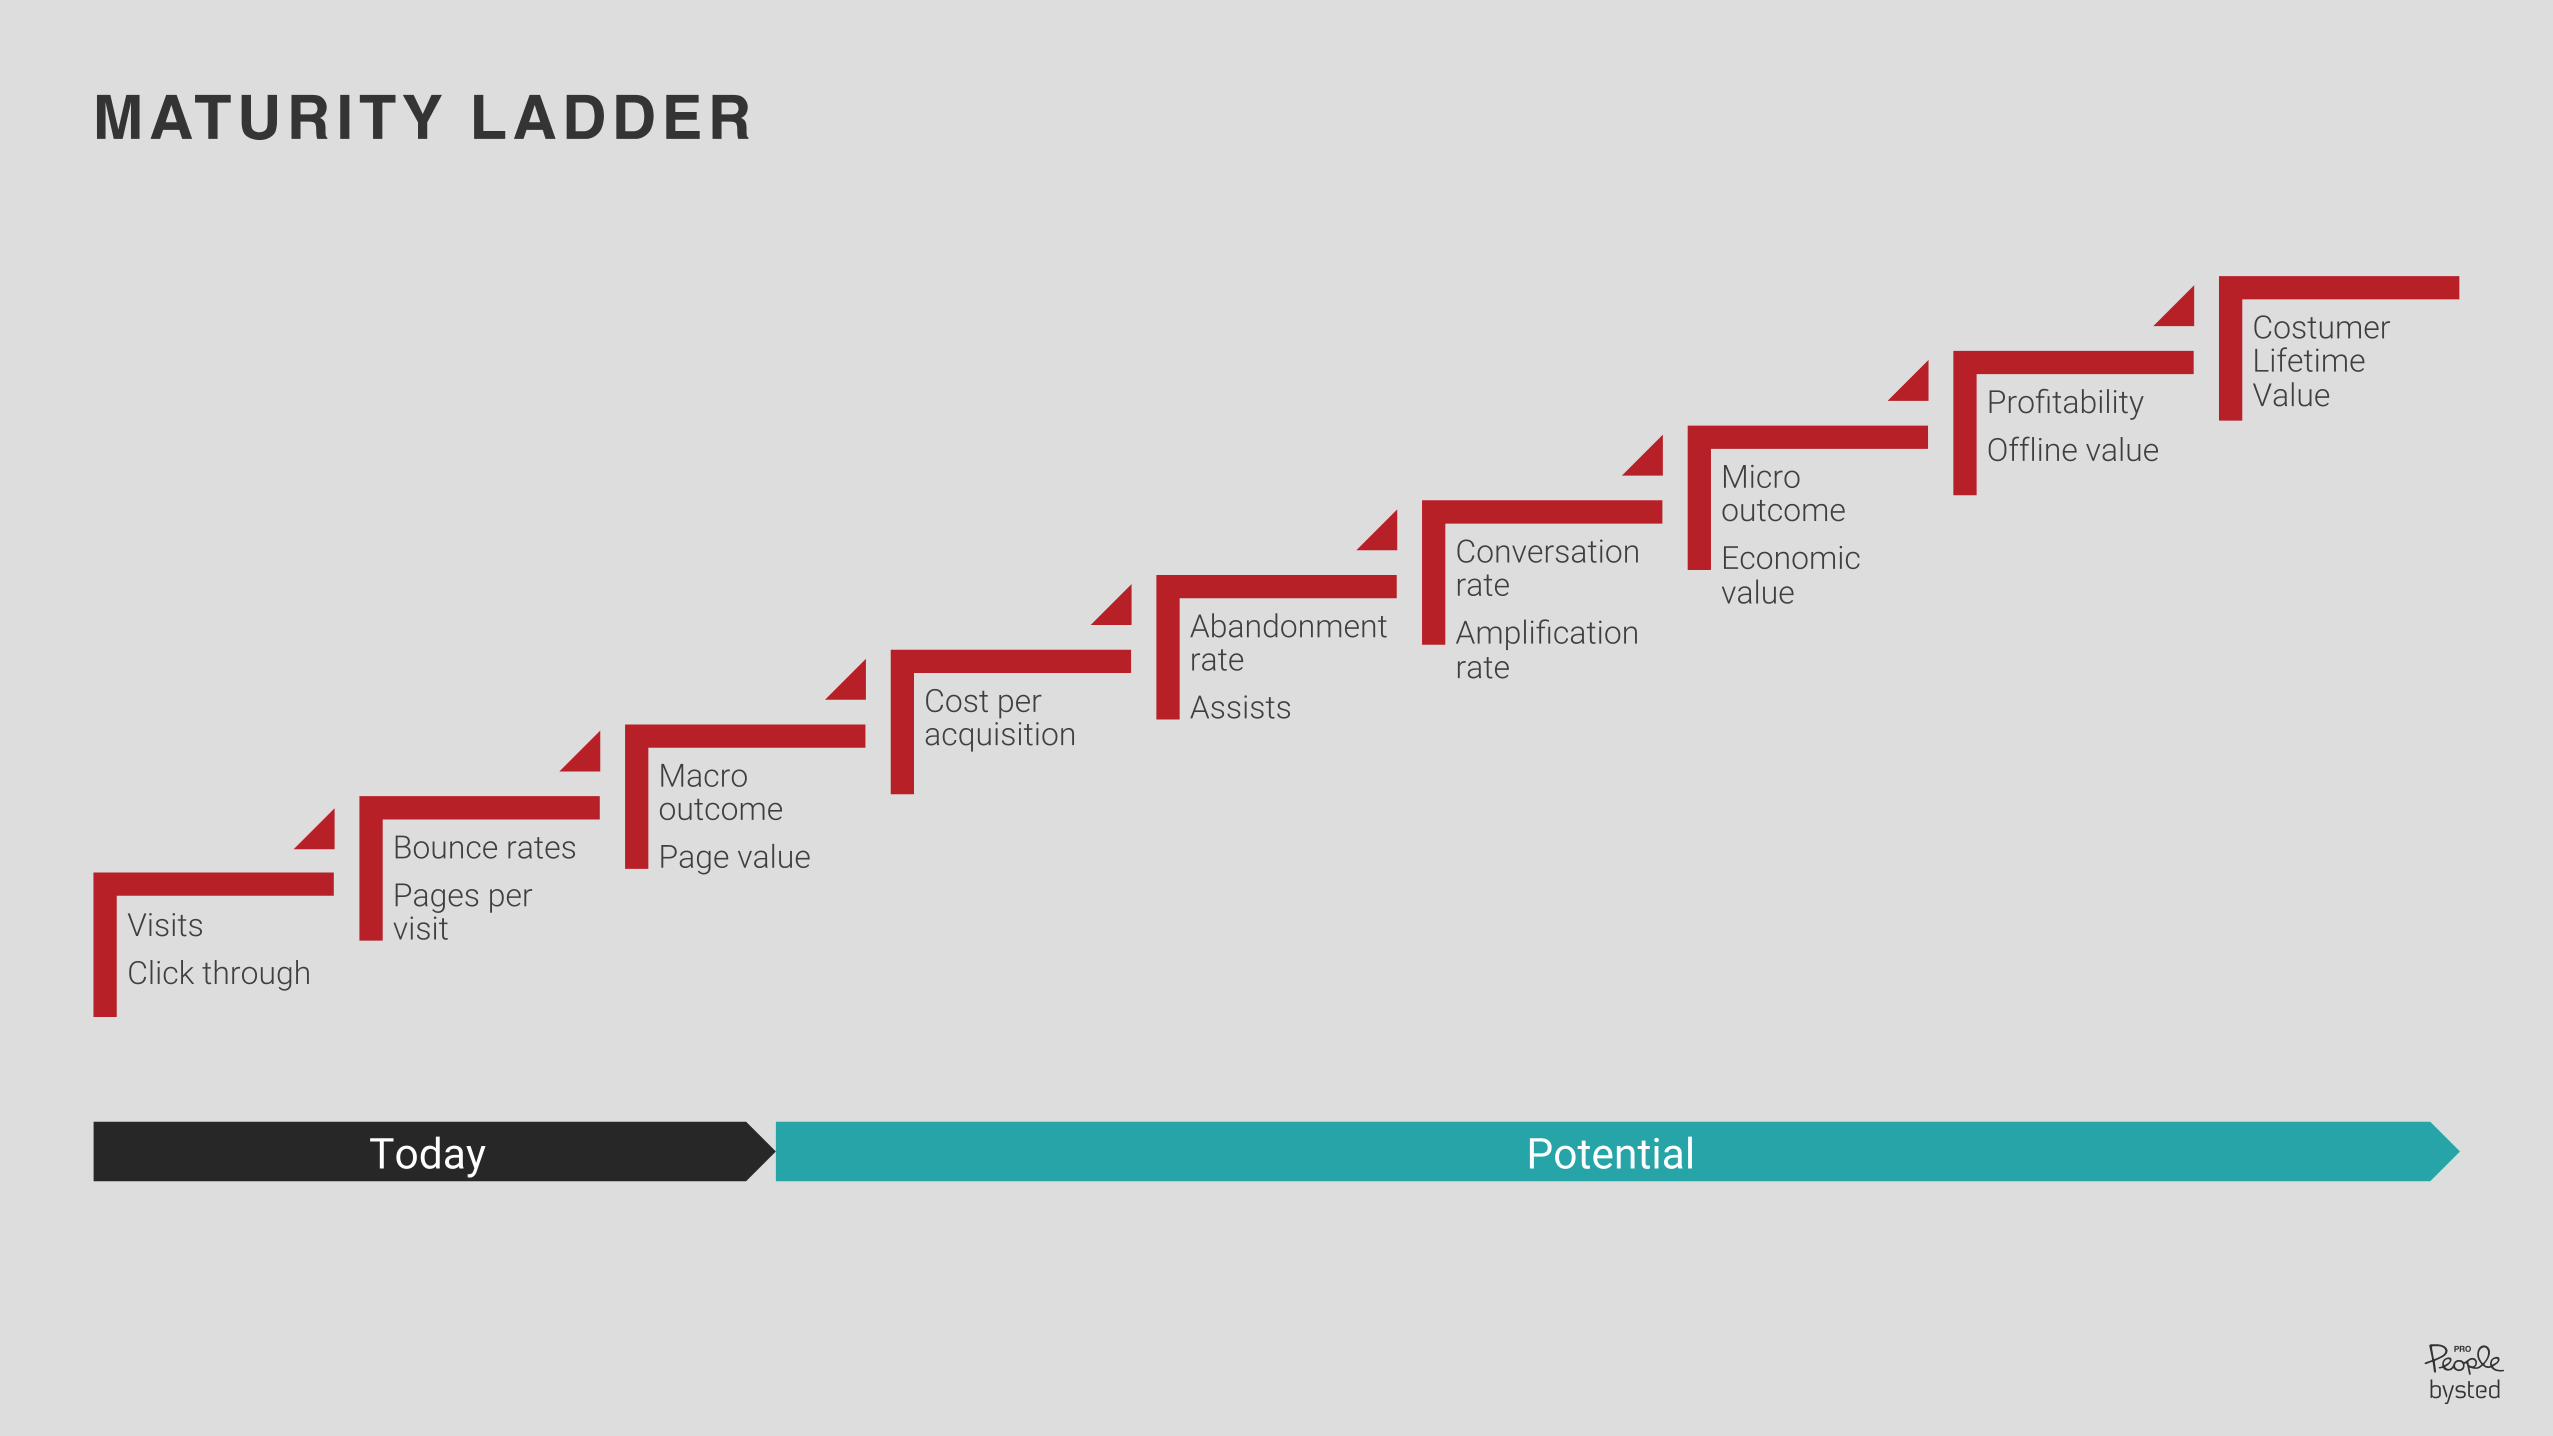
MATURITY LADDER
Visits
Click through
Bounce rates
Pages per
visit
Macro
outcome
Page value
Cost per
acquisition
Abandonment
rate
Assists
Conversation
rate
Amplification
rate
Micro
outcome
Economic
value
Profitability
Offline value
Costumer
Lifetime
Value
Today Potential
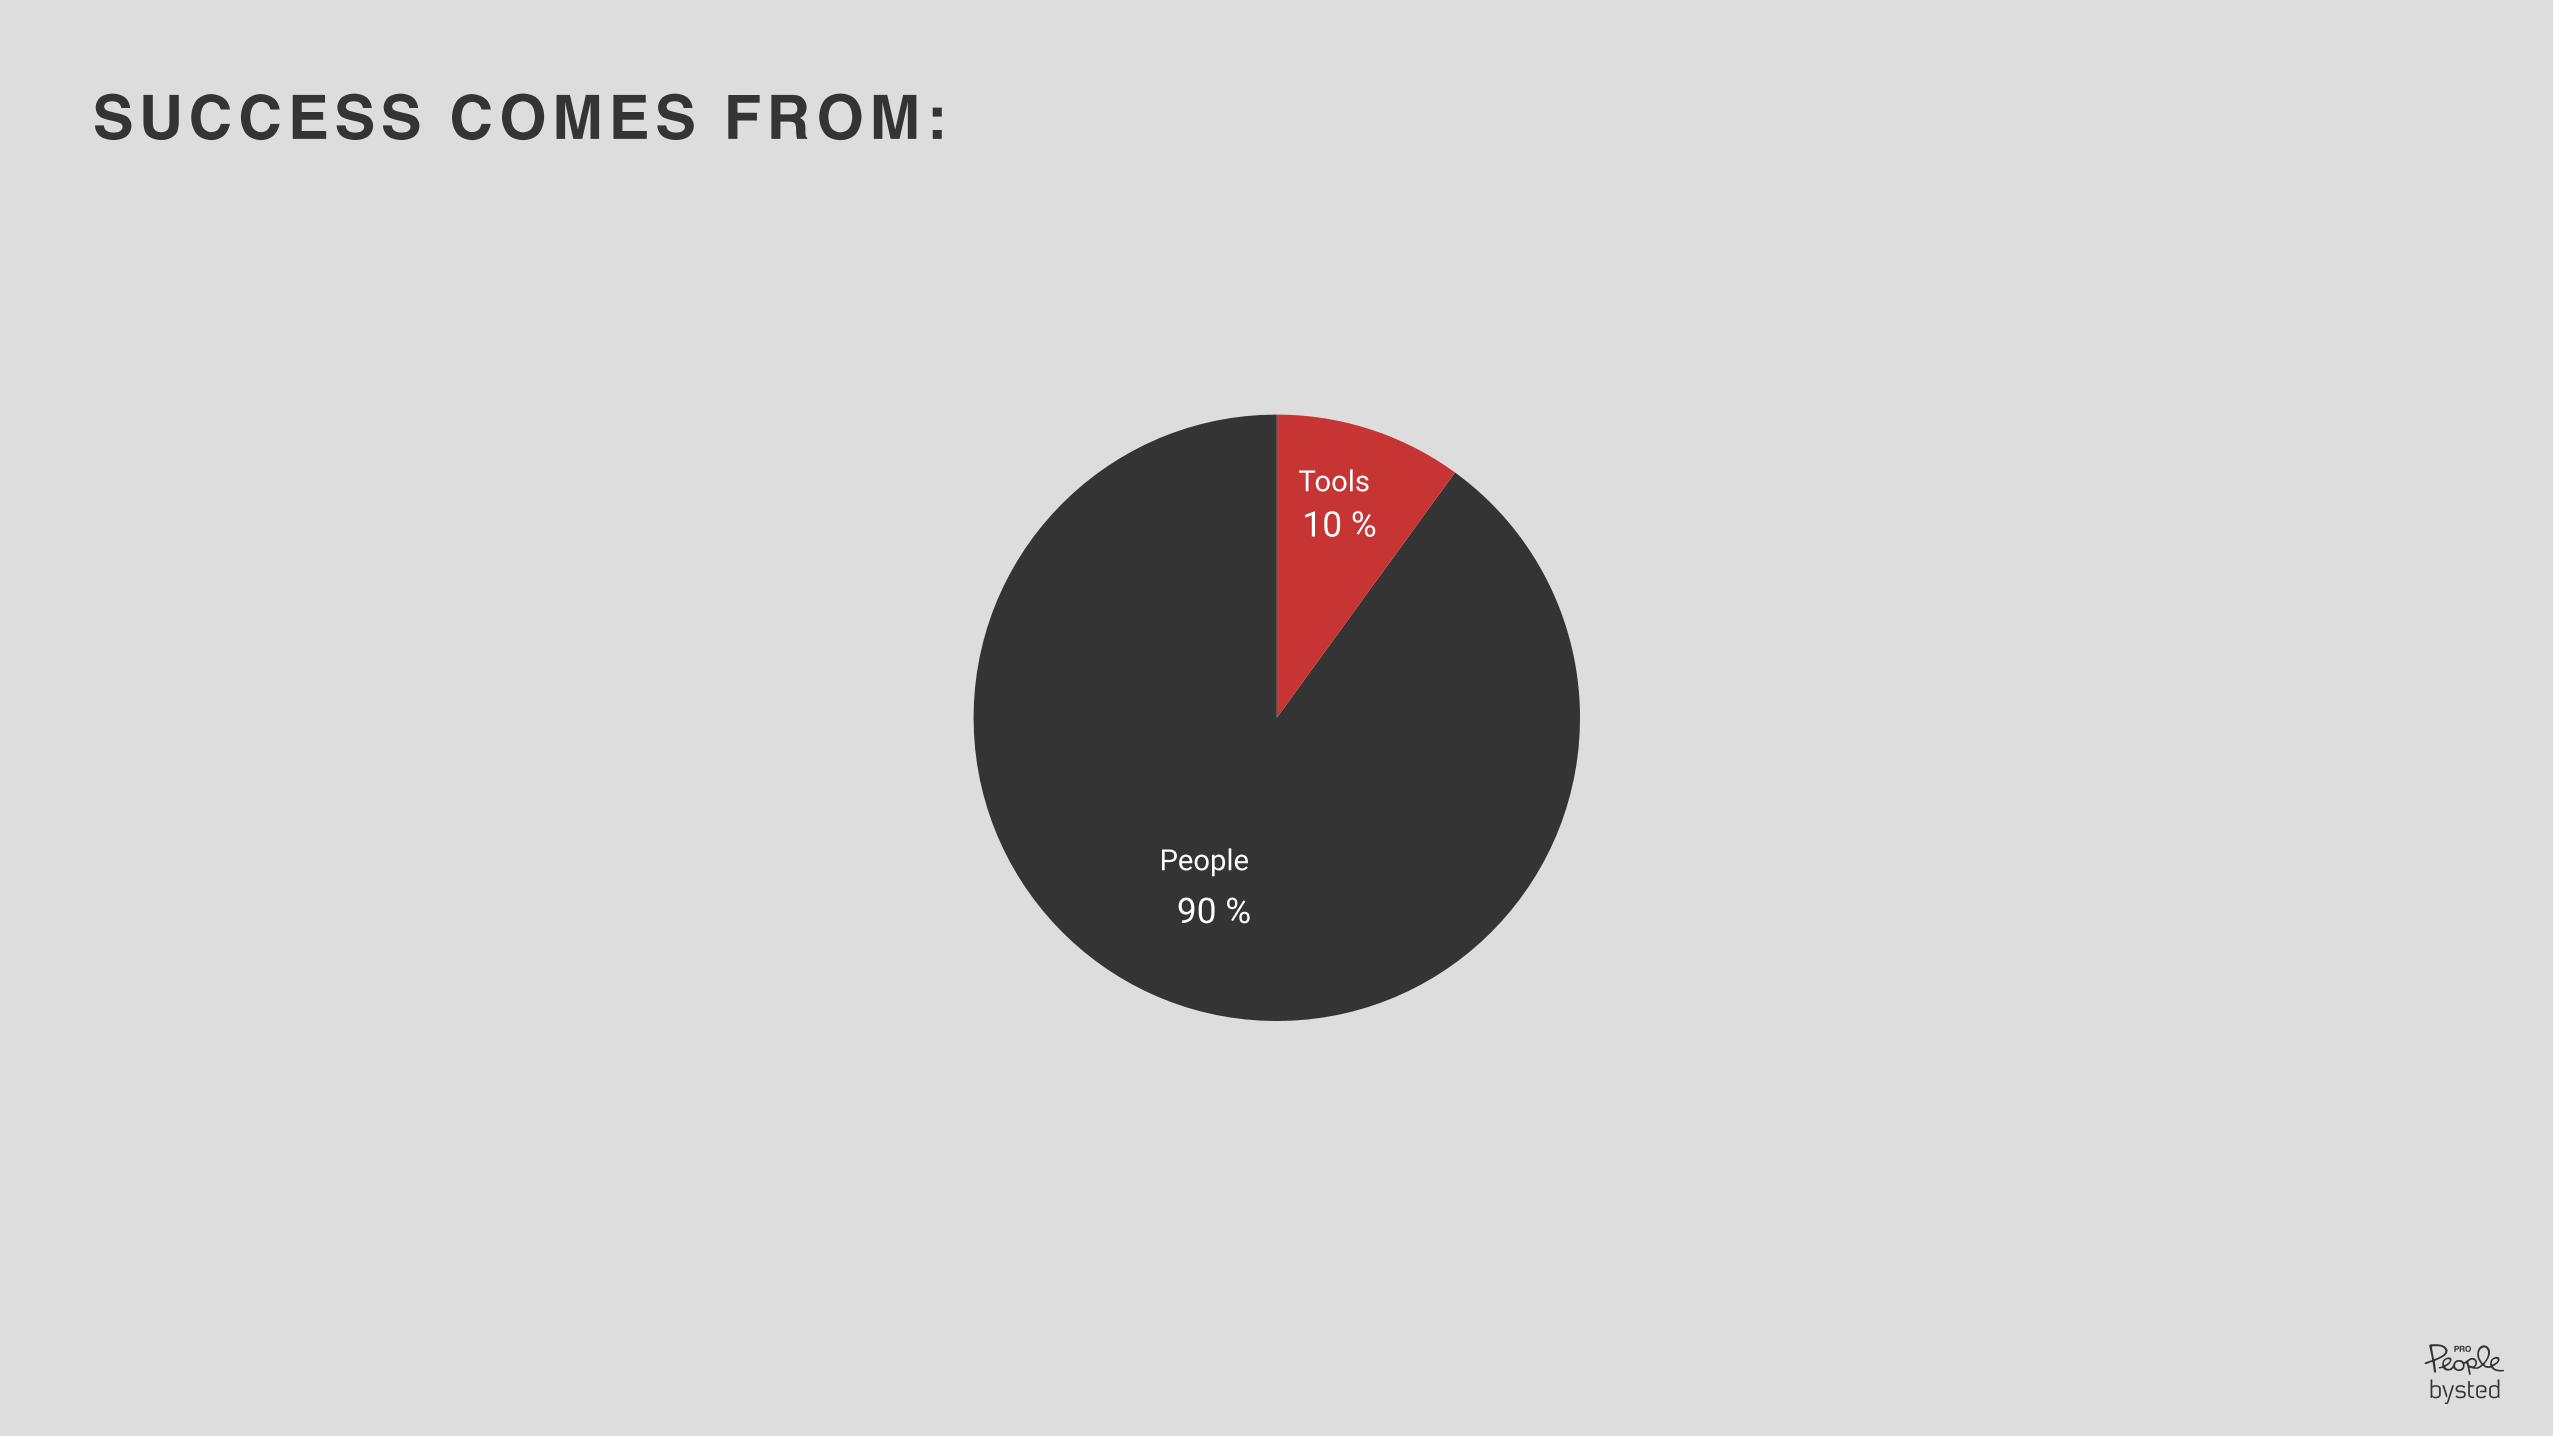
SUCCESS COMES FROM:
90 %
10 %Tools
People
Becoming a hero - tip # 7 Success comes from 10 % tools and 90 % people - build, buy or hire the competences.
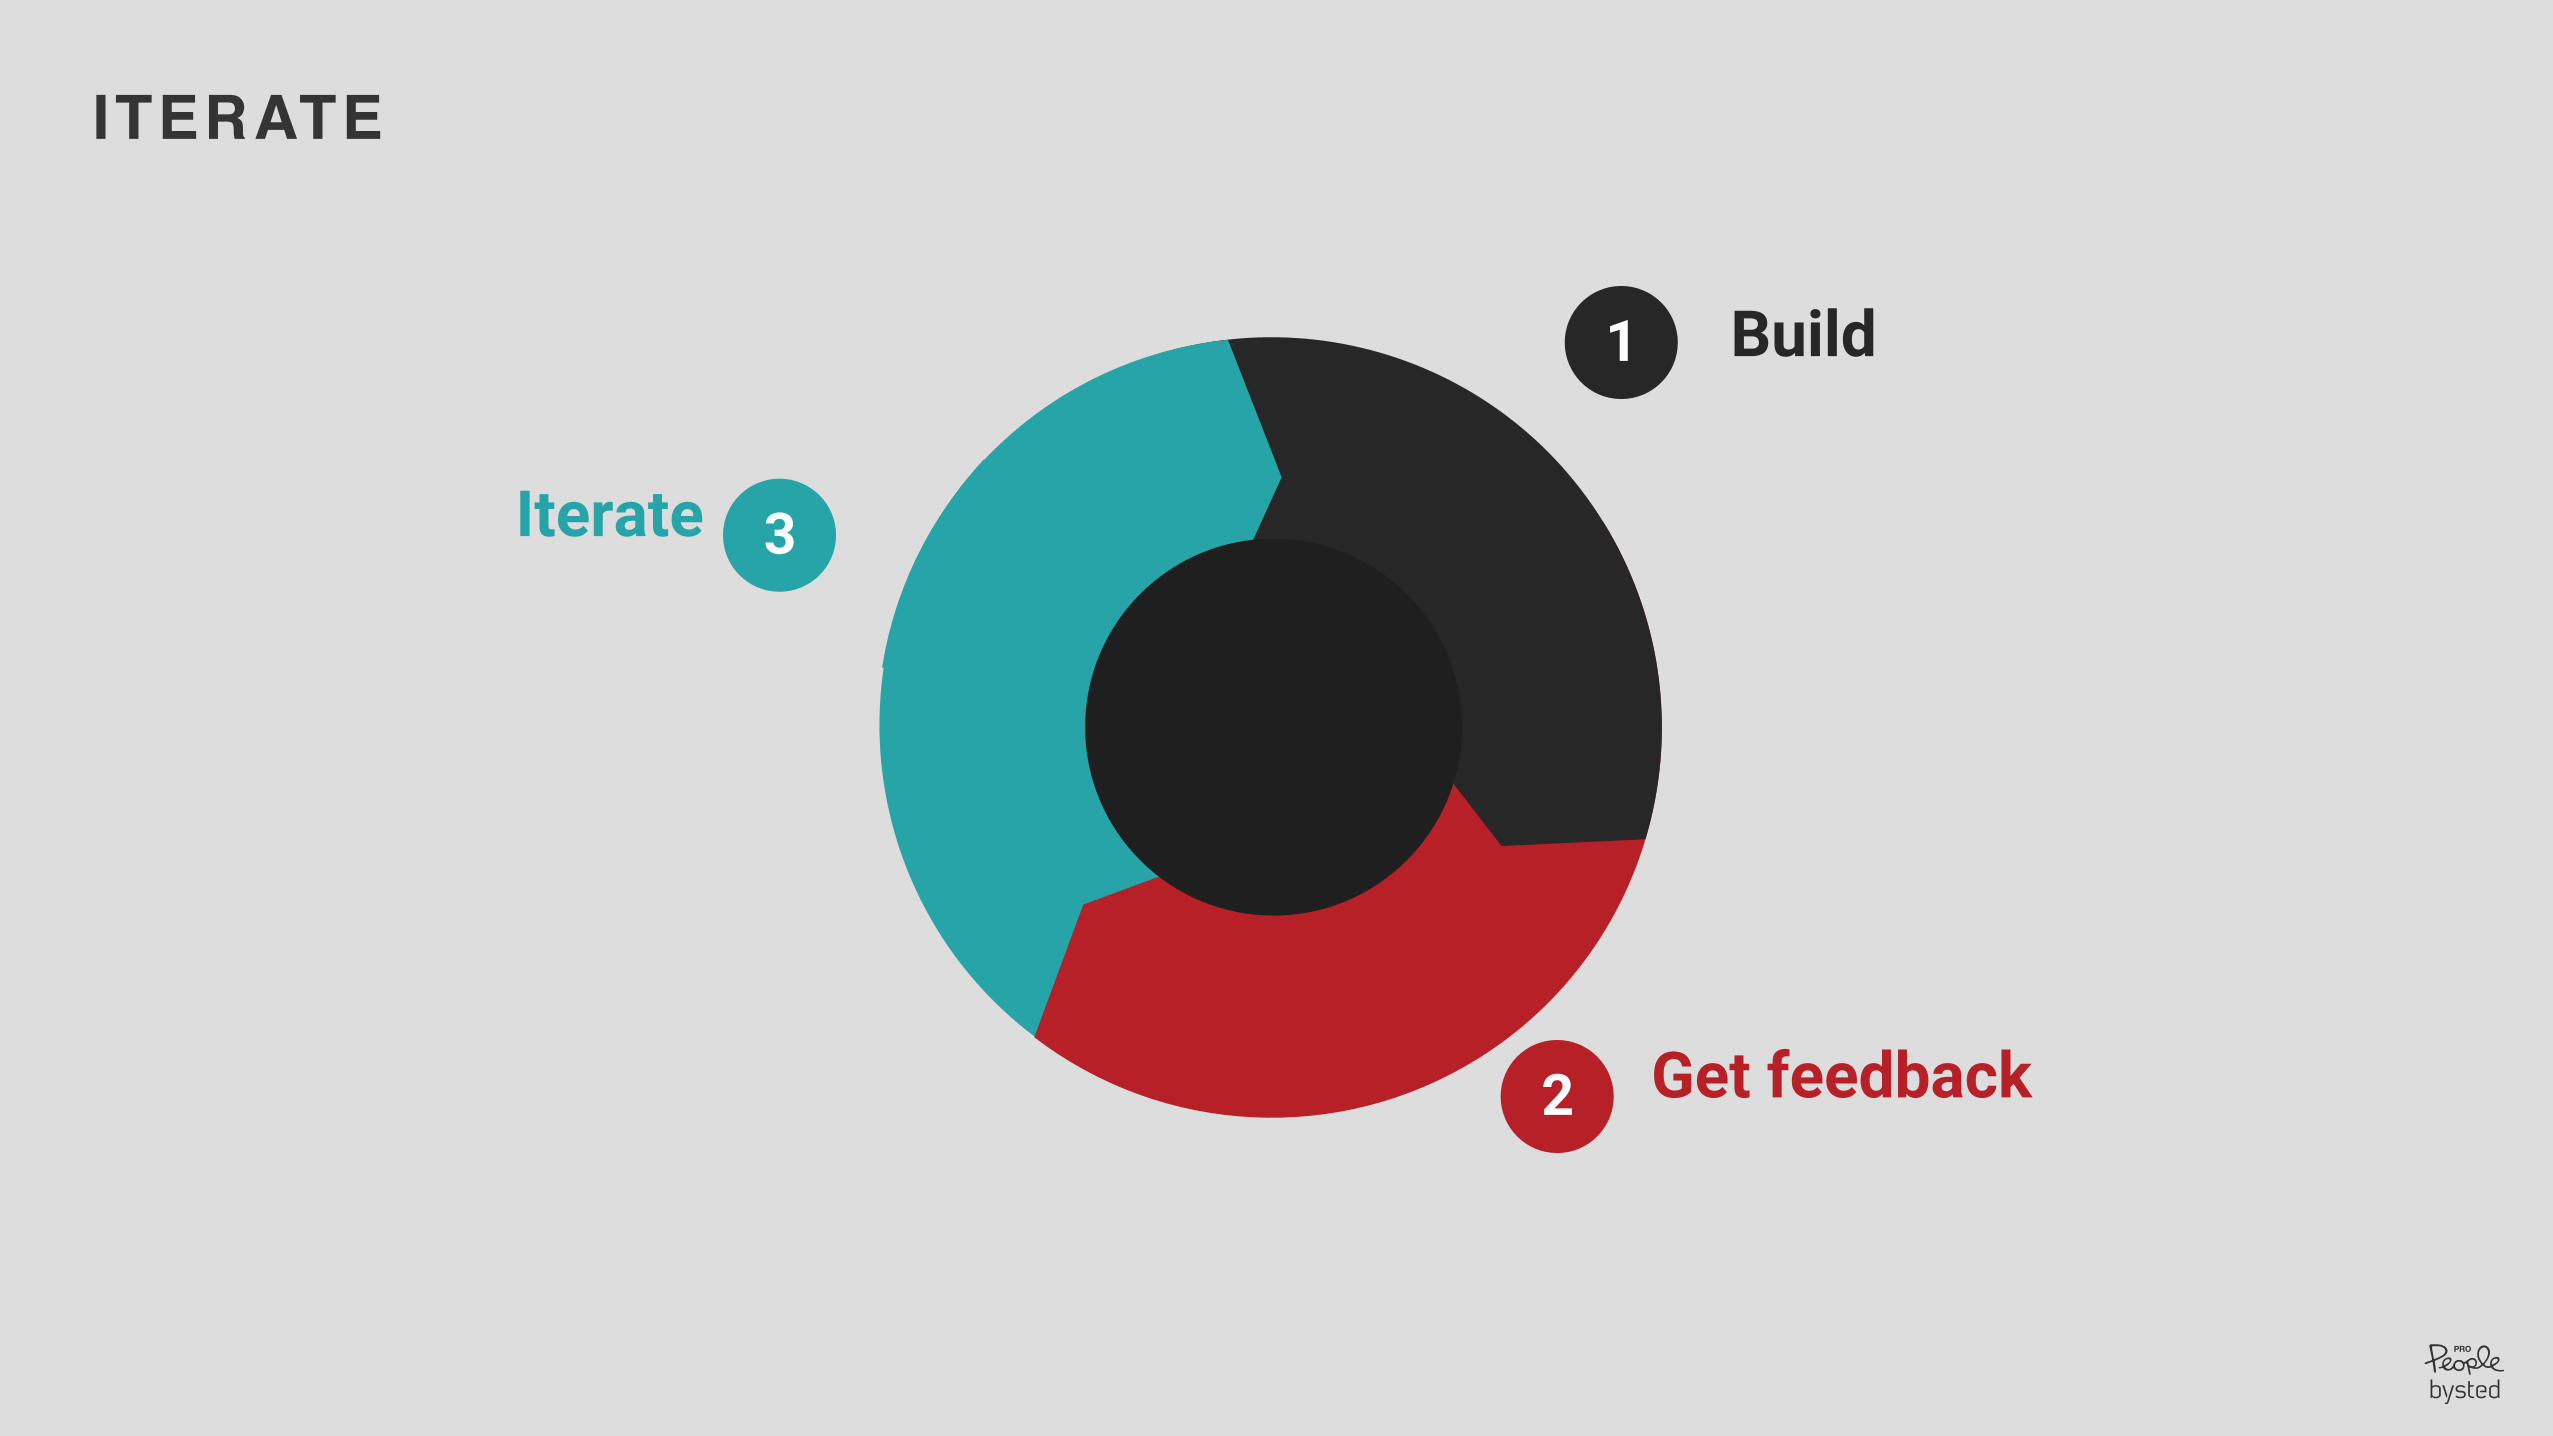
ITERATE
1
2
3
Get feedback
Build
Iterate
Becoming a hero - tip # 8 A dashboard is not static. The best dashboards are evolving over time and are updated when business focus is changing.
Questions or thoughts?

Thank you!
Slides and evaluation form on http://speakerscore.com/DASHBOARD
Morten B lumensaadtDig i ta l S t ra teg is tP ropeop le /Bys ted
mor ten@propeop le .dk+45 22718969