SnapLogic Tutorial
43
SnapLogic ® Tutorials Document Release: October 2013 SnapLogic, Inc. 2 West 5th Ave, Fo urth Floo r San Mateo, Cali fornia 94402 U.S.A. www.snaplogic.com
-
Upload
avi1champion -
Category
Documents
-
view
230 -
download
0
Transcript of SnapLogic Tutorial
8/13/2019 SnapLogic Tutorial
http://slidepdf.com/reader/full/snaplogic-tutorial 1/43
SnapLogic ® Tutorials
Document Release: October 2013
SnapLogic, Inc.2 West 5th Ave, Fourth Floor San Mateo, California 94402U.S.A. www.snaplogic.com
8/13/2019 SnapLogic Tutorial
http://slidepdf.com/reader/full/snaplogic-tutorial 2/43
Table of Contents
SnapLogic® Tutorials 1
Table of Contents 2
SnapLogic Overview 4
Glossary 4
The Tutorial Environment 4
About the Tutorial 5
Exercise 1: Working with Components 6
Reviewing the Sample Leads to Prospects Pipeline 6
Hands-on Ex ercise: Creating Components 8
Creating a Writer Component 11
Building the Read-Write Pipeline 12
Exercise 2: Fil tering Data 16
Reviewin g the California Prospects Pipeline 16
Hands-on Exercise: Creating a Filter Component 17
Duplicating Components 19
Building the Read -Write-Filter Pipeline 20
Exercise 3: Data Services 22
Reviewing the Census Feed and Qualified California Pip el ines 22
Hands-On Exercise: Data Servi ces 25
Creating a Join Component 27
Duplicating a W riter Component 28
Building a Data Service Pipeline 29
Exercise 4: Data Sorting 32
Reviewing the Filte red Qualifying California Prospects Pip eline 32
Hands-on Exercise : Sorting Data 34
Exercise 5: Utilizing Pass-Through 38
Reviewing the Calif ornia Prospects Pipeline, Exercise 5 38
Hands-on Exercise: Im plementing Pass-Through 39
- 2 -

8/13/2019 SnapLogic Tutorial
http://slidepdf.com/reader/full/snaplogic-tutorial 3/43
SnapLogic ® Tutorials
- 3 -
8/13/2019 SnapLogic Tutorial
http://slidepdf.com/reader/full/snaplogic-tutorial 4/43
SnapLogic OverviewSnapLogic is the only integration platform built on modern web standards and "containerized"Snaps, allowing you to easily connect any combination of Cloud, SaaS or On-premise appli-cations and data sources. Like the web itself, SnapLogic standardizes the access protocols,access methods and data structure for every interaction. These RESTful1 interactions allowdata to be exchanged between servers in an organized way that makes it easy for the data tobe processed and interpreted. This creates a resource-oriented, data-services layer that pro-vides transformation and integration services for all kinds of integrations.
Glossaryl Components : Components provide basic integration capabilities such as database que-ries, file read and write, aggregate, sort, filter, join, and others. Components are con-
figured with specific properties.
l Pipelines : Pipelines can be assembled into hierarchies that can implement complexlogic and transformations on data for sophisticated integrations.
l Repository : Resource definitions are stored locally in a SnapLogic Server’s Repository.
The Tutorial EnvironmentTo illustrate how to build a data services infrastructure layer with SnapLogic, this tutorialpresents four simple exercises. Each exercise builds upon the previous one to demonstratehow existing Resources can be reused as well as introduces new SnapLogic Components andcapabilities. Because exercises build on the previous exercise, they should be completed inorder as they depend on the successful completion of earlier work.
Once you complete this tutorial you will know how to use the SnapLogic Designer interface to:
l Configure Resources for data sources and targets
l Configure transformation Resources
l Link Components to form Pipelines
l Specify field mappings between Components
l Execute Pipelines from the Designer
l Reuse Components in other Pipelines
This tutorial is only an introduction to the power of SnapLogic. There are more Componentsavailable that can be referenced in the Documentation section located at
https://www.snaplogic.com/component-reference/component-reference.htm
- 4 -
1
8/13/2019 SnapLogic Tutorial
http://slidepdf.com/reader/full/snaplogic-tutorial 5/43
8/13/2019 SnapLogic Tutorial
http://slidepdf.com/reader/full/snaplogic-tutorial 6/43
Exercise 1: Working with ComponentsExercise 1 reads in the leads.csv file and writes out a file which reorders the First Name andLast Name fields and leaves out the home and mobile phone numbers.
To accomplish this, Exercise 1 constructs a Pipeline with two Components: A file Reader and afile Writer. The output file will be named: ex_1_prospects.csv .
Note: The Tutorial Pipelines generate the sample output files ex_n_pros-pects.csv , (for example, ex_1_prospects.csv , ex_2_prospects.csv ). Whenyou run your exercises, you will overwrite these files. To avoid this, you canrename your exercise output files to be unique. Or you can simply re-run the sam-ple pipelines to recreate the output files if you need to examine them.
Your version of SnapLogic includes an example for Exercise 1 that illustrates all the steps youneed to take to create the necessary Pipeline. First let’s look at the Exercise 1 Components,then we’ll create it ourselves.
Reviewing the Sample Leads to Prospects PipelineAfter installing SnapLogic successfully, connect to SnapLogic Designer using the hostname andport number selected during the installation. For example:
http://snaplogic1.snaplogic.com:8081
Double-click on the Ex1_Leads_to_Prospects Pipeline within the Library.
Pipelines and Components are indicated by different icons, which also indicate their status.These icons, as well as the other icons used in the client, are described in the following table.
Icon Type
This is a server icon and it appears on the Server List.
This is a folder icon and is used to organize Pipelines and Components on themain screen.This is a Component icon.
This is a Pipeline icon.
Click on the Component named Leads to view its configuration. l The Properties tab contains file delimiter and output file variables for this Component.
Note: In this sample exercise, the delimiter and filename are specified as $?{SOM-ENAME}. The syntax (dollar sign, question mark, and braces) indicates to the Com-ponent that the values for these properties are parameters that will be set atruntime. For an example of this usage, see Hands-on Exercise 1: Creating Com-ponents .
- 6 -
2
8/13/2019 SnapLogic Tutorial
http://slidepdf.com/reader/full/snaplogic-tutorial 7/43
SnapLogic ® Tutorials
l The Output tab defines the input .csv file fields, data types, and descriptions.
l The Parameters tab assigns default values to the delimiter and input file name var-iables.
l The Preview tab allows you to see the data produced by the Component. Only Com-
ponents which are "Producers", those which have no input views and only output views,will have this tab present.
Click on the Component named Prospects to view its configuration.
l The Properties tab defines the output .csv file to be created (written out) by spec-ifying if it has a header row, what the delimiter is, and what the filename and path is.This tab also provides optional descriptive information for this Writer Component.
l The Input tab specifies the fields (name, datatype, and description) that are to be readfrom the leads.csv file.
l The Parameters tab assigns values to the delimiter and input file name variables.
Click on the Pipeline Settings button in the upper left hand corner of the Pipeline. Click thefollowing tabs:
l The General Info tab provides optional descriptive information for this Pipeline as wellas buttons to access the Related Pipelines information and the Scheduler.
l The Parameters tab shows what parameters are used in the Pipeline, and what thedefault values should be. Any parameter which does not have a default value is con-sidered a required parameter, which must be provided when executing the Pipeline.This tab presents only the information that a Pipeline user would need.
l The Run tab contains the Run button which starts the Pipeline processing. There is alsoa parameters table that lets you specify parameters at runtime that might be differentfrom the default values indicated on the Parameters tab.
Note: The purple and green blocks on the Leads and Prospects Components areoutput/input views. In this case, the purple block on the Leads Component is anoutput view for the data that the Component has read in. The green block on theProspects Component is an input view for this Writer Component to obtain thedata from the Reader.
The link between Components is created by clicking on a purple output box at the bottom ofone Component and dragging it to a green input box at the top of another.
Click anywhere on the link to display the Field linking page.
The Field Linker lets you map fields from the source to the destination. Each input field mustbe linked before the Pipeline can be executed. Not every output field must be used and youcan use an output field more than once. Here, the input for the Writer Prospects is beinglinked to the output from the Reader Leads. There are two ways to make the connections. Foreach input field you can select an output field from the list of values. You can also click Sug-gest to have fields with the same names and datatypes automatically linked.
- 7 -
8/13/2019 SnapLogic Tutorial
http://slidepdf.com/reader/full/snaplogic-tutorial 8/43
Exercise 1: Working with Components
When you click the Run button, the Pipeline processes the Reader output, maps it into theWriter input, and creates the ex_1_prospects.csv file. To confirm that the operation was suc-cessful, open the ex_1_prospects.csv file and see that the fields you mapped are the fieldcontained in the file.
Hands-on Exercise: Creating ComponentsIn this exercise, you will start to recreate the Leads to Prospects Pipeline that is used throughseveral of the exercises
1. Double-click on the CSV Reader Component in the Foundry pane.
2. In the URI field enter: SnapLogic/User/Exercise_1/Leads where User is the user-name you wish to use.
In this example, and for all of these exercises, we will use the name User . Substituteyour name for User everywhere it is specified in these exercises if desired.
Note: You can click on the Component name in the General tab to accessthe online help for that Component.
3. On the Properties tab, leave the properties unchanged except for the following. (Fordetails about these properties you can look at the CSV Read Component Reference doc-umentation.)
l Specify the delimiter as the parameter $?{DELIMITER} . We will specify the actualdelimiter character at runtime.
l Specify the skip_lines value as 1 . This setting allows us to skip the specifiednumber of lines when reading an input file that might contain column headers.Since leads.csv contains a header row, we want to skip this row.
l Specify the input filename as $?{INPUTFILE} . We will specify the actual name ofthe file at runtime.
4. Click Save . Saving is optional until all the edits are made.All changes are stored in the client browser until they are saved to the Data Server. Ifyou have made changes to a Component, but have not saved them, you can discard thechanges by simply closing the Pipeline’s tab.
The Leads Component tab opens.
Note: The URI that you specified has generated a folder hierarchy in theData Server. For each subsequent Component, be sure to use the same paththroughout these exercises so the Components show up in the same folders.
Your screen should look like the following figure.
- 8 -
8/13/2019 SnapLogic Tutorial
http://slidepdf.com/reader/full/snaplogic-tutorial 9/43
SnapLogic ® Tutorials
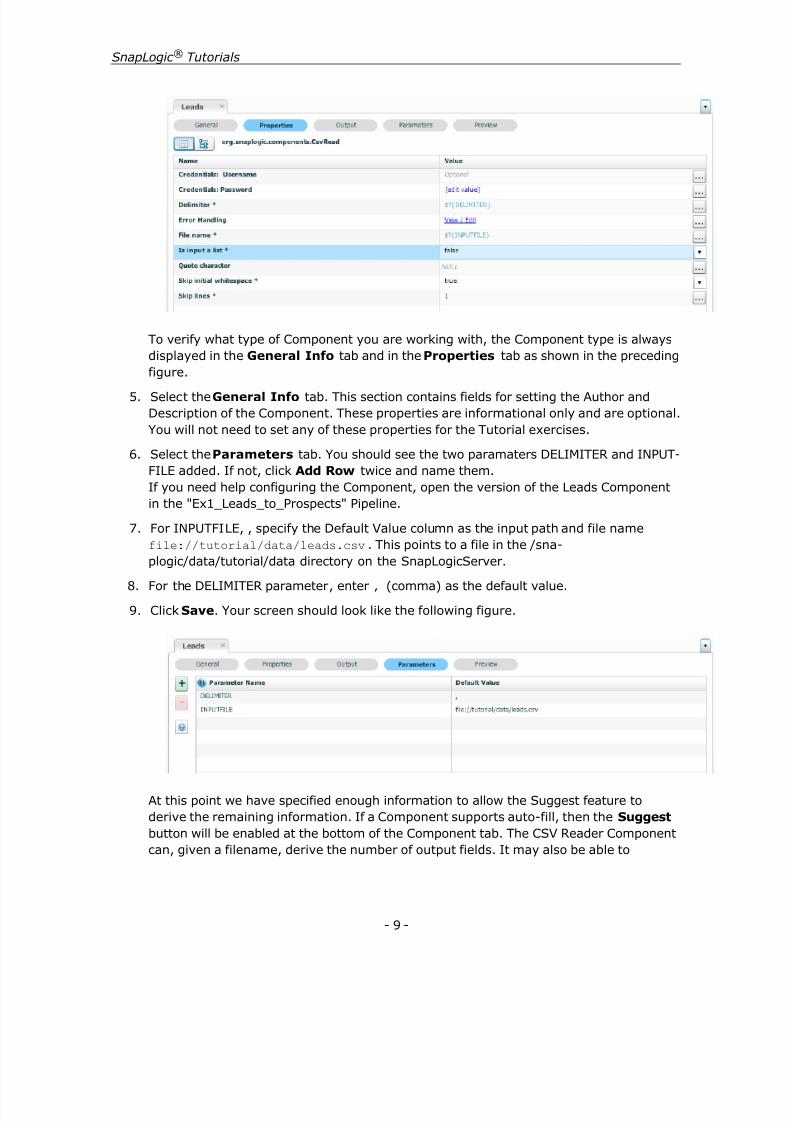
To verify what type of Component you are working with, the Component type is alwaysdisplayed in the General Info tab and in the Properties tab as shown in the preceding
figure. 5. Select the General Info tab. This section contains fields for setting the Author and
Description of the Component. These properties are informational only and are optional.You will not need to set any of these properties for the Tutorial exercises.
6. Select the Parameters tab. You should see the two paramaters DELIMITER and INPUT-FILE added. If not, click Add Row twice and name them.If you need help configuring the Component, open the version of the Leads Componentin the "Ex1_Leads_to_Prospects" Pipeline.
7. For INPUTFILE, , specify the Default Value column as the input path and file namefile://tutorial/data/leads.csv . This points to a file in the /sna-plogic/data/tutorial/data directory on the SnapLogicServer.
8. For the DELIMITER parameter, enter , (comma) as the default value.
9. Click Save . Your screen should look like the following figure.
At this point we have specified enough information to allow the Suggest feature toderive the remaining information. If a Component supports auto-fill, then the Suggest button will be enabled at the bottom of the Component tab. The CSV Reader Componentcan, given a filename, derive the number of output fields. It may also be able to
- 9 -
8/13/2019 SnapLogic Tutorial
http://slidepdf.com/reader/full/snaplogic-tutorial 10/43
Exercise 1: Working with Components
recommend the correct delimiter, quote character, and even field names for the outputview.
10. Click Suggest .A dialog opens with the suggested output view and a suggested quote character.
11. Accept the suggestions by clicking on the Apply All Changes button.
Click the Output tab. You should see the view Output1 with all the field names correctlyderived. If you choose not to use Suggest, you can create the output view manually byclicking the Add Output button and click Finish to accept the default view name ( Out-put1 ).
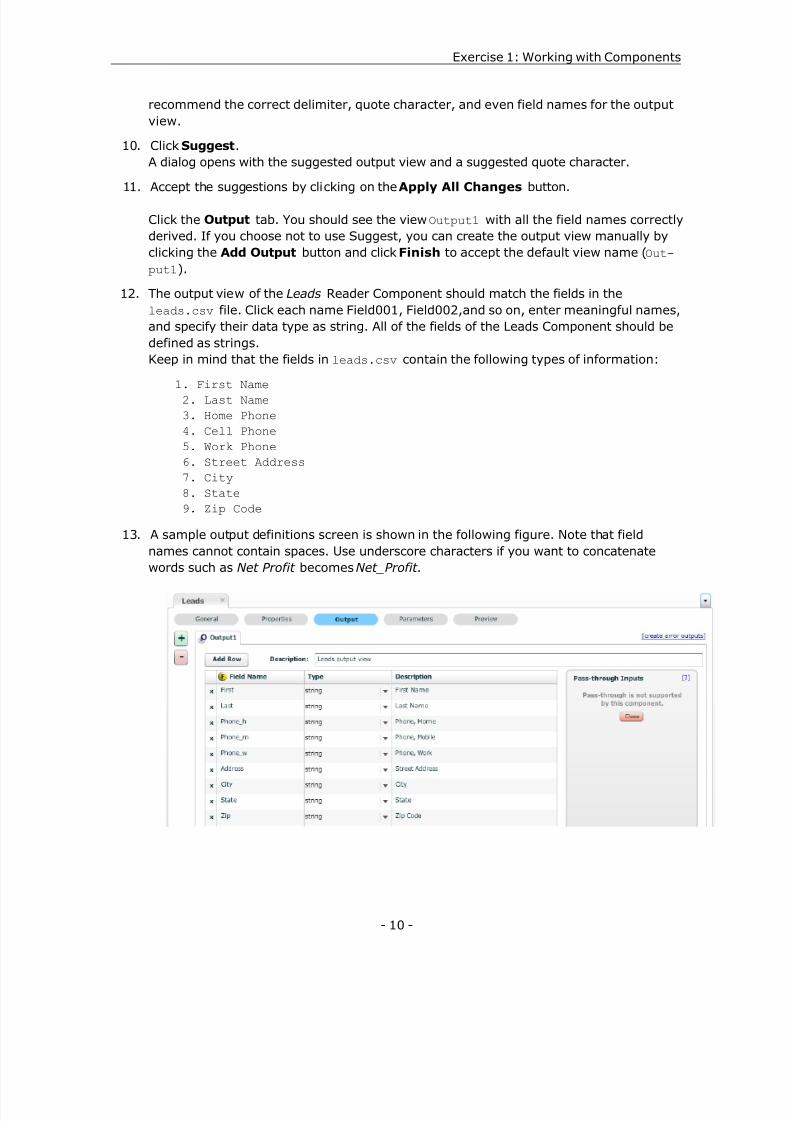
12. The output view of the Leads Reader Component should match the fields in theleads.csv file. Click each name Field001, Field002,and so on, enter meaningful names,and specify their data type as string. All of the fields of the Leads Component should bedefined as strings.Keep in mind that the fields in leads.csv contain the following types of information:
1. First Name 2. Last Name 3. Home Phone 4. Cell Phone 5. Work Phone 6. Street Address 7. City 8. State 9. Zip Code
13. A sample output definitions screen is shown in the following figure. Note that fieldnames cannot contain spaces. Use underscore characters if you want to concatenatewords such as Net Profit becomes Net_Profit .
- 10 -
8/13/2019 SnapLogic Tutorial
http://slidepdf.com/reader/full/snaplogic-tutorial 11/43
SnapLogic ® Tutorials
14. Click Validate . Validation checks that your Component is well-formed and performschecks such as all required properties are set and the necessary input/output views aredefined.
15. Click Save . The Reader is now defined.
Creating a Writer Component 1. Navigate to the SnapLogic > User > Exercise_1 folder in the Library pane.
Note: By navigating to the intended location for a new Component, the NewComponent dialog will automatically include this path in your URI.
2. Double-click the CSV Writer Component in the Component Library pane.
3. In the URI field, add Prospects to the end so it reads: SnapLogic/User/Exercise_1/Prospects .
4. Click OK . The Prospects Writer Component icon displays, and the Prospects Componentopens for editing.
5. Select the Properties tab.
6. For Header Present keep the default false (as we do not need a header row in theoutput file).
7. Specify the Delimiter as $?{DELIMITER} .
8. Specify the File name as the parameter $?{OUTPUTFILE} . We will specify the actualname of the file at runtime.
9. Click Save .
10. Select the General Info tab. Add your name as the author, and provide a description.These fields are optional. Click Save .
11. Select the Input tab and click the Add Input button.
a. Accept the default name and click Next .
b. Select Create a new (blank) view and click Finish to display the Input1 view.
Now we need to tell the Writer to only write out the last name, first name, streetaddress, city, state, zip code, and work phone number from the leads.csv file.
12. Click Add Row and enter the field name, data type, and description for Field001 as wedefined it in the Reader Output field definitions.
13. Repeat this for last name, address, city, state, zip, and work phone.
Here are several things you should notice:
l In our output result, we do not want home phone or cell phone, so those fields arenot added to the input view definition.
- 11 -
8/13/2019 SnapLogic Tutorial
http://slidepdf.com/reader/full/snaplogic-tutorial 12/43
Exercise 1: Working with Components
l We have specified last name first. The order of the input fields defines the orderin which they will be written out. This allows us to reorder the fields fromupstream Components.
l Some of the field names do not match exactly with those used by the Leads Com-ponent (for example, Zip vs. Zip_Code). This is intentional and will be used to illus-trate that exact matches are not necessary when linking Components together.
Note: Every field you define in an input view has to be mapped fromupstream views, so do not define fields you do not want. Also, for theseexercises, all fields have to be specified using string as the datatype.
14. Click Save .
15. Click the Parameters tab and click Add Row .
16. In the Name column, change PARAM_001 to be the output file parameter name we intro-duced in the Properties tab, OUTPUTFILE .
17. In the Default Value column, specify the output file path and name, file:/-/tutorial/data/ex_1_prospects.csv .
18. Click Add Row and repeat for the DELIMITER parameter.
19. Click Save . The Writer Component is now defined.
Building the Read-Write PipelineNext we need to build a Pipeline with the Reader and Writer Components to perform a data
integration. 1. Click the New Pipeline button.
2. In the URI field, add the name Leads_to_Prospects to the path Snap-Logic/User/Exercise_1/ .
3. Click OK .
4. Click on the canvas.The Leads_to_Prospects Pipeline is created and is opened for editing.
5. Click the General Info tab.
6. Enter a creator and description for this Component. These values are optional.
7. Click the Pipeline tab within the Pipeline Properties.
8. Drag the Leads and Prospects icons onto the grid field (also known as the Pipeline can-vas).Note: While naming the Components as we have done is optional, it is important tomatch the names used here with the ones used in the Parameter Map.
- 12 -
8/13/2019 SnapLogic Tutorial
http://slidepdf.com/reader/full/snaplogic-tutorial 13/43
SnapLogic ® Tutorials
9. Click the Leads output view box (purple box) and drag to link to the Prospects input viewbox (green box). By default, the Field Linker dialog displays automatically wheneveryou connect two Components.
10. Click Apply .
11. Map the fields. For each input view field, select one of the available output view fields.You can also click the B button, which will link any fields whose names and data typesmatch.
By default, Smart Link will be invoked automatically when you connect two Componentstogether. Again, this behavior can be controlled in the Pipeline Options. As some fieldnames do not match, link the remaining unlinked fields.
12. Click Save .
13. Click Pipeline Properties on the canvas toolbar.
14. Click the Parameters tab. We are now going to define the Pipeline parameters and howthey map to the Pipeline's Components.
When you drag a Component onto the Pipeline canvas, the Component's parameters areautomatically mapped as Pipeline parameters. Double-click on a parameter to edit it'sname or value. If you do not wish to expose a Component's parameter, you can delete itby selecting the parameter and clicking the Remove button. To add a parameter, youcan click the Add button to enter a new parameter. To add a parameter, specify a Pipe-line parameter name and select the Component parameter to which it maps, and adefault value if any.
15. Edit each parameter and change the default parameter names. By defining the DELIM-ITER parameters as INPUT_DELIMITER and OUTPUT_DELIMITER , rather than simplyDELIMITER as was defined for both Components, we can now use different delimiters ifwe need to. In this case, we will leave both delimiters as a comma. You can also using asingle pipeline parameter and map it to multiple Component parameters. For example,if you know that all input files use comma as the delimiter, you could map a singleparameter FILE_DELIMITER to both Component DELIMITER parameters.
16. In the Default Value field, enter the value to be used when running the Pipeline.
17. Click Save .
18. Click the Run tab.The Run tab contains three sub-tabs, Run, Preview Data and Runtime Information. The
Parameters table in the Run sub-tab is populated with the parameters to be used in thisPipeline. Notice that the default values appear in the table.
19. If we wanted to, we could change the values right here on the Run tab and run it.
20. Click the Run button.The Pipeline will read in the data specified in the Reader Component and write it to thefile specified in the Writer Component ( ex_1_prospects.csv ). The status of the Pipe-
- 13 -

8/13/2019 SnapLogic Tutorial
http://slidepdf.com/reader/full/snaplogic-tutorial 14/43

8/13/2019 SnapLogic Tutorial
http://slidepdf.com/reader/full/snaplogic-tutorial 15/43- 15 -
SnapLogic ® Tutorials
8/13/2019 SnapLogic Tutorial
http://slidepdf.com/reader/full/snaplogic-tutorial 16/43
Exercise 2: Filtering DataExercise 2 duplicates the Components from Exercise 1 and creates another Pipeline that filtersthe leads to include only those in California. To accomplish this, the FilterLeads Componentexamines the State column in the leads.csv file for the value equal to CA. The filtered outputis written to the file named ex_2_prospects.csv .
Note: The Tutorial Pipelines generate the sample output files ex_n_pros-pects.csv , (for example, ex_1_prospects.csv , ex_2_prospects.csv ). Whenyou run your exercises, you will overwrite these files. To avoid this, you canrename your exercise output files to be unique. Or you can simply re-run the sam-ple pipelines to recreate the output files if you need to examine them.
Your version of SnapLogic includes an example for Exercise 2 that illustrates the steps tocreate the necessary Components and link them with the Pipeline.
This exercise will show you how to create these two Components, how to duplicate and modifythe Leads and Prospects Components from Exercise 1, and combine the FilterLeads Com-ponent with the Leads and Prospects Components in a new Pipeline that will filter out all thenon-California leads.
First let’s look at the Exercise 2 components, then we’ll go create it ourselves.
Reviewing the California Prospects PipelineDouble-click the pipeline Ex2_CA_Prospects and it will open up in the Canvas. The Com-ponents used in this exercise will be the same ones used for Exercise 1. We will reuse theLeads Component exactly as it was configured in Exercise 1, but we will specify a runtimeparameter for the Prospects Component so that it can write to a different file.
Click the Pipeline Properties button for the Ex2_CA_Prospects Pipeline to see what the Pipe-line includes. Click the following tabs:
l The General tab provides descriptive information for this Component. This data isoptional.
l The Input tab defines the structure of the data that is provided by the upstream Com-ponents into the Pipeline. In this exercise, the Pipeline gets its data from a CSV Reader
Component that reads it from a local file. That is different from data that enters a Pipe-line from one of its input views. Since there is no upstream Component feeding the Pipe-line, there are no input views.
l The Output tab defines data exiting the Pipeline. In this exercise, the Pipeline has aCSV Writer Component that writes the data to a local file. Since no data is exiting thePipeline directly, it has no output views.
- 16 -
3
8/13/2019 SnapLogic Tutorial
http://slidepdf.com/reader/full/snaplogic-tutorial 17/43
SnapLogic ® Tutorials
l The Parameters tab shows what parameters are used in the Pipeline, and what thedefault values are if any.
l The Run tab contains the Run button which starts the Pipeline processing. There is alsoa parameters table that lets you specify parameters at runtime that might be differentfrom the default values indicated on the Parameters tab.
The purple block on the Leads Component is an output view and the green block on the Fil-terLeads Component is an input view. The link between them is created by clicking on a Com-ponent that can generate output and dragging to another Component. In this case, you clickLeads to draw a link to FilterLeads . You cannot link Prospects to FilterLeads because theWriter Component does not provide output.
Now double-click the FilterLeads Component:
l The Properties tab defines the field to be used to filter data, its value, and the con-dition to be met. In this example, to find all the California leads, we need to specify thatthe Column be State , the value be CA, and the condition be == .
l The Input tab defines the structure of the data that is provided by the upstream Com-ponents into the Filter.
l The Output tab defines the structure of the data from the FilterLeads Component. Inthis exercise, Filter output view should match its input view.
Click the link between the Leads Component and the FilterLeads Component to display theField Linker.
The fields coming in from the Reader Leads are mapped here to fields in the FilterLeads inputview by clicking on the fields in the Incoming fields (available to map) panel and draggingthem to the From panel. Then these are matched to the FilterLeads fields by draggingUnmapped outgoing fields to the corresponding To panel such that From fields are on thesame line as the fields there are going To.
Click anywhere on the link between the FilterLeads Component to the Prospects Component todisplay the Link menu and select Field Linking to display the Field Linking page.
The fields coming in from the FilterLeads are mapped here to fields in the Writer Prospects byclicking on the fields in the Incoming fields (available to map) panel and dragging them to theFrom panel. Then these are matched to the Writer fields by dragging Unmapped outgoingfields to the corresponding To panel such that From fields are on the same line as the fieldsthere are going To.
When you click Run , the Pipeline processes the Reader output, passes it through the Filter and
into the Writer input, then creates the ex_2_prospects.csv file. You should see that the out-put result contains 675 records.
Now let’s create the Components in Exercise 2.
Hands-on Exercise: Creating a Filter Component 1. Double-click the Fil ter Component in the Foundry pane.
2. Specify the URI as SnapLogic/User/Exercise_2/FilterLeads .
- 17 -
8/13/2019 SnapLogic Tutorial
http://slidepdf.com/reader/full/snaplogic-tutorial 18/43
Exercise 2: Filtering Data
3. Click OK .
4. Select the Input tab, click the Add Input button, and click Next on the View Name pop-up to start the view creation wizard. Here you will be able to choose between cre-ating a new view, just like we did in Exercise 1, or copying an existing view fromanother Component.
5. Select the Copy an Existing view option and then click Next .
6. Navigate to the Exercise 1 Leads Component you created in the first tutorial. When youselect a Component, the wizard will display a list of any input or output views it has.When you place your mouse over a view, you will get a brief summary of the fields inthat view. Select the output view Output1 and click Finish . The output view definitionwill be copied from your Leads Component.
7. We do not require the Phone_h and Phone_m fields in this Component so click the "X"beside those rows to delete the fields from this view.
8. Click Save .
9. Click the Output tab.
10. Repeat the steps you performed to define the input view Input1 to create the outputview Output1, but instead of copying the view from the Leads Component, just copy theinput view of your Filter Component.
11. Click Save .
12. Click the Properties tab.
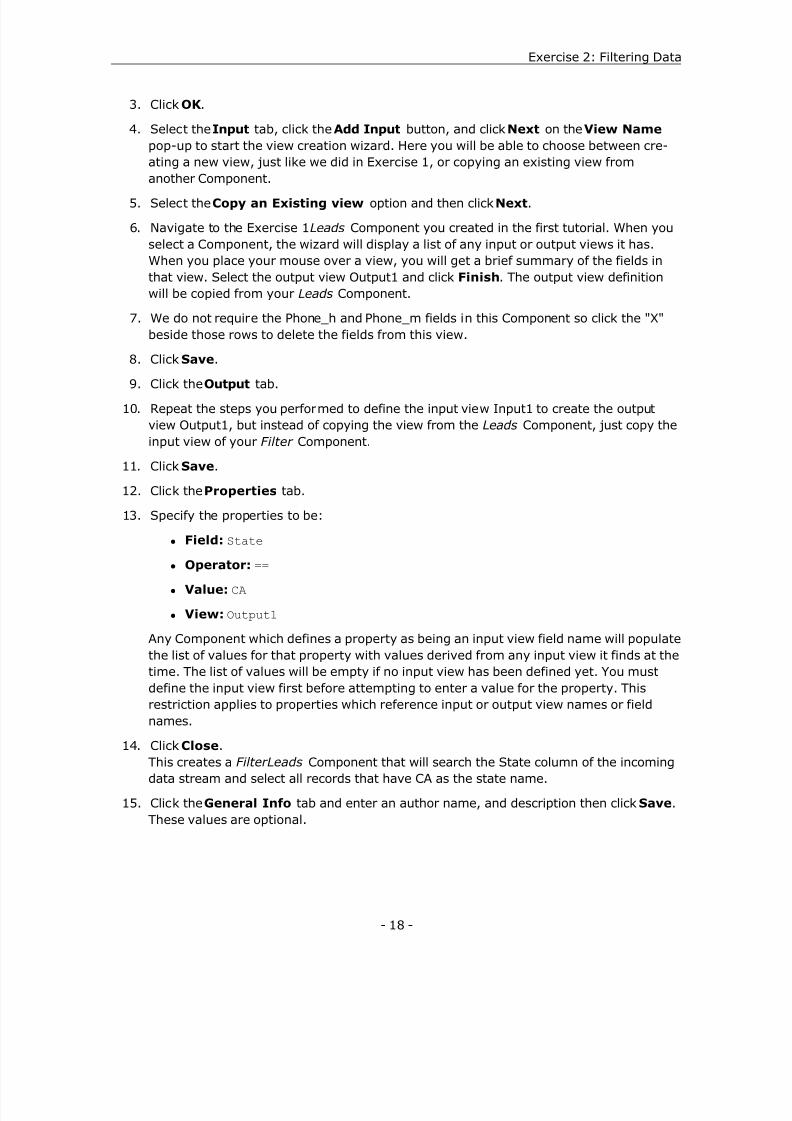
13. Specify the properties to be:
l Field: State
l Operator: ==
l Value: CA
l View: Output1
Any Component which defines a property as being an input view field name will populatethe list of values for that property with values derived from any input view it finds at thetime. The list of values will be empty if no input view has been defined yet. You mustdefine the input view first before attempting to enter a value for the property. Thisrestriction applies to properties which reference input or output view names or fieldnames.
14. Click Close .This creates a FilterLeads Component that will search the State column of the incomingdata stream and select all records that have CA as the state name.
15. Click the General Info tab and enter an author name, and description then click Save .These values are optional.
- 18 -
8/13/2019 SnapLogic Tutorial
http://slidepdf.com/reader/full/snaplogic-tutorial 19/43
SnapLogic ® Tutorials
16. Skip the Parameters tab. Since we have not defined any parameters for this Com-ponent, do not make any changes to this tab.The Filter is now defined.
Duplicating ComponentsDuplicating a Reader Component
The Leads Component created in your Exercise 1 folder is the same as what we need for aReader in this exercise. So let’s duplicate that version of the Reader and use it here.
This step diverges from the sample Tutorial version of Exercise 2 in that there is no LeadsComponent duplicated in the sample version. In the sample version of Exercise 2, you simplydrag the Leads icon from the Exercise 1 folder and drop it on the Exercise 2 Pipeline canvas.Both methods are valid. However, the instructions in this Hands-on section assume that youduplicate the Leads Component. Duplicating a Component allows you to modify a Componentwithout affecting the pipelines that reference the original Component.
You can also CTRL+Drag items within the tree to create duplicates, or use the "Copy" com-mand from the "Edit" menu.
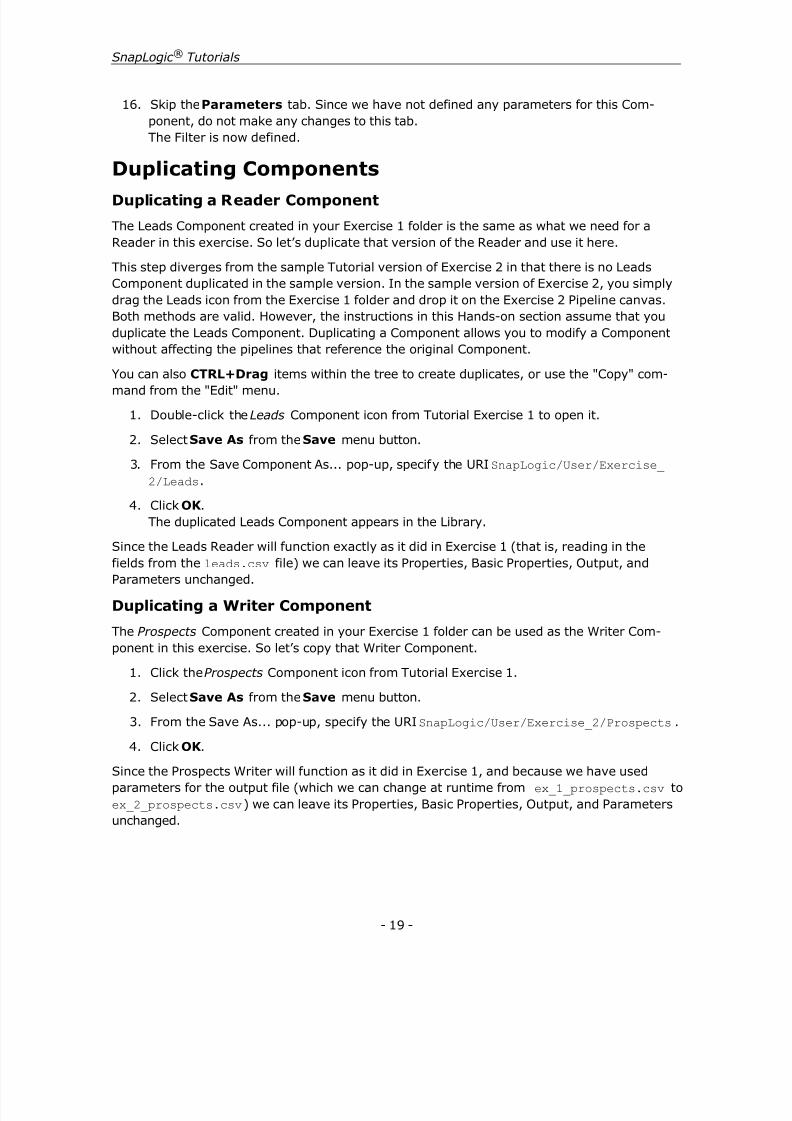
1. Double-click the Leads Component icon from Tutorial Exercise 1 to open it.
2. Select Save As from the Save menu button.
3. From the Save Component As... pop-up, specify the URI SnapLogic/User/Exercise_2/Leads .
4. Click OK .The duplicated Leads Component appears in the Library.
Since the Leads Reader will function exactly as it did in Exercise 1 (that is, reading in thefields from the leads.csv file) we can leave its Properties, Basic Properties, Output, andParameters unchanged.
Duplicating a Writer Component
The Prospects Component created in your Exercise 1 folder can be used as the Writer Com-ponent in this exercise. So let’s copy that Writer Component.
1. Click the Prospects Component icon from Tutorial Exercise 1.
2. Select Save As from the Save menu button.
3. From the Save As... pop-up, specify the URI SnapLogic/User/Exercise_2/Prospects .
4. Click OK .
Since the Prospects Writer will function as it did in Exercise 1, and because we have usedparameters for the output file (which we can change at runtime from ex_1_prospects.csv toex_2_prospects.csv ) we can leave its Properties, Basic Properties, Output, and Parametersunchanged.
- 19 -
8/13/2019 SnapLogic Tutorial
http://slidepdf.com/reader/full/snaplogic-tutorial 20/43
Exercise 2: Filtering Data
Building the Read-Write-Filter PipelineNext we need to link the Leads , Prospects , and FilterLeads Components in a new Pipeline toprocess the data.
1. Click the New Pipeline button. 2. Specify the URI as SnapLogic/User/Exercise_2/CA_Prospects .
3. Click OK .
4. Drag the FilterLeads Component onto the Pipeline canvas.
5. Drag your Leads and Prospects Components onto the Pipeline canvas.
6. Link the Leads Reader to the FilterLeads Component.By default, the Field Linker dialog appears, and all of the fields will be mapped auto-matically because a matching field name was found for each To field.
7. Click OK when finished.
8. Link the FilterLeads Component to the Prospects Writer.
9. When the Link dialog appears, some of the To fields will remain unmapped because theFrom field names do not match exactly. Map the From fields to the remaining unmappedTo fields.
10. Click OK when finished.
11. From the Pipeline, click the Parameters tab.
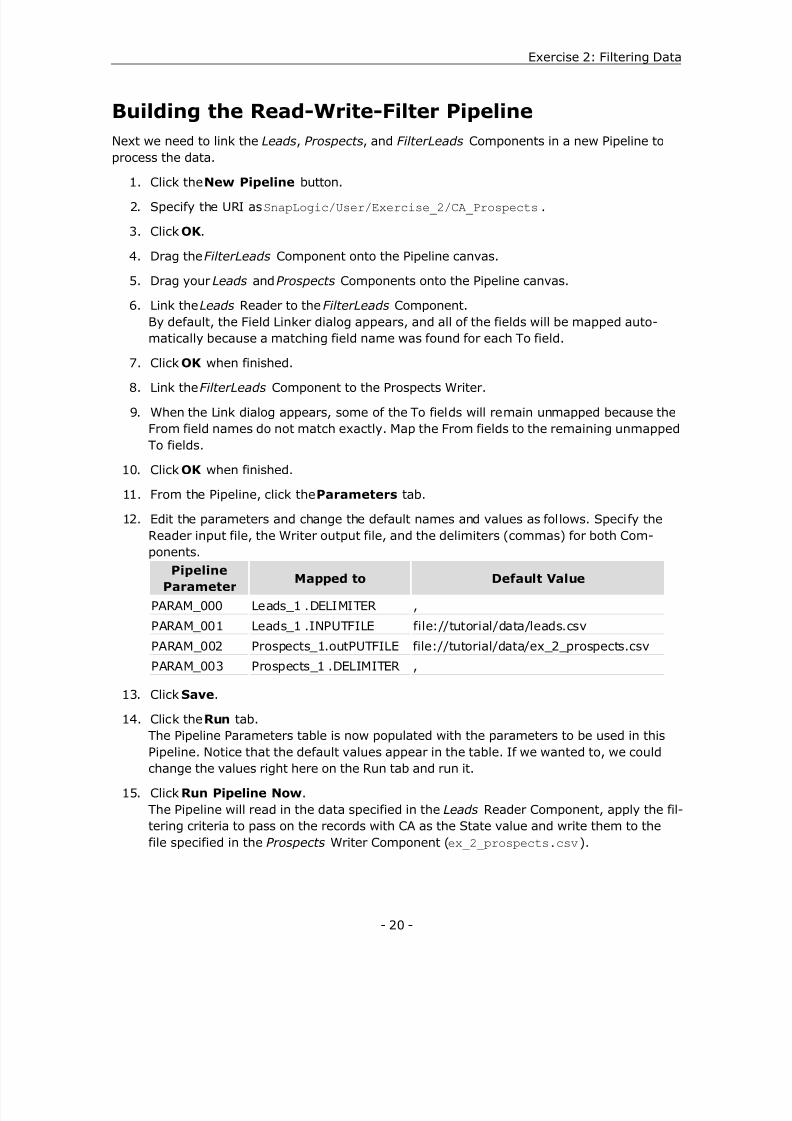
12. Edit the parameters and change the default names and values as follows. Specify theReader input file, the Writer output file, and the delimiters (commas) for both Com-
ponents.PipelineParameter
Mapped to Default Value
PARAM_000 Leads_1 .DELIMITER ,PARAM_001 Leads_1 .INPUTFILE file://tutorial/data/leads.csvPARAM_002 Prospects_1.outPUTFILE file://tutorial/data/ex_2_prospects.csvPARAM_003 Prospects_1 .DELIMITER ,
13. Click Save .
14. Click the Run tab.The Pipeline Parameters table is now populated with the parameters to be used in thisPipeline. Notice that the default values appear in the table. If we wanted to, we couldchange the values right here on the Run tab and run it.
15. Click Run Pipeline Now .The Pipeline will read in the data specified in the Leads Reader Component, apply the fil-tering criteria to pass on the records with CA as the State value and write them to thefile specified in the Prospects Writer Component ( ex_2_prospects.csv ).
- 20 -

8/13/2019 SnapLogic Tutorial
http://slidepdf.com/reader/full/snaplogic-tutorial 21/43
SnapLogic ® Tutorials
16. Open ex_2_prospects.csv to verify the filtered results. You should see only the 675leads that have California addresses.
- 21 -
8/13/2019 SnapLogic Tutorial
http://slidepdf.com/reader/full/snaplogic-tutorial 22/43
Exercise 3: Data ServicesExercise 3 starts with all of the California-based leads and adds information about income lev-els by zip code. This exercise introduces the concept of a Data Service Pipeline. A Data Serv-ice Pipeline is one that provides a feed of data that can be used by other Pipelines or otherapplications. Data from these pipelines can be presented in different Representations whenused by other applications. We will create a simple Data Service Pipeline that provides a feedof income data taken from the file CAIncomeByZip.csv. Next, we will introduce a Join Com-ponent that reads the income data from the Data Service feed and joins it (looks up) with thefiltered data from the leads Leads and FilterLeads Components. It then writes the output to afile named ex_3_prospects.csv. This file still includes all of the records from ex_2_pros-pects.csv, but this time, income information is added.
Note: The Tutorial Pipelines generate the sample output files ex_n_pros-pects.csv , (for example, ex_1_prospects.csv , ex_2_prospects.csv ). Whenyou run your exercises, you will overwrite these files. To avoid this, you canrename your exercise output files to be unique. Or you can simply re-run the sam-ple pipelines to recreate the output files if you need to examine them.
Your version of SnapLogic includes an example for Exercise 3 that illustrates all the steps youneed to take to create the necessary Components and link them with the Pipeline.
First let’s look at the Exercise 3 components, then we’ll go create them ourselves.
Reviewing the Census Feed and Qualified CaliforniaPipelinesFrom the Data Server icon, you should see the Ex3_CensusFeed and Ex3_Qual_CA_ProspectsPipelines.
Double-click Census and the following tabs are available:
l The Properties tab defines the file delimiter and output file name. It also providesdescriptive information for this Reader Component. This data is optional.
l The Output Views tab defines the CSV file fields, data types, and descriptions.
l The Parameters tab defines the values of the file delimiter and output file name.
Double-click Prospects and the following tabs are available:
l The Properties tab defines the output CSV file to be created (written out) by specifyingif it has a header row, what the delimiter is, and what the filename and path is. This tabalso provides descriptive information for this Writer Component. This data is optional.
The delimiter and filename are specified as $?{SOMENAME}. The dollar sign, question
- 22 -
4
8/13/2019 SnapLogic Tutorial
http://slidepdf.com/reader/full/snaplogic-tutorial 23/43
SnapLogic ® Tutorials
mark, and braces indicate to the Component that the values for these properties areparameters that will be set at runtime (that is, when the Pipeline processes associatedComponents).
l The Input tab specifies the fields (name, datatype, and description) that are to bewritten to the output file. This matches the fields defined in the Reader Output tab.
l The Parameters tab defines the values of the file delimiter and output file name.
Double-click Join and then click:
l The Properties tab defines the join expressions and the field aliasing properties. Italso provides optional descriptive information for this Writer Component.
The Join Expressions dialog contains the list of expressions used to join the input views.If there is more than one such expression, there is an implicit AND between them. A
join expression takes the following logical form: (Input1.name == Input2.name) .
The Aliases dialog is used to disambiguate the output view field names. Since the inputviews that are being joined often have fields of the same name, in order to distinguishthese fields, any ambiguous output fields must be aliased. A fully-qualified input field isgiven an alias, which is how this field will be represented in the output. For example,consider a Join Component with
l two input views: Input1: name, zip and Input2: name, company. These will be joined by name, (Input1.name = Input2.name)
And an output: name, company, zip.
Join needs to know which of these names should be used for the output. That is what Ali-ases specify.
l The Input tabs specify the fields (name, datatype, and description) that are to be readfrom the leads.csv and CAIncomeByZip.csv file.
l The Output tab specifies the fields (name, datatype, and description) that are to be out-put from the Join Component.
l The Parameters tab defines any parameters used by the Component. In this examplethe Join Component does not use any parameters.
Double-click the CensusFeed Pipeline to see what the Pipeline includes. Click the followingtabs:
l
The General Info tab provides descriptive information for the Pipeline. This data isoptional.
l The Input tab defines the structure of the data that upstream Components provide tothe Pipeline. In this exercise, the Pipeline gets its data from a CSV Reader Componentthat reads it from a local file. That is different from data that enters a Pipeline from oneof its input views. Since there is no upstream Component feeding this Pipeline, there areno input views.
- 23 -
8/13/2019 SnapLogic Tutorial
http://slidepdf.com/reader/full/snaplogic-tutorial 24/43
Exercise 3: Data Services
l The Output tab defines data exiting the Pipeline. The CensusFeed Pipeline is directingthe output from the Census Component's output view Output001 to the Pipeline's outputview Output1.
l The Parameters tab allows you to define the Pipeline parameters and map the param-eters to the Pipeline's Components.
l The Pipeline tab shows the single Component.
l The Run tab contains the Run button which starts the Pipeline processing. There is alsoa parameters table that lets you specify parameters at runtime that might be differentfrom the default values indicated on the Parameters tab.
Double-click the Qual_CA_Prospects Pipeline to see what the Pipeline includes. Click the fol-lowing tabs:
l The General Info tab provides descriptive information for the Pipeline. This data isoptional.
l
The Input tab, like the CensusFeed Pipeline above, defines no input views. l The Output tab defines data exiting the Pipeline. In this exercise, this Pipeline has a
CSV Writer Component that writes the data to a local file. Since no data is exiting thePipeline directly, it has no output views.
l The Parameters tab allows you to define the Pipeline parameters and map the param-eters to the Pipeline's Components.
l The Pipeline tab shows how the Components are linked.
l The Run tab contains the Run button which starts the Pipeline processing. There is alsoa parameters table that lets you specify parameters at runtime that might be differentfrom the default values indicated on the Parameters tab.
Click the link from Leads to FilterLeads to display the Link menu and select Field Linking to dis-play the Field Linking page.
The fields coming in from the Leads are mapped here to fields in the FilterLeads by clicking onthe names in the Incoming fields (available to map) panel and dragging them to the Frompanel. Then these are matched to the FilterLeads fields by dragging Unmapped outgoing fieldsto the corresponding To panel such that From fields are on the same line as the correspondingTo field names.
Click the link from CensusFeed to Join and select Field Linking to display the Field Linkingpage.
The fields coming in from CensusFeed (the Data Service Pipeline) are mapped here to fields in Join .
When you click the link from FilterLeads (the Filter Component) to Join (the Join Component)and select Field Linking to display the Field Linking page, you see how the filtered fields fromFilterLeads are mapped to the Join Component with the fields in Census .
To understand how Join combines the FilterLeads and Census fields, left click the link from Join to Prospects . Select Field Linking to display the Field Linking page.
- 24 -
8/13/2019 SnapLogic Tutorial
http://slidepdf.com/reader/full/snaplogic-tutorial 25/43
SnapLogic ® Tutorials
Notice that for this exercise, the input view of the Prospects Component has been changed toinclude the new field: MoreThan50K .
When you click Run , the Pipeline processes the data from the Leads and Census Components,and sends the data to the Prospects Component, which creates the ex_3_prospects.csv file.
Now let’s create the Components in Exercise 3.
Hands-On Exercise: Data ServicesThis exercise uses two Reader Components to read data from two different source files. Wereuse the filtered data from Exercise 2, create a new Reader Component to read in data fromanother source file, then join the two data sources to write out the desired file. The WriterComponent in this exercise is very similar to the Writer Component we created in Exercise 2,so we can duplicate it to save time.
Creating a Data Service Component
1. Double-click the CSV Reader Component in the Component Library pane. 2. Name the URI SnapLogic/User/Exercise_3/Census .
3. Click OK .
4. Click the Properties tab.
5. Set the Delimiter to $?{DELIMITER} .
6. Set the File name to $?{INPUTFILE} .Rather than explicitly defining the delimiter and the input file name, we use parametersthat can be defined at runtime.
7. Set Skip lines to 1 . The datafile contains a header row that we want to skip. Leave theother property settings unchanged.
8. Click Save .
9. Click the Parameters tab and confirm that the DELIMITER and INPUTFILE parametersare listed.
10. Click Save .
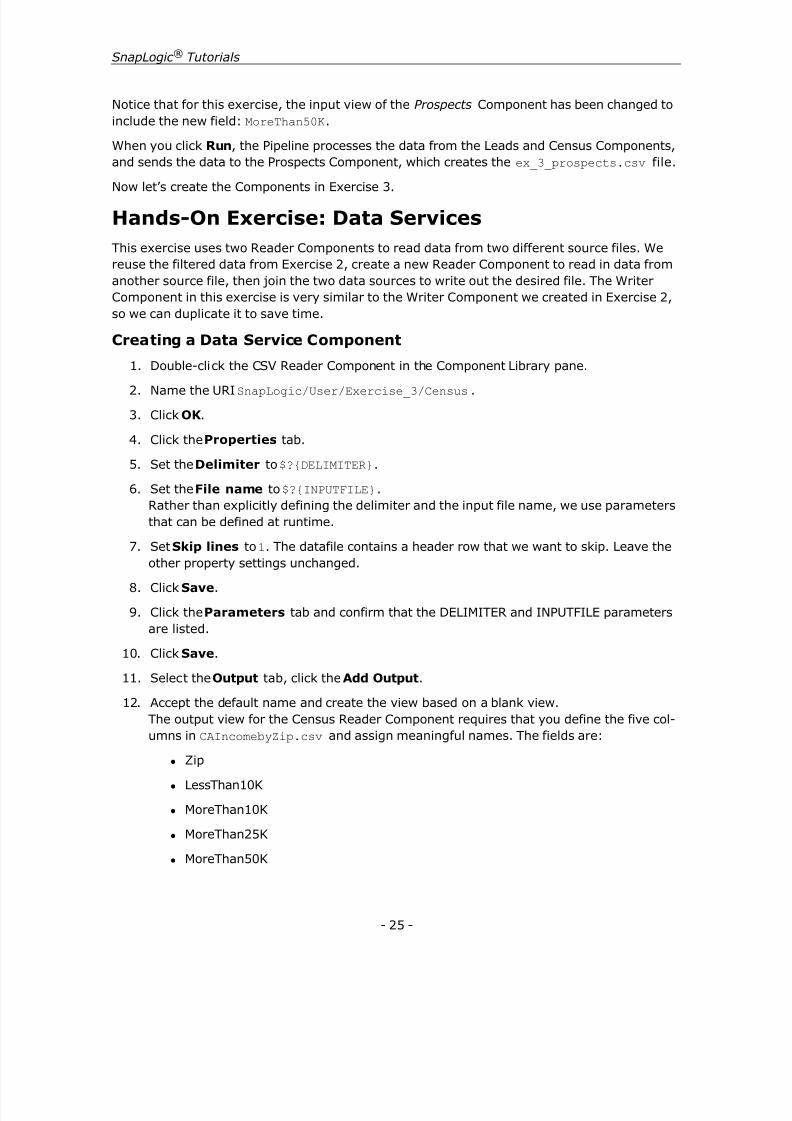
11. Select the Output tab, click the Add Output .
12. Accept the default name and create the view based on a blank view.The output view for the Census Reader Component requires that you define the five col-umns in CAIncomebyZip.csv and assign meaningful names. The fields are:
l Zip
l LessThan10K
l MoreThan10K
l MoreThan25K
l MoreThan50K
- 25 -
8/13/2019 SnapLogic Tutorial
http://slidepdf.com/reader/full/snaplogic-tutorial 26/43
Exercise 3: Data Services
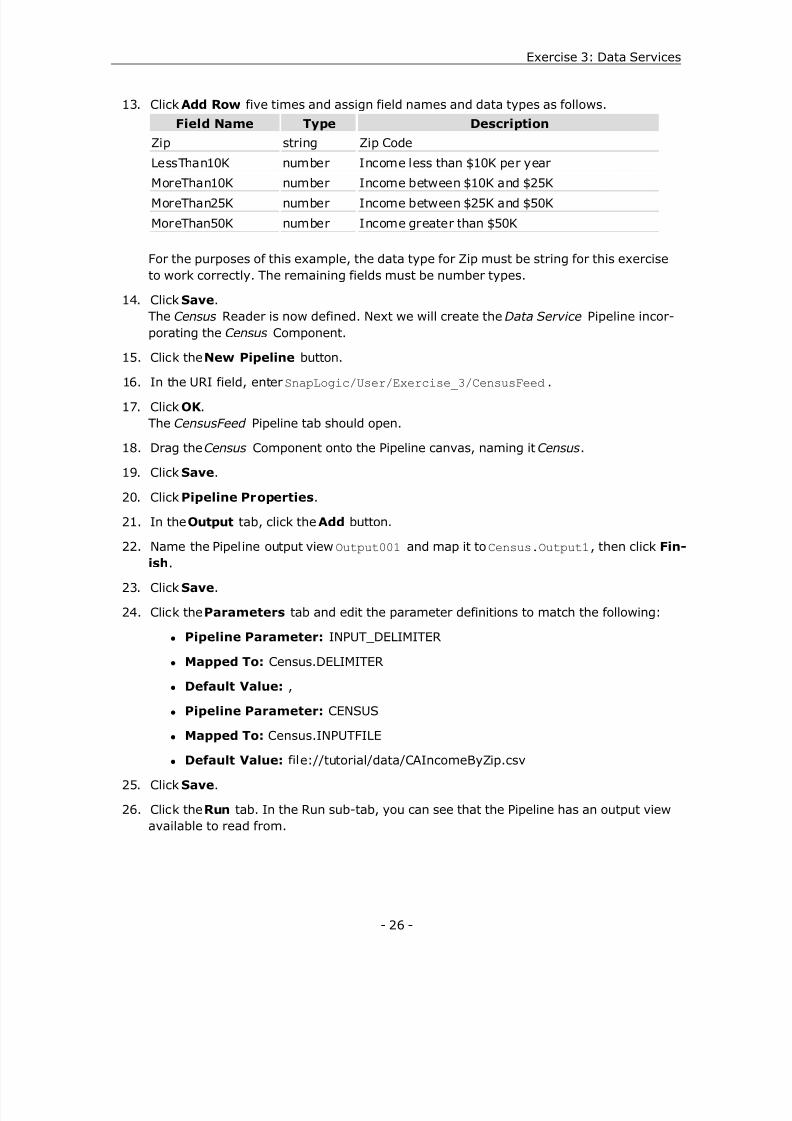
13. Click Add Row five times and assign field names and data types as follows.Field Name Type Description
Zip string Zip CodeLessThan10K number Income less than $10K per year
MoreThan10K number Income between $10K and $25KMoreThan25K number Income between $25K and $50KMoreThan50K number Income greater than $50K
For the purposes of this example, the data type for Zip must be string for this exerciseto work correctly. The remaining fields must be number types.
14. Click Save .The Census Reader is now defined. Next we will create the Data Service Pipeline incor-porating the Census Component.
15. Click the New Pipeline button.
16. In the URI field, enter SnapLogic/User/Exercise_3/CensusFeed .
17. Click OK .The CensusFeed Pipeline tab should open.
18. Drag the Census Component onto the Pipeline canvas, naming it Census .
19. Click Save .
20. Click Pipeline Properties .
21. In the Output tab, click the Add button.
22. Name the Pipeline output view Output001 and map it to Census.Output1 , then click Fin-ish .
23. Click Save .
24. Click the Parameters tab and edit the parameter definitions to match the following:
l Pipeline Parameter: INPUT_DELIMITER
l Mapped To: Census.DELIMITER
l Default Value: ,
l Pipeline Parameter: CENSUS
l Mapped To: Census.INPUTFILE
l Default Value: file://tutorial/data/CAIncomeByZip.csv
25. Click Save .
26. Click the Run tab. In the Run sub-tab, you can see that the Pipeline has an output viewavailable to read from.
- 26 -
8/13/2019 SnapLogic Tutorial
http://slidepdf.com/reader/full/snaplogic-tutorial 27/43
SnapLogic ® Tutorials
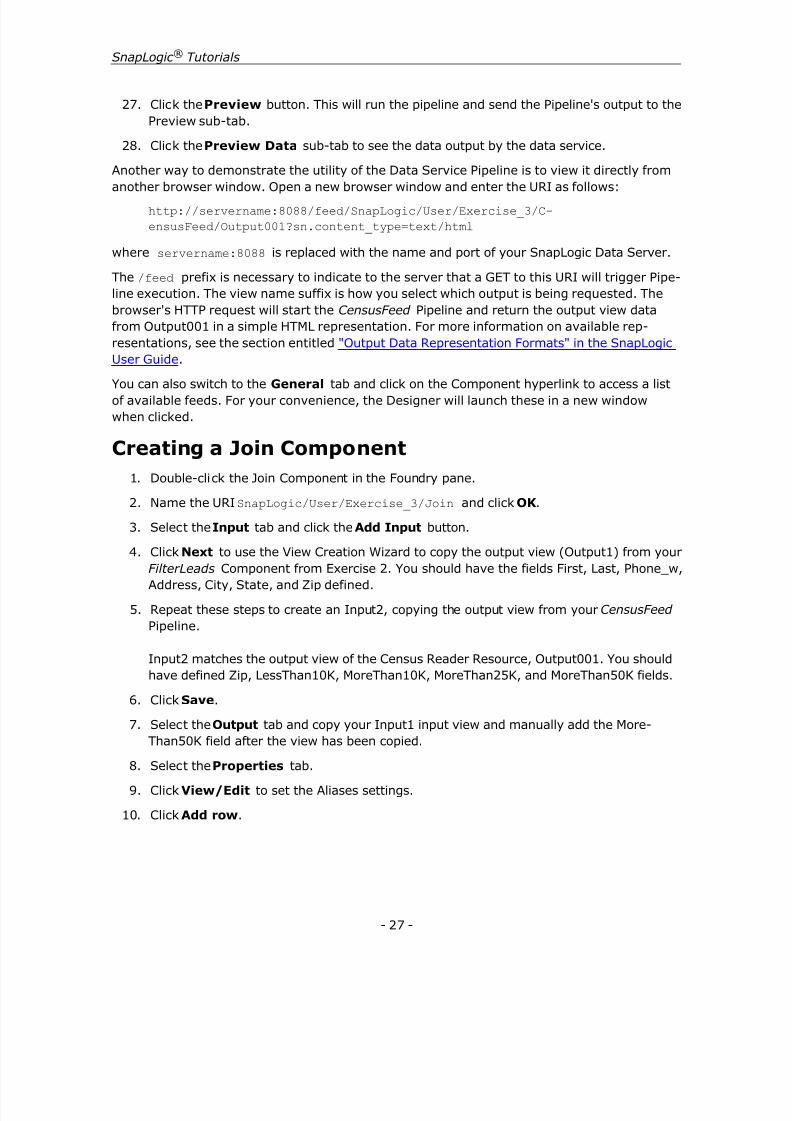
27. Click the Preview button. This will run the pipeline and send the Pipeline's output to thePreview sub-tab.
28. Click the Preview Data sub-tab to see the data output by the data service.
Another way to demonstrate the utility of the Data Service Pipeline is to view it directly from
another browser window. Open a new browser window and enter the URI as follows:http://servername:8088/feed/SnapLogic/User/Exercise_3/C-ensusFeed/Output001?sn.content_type=text/html
where servername:8088 is replaced with the name and port of your SnapLogic Data Server.
The /feed prefix is necessary to indicate to the server that a GET to this URI will trigger Pipe-line execution. The view name suffix is how you select which output is being requested. Thebrowser's HTTP request will start the CensusFeed Pipeline and return the output view datafrom Output001 in a simple HTML representation. For more information on available rep-resentations, see the section entitled "Output Data Representation Formats" in the SnapLogicUser Guide .
You can also switch to the General tab and click on the Component hyperlink to access a listof available feeds. For your convenience, the Designer will launch these in a new windowwhen clicked.
Creating a Join Component 1. Double-click the Join Component in the Foundry pane.
2. Name the URI SnapLogic/User/Exercise_3/Join and click OK .
3. Select the Input tab and click the Add Input button.
4. Click Next to use the View Creation Wizard to copy the output view (Output1) from yourFilterLeads Component from Exercise 2. You should have the fields First, Last, Phone_w,Address, City, State, and Zip defined.
5. Repeat these steps to create an Input2, copying the output view from your CensusFeed Pipeline.
Input2 matches the output view of the Census Reader Resource, Output001. You shouldhave defined Zip, LessThan10K, MoreThan10K, MoreThan25K, and MoreThan50K fields.
6. Click Save .
7. Select the Output tab and copy your Input1 input view and manually add the More-
Than50K field after the view has been copied. 8. Select the Properties tab.
9. Click View/Edit to set the Aliases settings.
10. Click Add row .
- 27 -
8/13/2019 SnapLogic Tutorial
http://slidepdf.com/reader/full/snaplogic-tutorial 28/43
Exercise 3: Data Services
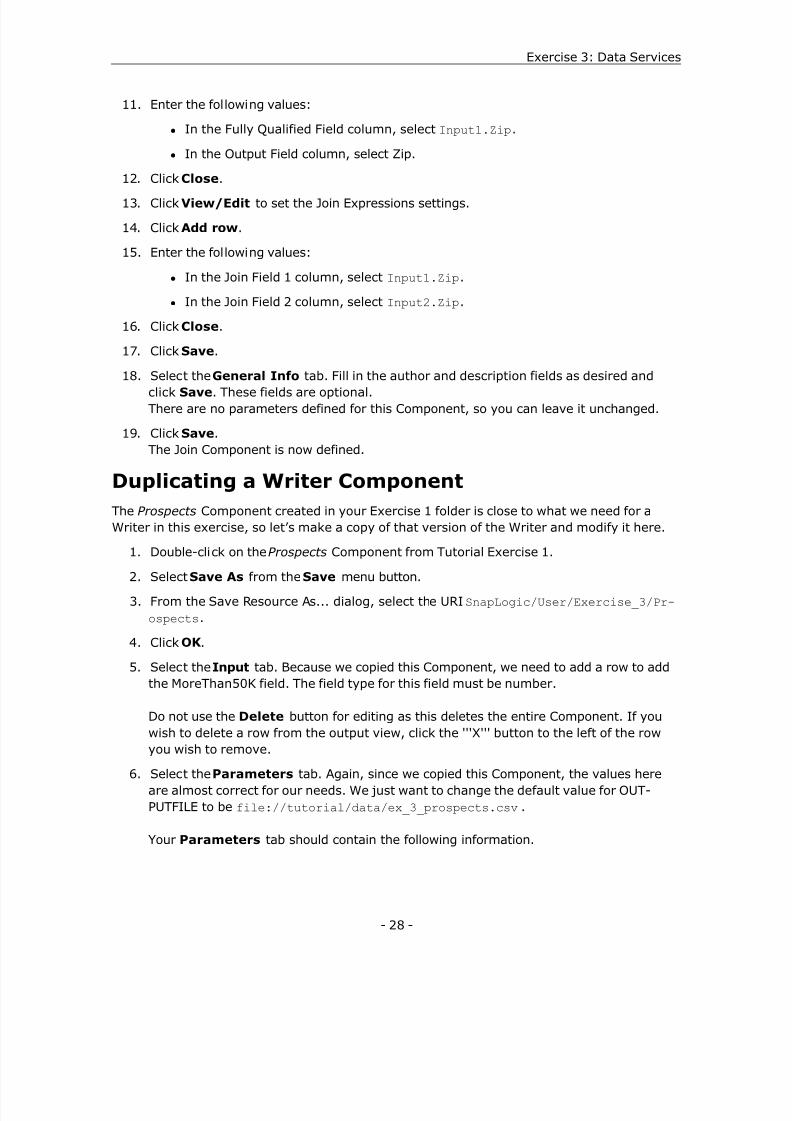
11. Enter the following values:
l In the Fully Qualified Field column, select Input1.Zip .
l In the Output Field column, select Zip.
12. Click Close .
13. Click View/Edit to set the Join Expressions settings.
14. Click Add row .
15. Enter the following values:
l In the Join Field 1 column, select Input1.Zip .
l In the Join Field 2 column, select Input2.Zip .
16. Click Close .
17. Click Save .
18. Select the General Info tab. Fill in the author and description fields as desired andclick Save . These fields are optional.There are no parameters defined for this Component, so you can leave it unchanged.
19. Click Save .The Join Component is now defined.
Duplicating a Writer ComponentThe Prospects Component created in your Exercise 1 folder is close to what we need for aWriter in this exercise, so let’s make a copy of that version of the Writer and modify it here.
1. Double-click on the Prospects Component from Tutorial Exercise 1. 2. Select Save As from the Save menu button.
3. From the Save Resource As... dialog, select the URI SnapLogic/User/Exercise_3/Pr-ospects .
4. Click OK .
5. Select the Input tab. Because we copied this Component, we need to add a row to addthe MoreThan50K field. The field type for this field must be number.
Do not use the Delete button for editing as this deletes the entire Component. If youwish to delete a row from the output view, click the '''X''' button to the left of the rowyou wish to remove.
6. Select the Parameters tab. Again, since we copied this Component, the values hereare almost correct for our needs. We just want to change the default value for OUT-PUTFILE to be file://tutorial/data/ex_3_prospects.csv .
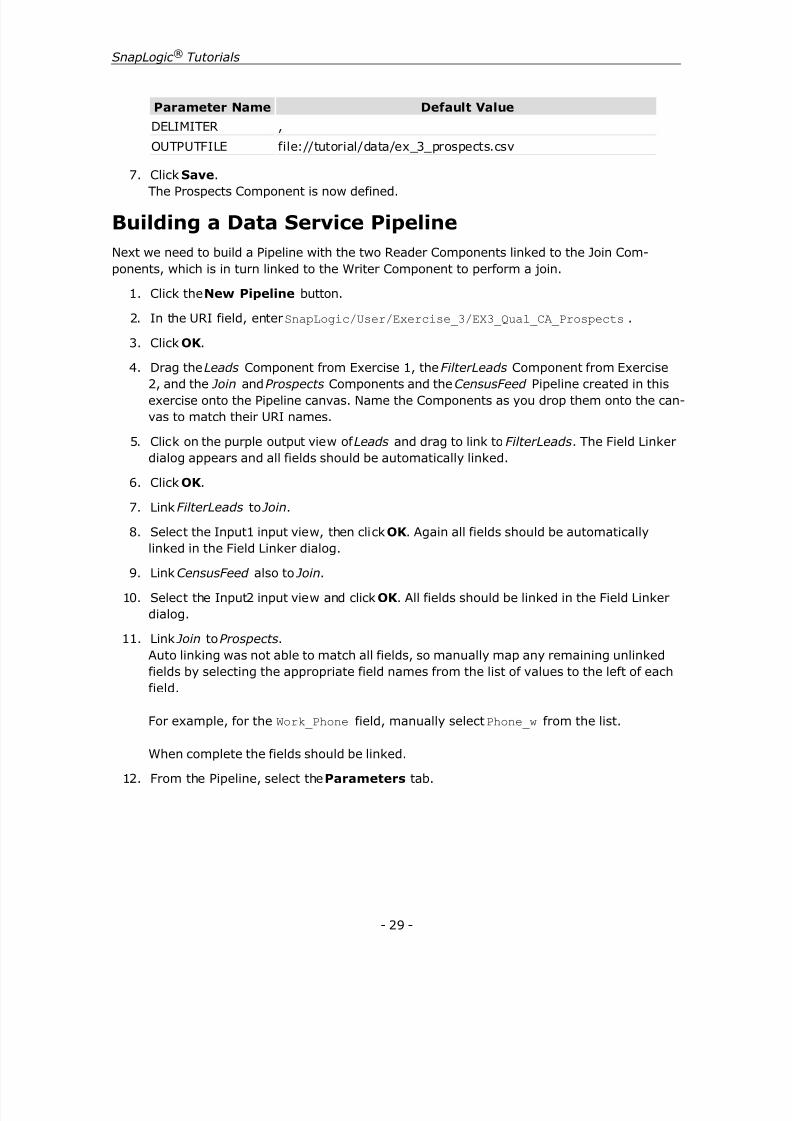
Your Parameters tab should contain the following information.
- 28 -
8/13/2019 SnapLogic Tutorial
http://slidepdf.com/reader/full/snaplogic-tutorial 29/43
SnapLogic ® Tutorials
Parameter Name Default Value
DELIMITER ,OUTPUTFILE file://tutorial/data/ex_3_prospects.csv
7. Click Save .The Prospects Component is now defined.
Building a Data Service PipelineNext we need to build a Pipeline with the two Reader Components linked to the Join Com-ponents, which is in turn linked to the Writer Component to perform a join.
1. Click the New Pipeline button.
2. In the URI field, enter SnapLogic/User/Exercise_3/EX3_Qual_CA_Prospects .
3. Click OK .
4. Drag the Leads Component from Exercise 1, the FilterLeads Component from Exercise2, and the Join and Prospects Components and the CensusFeed Pipeline created in thisexercise onto the Pipeline canvas. Name the Components as you drop them onto the can-vas to match their URI names.
5. Click on the purple output view of Leads and drag to link to FilterLeads . The Field Linkerdialog appears and all fields should be automatically linked.
6. Click OK .
7. Link FilterLeads to Join .
8. Select the Input1 input view, then click OK . Again all fields should be automaticallylinked in the Field Linker dialog.
9. Link CensusFeed also to Join .
10. Select the Input2 input view and click OK . All fields should be linked in the Field Linkerdialog.
11. Link Join to Prospects .Auto linking was not able to match all fields, so manually map any remaining unlinkedfields by selecting the appropriate field names from the list of values to the left of eachfield.
For example, for the Work_Phone field, manually select Phone_w from the list.
When complete the fields should be linked.
12. From the Pipeline, select the Parameters tab.
- 29 -
8/13/2019 SnapLogic Tutorial
http://slidepdf.com/reader/full/snaplogic-tutorial 30/43
Exercise 3: Data Services
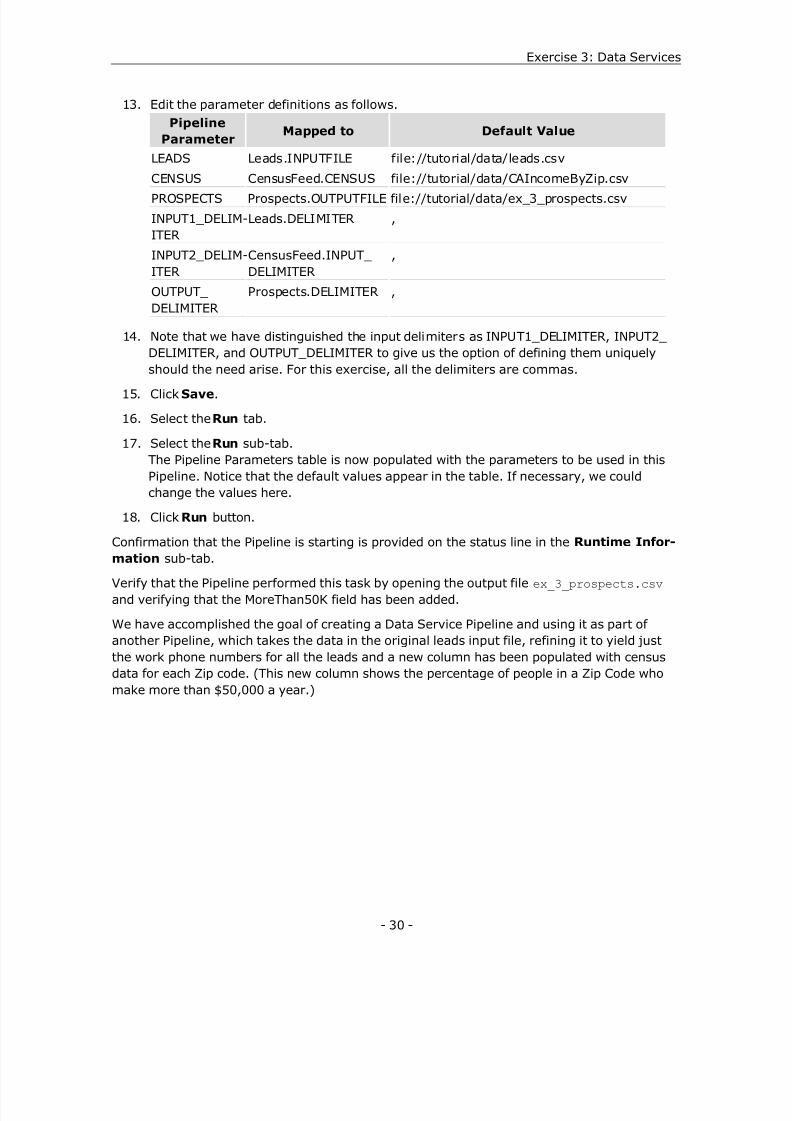
13. Edit the parameter definitions as follows.Pipeline
ParameterMapped to Default Value
LEADS Leads.INPUTFILE file://tutorial/data/leads.csvCENSUS CensusFeed.CENSUS file://tutorial/data/CAIncomeByZip.csvPROSPECTS Prospects.OUTPUTFILE file://tutorial/data/ex_3_prospects.csvINPUT1_DELIM-ITER
Leads.DELIMITER ,
INPUT2_DELIM-ITER
CensusFeed.INPUT_DELIMITER
,
OUTPUT_DELIMITER
Prospects.DELIMITER ,
14. Note that we have distinguished the input delimiters as INPUT1_DELIMITER, INPUT2_DELIMITER, and OUTPUT_DELIMITER to give us the option of defining them uniquely
should the need arise. For this exercise, all the delimiters are commas. 15. Click Save .
16. Select the Run tab.
17. Select the Run sub-tab.The Pipeline Parameters table is now populated with the parameters to be used in thisPipeline. Notice that the default values appear in the table. If necessary, we couldchange the values here.
18. Click Run button.
Confirmation that the Pipeline is starting is provided on the status line in the Runtime Infor-
mation sub-tab.Verify that the Pipeline performed this task by opening the output file ex_3_prospects.csv and verifying that the MoreThan50K field has been added.
We have accomplished the goal of creating a Data Service Pipeline and using it as part ofanother Pipeline, which takes the data in the original leads input file, refining it to yield justthe work phone numbers for all the leads and a new column has been populated with censusdata for each Zip code. (This new column shows the percentage of people in a Zip Code whomake more than $50,000 a year.)
- 30 -

8/13/2019 SnapLogic Tutorial
http://slidepdf.com/reader/full/snaplogic-tutorial 31/43- 31 -
SnapLogic ® Tutorials
8/13/2019 SnapLogic Tutorial
http://slidepdf.com/reader/full/snaplogic-tutorial 32/43
Exercise 4: Data SortingExercise 4 filters and sorts joined data based on zip codes where 25% or more of householdshave an income greater than $50,000. The results are written to a file named ex_4_pros-pects.csv .
Reviewing the Filtered Qualifying California Pros-pects PipelineIn the Library, you will see the Ex4_Filtered_Qual_CA_Prospects Pipeline. Let’s take a look atthe Components used in this Pipeline, then we’ll go create it ourselves.
Double-click the Ex4_Filtered_Qual_CA_Prospects Pipeline in the Library. This will open thePipeline in a new Canvas tab. In addition to Components used in previous exercises, you willsee the FilterProspects and SortProspects Components.
Double-click FilterProspects and then click:
l The General Info tab provides descriptive information for this Component. Thesefields are optional.
l The Properties tab is where you define the filter criteria used by this Component. Inthis example, we filter for zip codes where at least 25% of households have incomesgreater than $50,000. To do this, we define a filter expression to check when the valueof the MoreThan50K is greater than or equal to 0.25.
l In these exercises, zip code is defined as a string datatype.
l The Input tab defines the fields consumed by this Component.
l The Output tab specifies the fields output by this Component.
l The Parameters tab shows parameters used by this Component as well as theiroptional default values.
Double-click SortProspects .
l The General Info tab provides descriptive information for this Component. Thesefields are optional.
l The Properties tab is where you define the sorting criteria used by this Component. Inthis example, we will be sorting based on the following fields: MoreThan50K (primarykey), Zip_Code (secondary key).
l The Input tab defines the fields consumed by this Component.
l The Output tab specifies the fields output by this Component.
- 32 -
5
8/13/2019 SnapLogic Tutorial
http://slidepdf.com/reader/full/snaplogic-tutorial 33/43
SnapLogic ® Tutorials
l The Parameters tab shows parameters used by this Component as well as their optionaldefault values.
Click the Pipeline Properties button.
l The General Info tab provides descriptive information for this Pipeline. These fields
are optional. l The Input tab defines the fields consumed by this Pipeline. No Input Views are used by
this Pipeline.
l The Output tab specifies the fields output by this Pipeline. No Output Views are used bythis Pipeline.
l The Parameters tab shows parameters used by this Component as well as theiroptional default values.
The Census , Leads , FilterLeads , and Join Components and used in this Pipeline and their fieldmappings are identical to how they are defined in Exercise 3 . The following information
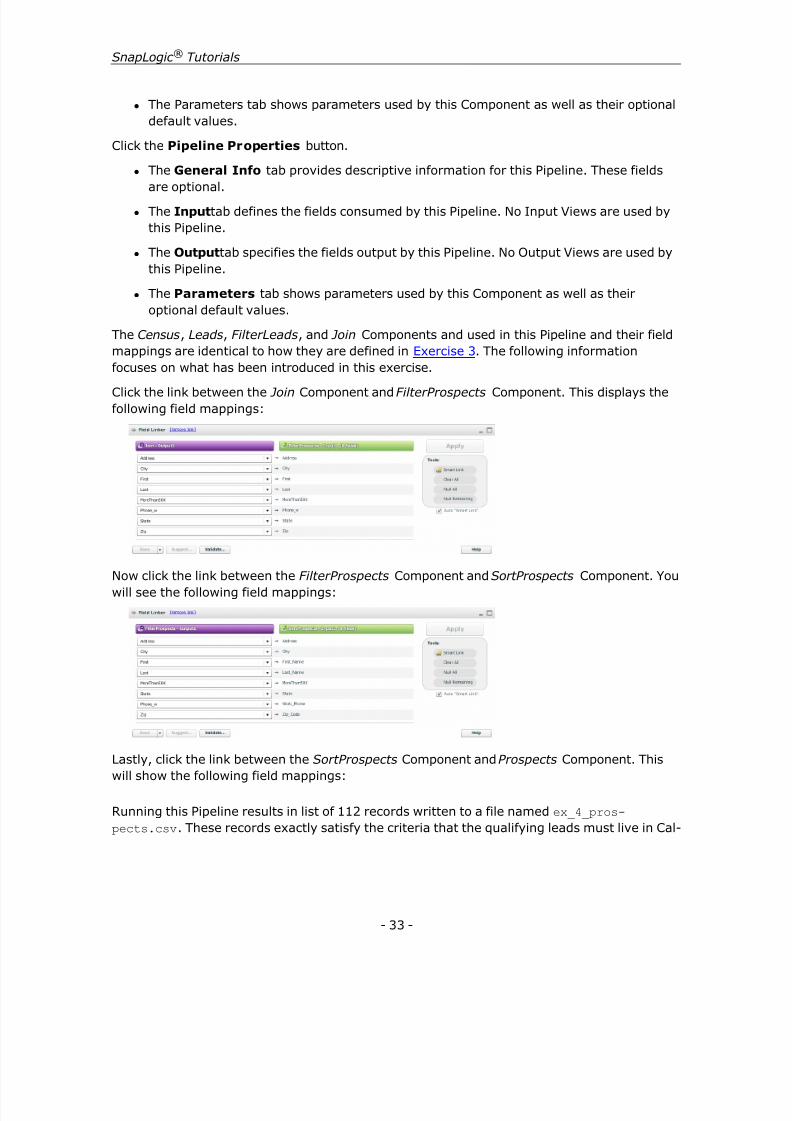
focuses on what has been introduced in this exercise.Click the link between the Join Component and FilterProspects Component. This displays thefollowing field mappings:
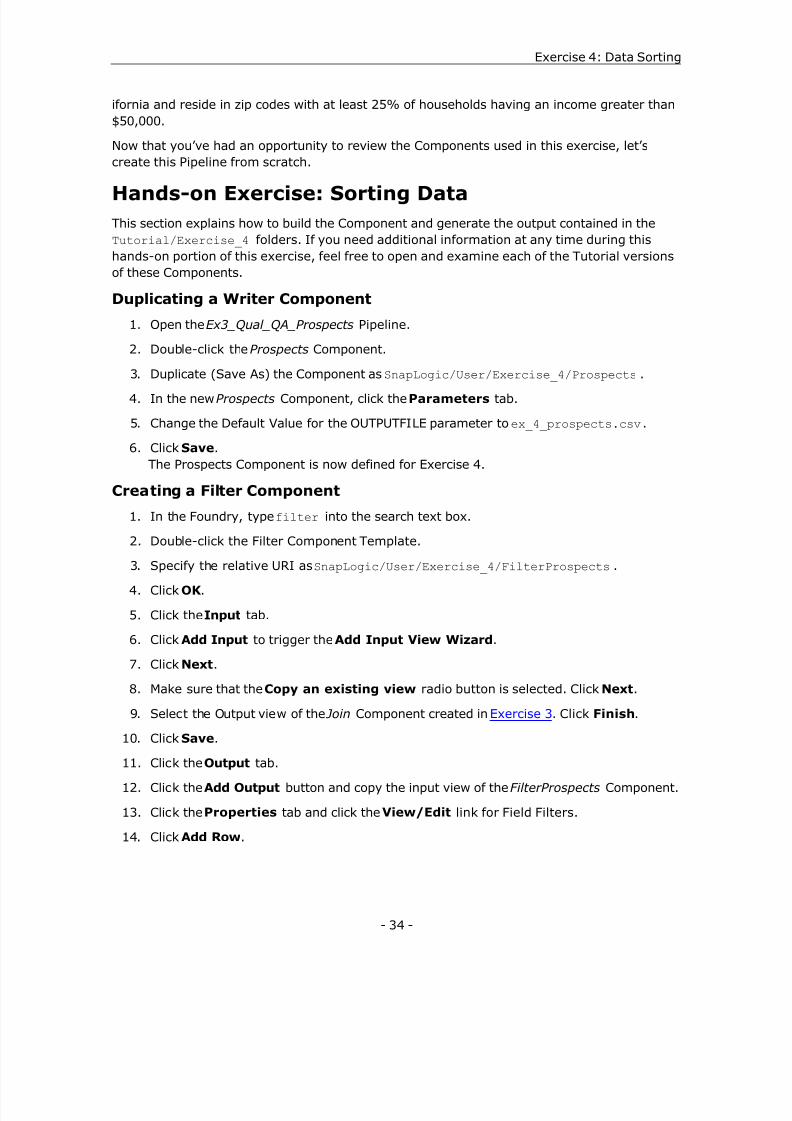
Now click the link between the FilterProspects Component and SortProspects Component. Youwill see the following field mappings:
Lastly, click the link between the SortProspects Component and Prospects Component. Thiswill show the following field mappings:
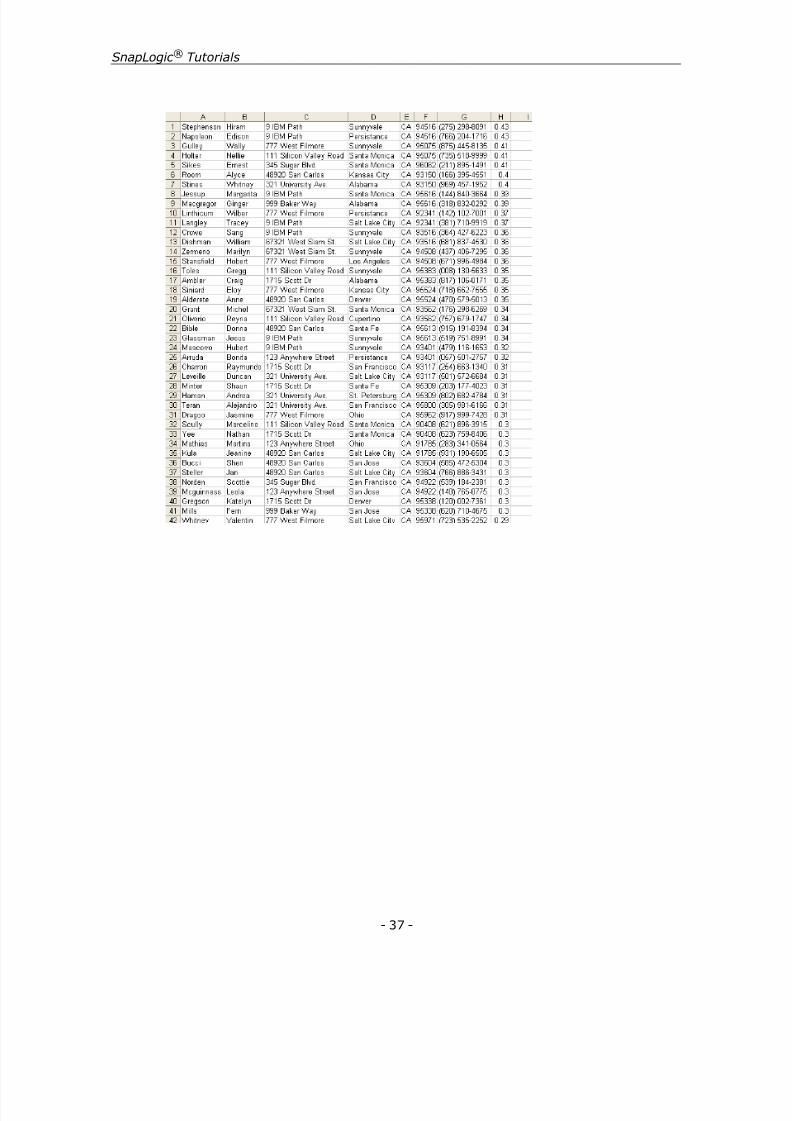
Running this Pipeline results in list of 112 records written to a file named ex_4_pros-pects.csv . These records exactly satisfy the criteria that the qualifying leads must live in Cal-
- 33 -
8/13/2019 SnapLogic Tutorial
http://slidepdf.com/reader/full/snaplogic-tutorial 34/43
Exercise 4: Data Sorting
ifornia and reside in zip codes with at least 25% of households having an income greater than$50,000.
Now that you’ve had an opportunity to review the Components used in this exercise, let’screate this Pipeline from scratch.
Hands-on Exercise: Sorting DataThis section explains how to build the Component and generate the output contained in theTutorial/Exercise_4 folders. If you need additional information at any time during thishands-on portion of this exercise, feel free to open and examine each of the Tutorial versionsof these Components.
Duplicating a Writer Component
1. Open the Ex3_Qual_QA_Prospects Pipeline.
2. Double-click the Prospects Component.
3. Duplicate (Save As) the Component as SnapLogic/User/Exercise_4/Prospects .
4. In the new Prospects Component, click the Parameters tab.
5. Change the Default Value for the OUTPUTFILE parameter to ex_4_prospects.csv .
6. Click Save .The Prospects Component is now defined for Exercise 4.
Creating a Filter Component
1. In the Foundry, type filter into the search text box.
2. Double-click the Filter Component Template.
3. Specify the relative URI as SnapLogic/User/Exercise_4/FilterProspects .
4. Click OK .
5. Click the Input tab.
6. Click Add Input to trigger the Add Input View Wizard .
7. Click Next .
8. Make sure that the Copy an existing view radio button is selected. Click Next .
9. Select the Output view of the Join Component created in Exercise 3 . Click Finish .
10. Click Save . 11. Click the Output tab.
12. Click the Add Output button and copy the input view of the FilterProspects Component.
13. Click the Properties tab and click the View/Edit link for Field Filters.
14. Click Add Row .
- 34 -
8/13/2019 SnapLogic Tutorial
http://slidepdf.com/reader/full/snaplogic-tutorial 35/43
SnapLogic ® Tutorials
15. Specify the Field Filters properties to be:
l Field: MoreThan50K
l Value: 0.25
l Comparison:>=
l View: Output1
16. Click Close .
17. Click Save .
Creating a Sort Component
1. In the Foundry, type sort into the search text box.
2. Double-click the Sort Component Template and create a new Component with the rel-ative URI to SnapLogic/User/Exercise_4/SortProspects .
3. Select the Input tab and copy the input view of the Prospects Component. 4. Select the Output tab and copy the input view of the SortProspects Component.
5. Click the Properties tab and click the View/Edit link for Sort Specifications.
6. Click Add Row .
7. Specify the Sort specs properties to be:
l Sort field: MoreThan50K
l Sort order: desc
8. Click Add Row and specify the Sort spec properties to be:
l Sort field: Zip_Cde
l Sort order: asc
9. Click Close .
10. Click Save .
Building the Pipeline
Next you can now link these Components together.
1. Click the New Pipeline button .
2. Specify the URI as SnapLogic/User/Exercise_4/Ex4_Filtered_Qual_CA_Prospects . 3. Click OK .
4. Drag the required Components onto the Pipeline Canvas and link the Components as fol-lows:
l Census , connect to Join
l Leads , connect to FilterLeads
- 35 -
8/13/2019 SnapLogic Tutorial
http://slidepdf.com/reader/full/snaplogic-tutorial 36/43
Exercise 4: Data Sorting
l FilterLeads , connect to Join
l Join , connect to FilterProspects
l FilterProspects , connect to SortProspects
l SortProspects , connect to Prospects
l Prospects
5. Define field mappings as described in "Reviewing the Filtered Qualifying California Pros-pects Pipeline" .
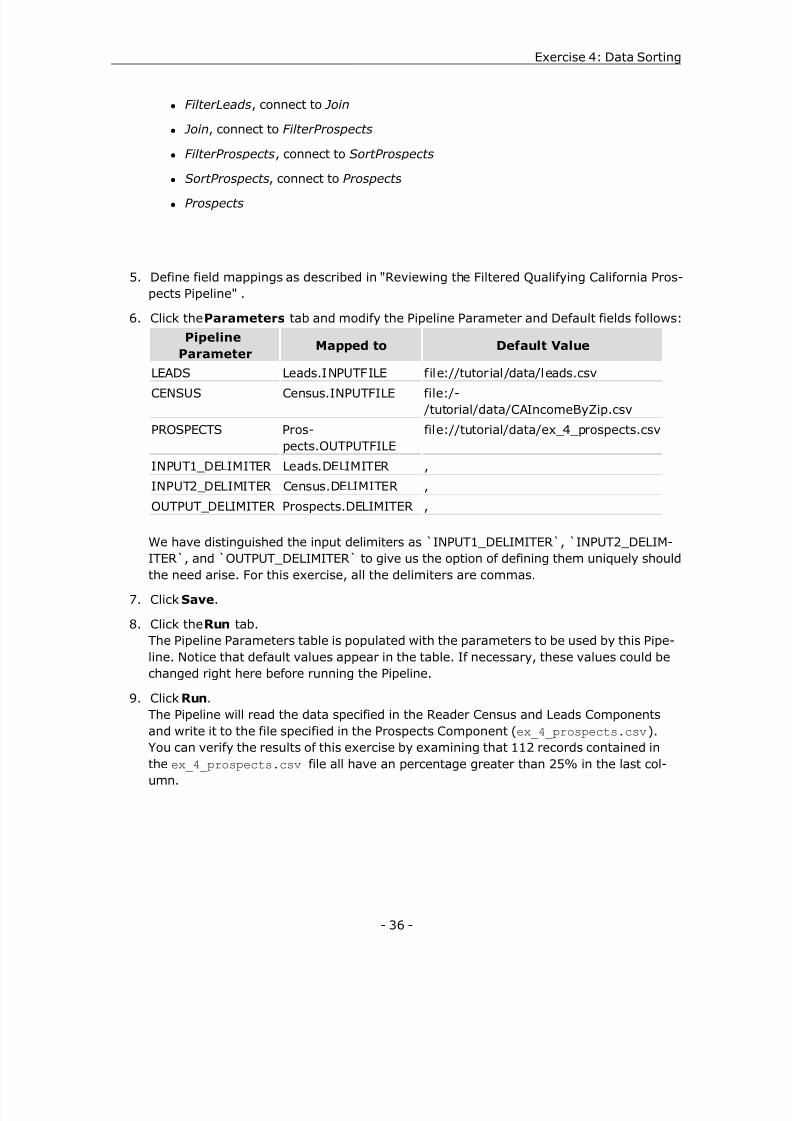
6. Click the Parameters tab and modify the Pipeline Parameter and Default fields follows:Pipeline
ParameterMapped to Default Value
LEADS Leads.INPUTFILE file://tutorial /data/leads.csvCENSUS Census.INPUTFILE file:/-
/tutorial/data/CAIncomeByZip.csvPROSPECTS Pros-
pects.OUTPUTFILEfile://tutorial/data/ex_4_prospects.csv
INPUT1_DELIMITER Leads.DELIMITER ,INPUT2_DELIMITER Census.DELIMITER ,OUTPUT_DELIMITER Prospects.DELIMITER ,
We have distinguished the input delimiters as `INPUT1_DELIMITER`, `INPUT2_DELIM-
ITER`, and `OUTPUT_DELIMITER` to give us the option of defining them uniquely shouldthe need arise. For this exercise, all the delimiters are commas.
7. Click Save .
8. Click the Run tab.The Pipeline Parameters table is populated with the parameters to be used by this Pipe-line. Notice that default values appear in the table. If necessary, these values could bechanged right here before running the Pipeline.
9. Click Run .The Pipeline will read the data specified in the Reader Census and Leads Componentsand write it to the file specified in the Prospects Component ( ex_4_prospects.csv ).You can verify the results of this exercise by examining that 112 records contained inthe ex_4_prospects.csv file all have an percentage greater than 25% in the last col-umn.
- 36 -
8/13/2019 SnapLogic Tutorial
http://slidepdf.com/reader/full/snaplogic-tutorial 37/43
SnapLogic ® Tutorials
- 37 -
8/13/2019 SnapLogic Tutorial
http://slidepdf.com/reader/full/snaplogic-tutorial 38/43
Exercise 5: Utilizing Pass-ThroughExercise 5 is based on Exercise 2 and introduces you to the concept of pass-through. Com-ponents that support pass-through allow you to map only the fields required by the Com-ponent. The remaining fields "pass-through" the Component and are available for linkingdownstream. See the Pass-through section in the User Guide for more information.
Note: The Tutorial Pipelines generate the sample output files ex_n_pros-pects.csv, (for example, ex_1_prospects.csv , ex_2_prospects.csv ). When yourun your exercises, you will overwrite these files. To avoid this, you can renameyour exercise output files to be unique. Or you can simply re-run the sample pipe-lines to recreate the output files if you need to examine them.
Reviewing the California Prospects Pipeline, Exer-cise 5From the Da ta Server icon (<my_machine _name>:8088 ), double-click the Ex5_CA_Prospectsfolder. The Pipeline is identical to the one in Exercise 2 with one exception.
Double click FilterLeads . This Component is almost identical to the one used in Exercise 2,except for the way the input and output views are configured. Click on:
l The Input tab. Notice that only the State field is defined. Since this filter Component isapplying a predicate to the State column, State is the only column that it really needs asinput.
l The Output tab. Again notice that the only field defined is the State field but also noticethat the box for view Input1 is checked in the Pass-through Input Views section. Thisenables passing-through all the fields that aren't linked to a field of Input1.
Back on the Ex5_CA_Prospects Pipeline, click the link between the Leads Resource to the Fil-terLeads Resource to display the Field Linker page.
In this exercise, FilterLeads only requires a single field, the State field.
Click anywhere on the link between the FilterLeads Resource to the Prospects Resource to dis-play the Link menu and select Field Linking to display the Field Linker page.
Since pass-through has been enabled in FilterLeads , not only is the State field available but allthe fields that were available to the input view of FilterLeads .
When you click the Run Pipeline button, the Pipeline processes the Reader output, passes itthrough the Filter and into the Writer input, then creates the ex_5_prospects.csv file. Youshould see that the output result contains 675 records.
Now let’s create the Resources in Exercise 5.
- 38 -
6
8/13/2019 SnapLogic Tutorial
http://slidepdf.com/reader/full/snaplogic-tutorial 39/43
SnapLogic ® Tutorials
Hands-on Exercise: Implementing Pass-ThroughCreating a Filter Component with Pass-Through
1. Double-click the Filter Component in the Component Library pane.
2. Specify the URI as SnapLogic/User/Exercise_5/FilterLeads .
3. Click OK .
4. Select the Input tab, click the Add View button, click Next where the input can be cop-ied from an existing view or can be created as a new view. Since our Component onlyneeds one field, we will select the new blank view option and click Finish .
5. Click Add Row to add a single row.
6. Name the field State . The datatype should be string and add a field description.
7. Click Save .
8. Click the Output tab.
9. Repeat the steps you performed to define the input view Input1 to create the outputview Output1 , or use the copy view wizard to copy the definition of Input1 .
10. Check the box next to Input1 to enable pass-through on this output view.
11. Click Save .
12. Click the Properties tab for the FilterLeads Component.
13. Specify the properties exactly as you did in exercise 2 .
14. Click on View/Edit link of Field Filters, then add the row:
l Field: Name of the CSV file column is State
l Operator: ==
l Value: The value to filter on is CA
l View: Output1
15. Click Close .
16. Click Save .The Filter is now defined.
Duplicating the Reader and Writer Resources
Duplicate the Leads and Prospects Resources created in your Exercise 2 folder.
1. Double-click the Leads Resource icon from Tutorial Exercise 2 to open it.
2. Select Save As from the Save menu button drop-down list.
3. From the Save Resource As dialog, specify the URI as SnapLogic/User/Exercise_5/Leads .
- 39 -
8/13/2019 SnapLogic Tutorial
http://slidepdf.com/reader/full/snaplogic-tutorial 40/43
Exercise 5: Utilizing Pass-Through
4. Click OK .The duplicated Leads Resource appears in SnapLogic > User > Exercise_5 .Since the Leads Reader will function exactly as it did in Exercise 2 (that is, reading inthe fields from the leads.csv file) we can leave its Properties, Output view, and Param-eters unchanged.
5. Perform the same steps as above for duplicating the Prospects resource from Exercise2. Specify the URI in the Save As dialog to be SnapLogic/User/Exercise_5/Prospects .
Building the Pipeline
Now we can link the Leads , Prospects , and FilterLeads Resources together in a Pipeline just asin Exercise 2 to process the data.
1. Click the New Pipeline button.
2. Specify the URI as SnapLogic/User/Exercise_5/CA_Prospects .
3. Click OK . 4. Drag the FilterLeads Component onto the Pipeline canvas. Note that _1 is appended to
the Component name.
5. Rename the Component FilterLeads .
6. Drag your Leads and Prospects Resources onto the Pipeline canvas. Name them Leads and Prospects respectively as you drop them onto the canvas.
7. Link the Leads Reader to the FilterLeads Resource.
8. By default, the Field Linker dialog appears, and the State fields will be mapped auto-matically because a matching field name was found.
9. Click Apply and Save when finished.
10. Link the FilterLeads Resource to the Prospects Writer.
11. Click Apply and Save when finished.
12. From the Pipeline Properties , select the Pipeline Parameters tab.
13. Edit the parameters to change the default names.
14. Click Save .
15. Click the Run Pipeline from the Pipeline menu.
The Pipeline will execute exactly as it did in Exercise 2. The only difference is that the fieldsunneeded by the Filter resource are passed through to the "downstream" resource.
Open ex_5_prospects.csv and verify the filtered results. You should see only the 675 leadsthat have California addresses, similar to the output from Exercise 2.
- 40 -

8/13/2019 SnapLogic Tutorial
http://slidepdf.com/reader/full/snaplogic-tutorial 41/43- 41 -
SnapLogic ® Tutorials
8/13/2019 SnapLogic Tutorial
http://slidepdf.com/reader/full/snaplogic-tutorial 42/43
C Components
creating 8
data service 25
filter 17, 34
fil ter with pass-through 39
join 27
sort 35
writer 11
d u plicating 19, 28, 34, 39
E
exercises
ov erview 6, 16, 22, 32, 38
P
Pipelin es
building 12, 20, 29, 35, 40
T
tutorials
environement 4
overview 5
- 42 -
Index

8/13/2019 SnapLogic Tutorial
http://slidepdf.com/reader/full/snaplogic-tutorial 43/43
SnapLogic ® Tutorials