0One Games - Adventure - The Grave of the Prince of Lies.pdf

1
Smoothing the lies: The distinctive effects of patent
characteristics on examiner and applicant citations
Joaquín M. Azagra-Caro*
INGENIO (CSIC-UPV), Universitat Politècnica de València, Camino de Vera s/n, 46022 Valencia, Spain. E-mail:
European Commission, Joint Research Centre (JRC), Institute for Prospective Technological Studies (IPTS), Edificio Expo,
C/Inca Garcilaso 3, E-41092 Sevilla, Spain**
CSIC - Consejo Superior de Investigaciones Científicas, Institute of Public Goods and Policies (IPP-CCHS), C/Albasanz 26-28,
E-28037 Madrid, Spain
Pauline Mattsson
Unit for Bioentrepreneurship (UBE) - Department of Learning, Informatics, Management and Ethics (LIME), Karolinska Institute,
SE-171 77 Stockholm, Sweden. E-mail: [email protected]
François Perruchas
INGENIO (CSIC-UPV), Universitat Politècnica de València, Camino de Vera s/n, 46022 Valencia, Spain. E-mail:
Patent citations added by examiners are often used indicators of technological impact and knowledge
flows, despite various critiques. In this study, we analyse the distribution of examiner patent citations
according to patent characteristics, to show their limitations. According to our findings, the number of
applicant citations included is dependent on the science-base of the technology. However, this gets
masked by the citations added by patent examiners, who smooth the distribution of citations across
* Corresponding author at: INGENIO (CSIC-UPV), Ciudad Politécnica de la Innovación Edif. 8E 4º, Camino
de Vera s/n, 46022 Valencia, Spain. Tel.: +3434963877007 ext. 78439. E-mail address: [email protected].
** The views expressed in this article are those of the authors; they do not necessarily reflect those of the
European Commission (EC). Neither the EC nor anyone acting on behalf of the EC can be held responsible for
the use that might be made of the information.

2
technology classes and include the same number of citations regardless of whether applicants cite any
references. Some researchers have called for the use of applicant rather than examiner patent citations
as indicators of technology impact and knowledge flows. Nevertheless, we show that the former also
have important caveats, because applicants may increase the number of citations in international patents
and when there are co-applicants. The implications are that analysts should consider a context-driven
use of citation-based indicators.
Introduction
‘Generation, diffusion and exploitation of knowledge are at the core of the research system’
(EC, 2007: 16). This official statement recognises the importance of academic research that
has focused on the origins and the destiny of the knowledge produced. Citations in patents
have been a common indicator to trace the technological knowledge on which the invention is
built. Before describing the state-of-the-art a number of different distinctions between
citations needs to be made:
according to direction of the citation, we can classify patent citations as backward or
forward citations.
‘Backward citations’ is the term used for a traditional citation and is the document that was
published earlier than the document citing it. In turn, the newer document is called ‘forward
citation’ or citing document. The use of forward citations is customary when the technological
impact of the patented invention is the target (Noma & Olivastro, 1984), often as a function of
the characteristics of the patent (Allison & Sager, 2007). The use of backward citations is
customary to express the knowledge base of the patented invention. This introduces another
important distinction:
according to the type of cited document, we can classify patent citations as patent-
to-patent or patent-to-paper citations (also known as patent vs non-patent references
or literature).

3
Patent-to-patent citations are the most frequently used and often serve as a proxy for the
whole knowledge base of the invention, more properly specified as the technological
knowledge base. For example, geographical spillovers can be measured by analysing whether
the patents cited are from the same country as the applicant (Jaffe & Trajtenberg, 1996).
Patent-to-paper citations frequently serve as proxies for the scientific knowledge base (Narin
& Noma, 1985; Hassan, 2003; Leydesdorff, 2004), usually leading to some justification of the
importance of science, or at least of some cutting-edge technologies.
As Chen (2003) accurately notes, patent-to-patent backward citations are used by
economists to explore knowledge spillovers, while their wider application - especially, of
patent-to-paper citations – is generally used in scientometrics. However, classical works use
similar wording to suggest a causal effect from citation to patent: ‘knowledge diffusion’,
‘utility of basic research to technology’, etc.
The increasing use of citation indicators among researchers has developed in parallel with
the use to justify research funding (Kostoff, 1994). However, some qualitative studies
recommend caution in the interpretation of results, based on another distinction among patent
citations:
according to who inserted the citation, we can classify patent citations as examiner
or applicant citations (the latter are also, somewhat improperly, referred to as
inventor citations).
The traditional studies on patent citations rely on patent examiner citations that appear on
the front pages of patent documents. Applicant and examiner citations serve different
purposes. Examiner citations are for the purpose to restricting the patent claims, whilst the
applicant citations are for demonstrating prior art for the invention generally. The use of
examiner citations introduces three main implications or problems (see e.g. Oppenheim, 2000;
Meyer, 2000; Michel & Bettels, 2001). First, examiner citations may provide biased

4
information about knowledge flows, since numbers might vary for non-technoeconomic
reasons1. Second, unlike the US, the patent system in Europe does not compel patent
applicants to provide a comprehensive background literature review, making it much more
probable that patent examiners will add citations. Third, we do not know whether applicants
are influenced by the fact that examiners will check their citations.
These critiques have not deterred traditional quantitative studies, perhaps because
qualitative evidence is not sufficiently convincing. In addition some academics claim that
patent citations are useful because they are more credible than paper citations (Lai & Wu,
2005) and that more efforts should be devoted to producing better-codified data on patent
citations (Stock & Stock, 2006) to facilitate its use. It has been proposed that examiner
forward citations should be used to build indicators such as h-indexes of firms’ technological
performance (Guan & Gao, 2008).
The first contribution of this paper is to provide quantitative evidence of possible
inconsistencies in examiner citations that should prevent from extended use.
Nevertheless, the critiques made about the use of patent citations have had some
consequences and have inspired several quantitative research lines. The first is to adopt more
careful wording to refer to the relation between patents and their citations, examples include:
‘interactions’, ‘links’ or ‘linkages’, ‘vicinity’, etc. (Tijssen, 2001; Callaert et al., 2006). A
second is to use patent data in alternative ways to visualise relations within the knowledge
1 “Non-technoeconomic reasons” in this context means practices related to the patenting process that do not
have much to do with the actual invention. These are some examples: the increasing workload of examiners; the
number of claims that are deeply examined; the existence of a duty of disclosure; the education requirements to
become a patent examiner; whether the patent office is examining or not; the preference for national or English
language (Meyer, 2000). Others are the relevance given to non-patent citations, whether the patent is national,
international or part of a family (Michel and Bettels, 2000), etc. In the next section, we describe how some of
these reasons may have an impact on the number of citations.

5
base, e.g. through co-classification in technology classes to show that countries for example
are not an appropriate unit of observation (Leydesdorff, 2008). A third is to promote a
quantitative approach to the difference between examiner and applicant citations. In this line,
the fact that the use of examiner citations biases the interpretation of findings is confirmed,
for instance, because the knowledge base appears to be more localised if measured through
applicant citations (Criscuolo & Verspagen, 2008). The degree of localisation and of
differences between examiner and applicant citations depend most likely on the absorptive
capacity of the region (Azagra et al., 2009) 2
.
This last stream of research pleads for the use of applicant rather than examiner citations as
a better expression of knowledge flows, and links directly to the second contribution of the
paper: to establish whether applicant citations also have caveats as indicators of knowledge
flows.
The next section builds a conceptual framework for the distribution of patent citations
according to the characteristics of patents. Based on this we set up testable hypotheses, based
on the research context. Further, we present the data and methodology and finally the results
and some conclusions.
Some insights into the meaning of examiner and applicant patent citations
The distribution of examiner backward citations by patent characteristics
We have reported that: (i) quantitative studies have explored how the number of examiner
forward patent citations varies in terms of patent characteristics; (ii) qualitative studies
2 We follow Cohen and Levinthal’s (1990) definition of absorptive capacity: “a limit to the rate or quantity of
scientific or technological information that firm can absorb”. To justify the extension of the concept of
absorptive capacity from firms to regions, see Niosi and Bellon (2002) and Azagra et al. (2006a).
6
suggest that patent characteristics influence the inclusion of examiner backward patent
citations. These two aspects justify quantitative study of the distribution of examiner
backward citations according to different characteristics of the patents. Earlier investigations
have been incidental, and they provide descriptive statistics rather than substantial analysis.
Our starting point is:
Hypothesis 1. Patent characteristics play an influential role in the distribution of examiner
citations.
Which characteristics are these? We will subdivide Hypothesis 1 into several sub-
hypotheses outlining the specific relations between each of the considered patent
characteristics and examiner citations. Let us distinguish two groups of characteristics: non-
technoeconomic, as defined in footnote 1, and technoeconomic, those characteristics that
justify substantially changes in the number of citations because of the nature of the invention.
Non-technoeconomic characteristics that we will incorporate in this study are time effects,
route of protection and ownership regime.
In terms of time effects, earlier studies have shown that they seem to influence the
distribution of examiner citations. Callaert et al. (2006) confirm that, between 1991 and 2001,
for European Patent Office (EPO) patents, the average number of examiner citations per
patent has decreased.3 In this paper, we will not only take into account patents from a
European region (not only EPO but also national and other international patents). Assuming
that the characteristics of EPO patents hold, we can formulate:
3 In the same period, the authors confirm an increase in US Patent and Trademark Office (USPTO) citations,
but we do not consider USPTO patents in this paper. The reason can be that US examiner time constraints have
become tighter, with the increase in the number of patent applications outpacing increases in the number of
examiners (Merrill et al., 2004).

7
Hypothesis 1.a. The number of examiner citations in patents decrease with time.
In relation to means of protection, many works consider only one protection alternative,
national (USPTO) or international (EPO), probably because of the major focus on the US and
Europe generally. However, when studying a single European country or region, several
protection alternatives may be relevant, national and international, because of the home
advantage effects (Criscuolo, 2006) and because alternative routes may be indicators of
geographical patterns of technological protection (Azagra et al., 2006b). In many European
countries, the national process of patent examination is mainly formal, whereas the
international one pays at least as much attention to the contents as in the hardest national
systems (like the German one). Hence, the international process may push examiners to be
more exhaustive when performing a search about previous art. For this reason, we state:
Hypothesis 1.b. Examiners include more citations in international patents than in
national patents.
Regarding the ownership regime, although there is little evidence about the impact of co-
ownership on the number of citations in patents, it could be argued to be influential, since
number and type of institutions may affect examiners’ behaviour. For instance, examiners
may conduct broader searches in the presence of co-applicants, interpreting that the joint
knowledge base is wider than for a single applicant. This is especially true if a firm includes
universities and public research organisations among applicants, assuming that the public
knowledge base deserves more attention than in patent applications from firms alone. This
justifies the next hypothesis:
Hypothesis 1.c. Examiners include more citations in patents applied for by firms if they
have co-applicants.

8
Our second group of patent characteristics are related to technoeconomic features: region,
technology class and economic sector.
Although not discussed in the descriptive analysis, let us recall that regions may play a role
in patent citation. Richer regions are likely to have a more developed industrial sector, firms
with a longer established tradition of applying for patents and more capacity to fill in patent
applications (including citations to prior art). Thus, it is possible to enunciate:
Hypothesis 1.d. Patents from more economically favoured regions (i.e. with highest per
capita income) will have more examiner citations.
In terms of technology classes, Callaert et al. (2006) find a larger number of EPO examiner
citations in patent-to-patent citations in Mechanical Engineering and Machinery and patent-
to-paper citations in Chemistry and Pharmaceuticals. Both are expected, the former because
of the long industrial strength in Europe in sectors close to mechanical engineering, and the
later, for the high pool of scientific knowledge applicable to more science-based
technologies4. Both reasons lead us to:
Hypothesis 1.e. Patents belonging to the class of mechanical engineering and more
science-based technologies are highly citing, i.e. the numbers of examiner citations are the
highest.
Earlier studies have proved that patenting is a more usual/efficient protection strategy in
some economic sectors than in others. Pavitt (1984) would argue that patenting is less
frequent in supplier-dominated sectors than in production-intensive or science-based sectors.
4 We use the definition of Meyer-Krahmer and Schmoch (1998), who define science-based technologies as
fields with frequent references to scientific publications and classify Mechanical engineering as a less science-
based technology.

9
Breschi and Malerba (1997) argue that traditional sectors are characterised by low levels of
appropriability, so the resource to patents is scarce, compared to mechanical industries,
automobile industries or high-tech sectors. Where there is a higher pool of citable knowledge
base (i.e. patents), one could expect a higher number of citations to this pool. This leads us to
form the next hypothesis:
Hypothesis 1.f. Examiners will include more citations in patents from production-
intensive and science-based economic sectors than in patents from traditional sectors.
Front-page vs full-text citations: Examiners track applicants
Another common source of criticism of information derived from examiner patent citations
is that it is the patent applicants who have the knowledge base of the invention (Jaffe et al.,
2000). However, it is much easier to analyze examiner citations since these are the ones
included in the patent databases and applicant citations can be tracked only by manually
checking the patent documents. It is only recently that quantitative studies have begun to
investigate examiner and applicant added citations separately, and this is due to improvements
in computation facilities for identifying citations on front pages of patent documents (Sampat,
2004; Thompson, 2006; Alcácer & Gittelman, 2006; Criscuolo & Verspagen, 2008).
However, following the economic tradition of measuring knowledge spillovers referred to
in the introduction, most of these studies have focused on citing-cited pairs. They analyse
localisation effects, regardless of whether the citations are included by examiners or
applicants. They are rarely interested in differences in patent characteristics although such
differences are relevant, since they may be a basic reason for the different sets of patents
included by applicants and examiners.
Another characteristic of these studies is that they look only at applicant citations that the
examiner considers relevant, i.e. those on the front pages. However, the applicant citations

10
which are included in the patent text, may be much closer to the actual knowledge base, since
they partly reflect the source of ideas of the inventor. Because of the time consuming process
of retrieving the information, only a few studies consider this aspect (see exceptions such as
Acosta & Coronado, 2003).
Given the scarcity of direct comparisons of citations along patent characteristics, it is
difficult to establish a hypothesis. Assuming that the non-technoeconomic and
technoeconomic reasons for increasing the number of citations affect examiners and
applicants equally, we can start by formulating a cautious hypothesis:
Hypothesis 2. Applicants and examiners include comparable distributions of citations
independent of patent characteristics.
Nevertheless, there do exist some results related to the influence of patent characteristics on
applicant citations. As in the previous section, we will subdivide Hypothesis 2 into several
sub-hypotheses. For instance, regarding time effects, Criscuolo & Verspagen (2008) find that
the share of applicant citations in EPO patents decreased between 1985 and 1999. That is why
we formulate:
Hypothesis 2.a. The number of applicants citations in patents region decrease with time.
In terms of route of protection, the same authors conceptually justify the fact that both
examiners and applicants tend to add more citations in patents applied for through the Patent
Cooperation Treaty (PCT)-EPO procedure, compared to the direct-EPO procedure. The
evidence from their econometric tests is inconclusive about whether this affects the
probability of examiner-added citations. Comparing both patenting routes to the national one,
it seems intuitive to state:

11
Hypothesis 2.b. Applicants include more citations in international patents than in
national patents.
Regarding the ownership regime, institutions may differ in their tendency to include
citations. For instance, universities and public research organisations may show a higher
propensity for citation, so co-applications involving firms and these institutions may be more
likely to incorporate prior art than patent applications from firms alone. It follows from this
reasoning:
Hypothesis 2.c. Applicants include more citations in patents applied for by firms if they
have co-applicants.
Technoeconomic characteristics (region, technology, economic sector) are also worth some
attention. Focusing on regions, Acosta & Coronado (2003) observe the concentration of
patent-to-paper citations in the more developed regions in Spain, such as Madrid, Catalonia
and the Basque Country, and their scarcity in regions with GDP below 75%5 of the EU
average. However, although Acosta & Coronado do not stress this point, the distribution of
patent-to-patent citations (which are more abundant than patent-to-paper citations) is
relatively even across regions. Hence, we report:
Hypothesis 2.d. Patents from more economically favoured regions (i.e. with highest per
capita income) will have more applicant citations.
For technology classes, Sampat (2004) provides some empirical evidence and suggests that
applicants are more likely to include citations in fields where patenting is important such as
chemicals and pharmaceuticals. Drawing on the previous literature, Sampat argues that in
5 Note that the present empirical analysis studies the Valencian Community, which is included in this group.

12
fast-moving, more technology intensive classes, the ability of examiners to access current
information is limited, and applicants are better informed about the closely related prior art
and therefore include more citations than examiners. In technologies that are less science
intensive, citation rates between examiners and applicants will generally be more similar. In
the case of EPO patents, Criscuolo & Verspagen (2008) find that the share of applicant
citations is higher in chemistry and materials and lower in semiconductors,
telecommunication, audiovisual and information technology. The next hypothesis is thus:
Hypothesis 2.e. Patents belonging to the class of mechanical engineering and more
science-based technologies are highly citing, i.e. the numbers of applicant citations are the
highest.
For economic sectors, Acosta & Coronado (2003) show that, in Spain, 85% of patent
applicants’ patent-to-paper citations are concentrated in only three sectors (chemistry,
pharmaceuticals and biotechnology). However, patent-to-patent citations predominate in high
and medium-high technology sectors, such as electrical engineering and instruments, which is
why Leydesdorff (2004) suggests that a sector such as biotechnology is not a valid model for
how university-industry interactions occur in general. It is then reasonable to test:
Hypothesis 2.f. Patents from economic sectors other than traditional ones (i.e.
production-intensive and science-based economic sectors) will have more applicant citations.
Within full-text citations: Patents where applicants disclose knowledge are representative of
the knowledge found in all patents
Criscuolo & Verspagen (2008) plead in their study for greater use of applicant rather than
examiner citations, as indicators of knowledge flows. They rely on the assumption that the
characteristics of patents with applicant citations are representative of all patents. The

13
problem, which the authors are aware of since they study the European case, once again, is the
lack of applicant citations. What about patents that do not include applicant citations?
In this situation, it is questionable whether we should consider even patents with applicant
citations in the full-text as being representative of the knowledge base. A good indication
might be if the distribution of patents was the same for different characteristics of patents for
both applicants who disclose some information and those who do not reveal any. To test for
this, it is useful to formulate:
Hypothesis 3. The characteristics of patents with and without applicant citations are similar.
Within front-page citations: Examiners behaviour is different depending on whether
applicants disclose some knowledge or not
The best conceptual background to understand the differences between applicant and
examiner citing-cited pairs is in Alcácer & Gittelman (2006). They investigate different
scenarios in terms of examiners’ decisions about whether to fill the gaps (adding citations that
the inventor has left out) or track the distribution of inventor citations. Implicitly, this
approach assumes that examiners have something to fill in or track because inventors disclose
some knowledge.
This may not be an issue in the US, where applicants are subject to ‘duty of candour’,
which forces them to be exhaustive in their inclusion of references to prior art (Meyer, 2000;
Michel & Bettels, 2001). However, it is important in Europe, since there is no imposition of
that kind on applicants, meaning that they are free to decide whether or not to include
references. For instance, Acosta & Coronado (2002) show that only 31% of Spanish patents
include applicant full-text patent-to-patent citations and 10% of Spanish patents include
applicant full-text patent-to-paper citations, i.e. a small number compared to front-page
citations, which appear in all patents. Similarly, Azagra et al. (2009) find that only 30% of

14
patents from the Valencian Community (a Spanish NUTS 2 region) includes at least one
applicant citation.
Thus, in the European case, it is worth studying whether examiners treat patents with and
without citations equally. If treatment is equal in that in both cases the examiner transposes a
standard body of references, then it is more difficult to uphold their objectivity. If treatment is
not equal, we would expect the distribution of examiner citations according to the
characteristics of the patent, to differ between patents with and without citations, because each
will be subject to a case-by-case search report. Let us assume this situation as a starting point:
Hypothesis 4. The distribution of examiner citations is different according to whether the
studied patents contain applicant citations or not.
The research context: the Valencian Community
The Valencian Community is described as having low absorptive capacity (Azagra, 2007).
The main features of the region are:
low-tech profile of its economic structure (predominance of microfirms in services
and traditional manufactures);
weak innovation activities (innovation is mostly incremental and in the form of
machinery and equipment acquisition, with low R&D expenditure);
scarcity of qualified personnel even in firms in the knowledge-intensive sectors;
policy emphasis on enhancing technology transfer (similar to high-tech regions or
countries).
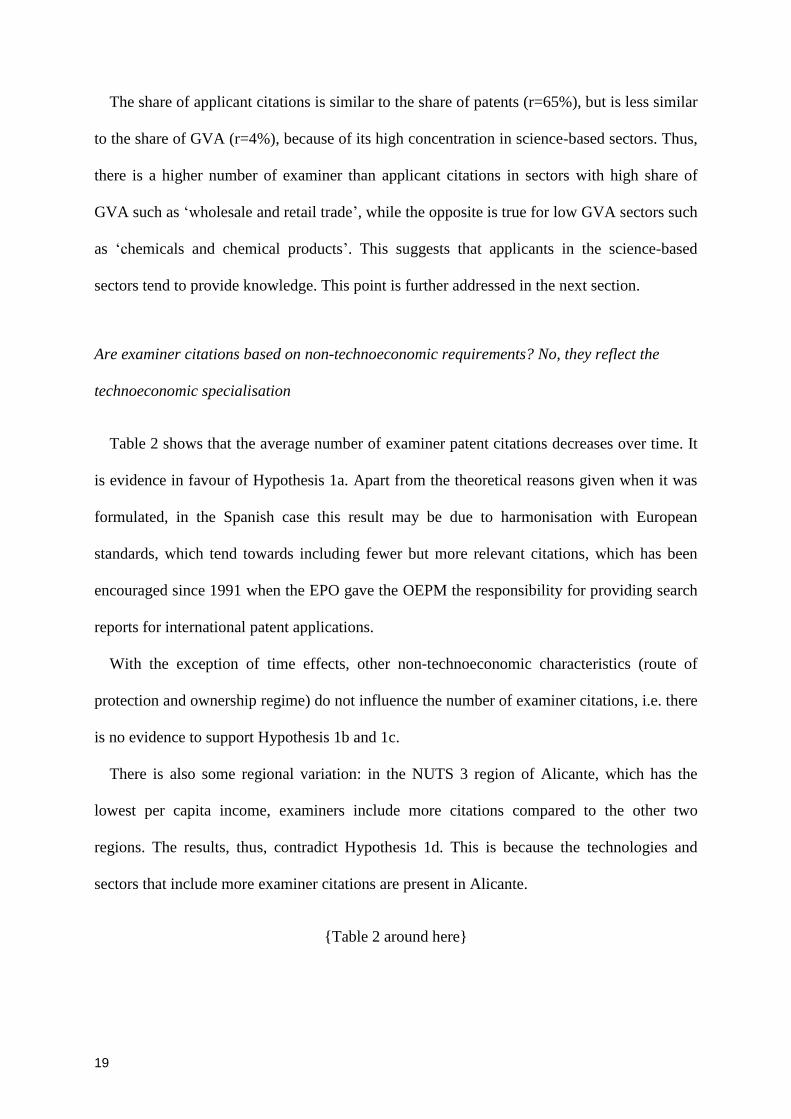
Table 1 provides a more detailed description of the industrial structure of the Valencian
Community.

15
{Table 1 around here}
The column presenting gross value added (GVA) shows the share of the average value of
this variable for 1999-2003 (for comparison with patents), in constant prices, by NACE
activity. The data are from the Spanish National Statistics Institute’s Regional Accounts. We
group economic branches following (and extending) the typologies proposed by Pavitt (1984)
and Breschi and Malerba (1997). The classification is arguable, but it is not the objective of
this paper to justify this.
Supplier-dominated sectors predominate, especially ‘construction’ and services such as
‘wholesale and retail trade’, ‘non-market services’ and ‘transport, storage and
communication’. Within production-intensive sectors, ‘manufacturing of other non-metallic
mineral products’ stands out because of the regional focus on producing ceramic tiles. The
contribution of science-based sectors is relatively small. The case of ‘real estate, renting and
business activities’ is rather special, since the high GVA weighting is due mainly to the
activities in the supplier-dominated sectors. However, because they include ‘computer and
related activities’ and ‘research and development’ we chose to classify them under science-
based sectors, which is relevant for the information in subsequent columns on patents and
patent citations. Next, we explain the methodology and data.
Methodology and data
The source of patent application information for the Valencian Community is the database
of the Spanish Patent and Trademark Office (OEPM), which allows us to select according to
‘province’. Three NUTS 3 regions were included in the analysis: Alicante, Castellon and
Valencia. We recovered patents from 1999 to 2003.6
6 OEPM regularly updates online data. The date of the extractions used in this paper is 23 June 2006.

16
We chose patents identified as patents owned by companies rather than including patents
from all performance sectors, to allow for some institutional homogeneity and a focus on
knowledge-industry interaction, and also because they represent the bulk of patenting activity
in the selected regions. The OEPM database includes information on name(s) of patent
applicant that was not straightforward and therefore their correspondence with firms had to
me manually confirmed. We found a total of 1,382 patents registered for the Valencian
Community between 1999 and 2003, and distinguished between firm and other types of
applicants, based on an the acronyms SL (limited society) and SA (anonymous society)
attached to the name.
Next, we constructed a database where citations for all patents owned by companies were
included. We studied the full-text of the patent application forms for every patent, especially
the description field where the applicant includes the prior art, and counted the numbers of
citations.7 The same exercise for citations in the prior art report (included by patent
examiners) was carried out. This resulted in 712 applicant citations and 2,849 examiner
citations, which we classified further according to the following characteristics:
year of application: from 1999 to 2003;
route of protection: there are three legal routes to protection of an invention in Spain
included in the OEPM database: national, European, and PCT. Because of the small
7 In the full-text of the application form, applicants provide descriptions of their inventions to demonstrate
their novelty, to describe them and to explain how they were made. Although most include a section on prior art,
it is not obligatory to include citations. Consequently, a patent with no citations does not mean there is no
involvement of prior art, but only that it is implicitly referred to.

17
number of patents that apply for EPO protection, we combined them with PCT
applications under the label ‘international applications’8
ownership: patents with only one applicant (no co-applicants) or with co-applicants
(another firm, a research centre, an innovation/technology centre or an individual).
NUTS 3 region: there are three regions in the Valencian Community –Alicante (with
the lowest per capita income), Castellon (with the highest per capita income) and
Valencia;
technology class: each of the eight sections at the first level of the International
Patent Classification (IPC) – manually assigned by examiners (Kang et al., 2007) –,
calculated through a fractional count.
We also attributed patents to economic sectors by linking them to the Analytical System on
Spanish Balance Sheets (SABE). This database, which includes economic data on Spanish
firms, includes a field for the Statistical Classification of Economic Activities (NACE),
revision 1.1. We were able to match 92% of the firm applicants in our sample to the firms
included in SABE and assigned to each of these patents the two-digit NACE activity code of
the applicant. This allowed us to construct the following variable:
economic sector: two-digit NACE activity of applicant firm, calculated with a
fractional count, which provides information included in the last three columns of
Table 1.
8 Note that PCT does not award patents: applications are subject only to international review and then filed at
national patent offices, i.e. PCT applications become national (or not, if they are abandoned).

18
For each variable, we calculate whether the difference between numbers of applicant and
examiner citations is significant, and whether there is a significant difference between
variable categories using ANOVA and the non-parametric Kruskal-Wallis ANOVA.
For the analysis, we divided the sample into sub-samples - with and without applicant
citations. The comparison between the full sample and the sub-sample with applicant citations
allows us to test some of our hypotheses. We assume that that applicants that disclose some
knowledge (i.e. include at least one applicant citation) have more knowledge than applicants
who do not disclose any knowledge (i.e. do not include any applicant citations). Although it is
beyond the scope of this study to verify this, we provide some evidence that this is a
reasonable assumption.
Results
There is generally not much relationship between total number of patents and GVA in
Table 1 (correlation coefficient r=17%). The exceptions are ‘wholesale and retail trade’ and
‘real estate, renting and business activities’, which have a high share of both patents and
GVA. Other large sectors, in terms of GVA (‘construction’, ‘non-market services’, ‘transport,
storage and communication’), do not have high shares of patents, while other active patenting
sectors do not show high shares of GVA (‘rubber and plastic products’, ‘machinery and
equipment n.e.c.’, ‘chemicals and chemical products’). This suggests that the technological
structure of the economy is determined by the type of sectoral innovation system rather than
by size of industry.
The knowledge base, as indicated by number of examiner citations, follows the number of
patents distribution (r=96%) but the relation to GVA is slightly closer (r=23%) –mainly due to
the central categories of both distributions.
19
The share of applicant citations is similar to the share of patents (r=65%), but is less similar
to the share of GVA (r=4%), because of its high concentration in science-based sectors. Thus,
there is a higher number of examiner than applicant citations in sectors with high share of
GVA such as ‘wholesale and retail trade’, while the opposite is true for low GVA sectors such
as ‘chemicals and chemical products’. This suggests that applicants in the science-based
sectors tend to provide knowledge. This point is further addressed in the next section.
Are examiner citations based on non-technoeconomic requirements? No, they reflect the
technoeconomic specialisation
Table 2 shows that the average number of examiner patent citations decreases over time. It
is evidence in favour of Hypothesis 1a. Apart from the theoretical reasons given when it was
formulated, in the Spanish case this result may be due to harmonisation with European
standards, which tend towards including fewer but more relevant citations, which has been
encouraged since 1991 when the EPO gave the OEPM the responsibility for providing search
reports for international patent applications.
With the exception of time effects, other non-technoeconomic characteristics (route of
protection and ownership regime) do not influence the number of examiner citations, i.e. there
is no evidence to support Hypothesis 1b and 1c.
There is also some regional variation: in the NUTS 3 region of Alicante, which has the
lowest per capita income, examiners include more citations compared to the other two
regions. The results, thus, contradict Hypothesis 1d. This is because the technologies and
sectors that include more examiner citations are present in Alicante.
{Table 2 around here}

20
Technological variation is also present and deserves some comment. On the one hand, the
number of examiner citations is low in more science-based technologies such as C.
Chemistry; Metallurgy, G. Physics and H. Electricity. The category F. Mechanical
Engineering does not stand out either. On the other hand, some less science-based categories
have high numbers of average citations: A. Human Necessities, D. Textiles; Paper, B.
Performing Operations and E. Fixed Constructions. The results go against Hypothesis 1e. An
interpretation about what could potentially be at the base of this result is that examiners
include more citations in technologies where GVA is high (according to Table 1:
‘construction’, ‘other non-metallic mineral products’, ‘agriculture, hunting and forestry’,
‘textiles’, ‘food products, beverages and tobacco’, etc.) and less citations in technologies in
science-based sectors where GVA is low.
Table 3, by economic sector, shows that there is significant variation and, that, although
differences across categories are not as clear-cut as in the case of technology classes, science-
based sectors do not present many more examiner citations per patent than other sectors.
Hence, there is no evidence in favour of Hypothesis 1f. Once again, the regional context is
more important than what the theory predicts.
{Table 3 around here}
Overall, Hypothesis 1 is supported: examiner citations vary according to some patent
characteristics. The pattern of this variation is interesting: (i) except for time effects, non-
technoeconomic reasons do not seem to influence the number of examiner citations; (ii) less
science-intensive technologies have fewer examiner citations, and for economic sectors, the
opposite is not true. Hence, examiners are paying attention to the technoeconomic structure of
the economy.

21
Do examiners track applicants? No, they fill the gap according to characteristic such as
region, technology class and economic sector
If we take single patents as the unit of observation, the correlation coefficient between
number of applicants and examiner added citations is close to zero. This is also true when
only patents where applicants include at least one citation are studied. That is, there is no
relation between the numbers of citations included by the two parties. This means that
Hypothesis 2 is not supported. To dig deeper into the source of differences among patents
grouped by patent characteristics, we focus on applicant citations (fifth column in Table 2).
In terms of patent characteristics, we find that the pattern of applicant citations is different
from that of examiner citations. On the one hand, the average number of citations over time
does not decrease significantly. i.e. the evidence does not support Hypothesis 2.a. On the
other hand, applicants tend to include more citations if the patent application is international
and has co-applicants, i.e. the evidence is in favour of Hypothesis 2.b and 2.c.
In terms of technoeconomic characteristics, applicant citations and examiner citations are
similar in that technological and economic heterogeneity and more especially regional
variation are significant. However, the sources of variation are very dissimilar between
examiners and applicants.
Castellon, the region with the highest per capita income (and smallest numbers of examiner
citations), has the highest numbers of applicant citations. This evidence supports Hypothesis
2d. The region with the largest numbers of examiner citations, Alicante, ranks second for
applicant citations. Thus, from the regional distribution of citations, we can say that
examiners fill applicants’ gaps rather than track applicant citations (using the same terms of
Alcácer and Gittelman, 2006).
In the case of technologies, there are statistically significant differences within classes (p
value=0.00). The largest differences between examiner and applicant citations are in less

22
science-based technologies, where numbers of applicant citations are much lower compared
to examiners’ (D. Textiles; Paper, B. Performing Operations; Transporting and A. Human
Necessities). The smallest differences are in some more science-based technologies (clear in
the case of C. Chemistry; Metallurgy). Given this evidence in favour of Hypothesis 2.e,
examiners largely counterweight the concentration of applicant citations in a few
technologies.
This is even clearer in the case of economic sectors (Table 3). Here, we can see significant
differences between examiner and applicant added citations in almost all categories. In the
supplier-dominated and production-intensive sectors, examiners cite more when applicants
cite less, e.g. in Other supplier-dominated sectors, Manufacture of machinery and equipment
n.e.c. and Manufacture of wood, paper, publishing, media. This inverse relation appears also
in Manufacture of chemicals and chemical products, where most applicant citations are
concentrated, and numbers of examiner citations are small. However, there are exceptions,
such as Manufacture of electrical machinery and equipment n.e.c., a science-base sector with
large differences between examiner and applicant citations. Overall, the evidence supports
Hypothesis 2.f.
These differences would seem to be the source of a negative correlation between applicant
and examiner citations that would contradict Hypothesis 2. However, other effects
predominate and for this reason, the coefficient of correlation is close to zero: the large
number of patents without applicant citations that have many different numbers of examiner
citations; and the smoother distribution of examiner citations than that of applicant citations.
Overall, the evidence does not support Hypothesis 2.
Note that the p value of the Kruskal-Wallis ANOVA is always significant because
examiners always include many more citations than applicants – this is logical since the

23
sample includes patents with no applicant citations. In the next section, we show the
differences between patents with and without applicant citations.
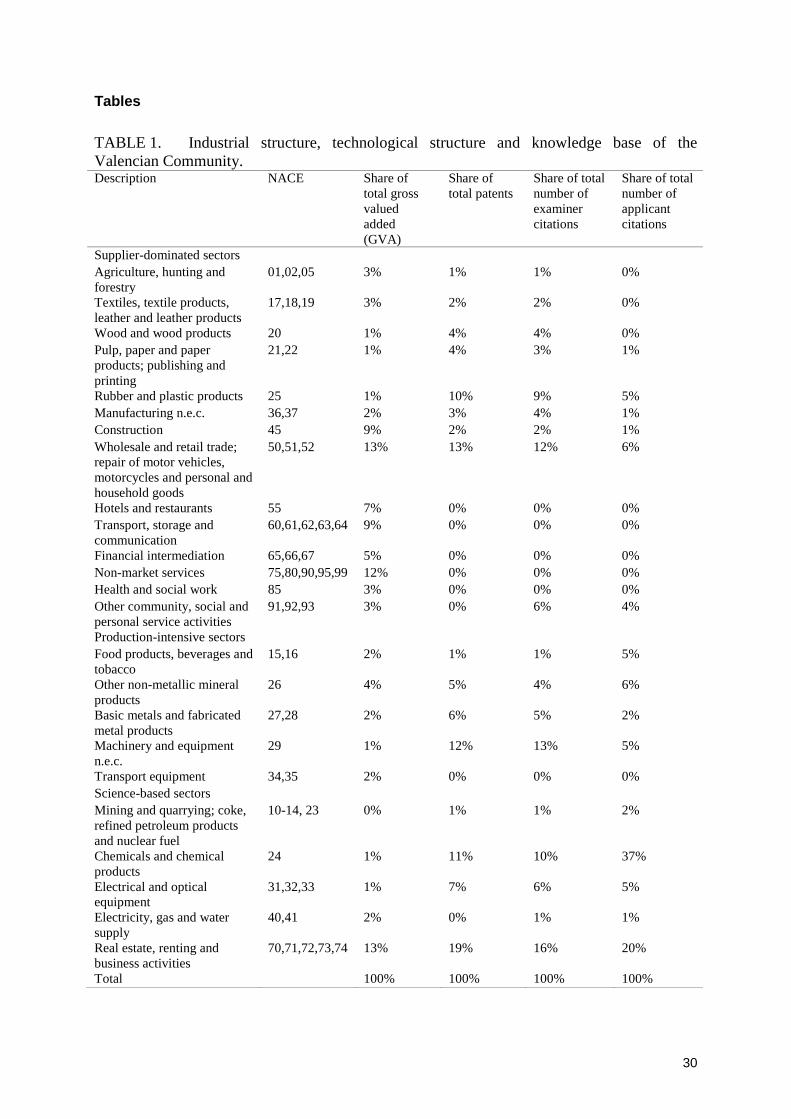
Are patents where applicants disclose some knowledge representative of all patents? No
The probability that a patent includes applicant citations (Table 4) is increasing in time, it is
higher for international patents (rather than national ones), for co-applications (rather than
single applications), for patents in C. Chemistry; Metallurgy (rather than in other technology
classes) and (Table 5) in Manufacture of chemicals and chemical products (rather than in
other economic sectors) 9
.
{Tables 4 and 5 around here}
This different distribution of patents with and without citations across patent characteristics
has consequences on the properties of the average number of applicant citations. We have
already seen that for all patents, the number of applicant citations (Table 2) is stable over
time, but increases for international applications and applications with more than one
applicant. The last columns of Table 4 shows that, in the sub-sample of patents with at least
one applicant citation, the number of applicant citations significantly decreases, and does not
vary based on route of protection or a positive number of co-applicants.
This does not support Hypothesis 3. The emergent statistics on applicant citations are
biased, because applicants inflate the number of citations for reasons such as route of
protection and ownership regime.
9 Tables from now onwards exclude technology classes and economic classes with fewer than 10 patents.

24
Do examiners behave differently if applicants include citations to disclose knowledge? No,
they behave similarly
Table 6 presents the results for the breakdown of examiner citations according to whether
patents have at least one applicant citation.
{Table 6 around here}
We can see that examiners in both sets of patents tend to include fewer citations over time,
as in Table 2, and that there is no significant variation between routes of protection or
ownership regime; patents from Alicante include again more examiner citations, similar to the
numbers in less science-based technologies and (Table 7) supplier dominated sectors. This
mirrors the position of examiner citations for the overall sample.
{Table 7 around here}
The findings indicate that examiners behave similarly regardless of whether or not
applicants include citations, which does not support Hypothesis 4.
An unforeseen side result –a fixed number of examiner citations
The above results suggest that examiners merely replicate bodies of knowledge from patent
to patent, ignoring the citations included by applicants. To verify this, we matched pairs of
common examiner citations in different patents but did not find huge correspondence (less
than 30%). However, the number of examiner citations in these patents was often the same.
Therefore, it seems that examiners tend to add a ‘fixed’ number of citations, although these
citations may be different. This contradicts the claim of replication of bodies of knowledge,
but implies the existence of a standard practice in terms of number of citations. This result
deserves further research.

25
Conclusions
The results in this paper suggest that it would be premature to defend the use of examiner
citations in patents to justify research funding or evaluate performance. Our results also do
not support the hypothesis that applicant citations are better sources of information. We
develop these ideas in the next paragraphs.
The number of examiner added citations is dependent on the technoeconomic structure of
the territory. If the local industry has very few leading and patenting sectors, there will be
fewer examiner citations. For other sectors, even though the knowledge base exists, examiner
patent citations will not indicate so. Therefore, studies using examiner citations should
consider the technoeconomic structure. Examiner citations may be representative of the
knowledge base where there is strong industrial specialisation in highly patenting or leading
sectors but require complementary analysis in every other case.
This paper looked at full-text applicant citations, which highlighted some practices of
patent examiners related to adding citations, namely to include more (less) references than
applicants, in patents where the technology classes and economic sectors rely less (more) on
the science base. The result is a more homogeneous distribution of citations that masks the
scarce importance of codified knowledge for traditional economic activities.
However, we also show that using applicant citations creates problems, since applicants
may add a large number of (hardly justified) citations in some patents (especially patents that
are international and include co-applicants). One limitation of our research is that we cannot
claim whether examiner citations are better than applicant citations or the other way round.
We just highlight that applicant citations may not be the solution to the problems detected by
earlier literature on examiner citations. Comparison of both measures with a third one to
discriminate the best one could be a line of future research.

26
Overall, this makes a case for increasing resource allocation to patent examiners’ to allow
for more detailed search reports, which would most likely increase the incentives for
applicants’ to disclose information to the EPO and the World Intellectual Property
Organization (WIPO). More resources could also translate into, better legal standards for
storing information and thus make it possible to analyse full-text applicant citations, which
would be a benefit for examining knowledge flows. A limitation of our work is that we do not
have data on USPTO patents, which would also be interesting.
Many of the explanations for parts of the evidence from this study are related to the conduct
of examiners and applicants. Interviews would be useful to check the consistency of
explanations. Ongoing work suggests that patent examiners’ personal characteristics also
determine the inclusion of citations (Lemley & Sampat, 2008). A limitation of our work is
that we cannot control for these personal characteristics.
To what extent these results are idiosyncratic of the sample we analysed, which is based on
a region with low absorptive capacity, is questionable. This is further examined in an earlier
study (Azagra et al., 2009). Here, we want to stress that, although some of our findings may
be idiosyncratic, the importance of the hypotheses and their methodological implications
should guide the future debate on using patent citations as indicators of knowledge flow. One
way to continuing this discussion would be to replicate the analysis with a large number of
regions.
Acknowledgements
Our gratitude to the Valencian R&D Consultancy Council for funding the data gathering on
which the study relies. The academic exploitation and analysis has taken place under the
framework of ERAWATCH, a joint initiative of the European Commission’s Directorate
General for Research and the Joint Research Centre – IPTS. Thanks are due to René van

27
Bavel and Xabier Goenaga for their support; to Puay Tang for a substantial revision of an
early draft of the paper; to Ignacio Fernández de Lucio for exchanging ideas; to Liney
Manjarrés for database matching; and to Raquel Ortega Argilés for her advice on statistics.
References
Acosta, M. & Coronado, D. (2002). Las relaciones ciencia-tecnología en España. Evidencias a partir de las citas
científicas en patentes. Economía Industrial, 346, 27-46.
Acosta, M. & Coronado, D. (2003). Science-technology flows in Spanish regions. An analysis of scientific
citations in patents. Research Policy, 32, 1783-1803.
Alcácer, J. & Gittelman, M. (2006). Patent citations as a measurement of knowledge flows: The influence of
examiner citations. Review of Economics and Statistics, 88(4), 774-779.
Allison, J.R. & Sager, T.W. (2007). Valuable Patents Redux: On the Enduring Merit of Using Patent
Characteristics to Identify Valuable Patents. Texas Law Review, 85, 1769-1797.
Azagra-Caro, J.M., 2007. What type of faculty member interacts with what type of firm? Some reasons for the
delocalisation of university-industry interaction. Technovation, 27, 704-715
Azagra-Caro, J.M., Archontakis, F., Gutiérrez-Gracia, A. & Fernández-de-Lucio, I. (2006a). Faculty support for
the objectives of university-industry relations versus degree of R&D cooperation: the importance of regional
absorptive capacity. Research Policy 35(1), 37 – 55.
Azagra-Caro, J.M., Fernández de Lucio, I., Perruchas, F. & Mattsson, P. (2009). What do patent examiner
inserted citations indicate for a region with low absorptive capacity? Scientometrics, 80(2), 441–455.
Azagra-Caro, J.M., Yegros-Yegros, A. & Archontakis, F. (2006b). What do university patent routes indicate at
regional level? Scientometrics, 66(1), 219-230.
Breschi, S. & Malerba, F. (1997). Sectoral Innovation Systems: Technological Regimes, Schumpeterian
Dynamics, and Spatial Boundaries, C. Edquist (ed.): Systems of Innovation: Technologies, Institutions and
Organizations, ch. 6. London and Washington: Pinter.
Callaert, J., van Looy, B., Verbeek, A., Debackere, K. & Thus, B. (2006). Traces of Prior Art: An analysis of
non-patent references found in patent documents. Scientometrics, 69(1), 3-20.
Chen, C. (2003). Book Review: Patents, Citations & Innovations: A Window on the Knowledge Economy.
Journal of the American Society for Information Science and Technology, 54(8), 802–803.

28
Cohen, W. M. & Levinthal, D. A. (1990). Absorptive Capacity: a new Perspective on Learning and Innovation.
Administrative Science Quarterly 35(1), 128-152.
Criscuolo, P. (2006). The ‘home advantage’ effect and patent families. A comparison of OECD triadic patents,
the USPTO and the EPO. Scientometrics, 66(1), 23–41.
Criscuolo, P. & Verspagen, B. (2008). Does it matter where patent citations come from? Inventor vs. examiner
citations in European patents. Research Policy, 37, 1892-1908.
EC (2007). Commission Green Paper ‘The European Research Area: New Perspectives’. COM(2007), 161.
Guan, J.C. & Gao, X. (2009). Exploring the h-Index at Patent Level. Journal of the American Society for
Information Science and Technology, 60 (1), 35-40.
Hassan, E. (2003). Simultaneous Mapping of Interactions between Scientific and Technological Knowledge
Bases: The Case of Space Communications. Journal of the American Society for Information Science and
Technology, 54(5), 462-468.
Jaffe, A. & Trajtenberg, M. (1996). Flows of knowledge from universities and federal laboratories: Modeling the
flow of patent citations over time and across institutional and geographic boundaries. PNAS, 93, 12671-
12677.
Jaffe, A., Trajtenberg, M. & Fogarty, M.S. (2000). The meaning of patent citation: Report on the NBER/Case-
Western reserve survey of patentees. NBER Working Paper, 7631.
Kang, I.S, Na, S.H., Kim, J. & Lee, J.H. (2007). Cluster-based patent retrieval. Information Processing &
Management, 43(5), 1173-1182.
Kostoff, R.N. (1994). Federal Research Impact Assessment: State-of-the-Art. Journal of the American Society
for Information Science and Technology, 45(6), 428-440.
Lai, K.K. & Wu, S.J. (2005). Using the patent co-citation approach to establish a new patent classification
system. Information Processing and Management, 41, 313–330.
Lemley, M. & Sampat, B.N. (2008). Examiner Characteristics and the Patent Grant Rate, mimeo:
http://www.nber.org/~confer/2008/si2008/IPPI/lemley.pdf, last access: 13/01/2009.
Leydesdorff, L. (2004). The University–Industry Knowledge Relationship: Analyzing Patents and the Science
Base of Technologies. Journal of the American Society for Information Science and Technology, 55(11),
991-1001.
Leydesdorff, L. (2008). Patent Classifications as Indicators of Intellectual Organization. Journal of the American
Society for Information Science and Technology, 59(10), 1582-1597.

29
Merrill, S.A., R.C. Levin & M.B. Myers (eds) (2004). A Patent System for the 21st Century. Washington, DC:
The National Academies Press.
Meyer, M. (2000). What is special about patent citations? Differences between scientific and patent citations.
Scientometrics, 49(1), 93-123.
Meyer-Krahmer, F. & U. Schmoch (1998). Science-based technologies: university-industry interactions in four
fields. Research Policy, 27, 835–851.
Michel, J. & Bettels, B. (2001). Patent citations analysis: A closer look at the basic input data from patent search
reports. Scientometrics, 51(1), 185-201.
Narin, F. & Noma, E. (1985). Is technology becoming science? Scientometrics, 7(3-6), 369-381.
Niosi, J. & Bellon, B. (2002). The Absorptive Capacity of Regions. Colloque Economie Méditerranée Monde
Arabe. Sousse 20-21 September.
Noma, E. & Olivastro, D. (1984). Are there enduring patents? Journal of the American Society for Information
Science and Technology, 36(5), 297 – 301.
Oppenheim, C. (2000). Do patent citations count? In B. Cronin & H.B. Atkins (eds.), The Web of Knowledge: A
Festschrift in Honor of Eugene Garfield (p. 405-435). Medford. N.Y: Information Today Inc.
Pavitt, K. (1984). Sectoral patterns of technical change: Towards a taxonomy and a theory. Research Policy 13,
343-373.
Sampat, B. (2004). Examining Patent Examination: An Analysis of Examiner and Applicant Generated Prior
Art, Working Paper, School of Public Policy, Georgia Institute of Technology.
Stock, M. & Stock, W.G. (2006). Intellectual Property Information: A Comparative Analysis of Main
Information Providers. Journal of the American Society for Information Science and Technology, 57(13),
1794-1803.
Tijssen, R.J.W. (2001). Global and domestic utilization of industrial relevant science: patent citation analysis of
science–technology interactions and knowledge flows. Research Policy, 30, 35–54.
Thompson, P. (2006). Patent citations and the geography of knowledge spillovers: Evidence from inventor- and
examiner-added citations. Review of Economics and Statistics, 88(2), 383-388.
30
Tables
TABLE 1. Industrial structure, technological structure and knowledge base of the
Valencian Community. Description NACE Share of
total gross
valued
added
(GVA)
Share of
total patents
Share of total
number of
examiner
citations
Share of total
number of
applicant
citations
Supplier-dominated sectors
Agriculture, hunting and
forestry
01,02,05 3% 1% 1% 0%
Textiles, textile products,
leather and leather products
17,18,19 3% 2% 2% 0%
Wood and wood products 20 1% 4% 4% 0%
Pulp, paper and paper
products; publishing and
printing
21,22 1% 4% 3% 1%
Rubber and plastic products 25 1% 10% 9% 5%
Manufacturing n.e.c. 36,37 2% 3% 4% 1%
Construction 45 9% 2% 2% 1%
Wholesale and retail trade;
repair of motor vehicles,
motorcycles and personal and
household goods
50,51,52 13% 13% 12% 6%
Hotels and restaurants 55 7% 0% 0% 0%
Transport, storage and
communication
60,61,62,63,64 9% 0% 0% 0%
Financial intermediation 65,66,67 5% 0% 0% 0%
Non-market services 75,80,90,95,99 12% 0% 0% 0%
Health and social work 85 3% 0% 0% 0%
Other community, social and
personal service activities
91,92,93 3% 0% 6% 4%
Production-intensive sectors
Food products, beverages and
tobacco
15,16 2% 1% 1% 5%
Other non-metallic mineral
products
26 4% 5% 4% 6%
Basic metals and fabricated
metal products
27,28 2% 6% 5% 2%
Machinery and equipment
n.e.c.
29 1% 12% 13% 5%
Transport equipment 34,35 2% 0% 0% 0%
Science-based sectors
Mining and quarrying; coke,
refined petroleum products
and nuclear fuel
10-14, 23 0% 1% 1% 2%
Chemicals and chemical
products
24 1% 11% 10% 37%
Electrical and optical
equipment
31,32,33 1% 7% 6% 5%
Electricity, gas and water
supply
40,41 2% 0% 1% 1%
Real estate, renting and
business activities
70,71,72,73,74 13% 19% 16% 20%
Total 100% 100% 100% 100%

31
TABLE 2. Frequency of citations in patents from the Valencian Community with firm applicants – full sample. Variable Category Nº of
patents
Average number of
examiner citations (mode; frequency of mode)
Average number of
applicant citations (mode; frequency of mode)
Kruskal-Wallis ANOVA
Mean squares
F value p value
Year of
application
1999 86 5.87 (5; 23%) 1.26 (0; 81%) 916.33 88.61 0.00**
2000 114 4.82 (4; 25%) 1.82 (0; 72%) 510.00 40.36 0.00**
2001 129 4.64 (4; 24%) 0.95 (0; 74%) 874.52 161.57 0.00**
2002 133 4.71 (3 and 4; 21%) 1.05 (0: 65%) 887.96 209.64 0.00**
2003 109 4.40 (4; 24%) 0.83 (0; 69%) 697.71 194.73 0.00**
ANOVA Mean squares
F value
p value
30.03
7.53
0.00**
17.57
1.76
0.13
Route of
protection
National 459 4.81 (4; 24%) 1.02 (0; 74%) 2094.98 332.16 0.00**
International 112 4.91 (5; 22%) 1.81 (0; 63%) 537.54 45.00 0.00**
ANOVA Mean squares
F value
p value
0.91
0.22
0.64
57.225
5.77
0.02*
Ownership No co-applicants 545 4.80 (4; 22%) 1.10 (0; 73%) 1525.03 184.66 0.00**
With co-applicants 26 5.38 (4; 27%) 2.62 (0; 46%) 99.69 7.74 0.01*
ANOVA Mean squares F value
p value
8.38 2.01
0.16
56.781 5.72
0.02*
NUTS 3 region Alicante (1) 148 5.32 (4; 21%) 1.53 (0; 70%) 1059.46 94.36 0.00**
Castellon (2) 99 4.65 (5; 25%) 1.81 (0; 66%) 398.79 38.58 0.00**
Valencia (3) 324 4.66 (4; 23%) 0.81 (0; 74%) 2403.56 595.85 0.00**
ANOVA ratio (3)/(1) Mean squares
F value
p value
43.45
10.67
0.00**
52.97
6.24
0.01*
ANOVA ratio (3)/(2) Mean squares
F value
p value
4.46
0.26
0.61
26.72
5.90
0.02*
Technology
class (IPC
section)
A. Human Necessities 152 4.48 (3; 17%) 1.18 (0; 72%) 99.07 119.17 0.00**
B. Performing Operations; Transporting 160 4.06 (3; 18%) 0.55 (0; 83%) 1002.14 126.87 0.00**
C. Chemistry; Metallurgy 52 3.16 (3; 24%) 2.41 (0; 54%) 554.32 122.64 0.00**
D. Textiles; Paper 18 4.24 (4; 21%) 0.43 (0; 75%) 300.00 47.92 0.00**
E. Fixed Constructions 74 4.02 (4; 19%) 1.26 (0; 67%) 728.00 148.21 0.00**
F. Mechanical Engineering; Lighting; Heating; Weapons; Blasting 32 3.27 (2 and 3; 18%) 0.19 (0; 87%) 395.50 86.30 0.00**
G. Physics 25 3.20 (3; 24%) 0.17 (0; 82%) 315.44 64.11 0.00**
H. Electricity 59 3.48 (4; 22%) 0.82 (0; 61%) 677.63 153.16 0.00**
ANOVA Mean squares
F value p value
14.79
3.68 0.00**
44.97
4.97 0.00**
** Significant at 1%. * Significant at 5%

32
TABLE 3. Frequency of citations in patents from the Valencian Community with firm applicants – sample of firms assigned to economic
sectors. Variable Category Nº of
patents
Average number of
examiner citations
(mode; frequency
of mode)
Average number of
applicant citations
(mode; frequency
of mode)
Kruskal-Wallis ANOVA
Mean
squares
F value p value
Supplier-
dominated
sectors
Manufacture of wood, paper, publishing, media (NACE 20, 21, 22) 44 4.80 (4; 29%) 0.16 (0; 86%) 472.91 353.51 0.00**
Manufacture of rubber and plastic products (NACE 25) 52 5.06 (5; 21%) 0.69 (0; 71%) 504.24 186.62 0.00**
Trade, maintenance and repair (NACE 50, 51, 52) 70 4.33 (4; 27%) 0.38 (0; 78%) 649.32 198.54 0.00**
Other business activities (NACE 70, 71, 74) 83 4.23 (4; 23%) 1.24 (0; 59%) 382.55 57.15 0.00**
Other supplier-dominated sectors (NACE 01, 17, 18, 19, 36, 45, 63,
85)
41 5.40 (4; 28%) 0.28 (0; 79%) 565.35 205.97 0.00**
Production-
intensive
sectors
Manufacture of other non-metallic mineral products (NACE 26) 27 4.22 (3 and 4; 21%) 1.29 (0; 75%) 120.81 17.88 0.00**
Manufacture of fabricated metal products, except machinery and
equipment (NACE 28)
30 4.60 (4; 23%) 0.53 (0; 80%) 248.07 79.64 0.00**
Manufacture of machinery and equipment n.e.c. (NACE 29) 66 5.05 (5; 22%) 0.35 (0; 81%) 751.77 337.67 0.00**
Other production-intensive sectors (NACE 15, 33, 34) 26 4.62 (4; 19%) 1.88 (0; 62%) 96.94 7.66 0.01*
Science-
based
sectors
Manufacture of chemicals and chemical products (NACE 24) 58 4.69 (5 and 3; 22%) 4.47 (0; 38%) 1.46 0.07 0.80
Manufacture of electrical machinery and equipment n.e.c. (NACE 31) 10 4.50 (4; 30%) 0.20 (0; 90%) 92.45 55.29 0.00**
R&D and computer activities (NACE 72, 73) 19 5.47 (5; 26%) 2.00 (0; 74%) 114.63 11.31 0.00**
Other science-based sectors (NACE 14, 23, 32, 40) 15 4.57 (4; 29%) 1.74 (0; 65%) 68.47 8.26 0.01*
ANOVA Mean squares
F value
p value
108.63
2.22
0.01**
890.90
8.57
0.00**
** Significant at 1%. * Significant at 5%

33
TABLE 4. Number of patents from the Valencian Community with firm applicants by having or not applicant citations – full sample. Variable Category Patents with applicant citations Patents without applicant citations
Nº % Nº % Average number of applicant citations (mode; frequency of mode)
Year of
application
1999 16 10% 70 17% 6.75 (3; 31%)
2000 32 20% 82 20% 6.50 (1; 22%)
2001 34 21% 95 23% 3.62 (1; 35%)
2002 46 28% 87 21% 3.04 (1; 33%)
2003 34 21% 75 18% 2.65 (1; 44%)
ANOVA Mean squares
F value
p value
106.57
5.08
0.00**
Route of
protection
National 120 74% 339 83% 3.88 (1; 34%)
International 42 26% 70 17% 4.83 (1; 26%)
ANOVA Mean squares
F value
p value
28.08
1.21
0.27
Ownership No co-applicants 148 91% 397 97% 4.06 (1; 32%)
With co-applicants 14 9% 12 3% 4.86 (1; 29%)
ANOVA Mean squares
F value
p value
8.11
0.35
0.56
NUTS 3
region
Alicante (1) 45 28% 103 25% 5.04 (2; 31%)
Castellon (2) 34 21% 65 16% 5.26 (1; 32%)
Valencia (3) 83 51% 241 59% 3.17 (1; 36%)
ANOVA ratio (3)/(1) Mean squares
F value
p value
102.67
5.02
0.03**
ANOVA ratio (3)/(2) Mean squares
F value
p value
105.97
6.93
0.01**
Technology
class (IPC
section)
A. Human Necessities 42 28% 110 32% 4.34 (1; 27%)
B. Performing Operations;
Transporting
37 25% 123 35% 2.18 (1; 33%)
C. Chemistry; Metallurgy 25 17% 27 8% 5.29 (1; 23% )
E. Fixed Constructions 23 15% 51 15% 3.82 (2; 23%)
H. Electricity 23 15% 36 10% 2.16 (1; 35%)
ANOVA Mean squares
F value
p value
67.03
3.49
0.00**
** Significant at 1%. * Significant at 5%
34
TABLE 5. Number of patents from the Valencian Community with firm applicants by having or not applicant citations – sample of patents
with firms assigned to economic sectors. Variable Category Patents with
applicant citations
Patents without applicant citations
Nº % Nº % Average number of applicant citations (mode;
frequency of mode)
Supplier-
dominated sectors
Manufacture of rubber and plastic products (NACE
25)
15 13% 37 16% 2.40 (1 or 2; 33%)
Trade, maintenance and repair (NACE 50, 51, 52) 14 12% 56 24% 1.74 (1; 44%)
Other business activities (NACE 70, 71, 74) 34 28% 49 21% 3.03 (2; 35%)
Production-
intensive sectors
Manufacture of machinery and equipment n.e.c.
(NACE 29)
11 9% 55 23% 1.83 (1; 38%)
Other production-intensive sectors (NACE 15, 33, 34) 10 8% 16 7% 4.90 (3; 40%)
Science-based
sectors
Manufacture of chemicals and chemical products
(NACE 24)
36 30% 22 9% 7.19 (1; 19%)
ANOVA Mean squares
F value
p value
117.88
5.64
0.00**
** Significant at 1%. * Significant at 5%

35
TABLE 6. Frequency of examiner citations in patents from the Valencian Community with firm applicants by having or not applicant
citations – full sample. Variable Category Average number of examiner
citations in patents with
applicant citations (mode;
frequency of mode)
Average number of examiner
citations in patents without
applicant citations (mode;
frequency of mode)
Kruskal-Wallis ANOVA
Mean
squares
F value p value
Year of application 1999 6.00 (5; 31%) 5.84 (5; 16%) 2.06 0.50 0.48
2000 5.03 (4; 34%) 4.74 (5; 24%) 0.32 0.06 0.81
2001 4.56 (5; 23%) 4.67 (4; 25%) 0.27 0.07 0.78
2002 4.72 (3; 24%) 4.70 (4; 23%) 0.01 0.00 0.96
2003 4.18 (4; 38%) 4.50 (4; 17%) 2.55 0.78 0.38
ANOVA Mean squares
F value
p value
9.99
2.49
0.04*
2.05
5.24
0.00**
Route of protection National 4.68 (3; 22%) 4.86 (4; 25%) 2.63 0.67 0.41
International 4.98 (4; 33%) 4.87 (5; 26%) 0.29 0.05 0.81
ANOVA Mean squares
F value
p value
2.67
0.64
0.42
1.01
0.00
0.95
Ownership No co-applicants 4.64 (4; 24%) 4.86 (5; 18%) 5.32 1.33 0.25
With co-applicants 6.00 (4; 29%) 4.66 (4; 25%) 11.49 1.49 0.23
ANOVA Mean squares
F value
p value
23.59
5.84
0.02*
0.45
0.11
0.74
NUTS 3 region Alicante (1) 5.18 (4 and 6; 22%) 5.38 (5; 13%) 1.26 0.27 0.61
Castellon (2) 5.06 (4 and 5; 26%) 4.44 (4; 23%) 8.80 2.10 0.15
Valencia (3) 4.41 (4; 25%) 4.75 (5; 18%) 7.20 1.91 0.17
ANOVA ratio (3)/(1) Mean squares
F value
p value
0.27
0.06
0.80
35.80
7.74
0.00**
ANOVA ratio (3)/(2) Mean squares
F value
p value
10.16
2.19
0.14
5.25
1.47
0.23
Technology class
(IPC section)
A. Human Necessities 4.52 (4; 17%) 4.46 (4; 37%) 4.81 0.02 0.88
B. Performing Operations; Transporting 3.58 (3;31%) 4.20 (4; 17%) 15.07 3.11 0.08
C. Chemistry; Metallurgy 3.49 (3; 20% ) 2.85 (3; 28%) 6.00 2.53 0.12
E. Fixed Constructions 4.20 (4; 23%) 3.94 (4; 16%) 1.49 0.46 0.49
H. Electricity 3.25 (4; 31%) 3.63 (3; 17%) 2.15 0.66 0.42
ANOVA Mean squares
F value
p value
10.42
2.90
0.02*
20.74
4.77
0.00**
** Significant at 1%. * Significant at 5%

36
TABLE 7. Frequency of examiner citations in patents from the Valencian Community with firm applicants by having or not applicant
citations – sample of patents with firms assigned to economic sectors.
** Significant at 1%. * Significant at 5%
Variable Category Average number of
examiner citations in
patents with applicant
citations (mode;
frequency of mode)
Average number of
examiner citations in
patents without applicant
citations (mode;
frequency of mode)
Kruskal-Wallis ANOVA
Mean squares F value p-value
Supplier-
dominated
sectors
Manufacture of rubber and plastic products
(NACE 25)
5.13 (5; 27%) 5.03 (5; 19%) 0.12 0.03 0.85
Trade, maintenance and repair (NACE 50, 51,
52)
4.66 (4; 37%) 4.23 (4; 24%) 2.30 0.87 0.35
Other business activities (NACE 70, 71, 74) 3.79 (4; 26%) 4.54 (4; 20%) 13.43 2.67 0.11
Production-
intensive
sectors
Manufacture of machinery and equipment
n.e.c. (NACE 29)
4.04 (4 and 5; 23%) 5.30 (5; 22%) 16.32 4.62 0.03*
Other production-intensive sectors (NACE 15,
33, 34)
4.50 (4; 30%) 4.70 (4; 12%) 0.22 0.05 0.82
Science-based
sectors
Manufacture of chemicals and chemical
products (NACE 24)
4.69 (4; 28%) 4.68 (3; 27%) 0.00 0.00 0.98
ANOVA Mean squares
F value
p value
MS=5.30
F=1.65
p=0.15
MS=7.11
F=1.57
p=0.17