Smoke and Safety in case of fire - Nexans · F. Gyppaz – Nexans Research Center – Lyon France -...
15
F. Gyppaz – Nexans Research Center – Lyon France - +33 4 37 37 47 47 Page 1/15 2014/03 Smoke and Safety in case of fire Franck GYPPAZ Nexans Research Center [email protected] March 2014
Transcript of Smoke and Safety in case of fire - Nexans · F. Gyppaz – Nexans Research Center – Lyon France -...

F. Gyppaz – Nexans Research Center – Lyon France - +33 4 37 37 47 47
Page 1/15
2014/03
Smoke and Safety in case of fire
Franck GYPPAZ Nexans Research Center
March 2014

F. Gyppaz – Nexans Research Center – Lyon France - +33 4 37 37 47 47
Page 2/15
2014/03
Table of content 1 Introduction .......................................................................................................... 3
2 From Polymer to Smoke ...................................................................................... 3
3 Smoke release assessment ................................................................................ 4
3.1 Transmittance ................................................................................................ 4
3.2 Optical density ............................................................................................... 4
3.3 Extinction coefficient (K) ................................................................................ 5
3.4 Test methods to assess the smoke production potential on cables ............... 5
3.4.1 IEC/EN 61034-1 and -2 standards .......................................................... 5
3.4.2 EN 50399 standard ................................................................................. 5
3.4.3 Others ..................................................................................................... 7
4 Visibility modeling ................................................................................................ 8
5 Influence of longitudinal air velocity on smoke stratification .............................. 12
6 Conclusion ......................................................................................................... 14

F. Gyppaz – Nexans Research Center – Lyon France - +33 4 37 37 47 47
Page 3/15
2014/03
1 Introduction
The ISO13571 standard states that “when evaluating the consequence to human life, the crucial criterion for life safety in fires is that the time available for escape be greater than the time required for escape.” Visual obscuration due to smoke release during a fire is one of the main parameters having a negative effect on the time allowed for escape: the higher the smoke production, the lower the time available. This White Paper aims to introduce the effects of smoke release on visibility, and finally, on safety.
2 From Polymer to Smoke
In the first stages of a fire, polymers are heated to a temperature at which they start to decompose and release gaseous products. They diffuse upwards into the flame, undergo combustion in the gas phase, and liberate more heat. Under steady-state burning conditions, heat is transferred back to the polymer surface, producing more volatile polymer fragments to sustain the combustion cycle. In complete combustion, polymers would be fully converted into stable gaseous products. Materials or polymers such as polyethylene would be fully transformed into carbon dioxide (CO2) and water (H2O). However, in any fire, the reaction is not complete. When the oxygen concentration, ventilation and/or the flame temperature decrease, the carbon oxidation is never 100 %. For a polyethylene, when the temperature near its surface becomes high it undergoes scission at random locations on its chain, creating many smaller fragments. These can undergo pyrolysis reactions leading to the formation of unsaturated molecular species. These can react together to form aromatic species, like benzene. As the tendency for aromatic species to assembly themselves is lower than for their breakage, the conditions are ideal for their networking. This is the precursor of Polycyclic Aromatic Hydrocarbons (PAHs) which finally produce soot particles. When their sizes become of the same order as the light wavelength, they reduce visibility. This phenomenon can be explained mainly by the direct absorption of light by the biggest particles (from µm up to mm) or the light diffraction due to particles having a size in the same range as the light wavelength (0.3-0.7 µm).
Figure 1: example of PAH in smokes
It seems that soot types depend much more on fire conditions (Oxygen concentration, ventilation, temperature) than on the material type. In fact, during combustion, polymers release similar decomposition products (methane, ethylene, etc.). It has been shown that Polyethylene and PVC were releasing the same soot amount at 1000°C.
Naphtalene Fluorene
Benzo (a) pyrene

F. Gyppaz – Nexans Research Center – Lyon France - +33 4 37 37 47 47
Page 4/15
2014/03
3 Smoke release assessment
In the case of fire, smoke has many effects, one of the worst being visibility reduction. It delays escape from buildings, as smoke is quickly felt as an impenetrable barrier affecting breathing and irritating the eyes. Visibility (m) is assessed through smoke opacity, by calculating its optical density, extinction coefficient or transmittance. Finally, the effect of opacity on people is determined using models which take into account the object they want to see through the smoke.
3.1 Transmittance
Transmittance is the ratio of transmitted light intensity through smoke to incident light intensity under specified conditions. It is dimensionless and is usually expressed as a percentage. Without any smoke its value is 100%, decreasing with smoke release.
I0: light intensity measured in the absence of smoke/transmittance = 100% I: light intensity measured with smoke
3.2 Optical density
The Beer–Lambert law defines light absorption of a material, depending on its properties. It can be used to determine the attenuation of light through the smoke for a given path length. The optical density is usually obtained by measuring the attenuation of a light beam passing through the smoke, using the Lambert-Beer law:
With K: extinction coefficient (m-1) C: mass concentration of smoke particles L: path length (m)
The optical density is then defined by the relation:
Where D: measured optical density (bel) The optical density, D, is always given for a specific path length (m), but could also be determined independently by:
or
with D0: optical density for a path length of 1 m (bel/m) L: path length (m)
F. Gyppaz – Nexans Research Center – Lyon France - +33 4 37 37 47 47
Page 5/15
2014/03
3.3 Extinction coefficient (K)
The extinction coefficient of smoke is calculated using the following equation:
With K: extinction coefficient (m-1)
3.4 Test methods to assess the smoke production potential of cables
3.4.1 IEC/EN 61034-1 and -2 standards
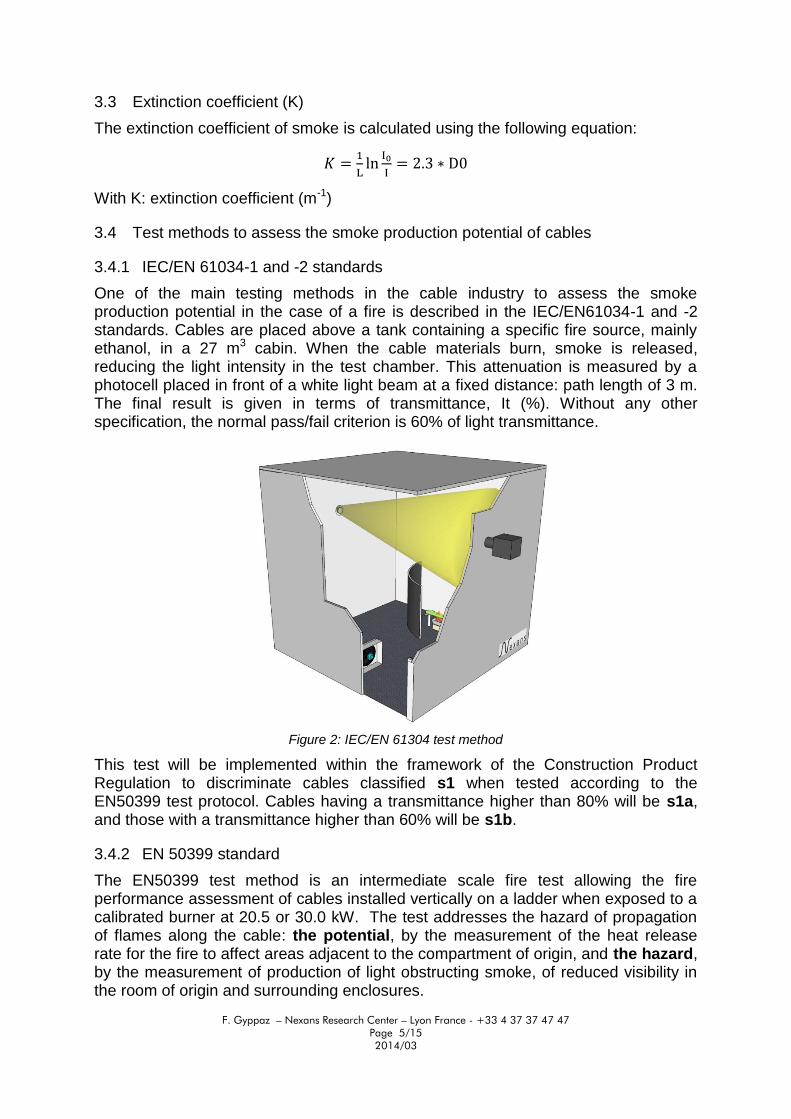
One of the main testing methods in the cable industry to assess the smoke production potential in the case of a fire is described in the IEC/EN61034-1 and -2 standards. Cables are placed above a tank containing a specific fire source, mainly ethanol, in a 27 m3 cabin. When the cable materials burn, smoke is released, reducing the light intensity in the test chamber. This attenuation is measured by a photocell placed in front of a white light beam at a fixed distance: path length of 3 m. The final result is given in terms of transmittance, It (%). Without any other specification, the normal pass/fail criterion is 60% of light transmittance.
Figure 2: IEC/EN 61304 test method
This test will be implemented within the framework of the Construction Product Regulation to discriminate cables classified s1 when tested according to the EN50399 test protocol. Cables having a transmittance higher than 80% will be s1a, and those with a transmittance higher than 60% will be s1b.
3.4.2 EN 50399 standard
The EN50399 test method is an intermediate scale fire test allowing the fire performance assessment of cables installed vertically on a ladder when exposed to a calibrated burner at 20.5 or 30.0 kW. The test addresses the hazard of propagation of flames along the cable: the potential, by the measurement of the heat release rate for the fire to affect areas adjacent to the compartment of origin, and the hazard, by the measurement of production of light obstructing smoke, of reduced visibility in the room of origin and surrounding enclosures.
F. Gyppaz – Nexans Research Center – Lyon France - +33 4 37 37 47 47
Page 6/15
2014/03
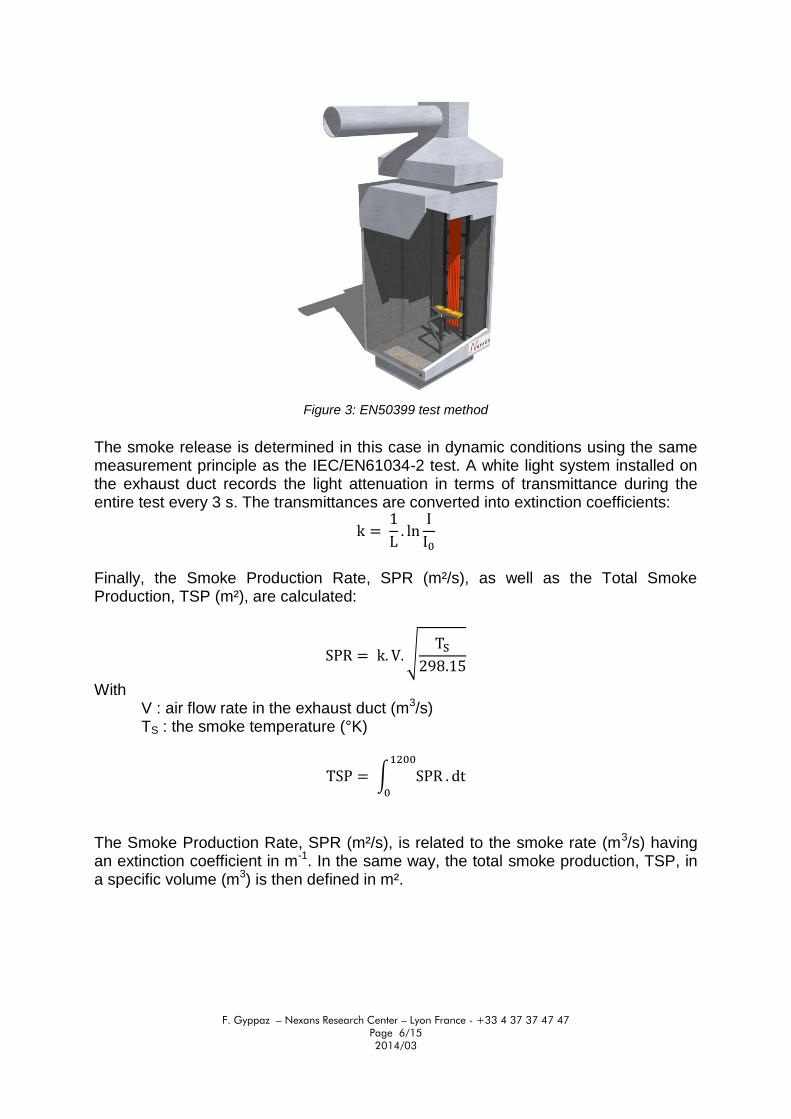
Figure 3: EN50399 test method
The smoke release is determined in this case in dynamic conditions using the same measurement principle as the IEC/EN61034-2 test. A white light system installed on the exhaust duct records the light attenuation in terms of transmittance during the entire test every 3 s. The transmittances are converted into extinction coefficients:
Finally, the Smoke Production Rate, SPR (m²/s), as well as the Total Smoke Production, TSP (m²), are calculated:
With V : air flow rate in the exhaust duct (m3/s) TS : the smoke temperature (°K)
The Smoke Production Rate, SPR (m²/s), is related to the smoke rate (m3/s) having an extinction coefficient in m-1. In the same way, the total smoke production, TSP, in a specific volume (m3) is then defined in m².
F. Gyppaz – Nexans Research Center – Lyon France - +33 4 37 37 47 47
Page 7/15
2014/03
Table 1: EN13501-6 (Draft)
Smoke class
TSP (m²)
Peak SPR (m²/s)
s1 ≤ 50 ≤ 0.25
s2 ≤ 400 ≤1.5
s3 > 400 >1.5
3.4.3 Others
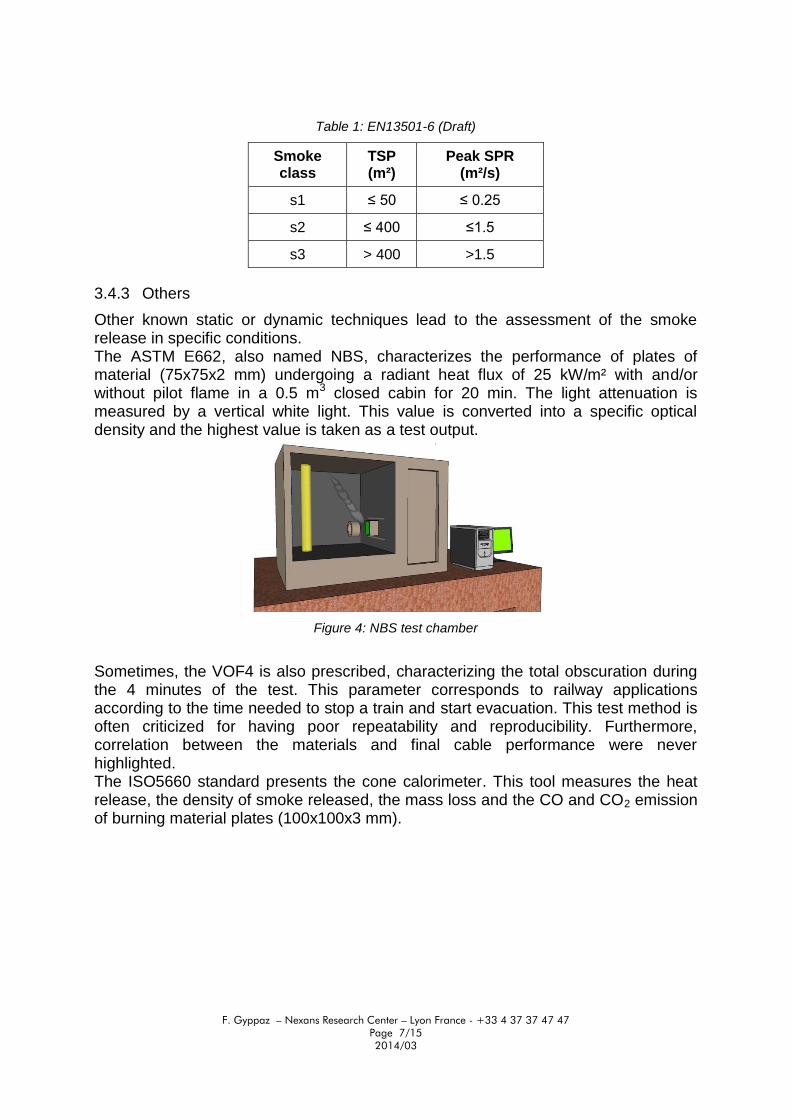
Other known static or dynamic techniques lead to the assessment of the smoke release in specific conditions. The ASTM E662, also named NBS, characterizes the performance of plates of material (75x75x2 mm) undergoing a radiant heat flux of 25 kW/m² with and/or without pilot flame in a 0.5 m3 closed cabin for 20 min. The light attenuation is measured by a vertical white light. This value is converted into a specific optical density and the highest value is taken as a test output.
Figure 4: NBS test chamber
Sometimes, the VOF4 is also prescribed, characterizing the total obscuration during the 4 minutes of the test. This parameter corresponds to railway applications according to the time needed to stop a train and start evacuation. This test method is often criticized for having poor repeatability and reproducibility. Furthermore, correlation between the materials and final cable performance were never highlighted. The ISO5660 standard presents the cone calorimeter. This tool measures the heat release, the density of smoke released, the mass loss and the CO and CO2 emission of burning material plates (100x100x3 mm).

F. Gyppaz – Nexans Research Center – Lyon France - +33 4 37 37 47 47
Page 8/15
2014/03
Figure 5: cone calorimeter
The sample is directly irradiated by a cone heater at a specific flux, often 50 kW/m². Sparks ignite the combustible gas produced by the intense heating of the specimen. All the smoke, gases are caught through a chimney and the smoke density is measured through the exhaust chimney thanks to a laser beam. Outputs like the Smoke Production rate (m²/s), the Total smoke release (TSR) are then calculated.
4 Visibility modeling
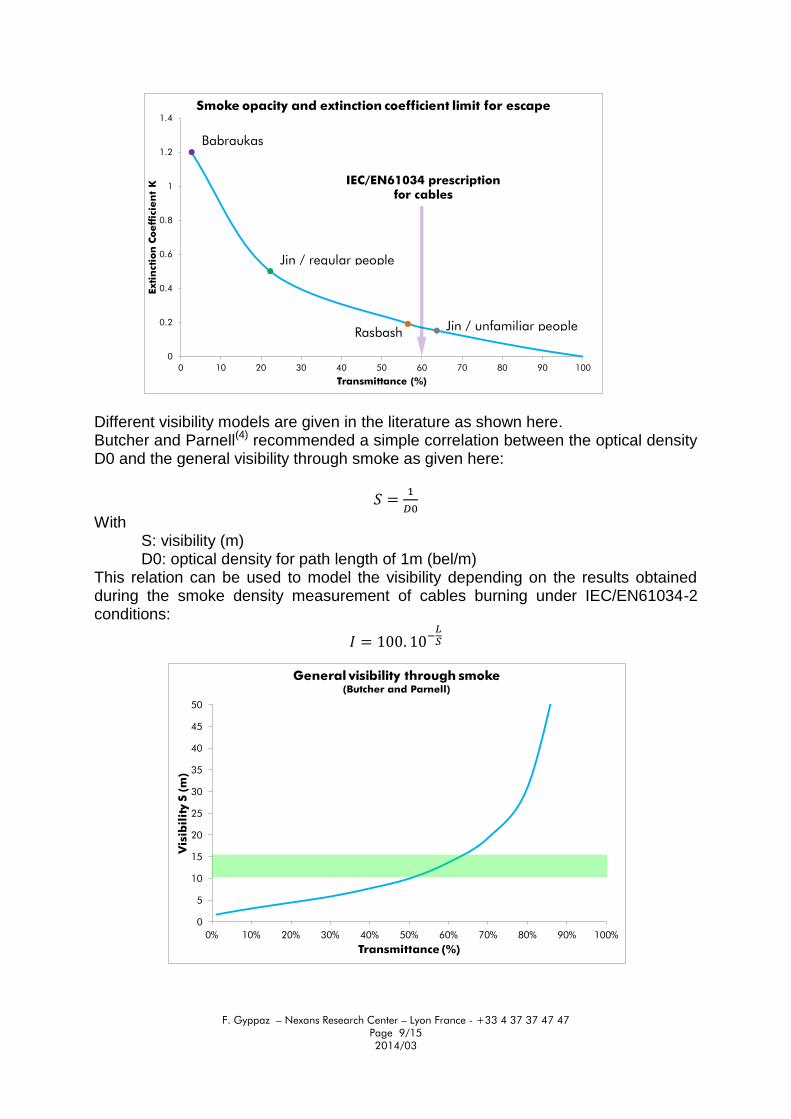
Visibility is not a parameter that is directly measured. It is calculated or estimated using models taking as inputs optical density or smoke concentration. Many publications deal with the topic. Jin(1) claims that for people unfamiliar with the escape route an extinction coefficient limit of 0.15 m-1 (D0=0.06 bel/m) and for regular 0.5 m-1 (D0=0.2 bel/m); while Rasbash(2) gives a visibility limit of 10 m, equivalent to an optical density of 0.08bel/m (k=0.19 m-1). For Babraukas(3), the extinction coefficient should be higher than 1.2m-1 (D0=0.5 bel/m). Finally, for safety reasons, the visibility limits are obtained for extinction coefficients in the range (0.15 ; 0.20) m-1.
Table 2: Extinction Coefficient limit (or D) and related transmittance
Extinction coefficient limit (m
-1)
DO (bel/m)
D (bel ; L=3m)
Transmittance (%)
1.2 0.5 1.5 3
0.5 0.2 0.6 22
0.19 0.08 0.24 57
0.15 0.06 0.18 64
These values are in close agreement with the prescription given in the IEC/EN 61034-2 test standard, used for determining smoke emission of cables. In this case, minimum transmittance is 60% (K=0.17 m-1). Cables classified s1b according the Euro-classification criteria fulfill these requirements.
F. Gyppaz – Nexans Research Center – Lyon France - +33 4 37 37 47 47
Page 9/15
2014/03
Different visibility models are given in the literature as shown here. Butcher and Parnell(4) recommended a simple correlation between the optical density D0 and the general visibility through smoke as given here:
With S: visibility (m) D0: optical density for path length of 1m (bel/m)
This relation can be used to model the visibility depending on the results obtained during the smoke density measurement of cables burning under IEC/EN61034-2 conditions:
0
0.2
0.4
0.6
0.8
1
1.2
1.4
0 10 20 30 40 50 60 70 80 90 100
Extin
ction
Coefficien
t K
Transmittance (%)
Smoke opacity and extinction coefficient limit for escape
0
5
10
15
20
25
30
35
40
45
50
0% 10% 20% 30% 40% 50% 60% 70% 80% 90% 100%
Visib
ility S
(m
)
Transmittance (%)
General visibility through smoke
(Butcher and Parnell)
Babraukas
Jin / regular people
Jin / unfamiliar people Rasbash
IEC/EN61034 prescription
for cables

F. Gyppaz – Nexans Research Center – Lyon France - +33 4 37 37 47 47
Page 10/15
2014/03
Taking into account that a minimum of 10 m of visibility is necessary to escape safely from a building, this means that transmittance must be higher than 50%. This value corresponds to cables classified s1b according the Euro-classification criteria. For the visibility of “EXIT” signs, this correlation is different, depending on the type of illumination. Studies by Jin, Rasbash, Parnell & Butcher have shown that the visibility was correlated to the smoke extinction coefficient or its optical density:
With S: visibility (m) C: constant for reflective or light systems K: extinction coefficient (m-1)
Table 3: C constant for front and back illuminated systems
C
(light system) C
(Reflective system)
Rasbash (1951) 5.8 NA
Jin (1979) 8.0 3.0
Parnell & Butcher 5.75 2.3
In these conditions, it means that for reflective surfaces or systems, the transmittance must be higher than 50%. Alsecure cables classified s1b according Euro-classification criteria fulfill this requirement. Concerning light systems, the visibility would be ensured for transmittance down to 20%. But here, the physiological effect of smoke is not taken into account as eye irritations, toxicity…limiting drastically the escape possibilities. Table 4 presents results obtained performing IEC/EN61034-2 tests on typical cables used in buildings. In a 27 m3 cabin, approximately 250 g of polymeric material (3G2.5
0
5
10
15
20
25
30
35
40
45
50
0% 10% 20% 30% 40% 50% 60% 70% 80% 90% 100%
Visib
ility (m
)
Transmittance (%)
Smoke opacity and visibility
Rasbash (1951) Light system
Jin (1979) Light system
Parnell & Butcher (1979) Light system
Parnell & Butcher Reflective system
Jin (1979) Reflective system

F. Gyppaz – Nexans Research Center – Lyon France - +33 4 37 37 47 47
Page 11/15
2014/03
mm²) lead to a transmittance of 30% for PVC cables in comparison to 90% for LSZH samples.
Table 4: IEC/EN61034-2 Transmittance values for “building” cables
R2V cables
(PVC) FR N1X1G1 cables
(LSZH)
3G2.5 mm² 27.6% 92.7%
3G16 mm² 28.6% 91.6%
It shows that PVC cables would reduce visibility down to 5 m in corridors without any self-emitting Exit signs, or between 10 to 15 m in corridors where light systems would be installed. At the same time, LSZH cables would not affect it. Jin also took into consideration the irritating effect of smoke and pointed out that for an extinction coefficient higher than 0.25 m-1 (D = 0.33 ; transmittance = 47%) visual acuity was rapidly dropping. Models propose using the following equations to estimate the travel speed in non-irritant and irritant smoke:
(non-irritant smoke)
And
(irritant smoke) With
V: walking speed (m.s-1) D0: optical density for path length of 1 m (bel/m)
0
5
10
15
20
25
30
35
40
45
50
0% 10% 20% 30% 40% 50% 60% 70% 80% 90% 100%
Visib
ility S
(m
)
Transmittance (%)
General visibility through smoke
(Butcher and Parnell)
0
5
10
15
20
25
30
35
40
45
50
0% 10% 20% 30% 40% 50% 60% 70% 80% 90% 100%
Visib
ility (m
)
Transmittance (%)
Smoke opacity and visibility
Rasbash (1951) Light system
Jin (1979) Light system
Parnell & Butcher (1979) Light system
Parnell & Butcher Reflective system
Jin (1979) Reflective system
0.0
0.2
0.4
0.6
0.8
1.0
1.2
1.4
0% 10% 20% 30% 40% 50% 60% 70% 80% 90% 100%
Wa
lk
in
g sp
eed
(m
/s)
Transmittance (%)
Smoke opacity and walking speed
Non irritant smoke
Irritant smoke
0
20
40
60
80
100
120
140
160
180
0% 10% 20% 30% 40% 50% 60% 70% 80% 90% 100%
Esca
pe tim
e (50m
)
Transmittance (%)
Smoke opacity and escape time
Non irritante smoke
Irritante smoke
PVC cables LSZH cables PVC cables LSZH cables
PVC cables LSZH cables PVC cables LSZH cables

F. Gyppaz – Nexans Research Center – Lyon France - +33 4 37 37 47 47
Page 12/15
2014/03
In this case, not taking into account the toxicity potential of smoke, PVC cables affect both walking speed and escape time, while LSZH cables don’t. Moreover, PVC cables lead to low transmittance values. A small increase of combustion would reduce walking speed to a lower value, and thus increase escape time. The document PD 7974-6: 2004, “The application of fire safety engineering principles to fire safety design of buildings Part 6: Human factors: Life safety strategies, occupant evacuation, behaviour and condition” (also used in the European Guideline “Fire safety engineering concerning evacuation from buildings”) states that generic design tenability limits should be implemented as shown here:
Table 5: smoke effect acc. PD 7974-6:2004
Suggested tenability limits for buildings with:
Small enclosures and travel distances D0=0.2 (visibility 5 m)
Large enclosures and travel distances D0=0.08 (visibility 10 m)
5 Influence of longitudinal air velocity on smoke stratification
Smoke exhaust systems are commonly used to ensure the evacuation of people in the case of fire in buildings. Their reliability is based on the fact that the smoke remains stratified. Without external influences, smoke behavior depends on its buoyant properties. It rises to the ceiling and propagates all along it, away from the fire in a stratified layer.
Smoke movement without external influences near the fire source Idealized behavior
The velocity of smoke propagation is influenced to some extent by the fire size, but a value of 2 m.s-1 is generally taken as reference for serious fires. As it moves, the smoke layer cools down and its velocity decreases. Meanwhile, it transfers heat to the ceiling, walls and surrounding air. Finally, the coolest smoke layer is located at a deeper level. Far from the fire source, smoke can be close to the floor, then sent back to the fire by the air flow. Smoke fills the entire volume.
Fig 1: Longitudinal air velocity lower than the critical velocity V<Vd
Back-layering
Upstream Downstream
F. Gyppaz – Nexans Research Center – Lyon France - +33 4 37 37 47 47
Page 13/15
2014/03
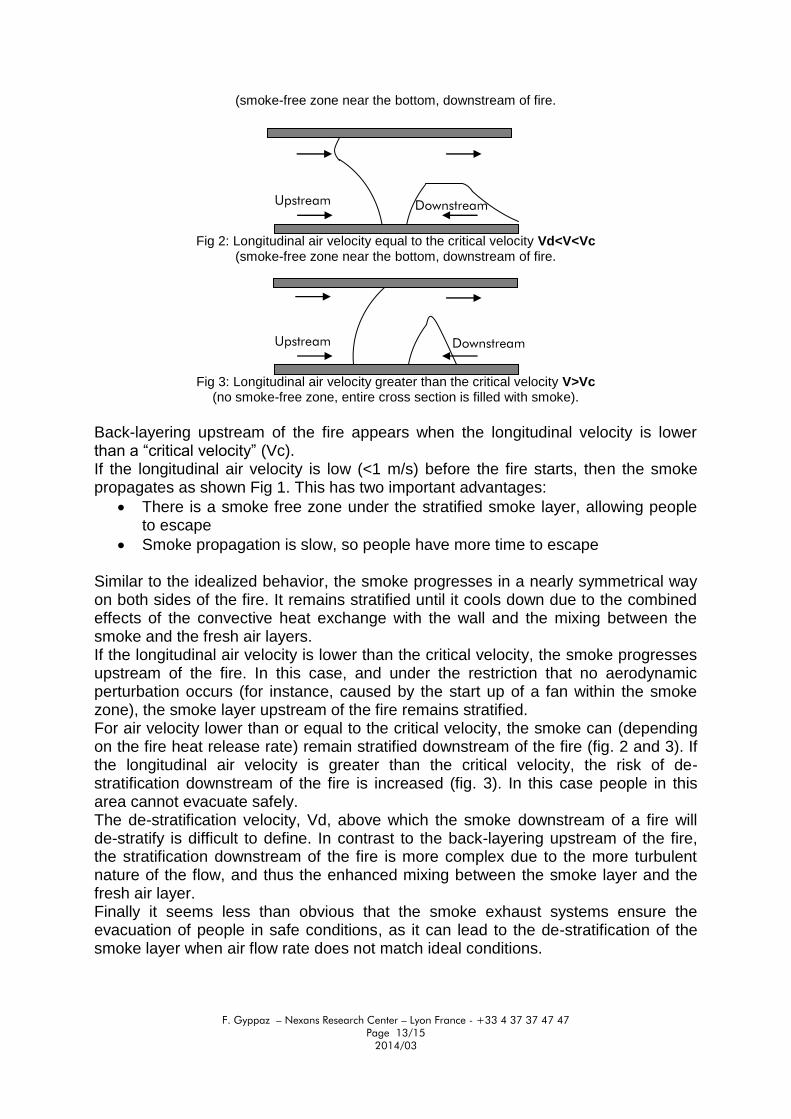
(smoke-free zone near the bottom, downstream of fire.
Fig 2: Longitudinal air velocity equal to the critical velocity Vd<V<Vc (smoke-free zone near the bottom, downstream of fire.
Fig 3: Longitudinal air velocity greater than the critical velocity V>Vc (no smoke-free zone, entire cross section is filled with smoke).
Back-layering upstream of the fire appears when the longitudinal velocity is lower than a “critical velocity” (Vc). If the longitudinal air velocity is low (<1 m/s) before the fire starts, then the smoke propagates as shown Fig 1. This has two important advantages:
There is a smoke free zone under the stratified smoke layer, allowing people to escape
Smoke propagation is slow, so people have more time to escape Similar to the idealized behavior, the smoke progresses in a nearly symmetrical way on both sides of the fire. It remains stratified until it cools down due to the combined effects of the convective heat exchange with the wall and the mixing between the smoke and the fresh air layers. If the longitudinal air velocity is lower than the critical velocity, the smoke progresses upstream of the fire. In this case, and under the restriction that no aerodynamic perturbation occurs (for instance, caused by the start up of a fan within the smoke zone), the smoke layer upstream of the fire remains stratified. For air velocity lower than or equal to the critical velocity, the smoke can (depending on the fire heat release rate) remain stratified downstream of the fire (fig. 2 and 3). If the longitudinal air velocity is greater than the critical velocity, the risk of de-stratification downstream of the fire is increased (fig. 3). In this case people in this area cannot evacuate safely. The de-stratification velocity, Vd, above which the smoke downstream of a fire will de-stratify is difficult to define. In contrast to the back-layering upstream of the fire, the stratification downstream of the fire is more complex due to the more turbulent nature of the flow, and thus the enhanced mixing between the smoke layer and the fresh air layer. Finally it seems less than obvious that the smoke exhaust systems ensure the evacuation of people in safe conditions, as it can lead to the de-stratification of the smoke layer when air flow rate does not match ideal conditions.
Upstream Downstream
Upstream Downstream
F. Gyppaz – Nexans Research Center – Lyon France - +33 4 37 37 47 47
Page 14/15
2014/03
6 Conclusion
This document highlights that the smoke released in the case of a fire is a cause of delay, and sometimes worse, impedes escape due to visibility reduction on the EXIT route. Many authors took this topic into consideration and defined limits. A global consensus is that a visibility limit of 10 m is needed for the safe evacuation of people from buildings. It corresponds to a transmittance around 60%; that is also the prescription given in the IEC/EN61034 standard to assess the performance of cables in terms of smoke production. In buildings, the Euro-classification system will soon be implemented to assess the smoke performance of cables in terms of their reaction to fire. The main criteria to discriminate their performance will be s1, s1a, s1b, s2 and s3. Classes s1, s2 and s3 will be obtained with an EN50399 test when s1a and s1b differentiating the highest performance is determined by the EN61034-2 protocol. Final information will be given as additional criteria on cable marking. It appears that specific cables, designed with standard PVC, should be s2 or s3 while LSZH ones should be s1a or s1b, which corresponds to the highest performances. It should also be pointed out that typical safety systems, such as smoke exhaust devices could cause smoke de-stratification, depending in the air flow rate created, and this could lead to obscuration or all-pervasive “smoke fog” in the building space. This point challenges the concept on which building safety is based. This White Paper suggests that fire engineering and the fire-performance of cables must go hand-in-hand if high escape levels are to be assured for those seeking safety in the event of a building fire.

F. Gyppaz – Nexans Research Center – Lyon France - +33 4 37 37 47 47
Page 15/15
2014/03
References
(1) Jin T., Journal of Fire and Flammability, vol. 12, 1981, p. 130.
(2) Rabash D.J, Relevance of firepoint theory to the assessment of fire behavior of combustible material. International Symposium on Fire safety of Combustible Materials, Edinburgh University, (1975).
(3) Babrauskas, V., Full-Scale Burning Behavior of Upholstered Chairs (Tech Note 1103), [U.S.] Natl. Bur. Stand., Gaithersburg MD (1979).
(4) Butcher, E.G. and Parnell, A.C. (1979). Smoke control in Fire safety design. E. & F.N. Spon Ltd., London