SMITH A O CORP - shareholder€¦ · · 2005-12-28In December 2002, we acquired the Jiangsu...
55
FORM 10-K SMITH A O CORP (Annual Report) Filed 2/18/2005 For Period Ending 12/31/2004 Address P O BOX 245009 MILWAUKEE, Wisconsin 53224-9509 Telephone 414-359-4000 CIK 0000091142 Industry Electronic Instr. & Controls Sector Technology Fiscal Year 12/31
Transcript of SMITH A O CORP - shareholder€¦ · · 2005-12-28In December 2002, we acquired the Jiangsu...

FORM 10-K
SMITH A O CORP
(Annual Report)
Filed 2/18/2005 For Period Ending 12/31/2004
Address P O BOX 245009
MILWAUKEE, Wisconsin 53224-9509
Telephone 414-359-4000
CIK 0000091142
Industry Electronic Instr. & Controls
Sector Technology
Fiscal Year 12/31
Table of Contents
SECURITIES AND EXCHANGE COMMISSION
Washington, D.C. 20549
FORM 10-K
For the fiscal year ended December 31, 2004
OR
For the transition period from to
Commission File Number 1-475
P. O. Box 245008, Milwaukee, Wisconsin 53224-9508
Telephone: (414) 359-4000
Securities registered pursuant to Section 12(b) of the Act:
ANNUAL REPORT PURSUANT TO SECTION 13 OR 15(d) OF THE SECURITIES EXCHANGE ACT OF 1934
���� TRANSITION REPORT PURSUANT TO SECTION 13 OR 15(d) OF THE SECURITIES EXCHANGE ACT OF 1934
Delaware 39-0619790 (State of Incorporation) (IRS Employer ID Number)
Securities registered pursuant to Section 12(g) of the Act: None.
Indicate by check mark whether the registrant (1) has filed all reports required to be filed by Section 13 or 15(d) of the Securities Exchange Act of 1934 during the preceding 12 months and (2) has been subject to such filing requirements for the past 90 days. Yes No � Indicate by check mark if disclosure of delinquent filers pursuant to Item 405 of Regulation S-K is not contained herein and will not be contained, to the best of registrant’s knowledge, in definitive proxy or information statements incorporated by reference in Part III of this Form 10-K or any amendment to this Form 10-K. Indicate by check mark whether the registrant is an accelerated filer (as defined in Rule 12b-2 of the act) Yes No � The aggregate market value of voting stock held by non-affiliates of the registrant was $13,115,015 for Class A Common Stock and $515,042,558 for Common Stock as of January 31, 2005. Documents Incorporated by Reference:
Title of Each Class
Shares of Stock Outstanding
January 31, 2005 Name of Each Exchange on
Which Registered
Class A Common Stock (par value $5.00 per share)
8,490,317
Not listed
Common Stock (par value $1.00 per share)
21,174,813
New York Stock Exchange
1. Portions of the company’s definitive Proxy Statement for the 2005 Annual Meeting of Stockholders (to be filed with the Securities and Exchange Commission under Regulation 14A within 120 days after the end of the registrant’s fiscal year and, upon such filing, to be incorporated by reference in Part III).
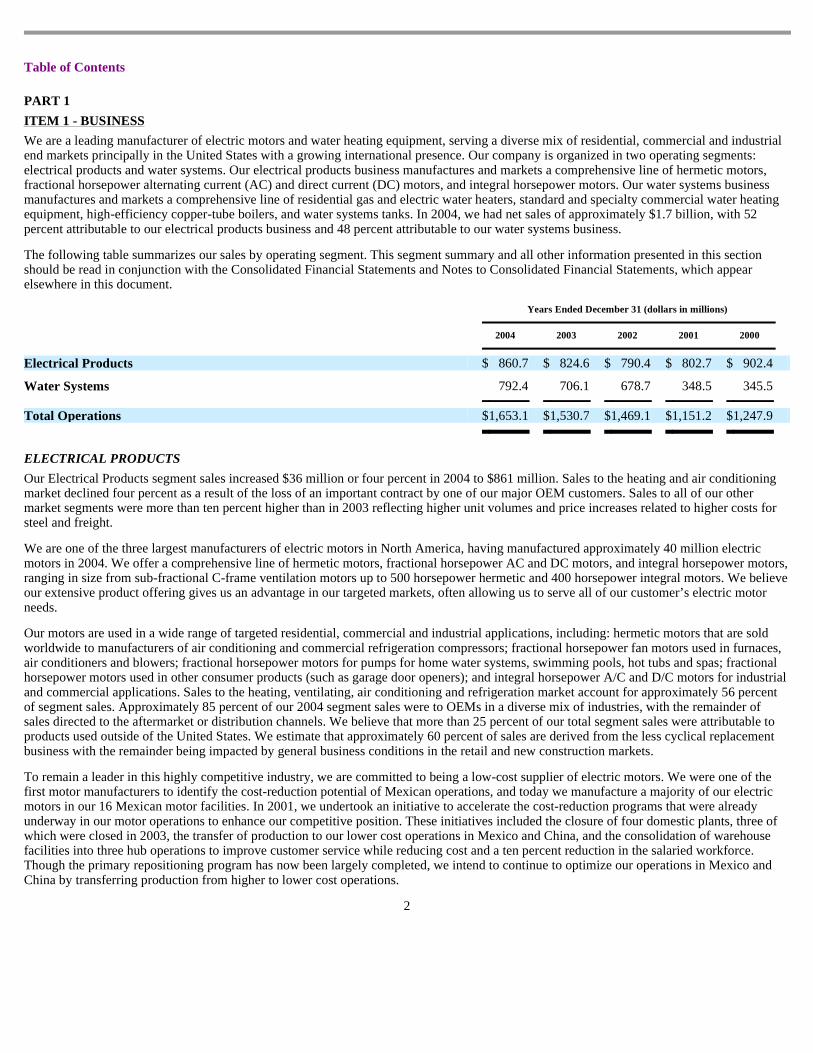
Table of Contents
PART 1 ITEM 1 - BUSINESS We are a leading manufacturer of electric motors and water heating equipment, serving a diverse mix of residential, commercial and industrial end markets principally in the United States with a growing international presence. Our company is organized in two operating segments: electrical products and water systems. Our electrical products business manufactures and markets a comprehensive line of hermetic motors, fractional horsepower alternating current (AC) and direct current (DC) motors, and integral horsepower motors. Our water systems business manufactures and markets a comprehensive line of residential gas and electric water heaters, standard and specialty commercial water heating equipment, high-efficiency copper-tube boilers, and water systems tanks. In 2004, we had net sales of approximately $1.7 billion, with 52 percent attributable to our electrical products business and 48 percent attributable to our water systems business. The following table summarizes our sales by operating segment. This segment summary and all other information presented in this section should be read in conjunction with the Consolidated Financial Statements and Notes to Consolidated Financial Statements, which appear elsewhere in this document.
ELECTRICAL PRODUCTS
Years Ended December 31 (dollars in millions)
2004 2003 2002 2001 2000
Electrical Products $ 860.7 $ 824.6 $ 790.4 $ 802.7 $ 902.4
Water Systems 792.4 706.1 678.7 348.5 345.5
Total Operations $ 1,653.1 $ 1,530.7 $ 1,469.1 $ 1,151.2 $ 1,247.9
Our Electrical Products segment sales increased $36 million or four percent in 2004 to $861 million. Sales to the heating and air conditioning market declined four percent as a result of the loss of an important contract by one of our major OEM customers. Sales to all of our other market segments were more than ten percent higher than in 2003 reflecting higher unit volumes and price increases related to higher costs for steel and freight. We are one of the three largest manufacturers of electric motors in North America, having manufactured approximately 40 million electric motors in 2004. We offer a comprehensive line of hermetic motors, fractional horsepower AC and DC motors, and integral horsepower motors, ranging in size from sub-fractional C-frame ventilation motors up to 500 horsepower hermetic and 400 horsepower integral motors. We believe our extensive product offering gives us an advantage in our targeted markets, often allowing us to serve all of our customer’s electric motor needs. Our motors are used in a wide range of targeted residential, commercial and industrial applications, including: hermetic motors that are sold worldwide to manufacturers of air conditioning and commercial refrigeration compressors; fractional horsepower fan motors used in furnaces, air conditioners and blowers; fractional horsepower motors for pumps for home water systems, swimming pools, hot tubs and spas; fractional horsepower motors used in other consumer products (such as garage door openers); and integral horsepower A/C and D/C motors for industrial and commercial applications. Sales to the heating, ventilating, air conditioning and refrigeration market account for approximately 56 percent of segment sales. Approximately 85 percent of our 2004 segment sales were to OEMs in a diverse mix of industries, with the remainder of sales directed to the aftermarket or distribution channels. We believe that more than 25 percent of our total segment sales were attributable to products used outside of the United States. We estimate that approximately 60 percent of sales are derived from the less cyclical replacement business with the remainder being impacted by general business conditions in the retail and new construction markets. To remain a leader in this highly competitive industry, we are committed to being a low-cost supplier of electric motors. We were one of the first motor manufacturers to identify the cost-reduction potential of Mexican operations, and today we manufacture a majority of our electric motors in our 16 Mexican motor facilities. In 2001, we undertook an initiative to accelerate the cost-reduction programs that were already underway in our motor operations to enhance our competitive position. These initiatives included the closure of four domestic plants, three of which were closed in 2003, the transfer of production to our lower cost operations in Mexico and China, and the consolidation of warehouse facilities into three hub operations to improve customer service while reducing cost and a ten percent reduction in the salaried workforce. Though the primary repositioning program has now been largely completed, we intend to continue to optimize our operations in Mexico and China by transferring production from higher to lower cost operations.
2

Table of Contents
In December 2001, we acquired Shenzhen Speeda Industries Co., Ltd. (Shenzhen), a manufacturer of sub-fractional horsepower electric motors in China. In December 2002, we acquired the Jiangsu Changheng Group Co. Ltd (Changheng), of Changzhou, China. While Changheng has an existing customer base in China, the primary purpose of both the Shenzhen and Changheng acquisitions is to further expand our ability to manufacture products for the U. S. market. In November 2003, we acquired Taicang Special Motor Co., Ltd. (Taicang), of Suzhou, China, a manufacturer of hermetic motors for commercial air conditioning equipment. Taicang currently serves the Chinese operations of a number of North American air conditioning companies and enhances our position in the global hermetic motor market. Our principal competitors in the electric motor industry are Emerson Electric Co. and Regal Beloit Corporation. A number of other companies, such as Fasco Motors (a subsidiary of Tecumseh Products), Baldor Electric and Jakel Incorporated, compete with us in specific segments of the electric motor market. WATER SYSTEMS Our Water Systems business had sales in 2004 of $792 million, which were 12 percent or $86 million higher than in 2003. The higher sales were the result of the introduction of higher efficiency residential water heaters, higher prices related to increased steel and freight costs, strong commercial volume, a 37 percent increase in China sales, and additional flammable vapor ignition resistant product. In December 2001, we acquired the privately held water heater manufacturer State Industries, Inc. (State) for aggregate cash consideration of $117.6 million. This was comprised of a $61.3 million purchase price and the assumption of $56.3 million of debt. The acquisition of State nearly doubled the sales of our water heating business. We serve residential, commercial and industrial end markets with a broad range of products, including: Residential gas and electric water heaters . Our residential water heaters come in sizes ranging from two-gallon (point-of-use) models to 120-gallon appliances with varying efficiency ranges. We offer traditional atmospheric water heaters as well as direct-vented and power-vented models for today’s energy efficient homes. Domestic residential water heater sales in 2004 were approximately $530 million or two-thirds of segment revenues. Standard commercial water heaters . Our gas, oil and electric water heaters come in capacities ranging from 50 to 100 gallons and are used by customers who require a consistent, economical source of hot water. Typical applications include restaurants, hotels and motels, laundries, car washes and small businesses. Approximately 80 percent of the residential and commercial markets consist of the replacement of existing product, although new construction is also an important factor for the business. Our Water Systems business also manufactures and markets specialty commercial water heaters, copper-tube boilers, expansion tanks and related products and parts. We are one of the two largest manufacturers and marketers of water heaters in North America, manufacturing approximately 2.8 million units in 2004. We have a leading share in the commercial water heating segment, and we believe we are the only domestic manufacturer that offers standard and specialty commercial water heater products. We believe that our comprehensive commercial product line gives us a competitive advantage in this higher-margin segment of the water heating industry. We also are one of the leaders in the residential water heating segment with an extensive line of high-efficiency gas and electric models. Government regulations are having a significant impact on the United States water heating industry. Beginning in July 2003, United States water heater manufacturers were required to comply with new flammable vapor ignition resistant standards for residential gas water heaters. These new regulations, developed by the manufacturers in cooperation with the United States Consumer Product Safety Commission, dictate that gas water heaters must be designed to protect against accidental ignition of flammable vapors caused by spilled gasoline or other liquids. In addition, a United States government requirement to increase the efficiency of residential gas and electric water heaters went into effect on January 20, 2004. Our water systems wholesale distribution channel includes more than 750 wholesale plumbing distributors with more than 4,500 selling locations serving residential, commercial and industrial markets. We also sell our residential water heaters through the retail channel. In this channel, our customers include four of the six largest national hardware and home center chains, including a long-standing private label relationship with Sears, Roebuck and Co.
3

Table of Contents
Our principal domestic water heating competitors include Rheem Manufacturing Company, Inc. and, to a lesser extent, American Water Heater Company, Bradford-White Corporation and Lochinvar Corporation. We also compete against numerous competitors in international markets. RAW MATERIAL Raw materials for our manufacturing operations, which consist primarily of steel, copper and aluminum, are generally available from several sources in adequate quantities. We hedge the majority of our annual copper and aluminum purchases to protect against price volatility. While steel prices have increased significantly over the past year, we had adequate supply and believe we have agreements in place to assure adequate supply in the future. SEASONALITY There is no significant seasonal pattern to our consolidated quarterly sales and earnings. RESEARCH AND DEVELOPMENT, PATENTS and TRADEMARKS In order to improve competitiveness by generating new products and processes, we conduct research and development at our Corporate Technology Center in Milwaukee, Wisconsin, as well as at our operating units. Total expenditures for research and development in 2004, 2003 and 2002 were $35.9, $34.6, and $30.4 million, respectively. We own and use in our businesses various trademarks, trade names, patents, trade secrets and licenses. While a number of these are important to us, we do not consider a material part of our business to be dependent on any one of them. EMPLOYEES Our company and its subsidiaries employed approximately 16,600 employees as of December 31, 2004. BACKLOG Normally, none of our operations sustain significant backlogs. ENVIRONMENTAL LAWS Our operations are governed by a variety of federal, state and local laws intended to protect the environment. While environmental considerations are a part of all significant capital expenditures, compliance with the environmental laws has not had a material effect and is not expected to have a material effect upon the capital expenditures, earnings, or competitive position of our company. See Item 3. FOREIGN SALES Total U.S. export sales from our operations were $106, $98, and $90 million in 2004, 2003 and 2002, respectively. AVAILABLE INFORMATION We maintain a website with the address www.aosmith.com. The information contained on our website is not included as a part of, or incorporated by reference into, this Annual Report on Form 10-K. Other than an investor’s own Internet access charges, we make available free of charge through our website our Annual Report on Form 10-K, quarterly reports on Form 10-Q, current reports on Form 8-K and amendments to these reports as soon as reasonably practical after we have electronically filed such material with, or furnished such material to, the Securities and Exchange Commission. The company is committed to sound corporate governance and has documented its corporate governance practices by adopting the A. O. Smith Corporate Governance Guidelines. The Corporate Governance Guidelines, Criteria for Selection of Directors, Financial Code of Ethics, the A. O. Smith Guiding Principles, as well as the charters for the Audit, Personnel and Compensation, Nominating and Governance and the Investment Policy Committees and other corporate governance materials may be viewed on the company’s website. Any waiver of or amendments to the Financial Code of Conduct or the A. O. Smith Guiding Principles also would be posted on this website; to date there have been none. Copies of these documents will be sent to stockholders free of charge upon written request of the corporate secretary at the address shown on the cover page of this Form 10-K.
4
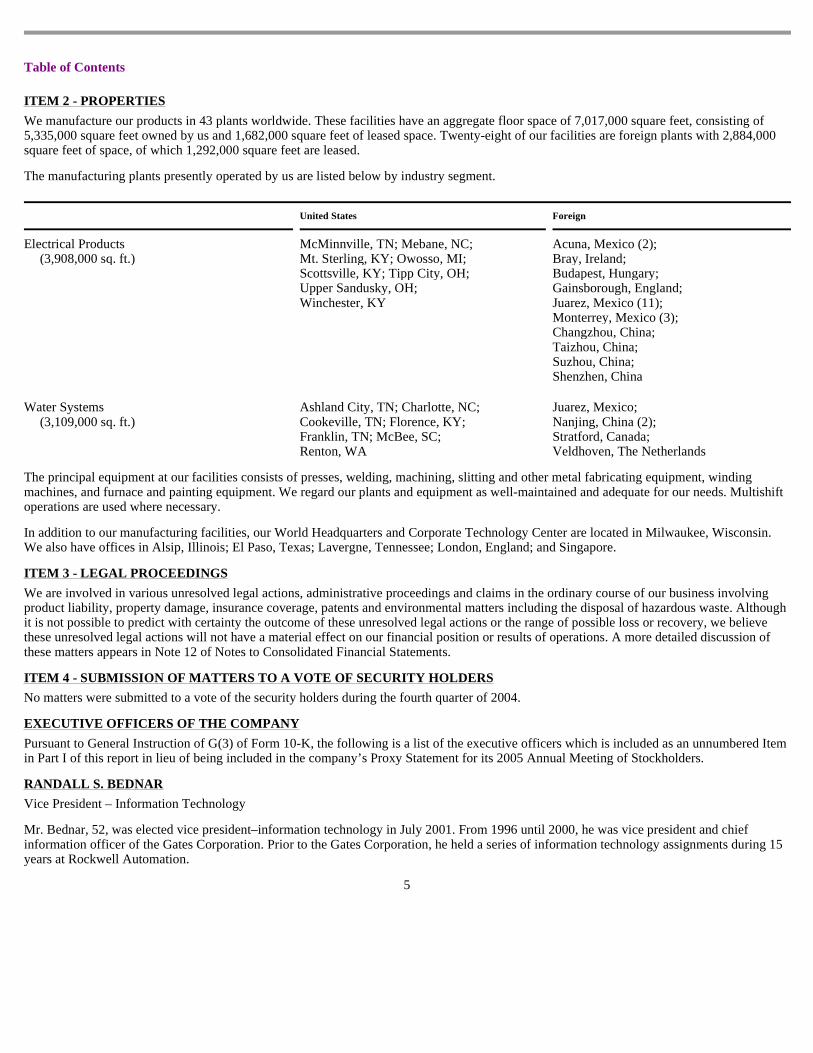
Table of Contents
ITEM 2 - PROPERTIES We manufacture our products in 43 plants worldwide. These facilities have an aggregate floor space of 7,017,000 square feet, consisting of 5,335,000 square feet owned by us and 1,682,000 square feet of leased space. Twenty-eight of our facilities are foreign plants with 2,884,000 square feet of space, of which 1,292,000 square feet are leased. The manufacturing plants presently operated by us are listed below by industry segment.
The principal equipment at our facilities consists of presses, welding, machining, slitting and other metal fabricating equipment, winding machines, and furnace and painting equipment. We regard our plants and equipment as well-maintained and adequate for our needs. Multishift operations are used where necessary. In addition to our manufacturing facilities, our World Headquarters and Corporate Technology Center are located in Milwaukee, Wisconsin. We also have offices in Alsip, Illinois; El Paso, Texas; Lavergne, Tennessee; London, England; and Singapore. ITEM 3 - LEGAL PROCEEDINGS
United States
Foreign
Electrical Products (3,908,000 sq. ft.)
McMinnville, TN; Mebane, NC; Mt. Sterling, KY; Owosso, MI;
Acuna, Mexico (2); Bray, Ireland;
Scottsville, KY; Tipp City, OH; Budapest, Hungary; Upper Sandusky, OH; Gainsborough, England; Winchester, KY Juarez, Mexico (11); Monterrey, Mexico (3); Changzhou, China; Taizhou, China; Suzhou, China; Shenzhen, China
Water Systems (3,109,000 sq. ft.)
Ashland City, TN; Charlotte, NC; Cookeville, TN; Florence, KY;
Juarez, Mexico; Nanjing, China (2);
Franklin, TN; McBee, SC; Stratford, Canada; Renton, WA Veldhoven, The Netherlands
We are involved in various unresolved legal actions, administrative proceedings and claims in the ordinary course of our business involving product liability, property damage, insurance coverage, patents and environmental matters including the disposal of hazardous waste. Although it is not possible to predict with certainty the outcome of these unresolved legal actions or the range of possible loss or recovery, we believe these unresolved legal actions will not have a material effect on our financial position or results of operations. A more detailed discussion of these matters appears in Note 12 of Notes to Consolidated Financial Statements. ITEM 4 - SUBMISSION OF MATTERS TO A VOTE OF SECURITY HOLDER S No matters were submitted to a vote of the security holders during the fourth quarter of 2004. EXECUTIVE OFFICERS OF THE COMPANY Pursuant to General Instruction of G(3) of Form 10-K, the following is a list of the executive officers which is included as an unnumbered Item in Part I of this report in lieu of being included in the company’s Proxy Statement for its 2005 Annual Meeting of Stockholders. RANDALL S. BEDNAR Vice President – Information Technology Mr. Bednar, 52, was elected vice president–information technology in July 2001. From 1996 until 2000, he was vice president and chief information officer of the Gates Corporation. Prior to the Gates Corporation, he held a series of information technology assignments during 15 years at Rockwell Automation.
5

Table of Contents
CHARLES J. BISHOP Vice President - Corporate Technology Dr. Bishop, 63, has been vice president-corporate technology since 1985. Dr. Bishop joined the company in 1981. MICHAEL J. COLE Vice President - Asia Mr. Cole, 60, was elected vice president-Asia in March 1996. Previously he was vice president-emerging markets of Donnelly Corporation, an automotive supplier. PAUL W. JONES President and Chief Operating Officer Mr. Jones, 56, was elected president and chief operating officer in January 2004 and was elected as a director in December 2004. Previously, from 1998 to October 2002, he was chairman and chief executive officer of U.S. Can Company. U.S. Can Company is a leading provider of steel containers for personal care, household, automotive, paint, industrial and specialty products in the United States and Europe. Prior to the U.S. Can Company, he was Chief Executive Officer of Greenfield Industries, a global supplier of cutting tools. He is a director of Federal Signal Corporation. JOHN J. KITA Vice President, Treasurer and Controller Mr. Kita, 49, was elected vice president, treasurer and controller in April 1996. From 1995 to 1996, he was treasurer and controller. Prior thereto, he served as assistant treasurer since he joined the company in 1988. KENNETH W. KRUEGER Senior Vice President and Chief Financial Officer Mr. Krueger, 48, became senior vice president and chief financial officer in August 2000. Previously he was a group vice president, finance and business planning at Eaton Corporation. Prior to Eaton, he was vice president-finance for Rockwell Automation, where he worked from 1983 to 1999. He is a director of Manitowoc Company, Inc. CHRISTOPHER L. MAPES Senior Vice President and President - A. O. Smith Electrical Products Company Mr. Mapes, 43, became president of A. O. Smith Electrical Products Company, a division of the company, in September 2004. He was elected senior vice president in October 2004. Previously he was president of motor sales and marketing and an officer of Regal-Beloit Corporation. From 1990 to 2002, Mr. Mapes worked at Superior Telecom. RONALD E. MASSA Senior Vice President and President - A. O. Smith Water Products Company Mr. Massa, 55, became President of A. O. Smith Water Products Company, a division of the company, in February 1999. He was elected senior vice president in June 1997. He served as the president of A. O. Smith Automotive Products Company, a former division of the company, from June 1996 to April 1997. He was the president of A. O. Smith Water Products Company from 1995 to June 1996 and held other management positions in the Water Products Company prior thereto. He joined the company in 1977.
6

Table of Contents
ALBERT E. MEDICE Vice President - Europe Mr. Medice, 62, was elected vice president-Europe in 1995. Previously, from 1990 to 1995, he was the general manager of A. O. Smith Electric Motors (Ireland) Ltd., a subsidiary of the company. Mr. Medice joined the company in 1986 as vice president-marketing for its Electrical Products Company division. ROBERT J. O’TOOLE Chairman of the Board of Directors and Chief Executive Officer Mr. O’Toole, 63, became chairman of the board of directors in March 1992. He is a member of the Investment Policy Committee of the board of directors. He was elected chief executive officer in March 1989. He was elected president, chief operating officer and a director in 1986. Mr. O’Toole joined the company in 1963. He is a director of Briggs & Stratton Corporation, FM Global and Marshall & Ilsley Corporation. MARK A. PETRARCA Vice President - Human Resources and Public Affairs Mr. Petrarca, 41, was elected vice president-human resources and public affairs in January 2005. From 1999 to 2004, he served as vice president-human resources for A. O. Smith Water Products Company, a division of the company. Previously he was a director of human resources for Strike Weapons Systems, a division of Raytheon Systems Company. STEVE W. RETTLER Vice President – Business Development Mr. Rettler, 49, was elected vice president–business development in July 1998. Previously he was vice president and general manager of Brady Precision Tape Co., a manufacturer of specialty tape products for the electronics market. W. DAVID ROMOSER Vice President, General Counsel and Secretary Mr. Romoser, 61, was elected vice president, general counsel and secretary in March 1992.
7
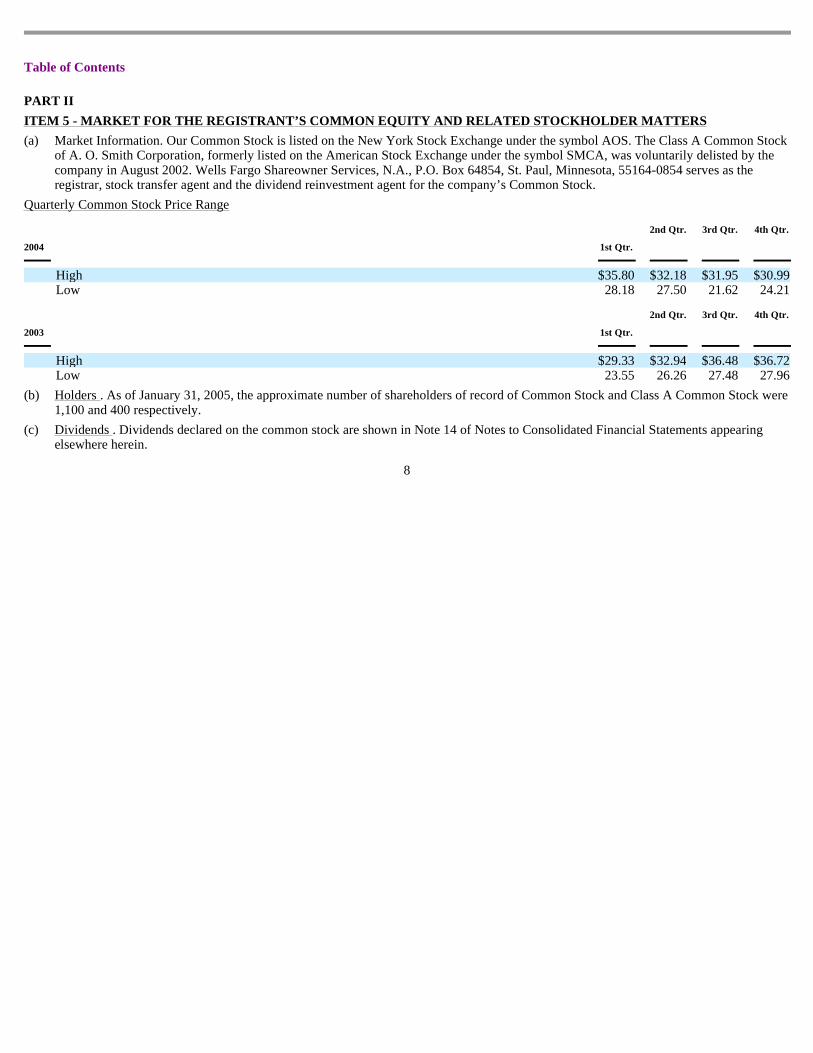
Table of Contents
PART II ITEM 5 - MARKET FOR THE REGISTRANT ’S COMMON EQUITY AND RELATED STOCKHOLDER MATTERS
(a) Market Information. Our Common Stock is listed on the New York Stock Exchange under the symbol AOS. The Class A Common Stock of A. O. Smith Corporation, formerly listed on the American Stock Exchange under the symbol SMCA, was voluntarily delisted by the company in August 2002. Wells Fargo Shareowner Services, N.A., P.O. Box 64854, St. Paul, Minnesota, 55164-0854 serves as the registrar, stock transfer agent and the dividend reinvestment agent for the company’s Common Stock.
Quarterly Common Stock Price Range
2004
1st Qtr.
2nd Qtr.
3rd Qtr.
4th Qtr.
High $ 35.80 $ 32.18 $ 31.95 $ 30.99 Low 28.18 27.50 21.62 24.21
2003
1st Qtr.
2nd Qtr.
3rd Qtr.
4th Qtr.
High $ 29.33 $ 32.94 $ 36.48 $ 36.72 Low 23.55 26.26 27.48 27.96
(b) Holders . As of January 31, 2005, the approximate number of shareholders of record of Common Stock and Class A Common Stock were 1,100 and 400 respectively.
8
(c) Dividends . Dividends declared on the common stock are shown in Note 14 of Notes to Consolidated Financial Statements appearing elsewhere herein.

Table of Contents
ITEM 6 – SELECTED FINANCIAL DATA
Years ended December 31 (1)
(Dollars in Millions, except per share amounts)
2004
2003 (2)
2002 (3),(4)
2001 (5)
2000
Net sales - continuing operations $ 1,653.1 $ 1,530.7 $ 1,469.1 $ 1,151.2 $ 1,247.9 Earnings (Loss)
Continuing operations 35.4 52.2 51.3 14.5 41.7 Discontinued operations
Loss on disposition — — — — (11.9 ) — — — — (11.9 )
Net earnings $ 35.4 $ 52.2 $ 51.3 $ 14.5 $ 29.8
Basic earnings (loss) per share of common stock
Continuing operations $ 1.21 $ 1.80 $ 1.90 $ .61 $ 1.78 Discontinued operations — — — — (.51 )
Net earnings $ 1.21 $ 1.80 $ 1.90 $ .61 $ 1.27
Diluted earnings (loss) per share of common stock
Continuing operations $ 1.18 $ 1.76 $ 1.86 $ .61 $ 1.76 Discontinued operations — — — — (.50 )
Net earnings $ 1.18 $ 1.76 $ 1.86 $ .61 $ 1.26
Cash dividends per common share $ .62 $ .58 $ .54 $ .52 $ .50
December 31
2004
2003
2002
2001
2000
Total assets $ 1,312.8 $ 1,279.9 $ 1,224.9 $ 1,293.9 $ 1,064.9 Long-term debt (6) 272.5 170.1 239.1 390.4 316.4 Total stockholders’ equity 590.6 583.5 (7) 518.4 (7) 459.3 (7) 455.7 (7)
(1) On December 8, 2000, the company sold its fiberglass piping business and on January 10, 2001, the company sold its liquid and dry storage business. The company has accounted for the fiberglass piping and liquid and dry storage businesses as discontinued operations in the consolidated financial statements.
(2) In November 2003, the company acquired the motor manufacturing assets of Taicang Special Motor Co., Ltd. See Note 2 of Notes to Consolidated Financial Statements included elsewhere herein.
(3) Effective January 1, 2002, the company changed its method of accounting for goodwill and identifiable intangible assets with indefinite lives. See Note 6 of Notes to Consolidated Financial Statements included elsewhere herein.
(4) On July 1, 2002, the company acquired the hermetic motor assets of the Athens Products division of Electrolux. In December 2002, the company acquired the motor manufacturing assets of Jiangsu Changheng Group Co. Ltd. (Changheng). See Note 2 of Notes to Consolidated Financial Statements included elsewhere herein.
(5) On December 28, 2001, the company acquired all of the outstanding stock of State Industries, Inc., a manufacturer of a comprehensive line of residential and commercial water heaters.
(6) Excludes short-term debt and the current portion of long-term debt.
9
(7) Restated. See Note 11 of Notes to Consolidated Financial Statements included elsewhere herein.

Table of Contents
ITEM 7 – MANAGEMENT ’S DISCUSSION AND ANALYSIS OF FINANCIAL CONDITION AN D RESULTS OF OPERATIONS LIQUIDITY AND CAPITAL RESOURCES We recorded net earnings of $35.4 million or $1.18 per share in 2004, compared with $52.2 million or $1.76 per share recorded in 2003 and $51.3 million or $1.86 per share in 2002. Net earnings recorded in 2004 were negatively impacted by cost increases to steel and freight, as well as manufacturing inefficiencies during the first nine months of the year in our Ashland City plant and higher selling, general and administrative expense (SG&A). While net earnings were flat in 2003 compared with 2002, the lower earnings per share amount in 2003 as compared with 2002 reflected the full-year impact of our stock offering in May 2002. Our individual segment performance will be discussed later in this section. Our working capital, excluding short-term debt, was $339.8 million at December 31, 2004, compared with $305.9 million and $225.1 million at December 31, 2003, and December 31, 2002, respectively. The $33.9 million increase in 2004 reflects $44.9 million higher receivable balances due to longer payment terms experienced by both of our businesses as well as higher sales levels in the fourth quarter. Offsetting the increase in receivable balances were $13.5 million lower inventory levels split about equally between Water Systems and Electrical Products and $14.3 million higher accounts payable balances. The $80.8 million increase in 2003 reflects $46.6 million higher inventory balances due primarily to extensive manufacturing repositioning in our electric motor business and several new product introductions and manufacturing consolidation in our water systems business. Additionally, receivable balances were $21.2 million higher due to price increases associated with new product introductions in our water systems business and an increase in international sales, which tend to have longer payment terms. Finally, a $13.1 million increase in accounts payable balances was largely offset by $9.4 million in restructuring expenses paid out in 2003. Reducing working capital is one of our major initiatives in 2005. Cash provided by operating activities during 2004 was $67.2 million compared with $29.0 million during 2003 and $116.0 million during 2002. Despite lower earnings in 2004, a smaller investment in working capital explains the majority of the improvement in cash flow compared with 2003. The higher investment in working capital in 2003 (as discussed above), explains the majority of the difference between 2003 and 2002. Our capital expenditures were $48.5 million in 2004, essentially the same as in 2003 and approximately $2.2 million higher than in 2002. The increase in 2003 was associated with new product launches in our water systems business. We are projecting 2005 capital expenditures to be approximately $55 million, essentially the same as our projected 2005 depreciation expense. We believe that our present facilities and planned capital expenditures are sufficient to provide adequate capacity for our operations in 2005. In June 2004, we completed a $265 million, five-year revolving credit facility with a group of eight banks. The new facility expires on June 10, 2009, and it replaced a $250 million credit facility which expired on August 2, 2004, and was terminated on June 10, 2004. The new facility backs up commercial paper and credit line borrowings. As a result of the long-term nature of this facility, the commercial paper and credit line borrowings are now classified as long-term debt. At December 31, 2004, we had available borrowing capacity of $153.9 million under this facility. We believe that the combination of available borrowing capacity and operating cash flow will provide sufficient funds to finance our existing operations for the foreseeable future. To take advantage of historically low long-term borrowing rates, we issued $50.0 million in senior notes with two insurance companies in June 2003. The notes range in maturity between 2013 and 2016 and carry a weighted average interest rate of slightly less than 4.5 percent. The proceeds of the notes were used to repay commercial paper and borrowing under the credit facility. Our leverage, as measured by the ratio of total debt to total capitalization, was 32 percent at the end of 2004 and the end of 2003. Aggregate Contractual Obligations A summary of our contractual obligations as of December 31, 2004, is as follows:
10
(dollars in millions) Payments due by period
Contractual Obligation
Total
Less Than 1 year
1 - 3 Years
3 - 5 Years
More than 5 years
Long-term Debt $ 275.1 $ 8.6 $ 13.8 $ 138.2 $ 114.5 Capital Leases 6.0 — — 6.0 — Operating Leases 62.9 14.4 20.7 11.6 16.2 Purchase Obligations 177.3 176.6 0.7 — —
Total $ 521.3 $ 199.6 $ 35.2 $ 155.8 $ 130.7

Table of Contents
We utilize blanket purchase orders to communicate expected annual requirements to many of our suppliers. Requirements under blanket purchase orders generally do not become “firm” until six weeks prior to the company’s scheduled unit production. The purchase obligation amount presented above represents the value of commitments considered firm. Our pension plan continues to meet all funding requirements under ERISA regulations, and under current actuarial assumptions, we do not expect any significant minimum funding requirements for several years. See Note 10 of Notes to Consolidated Financial Statements. Included in other assets is a $34.0 million receivable due to the payments of claims associated with the dip tube class action lawsuit. See Note 12 of Notes to Consolidated Financial Statements. The receivable is classified as a long-term asset because, while a trial was completed in 2004, the verdict was inconclusive, and a retrial date is expected to be scheduled sometime in 2005. We expect to collect the receivable after 2005 through the satisfaction of a judgment favorable to us. Alternatively, collection could occur in 2005 if a settlement of the lawsuit is reached with the defendants, Perfection Corporation, American Meter Company and insurance companies. We have paid dividends for 65 consecutive years with payments increasing each of the last 13 years. We paid total dividends of $.62 per share in 2004 compared with $.58 per share in 2003. RESULTS OF OPERATIONS Our sales in 2004 were $1.65 billion, an increase of $122.4 million or eight percent from sales of $1.53 billion in 2003. The sales increase resulted from new higher-priced water heater products, price increases associated with higher steel and freight costs and a 37 percent increase in China water heater sales. 2003 sales increased by $61.6 million or 4.2 percent from sales of $1.47 billion in 2002. The sales increase was due to a full-year impact of our 2002 acquisitions in the motor business, a 44 percent increase in sales at our Chinese water heater operation, and higher water heater pricing related to steel costs and the introduction of flammable vapor ignition resistant water heaters. Our gross profit margin for 2004 was 18.0 percent compared with 19.5 percent and 20.4 percent in 2003 and 2002, respectively. The decline in margin from 2003 to 2004 was attributable to higher costs at Water Systems for raw materials, freight and manufacturing inefficiencies. The decline in margin from 2002 to 2003 resulted from approximately $40 million of sales from acquired businesses with margins lower than those of our established business. Selling, general and administrative expense (SG&A) increased $29.6 million from $206.2 million in 2003. SG&A was 14.3 percent of sales in 2004 and 13.5 percent in 2003. The increase in SG&A in 2004 was caused by higher selling and advertising expenses for Water Systems, expansion in China and higher administrative expense related to pension and personnel costs. SG&A in 2003 of $206.2 million was consistent with 2002. We have significant pension benefit costs and credits that are developed from actuarial valuations. The valuations reflect key assumptions regarding, among other things, discount rates, expected return on plan assets, retirement ages and years of service. Consideration is given to current market conditions, including changes in interest rates, in making these assumptions. Our assumption for the expected rate of return on pension plan assets was 9.0 percent in 2004, unchanged from 2003. Our 2005 assumption for return on assets is 8.75 percent. We recognized pension income of $6.0 million, $11.6 million and $17.1 million in 2004, 2003 and 2002 respectively, reflected as reductions to cost of products sold and SG&A. See Note 10 of Notes to Consolidated Financial Statements. We estimate that we will recognize approximately $3.5 million of pension expense in 2005. In developing our expected long-term rate of return assumption, we evaluate our pension plan’s target asset allocation, the historical long-term rates of return of equity and bond indices and the actual historical returns of our pension plan. Our plan’s target allocation to equity managers is between 60 to 70 percent, with the remainder allocated primarily to bond managers and a small allocation to private equity managers. Due to market fluctuations, our actual asset allocation as of December 31, 2004, was 71 percent to equity managers, 24 percent to bond managers, 3 percent to private equity managers and the remainder in money market instruments. We regularly review our actual asset allocation and periodically rebalance our investments to our targeted allocation when considered appropriate. Our pension plan’s historical 10-year and 25-year compounded annualized returns are 12.6 percent and 13.1 percent, respectively. We believe that with our target allocation and the historical long-term returns of equity and bond indices as well as our actual historical returns, our 8.75 percent expected return on assets for 2005 is reasonable. The discount rate that we utilize for determining future pension obligations is based on the average yield of Moody’s Aa Corporate Bonds. The discount rate determined on this basis has decreased from 6.25 percent at December 31, 2003, to 6.00
11
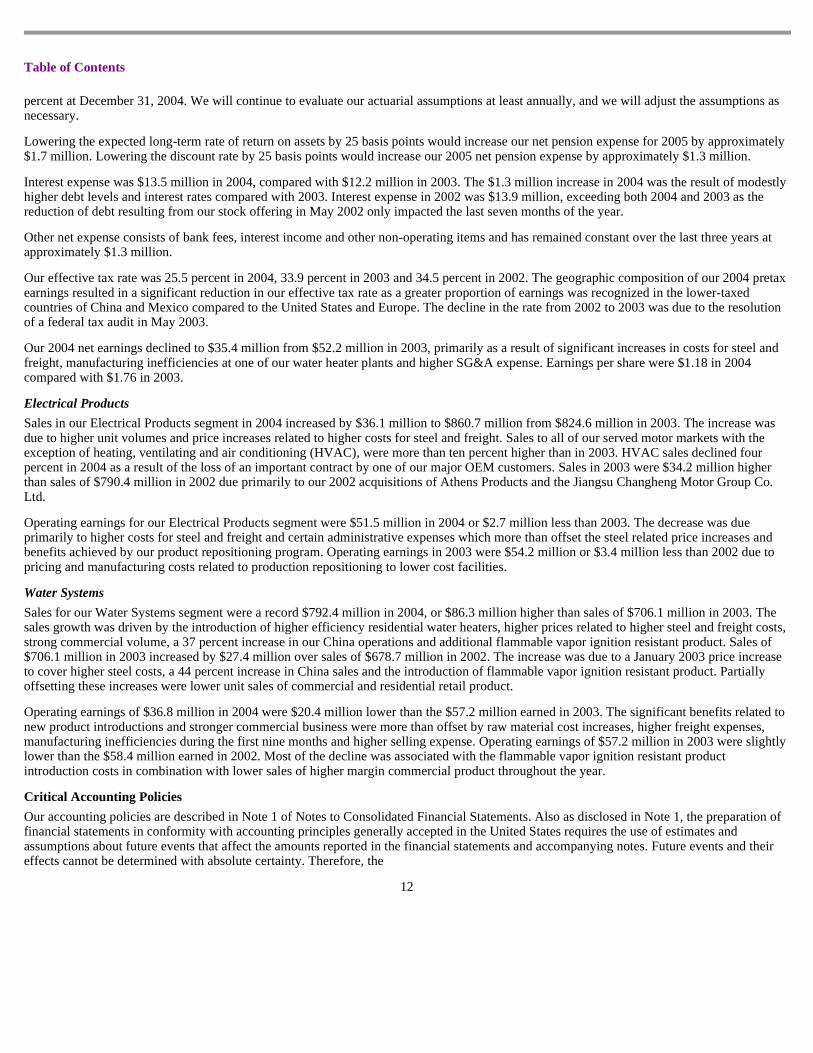
Table of Contents
percent at December 31, 2004. We will continue to evaluate our actuarial assumptions at least annually, and we will adjust the assumptions as necessary. Lowering the expected long-term rate of return on assets by 25 basis points would increase our net pension expense for 2005 by approximately $1.7 million. Lowering the discount rate by 25 basis points would increase our 2005 net pension expense by approximately $1.3 million. Interest expense was $13.5 million in 2004, compared with $12.2 million in 2003. The $1.3 million increase in 2004 was the result of modestly higher debt levels and interest rates compared with 2003. Interest expense in 2002 was $13.9 million, exceeding both 2004 and 2003 as the reduction of debt resulting from our stock offering in May 2002 only impacted the last seven months of the year. Other net expense consists of bank fees, interest income and other non-operating items and has remained constant over the last three years at approximately $1.3 million. Our effective tax rate was 25.5 percent in 2004, 33.9 percent in 2003 and 34.5 percent in 2002. The geographic composition of our 2004 pretax earnings resulted in a significant reduction in our effective tax rate as a greater proportion of earnings was recognized in the lower-taxed countries of China and Mexico compared to the United States and Europe. The decline in the rate from 2002 to 2003 was due to the resolution of a federal tax audit in May 2003. Our 2004 net earnings declined to $35.4 million from $52.2 million in 2003, primarily as a result of significant increases in costs for steel and freight, manufacturing inefficiencies at one of our water heater plants and higher SG&A expense. Earnings per share were $1.18 in 2004 compared with $1.76 in 2003. Electrical Products Sales in our Electrical Products segment in 2004 increased by $36.1 million to $860.7 million from $824.6 million in 2003. The increase was due to higher unit volumes and price increases related to higher costs for steel and freight. Sales to all of our served motor markets with the exception of heating, ventilating and air conditioning (HVAC), were more than ten percent higher than in 2003. HVAC sales declined four percent in 2004 as a result of the loss of an important contract by one of our major OEM customers. Sales in 2003 were $34.2 million higher than sales of $790.4 million in 2002 due primarily to our 2002 acquisitions of Athens Products and the Jiangsu Changheng Motor Group Co. Ltd. Operating earnings for our Electrical Products segment were $51.5 million in 2004 or $2.7 million less than 2003. The decrease was due primarily to higher costs for steel and freight and certain administrative expenses which more than offset the steel related price increases and benefits achieved by our product repositioning program. Operating earnings in 2003 were $54.2 million or $3.4 million less than 2002 due to pricing and manufacturing costs related to production repositioning to lower cost facilities. Water Systems Sales for our Water Systems segment were a record $792.4 million in 2004, or $86.3 million higher than sales of $706.1 million in 2003. The sales growth was driven by the introduction of higher efficiency residential water heaters, higher prices related to higher steel and freight costs, strong commercial volume, a 37 percent increase in our China operations and additional flammable vapor ignition resistant product. Sales of $706.1 million in 2003 increased by $27.4 million over sales of $678.7 million in 2002. The increase was due to a January 2003 price increase to cover higher steel costs, a 44 percent increase in China sales and the introduction of flammable vapor ignition resistant product. Partially offsetting these increases were lower unit sales of commercial and residential retail product. Operating earnings of $36.8 million in 2004 were $20.4 million lower than the $57.2 million earned in 2003. The significant benefits related to new product introductions and stronger commercial business were more than offset by raw material cost increases, higher freight expenses, manufacturing inefficiencies during the first nine months and higher selling expense. Operating earnings of $57.2 million in 2003 were slightly lower than the $58.4 million earned in 2002. Most of the decline was associated with the flammable vapor ignition resistant product introduction costs in combination with lower sales of higher margin commercial product throughout the year. Critical Accounting Policies Our accounting policies are described in Note 1 of Notes to Consolidated Financial Statements. Also as disclosed in Note 1, the preparation of financial statements in conformity with accounting principles generally accepted in the United States requires the use of estimates and assumptions about future events that affect the amounts reported in the financial statements and accompanying notes. Future events and their effects cannot be determined with absolute certainty. Therefore, the
12

Table of Contents
determination of estimates requires the exercise of judgment. Actual results inevitably will differ from those estimates, and such differences may be material to the financial statements. The most significant accounting estimates inherent in the preparation of our financial statements include estimates associated with the evaluation of the recoverability of certain assets including goodwill and receivables resulting from the payment of claims associated with the dip tube class action lawsuit (see Note 12 of Notes to Consolidated Financial Statements) as well as those estimates used in the determination of liabilities related to warranty activity, litigation, product liability, environmental matters, and pensions and other post-retirement benefits. Various assumptions and other factors underlie the determination of these significant estimates. The process of determining significant estimates is fact-specific and takes into account factors such as historical experience and trends, and in some cases, actuarial techniques. We constantly reevaluate these significant factors, and adjustments are made when facts and circumstances dictate. Historically, actual results have not significantly deviated from those determined using the estimates described above. Recent Accounting Pronouncements The Financial Accounting Standards Board (FASB) has issued SFAS No. 143, “Accounting for Asset Retirement Obligations,” and SFAS No. 146, “Accounting for Costs Associated with Exit or Disposal Activities.” We adopted SFAS No. 143 on January 1, 2003. Adoption of this statement did not have a material impact on our consolidated financial statements. SFAS No. 146 is effective for exit or disposal activities initiated after December 31, 2002. Adoption of this statement did not have a material impact on our consolidated financial statements. On December 16, 2004, the FASB issued SFAS No. 123 (revised 2004), Share-Based Payment, which is a revision of SFAS No. 123, Accounting for Stock-Based Compensation. SFAS No. 123(R) supersedes APB Opinion No. 25, Accounting for Stock Issued to Employees, and amends SFAS No. 95, Statement of Cash Flows. Generally, the approach in SFAS No. 123(R) is similar to the approach described in SFAS No. 123. However, SFAS No. 123(R) requires all share-based payments to employees, including grants of employee stock options, to be recognized in the income statement based on their fair values. Pro forma disclosure is no longer an alternative. SFAS No. 123(R) must be adopted no later than July 1, 2005. Early adoption will be permitted in periods in which financial statements have not yet been issued. We expect to adopt SFAS No. 123(R) on July 1, 2005. As permitted by SFAS No. 123, the company currently accounts for share-based payments to employees using APB Opinion No. 25’s intrinsic value method and, as such, generally recognizes no compensation cost for employee stock options. Accordingly, the adoption of SFAS No. 123(R)’s fair value method could have a significant impact on our results of operations, although it will have no impact on our overall financial position. The impact of adoption of SFAS No. 123(R) cannot be predicted at this time because it will depend on levels of share-based payments granted in the future. However, had we adopted SFAS No. 123(R) in prior periods, the impact of that standard would have approximated the impact of SFAS No. 123 as described in the disclosure of pro forma net earnings and earnings per share earlier in Note 1 of Notes to Consolidated Financial Statements. SFAS No. 123(R) also requires the benefits of tax deductions in excess of recognized compensation cost to be reported as a financing cash flow, rather than as an operating cash flow as required under current literature. This requirement will reduce net operating cash flows and increase net financing cash flows in periods after adoption. While the company cannot estimate what those amounts will be in the future (because they depend on, among other things, when employees exercise stock options), the amount of operating cash flows recognized in prior periods for such excess tax deductions were $2.5, $0.8 and $2.4 million in 2004, 2003 and 2002, respectively. Outlook We have implemented significant price increases in both of our businesses, the most recent increases being effective with the beginning of this year. These price increases have been put in place to offset the negative impact of material and freight cost increases. While we are generally pleased with the impact and acceptance of the new price levels, it is far too early to project their ultimate impact and acceptance. Accordingly, we have determined that we will not provide a forecast of earnings per share at this time. OTHER MATTERS Environmental Our operations are governed by a number of federal, state and local environmental laws concerning the generation and management of hazardous materials, the discharge of pollutants into the environment and remediation of sites owned by the company or third parties. We have expended financial and managerial resources complying with such laws. Expenditures related to environmental matters were not material in 2004 and are not expected to be material in any single year. Although we believe that our operations are substantially in compliance with such laws and maintain procedures designed to maintain
13

Table of Contents
compliance, there are no assurances that substantial additional costs for compliance will not be incurred in the future. However, since the same laws govern our competitors, we should not be placed at a competitive disadvantage. Market Risk We are exposed to various types of market risks, primarily currency and certain commodities. We monitor our risks in such areas on a continuous basis and generally enter into forward and futures contracts to minimize such exposures for periods of less than one year. We do not engage in speculation in our derivatives strategies. Further discussion regarding derivative instruments is contained in Note 1 of Notes to Consolidated Financial Statements. Commodity risks include raw material price fluctuations. We use futures contracts to fix the cost of our expected needs for certain raw materials (i.e. copper and aluminum) with the objective of reducing price risk. Futures contracts are purchased over time periods and at volume levels which approximate expected usage. At December 31, 2004, we had commodity futures contracts amounting to $81.0 million of commodity purchases. A hypothetical ten percent change in the underlying commodity price of such contracts would have a potential impact of $8.1 million. It is important to note that gains and losses from the company’s futures contract activities will be offset by gains and losses in the underlying commodity purchase transactions being hedged. In addition, we enter into foreign currency forward contracts to minimize the effect of fluctuating foreign currencies. At December 31, 2004, we had net foreign currency contracts outstanding of $119.2 million. Assuming a hypothetical ten percent movement in the respective currencies, the potential foreign exchange gain or loss associated with the change in rates would amount to $11.9 million. It is important to note that gains and losses from our forward contract activities will be offset by gains and losses in the underlying transactions being hedged. Our earnings exposure related to movements in interest rates is primarily derived from outstanding floating-rate debt instruments that are determined by short-term money market rates. At December 31, 2004, we had $117.5 million in outstanding floating-rate debt with a weighted-average interest rate of 2.4 percent at year end. A hypothetical ten percent annual increase or decrease in the year-end average cost of our outstanding floating-rate debt would result in a change in annual pretax interest expense of $0.3 million. Forward-Looking Statements This report contains statements that we believe are “forward-looking statements” within the meaning of the Private Securities Litigation Reform Act of 1995. Forward-looking statements generally can be identified by the use of words such as “may,” “will,” “expect,” “intend,” “estimate,” “anticipate,” “believe,” “continue” or words of similar meaning. These forward-looking statements are subject to risks and uncertainties that could cause actual results to differ materially from those anticipated as of the date of this release. Factors that could cause such a variance include the following: significant increases in raw material prices; competitive pressures on the company’s businesses; instability in the company’s electric motor and water products markets; adverse changes in general economic conditions; and the potential that assumptions on which the company based its expectations are inaccurate or will prove to be incorrect. Forward-looking statements included in this report are made only as of the date of this report, and the company is under no obligation to update these statements to reflect subsequent events or circumstances. All subsequent written and oral forward-looking statements attributed to the company, or persons acting on its behalf, are qualified entirely by these cautionary statements. ITEM 7A – QUANTITATIVE AND QUALITATIVE DISCLOSURES ABOUT MARK ET RISK See “Market Risk” above.
14

Table of Contents
ITEM 8 - FINANCIAL STATEMENTS AND SUPPLEMENTARY DATA
15
Form 10-K Page Number
Index to Financial Statements:
Report of Independent Registered Public Accounting Firm 16
Consolidated Balance Sheets at December 31, 2004 and 2003 17
For each of the three years in the period ended December 31, 2004:
- Consolidated Statement of Earnings 18
- Consolidated Statement of Comprehensive Earnings (Loss) 18
- Consolidated Statement of Cash Flows 19
- Consolidated Statement of Stockholders’ Equity 20
Notes to Consolidated Financial Statements 21-36
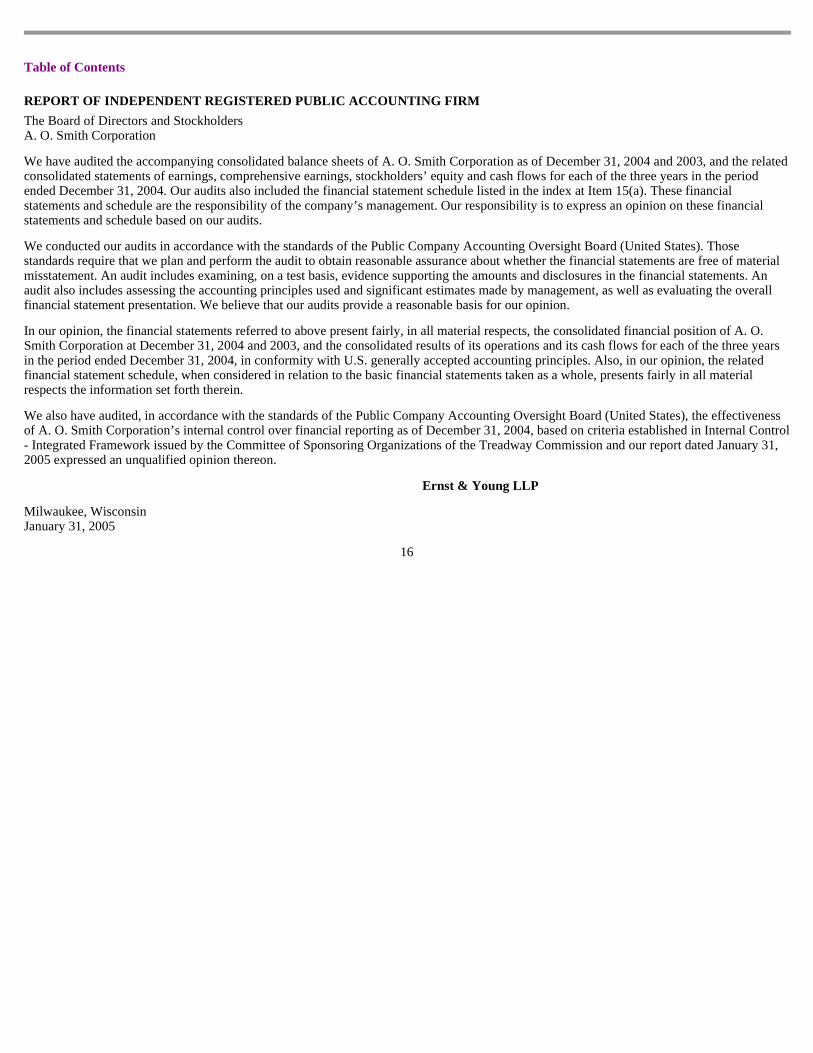
Table of Contents
REPORT OF INDEPENDENT REGISTERED PUBLIC ACCOUNTING FIRM The Board of Directors and Stockholders A. O. Smith Corporation We have audited the accompanying consolidated balance sheets of A. O. Smith Corporation as of December 31, 2004 and 2003, and the related consolidated statements of earnings, comprehensive earnings, stockholders’ equity and cash flows for each of the three years in the period ended December 31, 2004. Our audits also included the financial statement schedule listed in the index at Item 15(a). These financial statements and schedule are the responsibility of the company’s management. Our responsibility is to express an opinion on these financial statements and schedule based on our audits. We conducted our audits in accordance with the standards of the Public Company Accounting Oversight Board (United States). Those standards require that we plan and perform the audit to obtain reasonable assurance about whether the financial statements are free of material misstatement. An audit includes examining, on a test basis, evidence supporting the amounts and disclosures in the financial statements. An audit also includes assessing the accounting principles used and significant estimates made by management, as well as evaluating the overall financial statement presentation. We believe that our audits provide a reasonable basis for our opinion. In our opinion, the financial statements referred to above present fairly, in all material respects, the consolidated financial position of A. O. Smith Corporation at December 31, 2004 and 2003, and the consolidated results of its operations and its cash flows for each of the three years in the period ended December 31, 2004, in conformity with U.S. generally accepted accounting principles. Also, in our opinion, the related financial statement schedule, when considered in relation to the basic financial statements taken as a whole, presents fairly in all material respects the information set forth therein. We also have audited, in accordance with the standards of the Public Company Accounting Oversight Board (United States), the effectiveness of A. O. Smith Corporation’s internal control over financial reporting as of December 31, 2004, based on criteria established in Internal Control - Integrated Framework issued by the Committee of Sponsoring Organizations of the Treadway Commission and our report dated January 31, 2005 expressed an unqualified opinion thereon.
Ernst & Young LLP Milwaukee, Wisconsin January 31, 2005
16

Table of Contents
CONSOLIDATED BALANCE SHEETS
See accompanying notes which are an integral part of these statements.
17
December 31 (dollars in millions) 2004 2003
Restated Assets
Current Assets
Cash and cash equivalents $ 25.1 $ 18.7 Receivables 281.6 236.7 Inventories 233.5 247.0 Deferred income taxes 10.9 14.3 Other current assets 33.9 31.0
Total Current Assets 585.0 547.7
Net property, plant and equipment 358.8 367.5 Goodwill 303.8 303.8 Other intangibles 9.4 7.1 Other assets 55.8 53.8
Total Assets $ 1,312.8 $ 1,279.9
Liabilities
Current Liabilities
Short-term debt $ — $ 96.8 Trade payables 158.8 144.5 Accrued payroll and benefits 28.3 30.5 Accrued liabilities 30.9 37.7 Product warranty 17.5 18.9 Income taxes 1.1 1.6 Long-term debt due within one year 8.6 8.6
Total Current Liabilities 245.2 338.6
Long-term debt 272.5 170.1 Product warranty 42.3 43.2 Post-retirement benefit obligation 16.8 17.0 Deferred income taxes 13.8 20.6 Pension liability 87.9 61.6 Other liabilities 43.7 45.3
Total Liabilities 722.2 696.4
Commitments and contingencies (Notes 7 and 12)
Stockholders’ Equity
Preferred Stock — — Class A Common Stock (shares issued 8,522,912 and 8,530,930) 42.6 42.7 Common Stock (shares issued 24,026,450 and 24,018,432) 24.0 24.0 Capital in excess of par value 70.8 73.9 Retained earnings 648.4 631.2 Accumulated other comprehensive loss (112.3 ) (97.2 ) Unearned compensation (3.4 ) — Treasury stock at cost (79.5 ) (91.1 )
Total Stockholders’ Equity 590.6 583.5
Total Liabilities and Stockholders’ Equity $ 1,312.8 $ 1,279.9
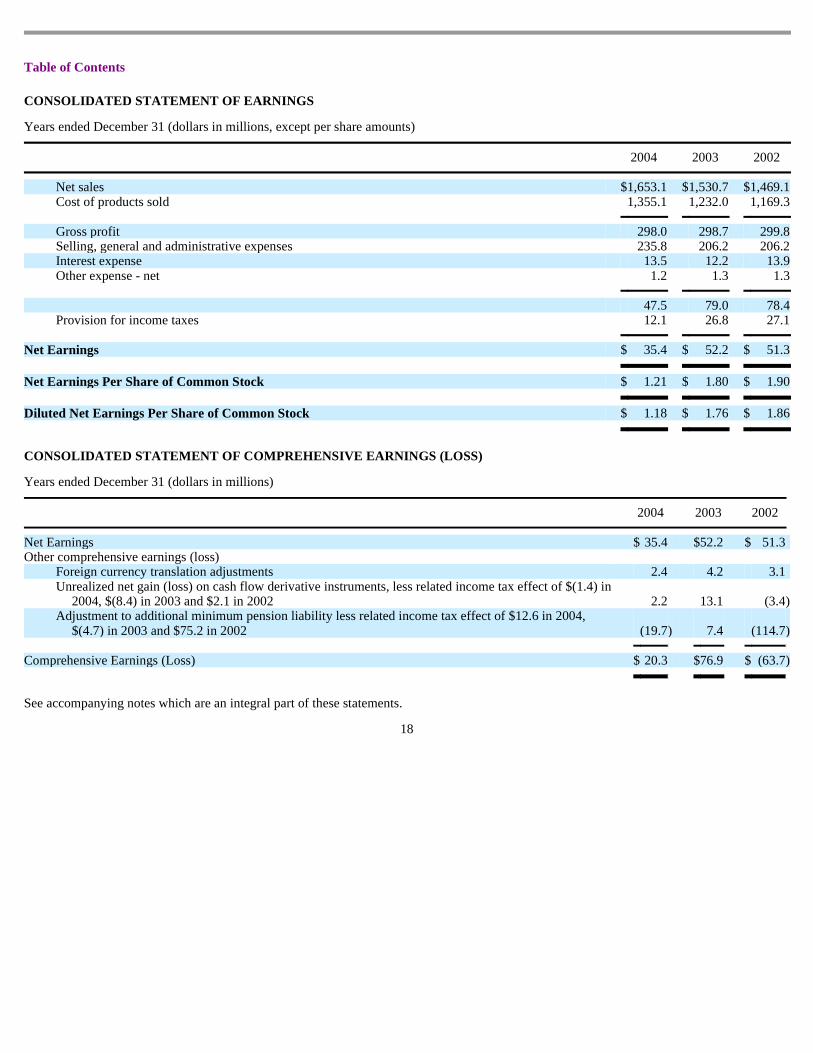
Table of Contents
CONSOLIDATED STATEMENT OF EARNINGS Years ended December 31 (dollars in millions, except per share amounts)
CONSOLIDATED STATEMENT OF COMPREHENSIVE EARNINGS (L OSS) Years ended December 31 (dollars in millions)
See accompanying notes which are an integral part of these statements.
18
2004 2003 2002
Net sales $ 1,653.1 $ 1,530.7 $ 1,469.1 Cost of products sold 1,355.1 1,232.0 1,169.3
Gross profit 298.0 298.7 299.8 Selling, general and administrative expenses 235.8 206.2 206.2 Interest expense 13.5 12.2 13.9 Other expense - net 1.2 1.3 1.3
47.5 79.0 78.4
Provision for income taxes 12.1 26.8 27.1
Net Earnings $ 35.4 $ 52.2 $ 51.3
Net Earnings Per Share of Common Stock $ 1.21 $ 1.80 $ 1.90
Diluted Net Earnings Per Share of Common Stock $ 1.18 $ 1.76 $ 1.86
2004 2003 2002
Net Earnings $ 35.4 $ 52.2 $ 51.3 Other comprehensive earnings (loss)
Foreign currency translation adjustments 2.4 4.2 3.1 Unrealized net gain (loss) on cash flow derivative instruments, less related income tax effect of $(1.4) in
2004, $(8.4) in 2003 and $2.1 in 2002 2.2 13.1 (3.4 ) Adjustment to additional minimum pension liability less related income tax effect of $12.6 in 2004,
$(4.7) in 2003 and $75.2 in 2002 (19.7 ) 7.4 (114.7 )
Comprehensive Earnings (Loss) $ 20.3 $ 76.9 $ (63.7 )

Table of Contents
CONSOLIDATED STATEMENT OF CASH FLOWS
See accompanying notes which are an integral part of these statements.
19
Years ended December 31 (dollars in millions) 2004 2003 2002
Operating Activities
Net earnings $ 35.4 $ 52.2 $ 51.3 Adjustments to reconcile net earnings to cash provided by operating activities:
Depreciation and amortization 53.9
52.1
50.7
Net change in current assets and liabilities (23.6 ) (78.2 ) 8.2 Net change in noncurrent assets and liabilities (1.3 ) (1.5 ) 2.3 Other 2.8 4.4 3.5
Cash Provided by Operating Activities 67.2 29.0 116.0
Investing Activities
Acquisition of businesses (2.3 ) (4.8 ) (23.4 ) Capital expenditures (48.4 ) (48.6 ) (46.3 )
Cash Used in Investing Activities (50.7 ) (53.4 ) (69.7 )
Financing Activities
Short-term debt retired - net — (13.7 ) — Long-term debt incurred 14.3 50.0 — Long-term debt retired (8.6 ) (11.7 ) (156.2 ) Net proceeds from common stock offering — — 127.5 Net proceeds from option activity 3.0 2.6 5.8 Dividends paid (18.2 ) (16.8 ) (14.3 )
Cash Provided by (Used in) Financing Activities (9.5 ) 10.4 (37.2 )
Cash Flow Provided by (Used in) Discontinued Operations (0.6 ) (0.1 ) 3.0
Net increase (decrease) in cash and cash equivalents 6.4 (14.1 ) 12.1 Cash and cash equivalents-beginning of year 18.7 32.8 20.7
Cash and Cash Equivalents-End of Year $ 25.1 $ 18.7 $ 32.8

Table of Contents
CONSOLIDATED STATEMENT OF STOCKHOLDERS’ EQUITY Years ended December 31 (dollars in millions)
2004 2003 2002
Restated Restated
Class A Common Stock
Balance at beginning of year $ 42.7 $ 43.0 $ 43.5 Conversion of Class A Common Stock (0.1 ) (0.3 ) (0.5 )
Balance at end of year $ 42.6 $ 42.7 $ 43.0
Common Stock
Balance at beginning of year $ 24.0 $ 24.0 $ 23.9 Conversion of Class A Common Stock — — 0.1
Balance at end of year $ 24.0 $ 24.0 $ 24.0
Capital in Excess of Par Value
Balance at beginning of year $ 73.9 $ 73.5 $ 54.8 Conversion of Class A Common Stock 0.1 0.3 0.4 Exercise of stock options (5.4 ) (0.9 ) (2.8 ) Tax benefit from exercise of stock options 2.5 0.8 2.4 Sale of Common Stock — — 18.4 Stock incentives and directors’ compensation (0.3 ) 0.2 0.3
Balance at end of year $ 70.8 $ 73.9 $ 73.5
Retained Earnings
Balance at beginning of year $ 631.2 $ 595.8 $ 551.5 Prior period adjustment (Note 11) — — 7.3 Net earnings 35.4 52.2 51.3 Cash dividends on Common Stock (18.2 ) (16.8 ) (14.3 )
Balance at end of year $ 648.4 $ 631.2 $ 595.8
Accumulated Other Comprehensive Loss
Balance at beginning of year $ (97.2 ) $ (121.9 ) $ (6.9 ) Foreign currency translation adjustments 2.4 4.2 3.1 Unrealized net gain (loss) on cash flow derivative instruments, less related income tax effect of $(1.4) in
2004, $(8.4) in 2003 and $2.1 in 2002 2.2 13.1 (3.4 ) Adjustment to additional minimum pension liability less related income tax effect of $12.6 in 2004, $(4.7) in
2003 and $75.2 in 2002 (19.7 ) 7.4 (114.7 )
Balance at end of year $ (112.3 ) $ (97.2 ) $ (121.9 )
Unearned Compensation
Balance at beginning of year $ — $ — $ — Issuance of restricted stock, net of amortization (3.4 ) — —
Balance at end of year $ (3.4 ) $ — $ —
Treasury Stock
Balance at beginning of year $ (91.1 ) $ (96.0 ) $ (214.8 ) Sale of Common Stock — — 109.0 Exercise of stock options, net of 127,352 shares surrendered as proceeds in 2004 and net of 10,325 shares
surrendered as proceeds in 2002 7.2 3.5 8.6 Stock incentives and directors’ compensation 4.4 1.4 1.2
Balance at end of year $ (79.5 ) $ (91.1 ) $ (96.0 )
Total Stockholders’ Equity $ 590.6 $ 583.5 $ 518.4

See accompanying notes which are an integral part of these statements.
20

Table of Contents
NOTES TO CONSOLIDATED FINANCIAL STATEMENTS
1. Organization and Significant Accounting Policies
Organization. A. O. Smith Corporation (the company) is a manufacturer serving customers worldwide. The company’s major product lines include fractional horsepower alternating current (A/C), direct current (D/C), hermetic and integral horsepower electric motors, as well as residential and commercial water heaters. The company’s products are manufactured and marketed primarily in North America. Electric motors are sold principally to original equipment manufacturers and distributors. Water heaters are sold principally to plumbing wholesalers and retail outlets. Consolidation. The consolidated financial statements include the accounts of the company and its wholly owned subsidiaries after elimination of intercompany transactions. Use of estimates . The preparation of financial statements in conformity with accounting principles generally accepted in the United States requires management to make estimates and assumptions that affect the amounts reported in the accompanying financial statements and notes. Actual results could differ from those estimates. Fair value of financial instruments . The carrying amounts of cash and cash equivalents, receivables and trade payables approximated fair value as of December 31, 2004 and 2003, due to the short maturities of these instruments. The carrying amount of long-term debt approximated fair value as of December 31, 2004 and 2003, based on current rates offered to the company for debt with the same or similar maturities. The fair values of derivative financial instruments are discussed later in this footnote. Foreign currency translation. For all subsidiaries outside the United States, with the exception of all Mexican operations and substantially all of the China operations of the company’s Electrical Products segment, the company uses the local currency as the functional currency. For those operations using a functional currency other than the U.S. dollar, assets and liabilities are translated into U.S. dollars at year-end exchange rates, and revenues and expenses are translated at weighted-average exchange rates. The resulting translation adjustments are recorded as a separate component of stockholders’ equity. The Mexican operations and the majority of the China operations of the company’s Electrical Products segment use the U.S. dollar as the functional currency as such operations are a direct and integral component of the company’s U.S. operations. Gains and losses from foreign currency transactions are included in net earnings. Cash and cash equivalents . The company considers all highly liquid investments, generally with a maturity of three months or less when purchased, to be cash equivalents. Inventory valuation. Inventories are carried at lower of cost or market. Cost is determined on the last-in, first-out (LIFO) method for substantially all domestic inventories, which comprise 88 percent and 91 percent of the company’s total inventory at December 31, 2004 and 2003, respectively. Inventories of foreign subsidiaries and supplies are determined using the first-in, first-out (FIFO) method. Property, plant and equipment. Property, plant and equipment are stated at cost. Depreciation is computed primarily by the straight-line method. The estimated service lives used to compute depreciation are generally 25 to 50 years for buildings and 5 to 20 years for equipment. Maintenance and repair costs are expensed as incurred. Goodwill and other intangibles. The company adopted Statement of Financial Accounting Standards (SFAS) No. 142, “Goodwill and Other Intangible Assets,” effective January 1, 2002. Under SFAS No. 142, goodwill and indefinite-lived intangible assets (totaling $3.0 million at December 31, 2004 and 2003) are no longer amortized but are reviewed for impairment on an annual basis. Separable intangible assets that are not deemed to have an indefinite life are amortized on a straight-line basis over their estimated useful lives which range from 5 to 30 years.
21

Table of Contents
Impairment of long-lived and amortizable intangible assets. Property, plant and equipment and intangible assets subject to amortization are reviewed for impairment whenever events or changes in circumstances indicate that the carrying amount may not be recoverable. If the sum of the expected undiscounted cash flows is less than the carrying value of the related asset or group of assets, a loss is recognized for the difference between the fair value and carrying value of the asset or group of assets. Such analyses necessarily involve significant judgment. Derivative instruments. SFAS No. 133, as amended, requires that all derivative instruments be recorded on the balance sheet at fair value and establishes criteria for designation and effectiveness of the hedging relationships. Any fair value changes are recorded in net earnings or other comprehensive earnings (loss). The company utilizes certain derivative instruments to enhance its ability to manage currency exposures and raw materials price risks. Derivative instruments are entered into for periods consistent with the related underlying exposures and do not constitute positions independent of those exposures. The company does not enter into contracts for speculative purposes. The contracts are executed with major financial institutions with no credit loss anticipated for failure of the counterparties to perform. Commodity Futures Contracts
1. Organization and Significant Accounting Policies (continued)
In addition to entering into supply arrangements in the normal course of business, the company also enters into futures contracts to fix the cost of certain raw material purchases, principally copper and aluminum, with the objective of minimizing changes in cost due to market price fluctuations. The commodity futures contracts are designated and accounted for as cash flow hedges of a forecasted transaction. Derivative commodity assets of $13.9 million and $15.7 million are recorded in other current assets as of December 31, 2004 and 2003, respectively. The value of the effective portion of the contracts of $13.6 million and $15.6 million as of December 31, 2004 and 2003, respectively, was recorded in accumulated other comprehensive earnings (loss), net of tax, and reclassified into cost of products sold in the period in which the underlying transaction was recorded in earnings. Ineffective portions of the commodity hedges are recorded in earnings in the period in which the ineffectiveness occurs. The impact of hedge ineffectiveness on earnings was not material in 2004, 2003 and 2002. Foreign Currency Forward Contracts The company is exposed to foreign currency exchange risk as a result of transactions in currencies other than the functional currency of certain subsidiaries. The company utilizes foreign currency forward purchase and sale contracts to manage the volatility associated with foreign currency purchases, sales and certain intercompany transactions in the normal course of business. Contracts typically have maturities of one year or less. Principal currencies include the Mexican peso, Hungarian forint, British pound, Canadian dollar, Euro and U.S. dollar. Forward contracts are designated and accounted for as cash flow hedges of a forecasted transaction. Derivative currency assets of $5.3 million as of December 31, 2004, are recorded in other current assets, and derivative currency liabilities of $1.0 million as of December 31, 2003, are recorded in accrued liabilities. Gains and losses on these instruments are recorded in accumulated other comprehensive earnings (loss), net of tax, until the underlying transaction is recorded in earnings. When the hedged item is realized, gains or losses are reclassified from accumulated other comprehensive earnings (loss) to the statement of earnings. The assessment of effectiveness for forward contracts is based on changes in the forward rates. These hedges have been determined to be perfectly effective.
22

Table of Contents
The majority of the amounts in accumulated other comprehensive earnings (loss) for cash flow hedges is expected to be reclassified into earnings within one year. The following table summarizes, by currency, the contractual amounts of the company’s foreign currency forward contracts.
The forward contracts in place at December 31, 2004 and 2003, amounted to approximately 89 percent and 92 percent, respectively, of the company’s anticipated subsequent year exposure for those currencies hedged. Revenue recognition. The company recognizes revenue upon transfer of title, which generally occurs upon shipment of the product to the customer. Contracts and customer purchase orders are generally used to determine the existence of an arrangement. Shipping documents are used to verify delivery. The company assesses whether the selling price is fixed or determinable based upon the payment terms associated with the transaction and whether the sales price is subject to refund or adjustment. The company assesses collectibility based primarily on the creditworthiness of the customer as determined by credit checks and analysis, as well as the customer’s payment history. Accruals for customer returns for defective product are based on historical experience with similar types of sales. Accruals for rebates and incentives are based on pricing agreements and are generally tied to sales volume. Changes in such accruals may be required if future returns differ from historical experience or if actual sales volume differs from estimated sales volume. Rebates and incentives are recognized as a reduction of sales. Shipping and handling costs billed to customers are included in net sales and the related costs are included in cost of products sold. Advertising. Advertising costs are charged to operations as incurred and amounted to $23.7, $18.4 and $16.2 million during 2004, 2003 and 2002, respectively. Research and development. Research and development costs are charged to operations as incurred and amounted to $35.9, $34.6 and $30.4 million during 2004, 2003 and 2002, respectively. Product warranty. The company’s products carry warranties that generally range from one to six years and are based on terms that are generally accepted in the market. The company records a liability for the expected cost of warranty-related claims at the time of sale. The allocation of our warranty liability between current and long-term is based on expected warranty claims to be paid in the next year as determined by historical product failure rates. The following table presents the company’s product warranty liability activity in 2004 and 2003:
Environmental costs. The company accrues for losses associated with environmental obligations when such losses are probable and reasonably estimable. Costs of estimated future expenditures are not discounted to their present value. Recoveries of environmental costs from other parties are recorded as assets when their receipt is considered probable. The accruals are adjusted as facts and circumstances change.
23
1. Organization and Significant Accounting Policies (continued)
December 31 (dollars in millions) 2004 2003
Buy
Sell
Buy
Sell
Euro $ 2.6 $ 6.5 $ — $ — Canadian dollar — 4.3 — 8.2 British pound — — 2.8 2.2 Hungarian forint 1.3 — 0.8 — Mexican peso 109.7 — 122.8 —
Total $ 113.6 $ 10.8 $ 126.4 $ 10.4
Years ended December 31 (dollars in millions) 2004 2003
Balance at beginning of year $ 62.1 $ 63.2 Expense 30.9 29.1 Claims settled (33.2 ) (30.2 )
Balance at end of year $ 59.8 $ 62.1

Table of Contents
Stock-based compensation. The company has one stock-based employee compensation plan (see Note 9). SFAS No. 123, “Accounting for Stock-Based Compensation,” encourages, but does not require, companies to record compensation cost for stock-based employee compensation plans at fair value. The company has chosen to continue applying Accounting Principles Board Opinion (APB) No. 25, “Accounting for Stock Issued to Employees,” and related interpretations in accounting for its stock-based compensation plan. Accordingly, because the number of shares is fixed and the exercise price of the stock options equals the market price of the underlying stock on the date of grant, no compensation expense has been recognized. Had compensation cost been determined based upon the fair value at the grant date for awards under the plans based on the provisions of SFAS No. 123, the company’s pro forma earnings and earnings per share would have been as follows:
Earnings per share of common stock. The numerator for the calculation of basic and diluted earnings per share is net earnings. The following table sets forth the computation of basic and diluted weighted-average shares used in the earnings per share calculations:
Reclassifications. Certain prior year amounts have been reclassified to conform to the 2004 presentation. New accounting standards. During 2002, the Financial Accounting Standards Board (FASB) issued SFAS No. 143, “Accounting for Asset Retirement Obligations,” and SFAS No. 146, “Accounting for Costs Associated with Exit or Disposal Activities.” SFAS No. 143 was adopted by the company on January 1, 2003. Adoption of this statement did not have a material impact on the company’s consolidated financial statements. SFAS No. 146 is effective for exit or disposal activities initiated after December 31, 2002. Adoption of this statement did not have a material impact on the company’s consolidated financial statements. On December 16, 2004, the FASB issued SFAS No. 123 (revised 2004), “Share-Based Payment”, which is a revision of SFAS No. 123, “Accounting for Stock-Based Compensation”. SFAS No. 123(R) supersedes APB Opinion No. 25, “Accounting for Stock Issued to Employees”, and amends SFAS No. 95, “Statement of Cash Flows”. Generally, the approach in SFAS No. 123(R) is similar to the approach described in SFAS No. 123. However, SFAS No. 123(R) requires all share-based payments to employees, including grants of employee stock options, to be recognized in the income statement based on their fair values. Pro forma disclosure is no longer an alternative. SFAS No. 123(R) must be adopted no later than July 1, 2005. Early adoption will be permitted in periods in which financial statements have not yet been issued. We expect to adopt SFAS No. 123(R) on July 1, 2005. SFAS No. 123(R) permits public companies to adopt its requirements using one of two methods: (1) a “modified prospective” method in which compensation cost is recognized beginning with the effective date (a) based on the requirements of SFAS No. 123(R) for all share-based payments granted after the effective date and (b) based on the requirements of SFAS No. 123 for all awards granted to employees prior to the effective date of SFAS No. 123(R) that remain unvested on the effective date; or (2) a “modified retrospective” method which includes the requirements of the modified prospective method described above, but also permits entities to restate based on the amounts previously recognized under SFAS No. 123 for purposes of pro forma disclosures.
24
1. Organization and Significant Accounting Policies (continued)
Years ended December 31 (dollars in millions, except per share amounts) 2004 2003 2002
Earnings:
As reported $ 35.4 $ 52.2 $ 51.3 Deduct: Total stock-based employee compensation expense determined under fair value based method, net of
tax (2.0 ) (1.8 ) (1.6 )
Pro forma $ 33.4 $ 50.4 $ 49.7
Earnings per share:
As reported:
Basic $ 1.21 $ 1.80 $ 1.90 Diluted 1.18 1.76 1.86
Pro forma:
Basic $ 1.14 $ 1.74 $ 1.84 Diluted 1.12 1.70 1.80
2004 2003 2002
Denominator for basic earnings per share - weighted-average shares outstanding 29,279,100 29,031,289 27,002,102 Effect of dilutive stock options and restricted stock 633,737 679,564 646,964
Denominator for diluted earnings per share 29,912,837 29,710,853 27,649,066
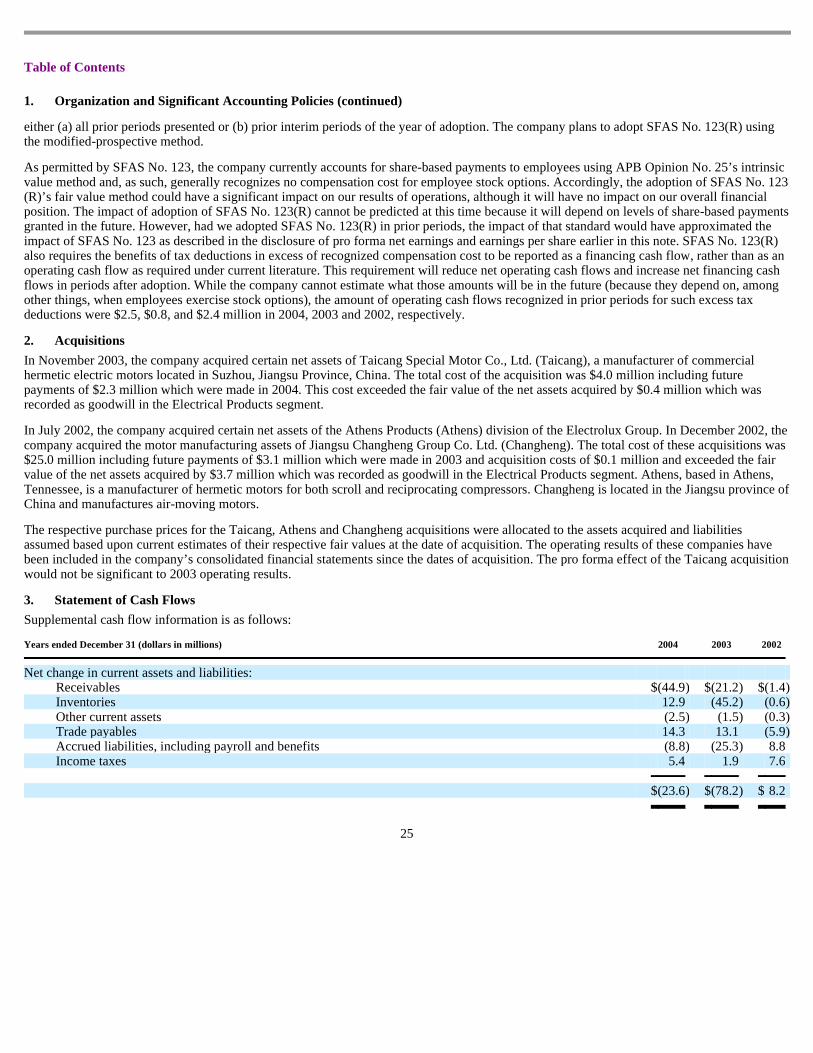
Table of Contents
either (a) all prior periods presented or (b) prior interim periods of the year of adoption. The company plans to adopt SFAS No. 123(R) using the modified-prospective method. As permitted by SFAS No. 123, the company currently accounts for share-based payments to employees using APB Opinion No. 25’s intrinsic value method and, as such, generally recognizes no compensation cost for employee stock options. Accordingly, the adoption of SFAS No. 123(R)’s fair value method could have a significant impact on our results of operations, although it will have no impact on our overall financial position. The impact of adoption of SFAS No. 123(R) cannot be predicted at this time because it will depend on levels of share-based payments granted in the future. However, had we adopted SFAS No. 123(R) in prior periods, the impact of that standard would have approximated the impact of SFAS No. 123 as described in the disclosure of pro forma net earnings and earnings per share earlier in this note. SFAS No. 123(R) also requires the benefits of tax deductions in excess of recognized compensation cost to be reported as a financing cash flow, rather than as an operating cash flow as required under current literature. This requirement will reduce net operating cash flows and increase net financing cash flows in periods after adoption. While the company cannot estimate what those amounts will be in the future (because they depend on, among other things, when employees exercise stock options), the amount of operating cash flows recognized in prior periods for such excess tax deductions were $2.5, $0.8, and $2.4 million in 2004, 2003 and 2002, respectively.
1. Organization and Significant Accounting Policies (continued)
2. Acquisitions
In November 2003, the company acquired certain net assets of Taicang Special Motor Co., Ltd. (Taicang), a manufacturer of commercial hermetic electric motors located in Suzhou, Jiangsu Province, China. The total cost of the acquisition was $4.0 million including future payments of $2.3 million which were made in 2004. This cost exceeded the fair value of the net assets acquired by $0.4 million which was recorded as goodwill in the Electrical Products segment. In July 2002, the company acquired certain net assets of the Athens Products (Athens) division of the Electrolux Group. In December 2002, the company acquired the motor manufacturing assets of Jiangsu Changheng Group Co. Ltd. (Changheng). The total cost of these acquisitions was $25.0 million including future payments of $3.1 million which were made in 2003 and acquisition costs of $0.1 million and exceeded the fair value of the net assets acquired by $3.7 million which was recorded as goodwill in the Electrical Products segment. Athens, based in Athens, Tennessee, is a manufacturer of hermetic motors for both scroll and reciprocating compressors. Changheng is located in the Jiangsu province of China and manufactures air-moving motors. The respective purchase prices for the Taicang, Athens and Changheng acquisitions were allocated to the assets acquired and liabilities assumed based upon current estimates of their respective fair values at the date of acquisition. The operating results of these companies have been included in the company’s consolidated financial statements since the dates of acquisition. The pro forma effect of the Taicang acquisition would not be significant to 2003 operating results.
3. Statement of Cash Flows
Supplemental cash flow information is as follows:
25
Years ended December 31 (dollars in millions) 2004 2003 2002
Net change in current assets and liabilities:
Receivables $ (44.9 ) $ (21.2 ) $ (1.4 ) Inventories 12.9 (45.2 ) (0.6 ) Other current assets (2.5 ) (1.5 ) (0.3 ) Trade payables 14.3 13.1 (5.9 ) Accrued liabilities, including payroll and benefits (8.8 ) (25.3 ) 8.8 Income taxes 5.4 1.9 7.6
$ (23.6 ) $ (78.2 ) $ 8.2

Table of Contents
4. Inventories
December 31 (dollars in millions) 2004 2003
Finished products $ 141.6 $ 153.8 Work in process 57.7 48.2 Raw materials 81.7 70.8
Inventories, at FIFO cost 281.0 272.8 LIFO reserve 47.5 25.8 $ 233.5 $ 247.0
5. Property, Plant and Equipment
December 31 (dollars in millions) 2004 2003
Land $ 9.3 $ 10.9 Buildings 136.8 140.0 Equipment 606.6 568.0 Software 21.1 19.4 773.8 738.3 Less accumulated depreciation and amortization 415.0 370.8 $ 358.8 $ 367.5
6. Goodwill
In connection with the adoption of SFAS No. 142, the company completed the transitional goodwill impairment test that required the company to compare the fair value of its reporting units to the carrying value of the net assets of the respective reporting units as of January 1, 2002. Based on this analysis, the company concluded that no impairment existed at the time of adoption, and, accordingly, the company has not recognized any transitional impairment loss. Additionally, the company concluded that no impairment existed at the time of the annual impairment tests which were performed in the fourth quarter of 2004, 2003 and 2002, respectively. The two reporting units used to test goodwill for impairment are Electrical Products and Water Systems. There were no changes in the carrying amount of goodwill in 2004. Changes in the carrying amount of goodwill during the year ended December 31, 2003, consisted of the following:
(dollars in millions)
Electrical
Products Water
Systems Total
Balance at December 31, 2002 $ 233.8 $ 68.6 $ 302.4 Acquisition of business (see Note 2) 0.4 — 0.4 Adjustment to finalize 2002 acquisitions 1.0 — 1.0
Balance at December 31, 2003 $ 235.2 $ 68.6 $ 303.8
7. Debt and Lease Commitments
December 31 (dollars in millions) 2004 2003
Bank credit lines, average year-end interest rate of 2.8% for 2004 and 1.7% for 2003 $ 6.6 $ 6.5 Commercial paper, average year-end interest rate of 2.4% for 2004 and 1.4% for 2003 104.5 90.3 Term notes with insurance companies, expiring through 2018, average year-end interest rate of 6.2% for
2004 and 6.3% for 2003 157.5 166.2 Other notes, expiring through 2012, average year-end interest rate of 2.5% for 2004 and 2003 12.5 12.5 281.1 275.5 Less short-term debt — 96.8 Less long-term debt due within one year 8.6 8.6

26
Long-term debt $ 272.5 $ 170.1

Table of Contents
The company has a $265 million multi year revolving credit agreement with a group of eight financial institutions, which expires on June 10, 2009. Borrowings under the company’s bank credit lines and commercial paper borrowings are supported by the revolving credit agreement. As a result of the long-term nature of this facility, the commercial paper and credit line borrowings are classified as long-term debt at December 31, 2004. At its option, the company maintains either cash balances or pays fees for bank credit and services. During June 2003, the company issued an additional $50 million in senior notes with two insurance companies. The notes range in maturity between 2013 and 2016 and carry a weighted-average interest rate of slightly less than 4.5 percent. The proceeds of the notes were used to repay commercial paper and revolver borrowing. Scheduled maturities of long-term debt within each of the five years subsequent to December 31, 2004, are as follows: 2005-$8.6; 2006-$6.9; 2007-$6.9; 2008-$15.6; 2009-$128.6 million. Future minimum payments under non-cancelable operating leases relating mostly to office, manufacturing and warehouse facilities total $62.9 million and are due as follows: 2005-$14.4; 2006-$11.0; 2007-$9.7; 2008-$7.0; 2009-$4.6; and thereafter-$16.2 million. Rent expense, including payments under operating leases, was $25.2, $22.4 and $22.0 million in 2004, 2003 and 2002, respectively. Interest paid by the company was $13.5, $12.2 and $13.9 million in 2004, 2003 and 2002, respectively.
7. Debt and Lease Commitments (continued)
8. Stockholders’ Equity
The company’s authorized capital consists of 3 million shares of Preferred Stock $1 par value, 14 million shares of Class A Common Stock $5 par value, and 60 million shares of Common Stock $1 par value. The Common Stock has equal dividend rights with Class A Common Stock and is entitled, as a class, to elect 25 percent of the Board of Directors and has 1/10th vote per share on all other matters. On May 10, 2002, the company completed the sale of 4,776,065 shares of Common Stock held in treasury. The $127.5 million net proceeds from the offering were used to reduce long-term debt. During 2004, 2003 and 2002, 8,018, 64,505 and 91,049 shares, respectively, of Class A Common Stock were converted into Common Stock. Regular dividends paid on the Class A Common Stock and Common Stock amounted to $.62, $.58 and $.54 per share in 2004, 2003 and 2002, respectively. At December 31, 2004, 32,595 and 2,851,637, shares of Class A Common Stock and Common Stock, respectively, were held as treasury stock. At December 31, 2003, 32,595 and 3,270,754 shares of Class A Common Stock and Common Stock, respectively, were held as treasury stock. Accumulated other comprehensive loss is as follows:
December 31 (dollars in millions) 2004 2003
Cumulative foreign currency translation adjustments $ 3.2 $ 0.8 Unrealized net gain on cash flow derivative instruments 11.5 9.3 Additional minimum pension liability (127.0 ) (107.3 ) $ (112.3 ) $ (97.2 )
9. Stock Options and Restricted Stock
The company adopted the A. O. Smith Combined Executive Incentive Compensation Plan (the “plan”) effective January 1, 2002. The plan superceded and replaced two predecessor incentive compensation plans. The plan provides for the issuance of 1.5 million stock options at exercise prices equal to the fair value of Common Stock on the date of grant. Additionally, any shares that would have been available for stock option grants under either of the predecessor plans, if such plans were in effect, will be available for granting of stock option awards under the plan. Of the 228,300 options granted in 2004, 71,700 become exercisable one year from date of grant and 156,600 become exercisable three years from date of grant. The options granted in 2003 and 2002 become exercisable one year from date of grant. For active employees, all options granted in 2004, 2003 and
27

Table of Contents
2002 expire ten years after date of grant. The number of shares available for granting of options at December 31, 2004, was 613,050. Participants may also be awarded shares of restricted stock under the plan. The company granted 149,000, 49,100 and 49,000 shares of restricted Common Stock under the plan in 2004, 2003 and 2002, respectively. The restricted shares were valued at $3.9, $1.4 and $1.3 million at the date of issuance in 2004, 2003 and 2002, respectively, and will be recognized as compensation expense ratably over the three-year vesting period. Compensation expense of $1.5, $0.6 and $0.1 million was recognized in 2004, 2003 and 2002, respectively. Changes in option shares, all of which are Common Stock, were as follows:
The following table summarizes weighted-average information by range of exercise prices for stock options outstanding and exercisable at December 31, 2004:
The weighted-average fair value per option at the date of grant during 2004, 2003 and 2002, using the Black-Scholes option-pricing model, was $10.31, $11.14 and $9.71, respectively. Assumptions were as follows:
28
9. Stock Options and Restricted Stock (continued)
Weighted-Avg.
Per Share Exercise Price
Years Ended December 31
2004
2003
2002
Outstanding at beginning of year $ 19.67 2,724,600 2,585,000 2,733,600
Granted
2004—$23.98 to $35.29 per share 26.45 228,300
2003—$28.70 per share 286,400
2002—$26.88 per share 296,400
Exercised
2004—$13.56 to $18.31 per share 16.63 (311,700 )
2003—$16.33 to $18.33 per share (146,800 )
2002—$8.67 to $18.33 per share (432,400 )
Expired
2002—$27.25 to $29.03 per share — — (12,600 )
Outstanding at end of year
(2004—$13.56 to $35.29 per share) 20.61 2,641,200 2,724,600 2,585,000
Exercisable at end of year 20.06 2,412,900 2,438,200 2,288,600
Range of Exercise Prices
Options Outstanding at
December 31,
2004
Weighted-
Average Exercise
Price
Options Exercisable at
December 31,
2004
Weighted-
Average Exercise
Price
Weighted- Average
Remaining Contractual
Life
$13.56 524,400 $ 13.56 524,400 $ 13.56 6 years $15.14 to $18.33 977,300 16.22 977,300 16.22 5 years $23.98 to $35.29 1,139,500 27.62 911,200 27.91 8 years 2,641,200 2,412,900
2004 2003 2002
Expected life (years) 6.5 6.4 6.3 Risk-free interest rate 4.0 % 3.7 % 3.3 % Dividend yield 2.2 % 2.2 % 2.2 % Expected volatility 43.3 % 43.9 % 41.3 %

Table of Contents
10. Pension and Other Post-retirement Benefits
The company provides retirement benefits for all United States employees including benefits for employees of discontinued operations which were earned up to the date of sale. The company also has several foreign pension plans, none of which are material to the company’s financial position. The company has a defined-contribution profit sharing and retirement plan covering the majority of its salaried nonunion employees which provides for annual company contributions of 35 percent to 140 percent of qualifying contributions made by participating employees. The amount of the company’s contribution in excess of 35 percent is dependent upon the company’s profitability. The company also has defined-contribution plans for certain hourly employees which provide for annual matching company contributions. The company has several unfunded defined-benefit post-retirement plans covering certain hourly and salaried employees that provide medical and life insurance benefits from retirement to age 65. Certain hourly employees retiring after January 1, 1996, are subject to a maximum annual benefit and salaried employees hired after December 31, 1993, are not eligible for post-retirement medical benefits. Obligations and Funded Status The following tables present the changes in benefit obligations, plan assets and funded status for domestic pension and post-retirement plans and the components of net periodic benefit costs.
29
Pension Benefits
Post-retirement Benefits
Years ended December 31 (dollars in millions) 2004 2003 2004 2003
Change in benefit obligations
Benefit obligation at beginning of year $ (751.3 ) $ (703.9 ) $ (17.3 ) $ (18.2 ) Service cost (8.6 ) (7.5 ) (0.2 ) (0.2 ) Interest cost (46.3 ) (46.8 ) (1.0 ) (1.1 ) Participant contributions — — (0.5 ) (0.6 ) Plan amendments (0.1 ) 7.8 — (0.2 ) Actuarial (losses) gains including assumption changes (28.6 ) (56.5 ) (0.5 ) 1.1 Benefits paid 55.4 55.6 1.7 1.9
Benefit obligation at end of year $ (779.5 ) $ (751.3 ) $ (17.8 ) $ (17.3 )
Change in plan assets
Fair value of plan assets at beginning of year $ 667.1 $ 592.8 $ — $ — Actual return on plan assets 56.0 127.9 — — Contribution by the company 0.2 2.0 1.2 1.3 Participant contributions — — 0.5 0.6 Benefits paid (55.4 ) (55.6 ) (1.7 ) (1.9 )
Fair value of plan assets at end of year $ 667.9 $ 667.1 $ — $ —
Benefit obligations in excess of plan assets $ (111.6 ) $ (84.2 ) $ (17.8 ) $ (17.3 ) Unrecognized net actuarial loss (gain) 234.5 200.6 (0.7 ) (1.4 ) Unrecognized prior service cost (credit) (0.4 ) (0.2 ) 0.1 —
Net amount recognized $ 122.5 $ 116.2 $ (18.4 ) $ (18.7 )
Amounts recognized in the statement of financial position:
Accumulated other comprehensive loss before tax $ 210.4 $ 177.8 $ — $ — Current liabilities — — (1.6 ) (1.7 ) Non-current liabilities (87.9 ) (61.6 ) (16.8 ) (17.0 )
Net amount recognized $ 122.5 $ 116.2 $ (18.4 ) $ (18.7 )
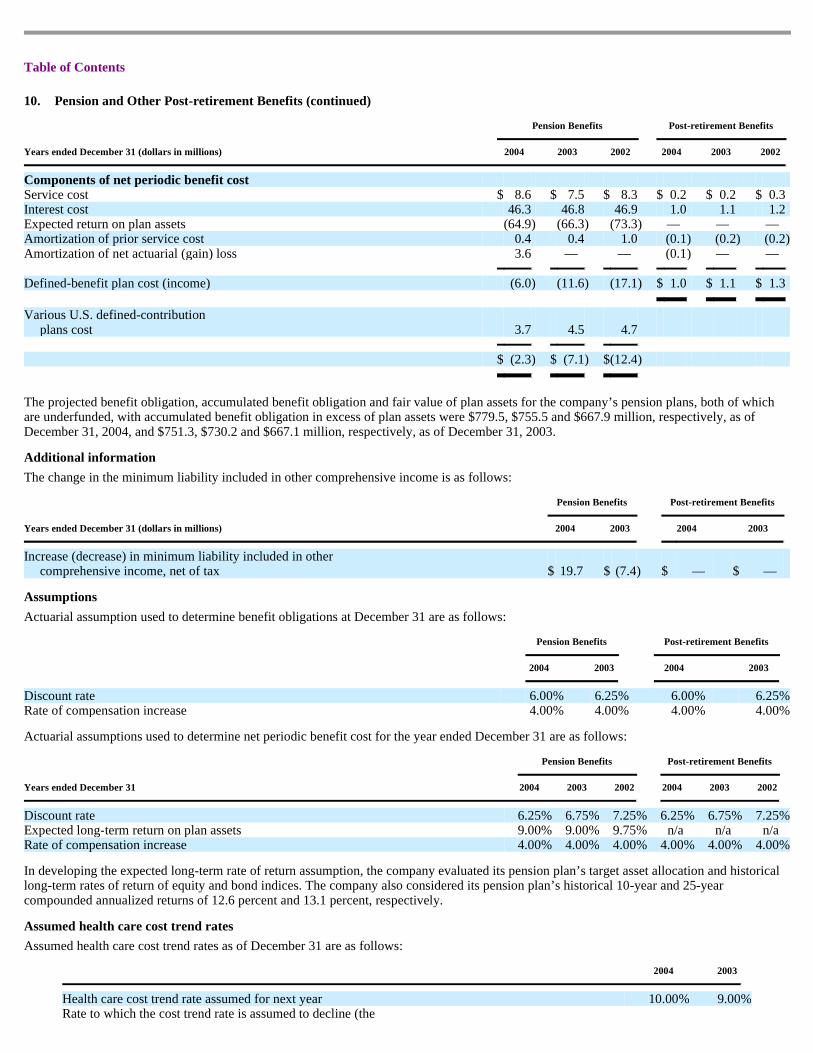
Table of Contents
The projected benefit obligation, accumulated benefit obligation and fair value of plan assets for the company’s pension plans, both of which are underfunded, with accumulated benefit obligation in excess of plan assets were $779.5, $755.5 and $667.9 million, respectively, as of December 31, 2004, and $751.3, $730.2 and $667.1 million, respectively, as of December 31, 2003. Additional information
10. Pension and Other Post-retirement Benefits (continued)
Pension Benefits
Post-retirement Benefits
Years ended December 31 (dollars in millions) 2004 2003 2002 2004 2003 2002
Components of net periodic benefit cost
Service cost $ 8.6 $ 7.5 $ 8.3 $ 0.2 $ 0.2 $ 0.3 Interest cost 46.3 46.8 46.9 1.0 1.1 1.2 Expected return on plan assets (64.9 ) (66.3 ) (73.3 ) — — — Amortization of prior service cost 0.4 0.4 1.0 (0.1 ) (0.2 ) (0.2 ) Amortization of net actuarial (gain) loss 3.6 — — (0.1 ) — —
Defined-benefit plan cost (income) (6.0 ) (11.6 ) (17.1 ) $ 1.0 $ 1.1 $ 1.3
Various U.S. defined-contribution plans cost 3.7 4.5 4.7
$ (2.3 ) $ (7.1 ) $ (12.4 )
The change in the minimum liability included in other comprehensive income is as follows:
Assumptions
Pension Benefits
Post-retirement Benefits
Years ended December 31 (dollars in millions) 2004 2003 2004 2003
Increase (decrease) in minimum liability included in other comprehensive income, net of tax $ 19.7 $ (7.4 ) $ — $ —
Actuarial assumption used to determine benefit obligations at December 31 are as follows:
Actuarial assumptions used to determine net periodic benefit cost for the year ended December 31 are as follows:
In developing the expected long-term rate of return assumption, the company evaluated its pension plan’s target asset allocation and historical long-term rates of return of equity and bond indices. The company also considered its pension plan’s historical 10-year and 25-year compounded annualized returns of 12.6 percent and 13.1 percent, respectively. Assumed health care cost trend rates
Pension Benefits
Post-retirement Benefits
2004 2003 2004 2003
Discount rate 6.00 % 6.25 % 6.00 % 6.25 % Rate of compensation increase 4.00 % 4.00 % 4.00 % 4.00 %
Pension Benefits
Post-retirement Benefits
Years ended December 31 2004 2003 2002 2004 2003 2002
Discount rate 6.25 % 6.75 % 7.25 % 6.25 % 6.75 % 7.25 % Expected long-term return on plan assets 9.00 % 9.00 % 9.75 % n/a n/a n/a Rate of compensation increase 4.00 % 4.00 % 4.00 % 4.00 % 4.00 % 4.00 %
Assumed health care cost trend rates as of December 31 are as follows:
2004 2003
Health care cost trend rate assumed for next year 10.00 % 9.00 % Rate to which the cost trend rate is assumed to decline (the

30
ultimate trend rate) 5.00 % 5.00 % Year that the rate reaches the ultimate trend rate 2010 2009
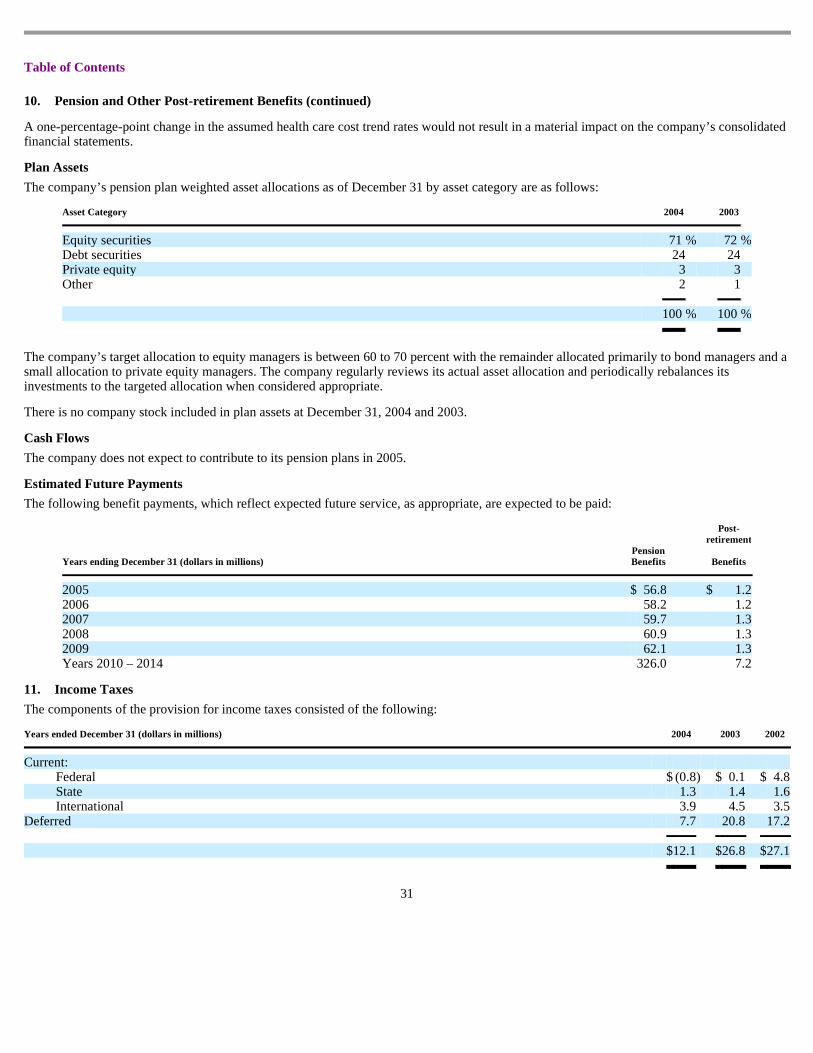
Table of Contents
A one-percentage-point change in the assumed health care cost trend rates would not result in a material impact on the company’s consolidated financial statements. Plan Assets
10. Pension and Other Post-retirement Benefits (continued)
The company’s pension plan weighted asset allocations as of December 31 by asset category are as follows:
The company’s target allocation to equity managers is between 60 to 70 percent with the remainder allocated primarily to bond managers and a small allocation to private equity managers. The company regularly reviews its actual asset allocation and periodically rebalances its investments to the targeted allocation when considered appropriate. There is no company stock included in plan assets at December 31, 2004 and 2003. Cash Flows
Asset Category 2004 2003
Equity securities 71 % 72 % Debt securities 24 24 Private equity 3 3 Other 2 1 100 % 100 %
The company does not expect to contribute to its pension plans in 2005. Estimated Future Payments The following benefit payments, which reflect expected future service, as appropriate, are expected to be paid:
Years ending December 31 (dollars in millions) Pension Benefits
Post- retirement
Benefits
2005 $ 56.8 $ 1.2 2006 58.2 1.2 2007 59.7 1.3 2008 60.9 1.3 2009 62.1 1.3 Years 2010 – 2014 326.0 7.2
11. Income Taxes
The components of the provision for income taxes consisted of the following:
31
Years ended December 31 (dollars in millions) 2004 2003 2002
Current:
Federal $ (0.8 ) $ 0.1 $ 4.8 State 1.3 1.4 1.6 International 3.9 4.5 3.5
Deferred 7.7 20.8 17.2 $ 12.1 $ 26.8 $ 27.1

Table of Contents
The provision for income taxes differs from the U.S. federal statutory rate due to the following items:
Components of earnings before income taxes were as follows:
Total taxes paid (tax refunds received) by the company for continuing and discontinued operations amounted to $(2.1), 6.7 and $(10.6) million in 2004, 2003 and 2002, respectively. No provision for U.S. income taxes or foreign withholding taxes has been made on the undistributed earnings of foreign subsidiaries as such earnings are considered to be permanently invested. At December 31, 2004, the undistributed earnings amounted to $91.2 million. Determination of the amount of unrecognized deferred tax liability on the undistributed earnings is not practicable. In addition, no provision or benefits for U.S. income taxes have been made on foreign currency translation gains or losses. The tax effects of temporary differences of assets and liabilities between income tax and financial reporting are as follows:
These deferred tax assets and liabilities are classified in the balance sheet as current or long-term based on the balance sheet classification of the related assets and liabilities as follows:
11. Income Taxes (continued)
Years ended December 31 2004 2003 2002
Provision at U.S. federal statutory rate 35.0 % 35.0 % 35.0 % State income and franchise taxes, net of federal benefit 2.6 3.1 3.5 International income tax rate differential (12.5 ) (3.5 ) (2.3 ) Research tax credits — (1.2 ) (1.3 ) Other 0.4 0.5 (0.4 ) 25.5 % 33.9 % 34.5 %
Years ended December 31 (dollars in millions) 2004 2003 2002
United States $ 23.2 $ 60.0 $ 63.5 International 24.3 19.0 14.9 $ 47.5 $ 79.0 $ 78.4
December 31 (dollars in millions)
2004
2003
Assets Liabilities Assets Liabilities
Employee benefits $ 52.8 $ — $ 42.3 $ — Recoverable dip tube costs — 13.1 — 13.1 Product liability and warranty 35.4 — 36.2 — Depreciation differences — 37.6 — 37.6 Amortization differences — 36.7 — 31.2 Derivative instruments — 7.5 — 6.0 Tax loss and credit carryovers 8.3 — 6.1 — All other 1.7 3.8 2.3 3.9 Valuation allowance (2.4 ) — (1.4 ) — $ 95.8 $ 98.7 $ 85.5 $ 91.8
Net liability $ (2.9 ) $ (6.3 )
December 31 (dollars in millions) 2004 2003
Current deferred income tax assets $ 10.9 $ 14.3 Long-term deferred income tax liabilities (13.8 ) (20.6 )
Net liability $ (2.9 ) $ (6.3 )

As a result of the acquisition of State, the company has $2.6 million of federal net operating loss carryovers that expire in 2021, $6.5 million of federal capital loss carryovers that expire in 2006 and $3.4 million of tax credits, the majority of which have an unlimited carryover period.
32

Table of Contents
The company has foreign net operating loss carryovers with tax benefits of $2.4 million. Of the $2.4 million of tax benefits, $0.8 million have an unlimited carryover period and $1.6 million expire between 2006 and 2009. Based on future realizability, a valuation allowance of $2.4 million has been established against the foreign net operating loss carryover tax benefits. The company also has approximately $148 million of state and local net operating loss carryovers. The majority of these carryovers expire between 2010 and 2024. The company recorded a $7.3 million prior period adjustment to increase retained earnings and decrease the amount of deferred tax liabilities recorded as of the beginning of the reporting period. This adjustment was recorded to recognize differences that existed between the originally recorded amount of deferred tax liabilities related to property, plant and equipment and the amount that should have been recorded based on timing differences between financial reporting and tax reporting. The company determined that the cumulative difference dated back to 1999 and prior periods. Accordingly, retained earnings as of the beginning of the reporting period was adjusted. Previously issued net earnings for 2003 and 2002 were not adjusted as the differences described above were not material to those periods.
11. Income Taxes (continued)
12. Litigation and Insurance Matters
The company is involved in various unresolved legal actions, administrative proceedings and claims in the ordinary course of its business involving product liability, property damage, insurance coverage, patents and environmental matters, including the disposal of hazardous waste. Although it is not possible to predict with certainty the outcome of these unresolved legal actions or the range of possible loss or recovery, the company believes these unresolved legal actions will not have a material effect on its financial position or results of operations. The following paragraphs summarize noteworthy actions and proceedings. In 1999, a class action lawsuit was filed in the United States District Court, Western District of Missouri, by individuals on behalf of themselves and all persons throughout the United States who have owned or currently own a water heater manufactured by Rheem Manufacturing Company, A. O. Smith Corporation, Bradford White Company, American Water Heater Company, Lochinvar Corporation, and State Industries, Inc. (the “water heater manufacturers”) that contains a dip tube manufactured, designed, supplied or sold by Perfection Corporation between August 1993 and October 1996. A dip tube is a plastic tube in a residential water heater that brings the cold water supply to the bottom area of the tank to be heated. The plaintiffs and the water heater manufacturers reached a settlement of this lawsuit which the Court approved in 2000. The water heater manufacturers paid the settlement, and all other legal actions brought against the water heater manufacturers related to dip tube claims have been dismissed as a result of the settlement of the class action. Separately, the water heater manufacturers in late 1999 filed a direct action lawsuit in the Civil District Court for the Parish of Orleans, State of Louisiana, against Perfection Corporation and American Meter Company, the parent company of Perfection Corporation, and their insurers to recover various damages caused by deteriorating dip tubes that were manufactured by Perfection Corporation. The trial was completed, the jury finished its deliberations and returned a verdict on some, but not all, of the claims presented at trial. On July 8, 2004, the Judge entered an order of partial judgment finding Perfection Corporation liable to the water heater manufacturers for breach of express warranty and for contribution and awarded $19.3 million with judicial interest from the filing of the lawsuit. The judgment also rejected all of Perfection Corporation’s claims against the water heater manufacturers and the water heater manufacturers’ claim for breach of contract against Perfection Corporation. The Judge ordered a new trial on the water heater manufacturers’ other claims against Perfection Corporation and the claim against American Meter Company asserting that it is liable for the acts of Perfection Corporation. The water heater manufacturers are seeking to recover an additional $77 million in damages at the new trial, being the amount the jurors in the first trial assigned to the claims for which they were not able to reach a verdict. The date of that trial has not been established. The judgment entered on July 8, 2004, cannot be appealed until the new trial has been completed and a judgment entered. It is likely that all or part of the judgments will be appealed by one or more parties adversely affected by the judgments. The appeals process could take from one to three years to complete. Perfection Corporation sued the water heater manufacturers in a separate action in Cook County, Illinois. The filing by Perfection Corporation was an attempt to preempt the Louisiana lawsuit. This action was dismissed.
33
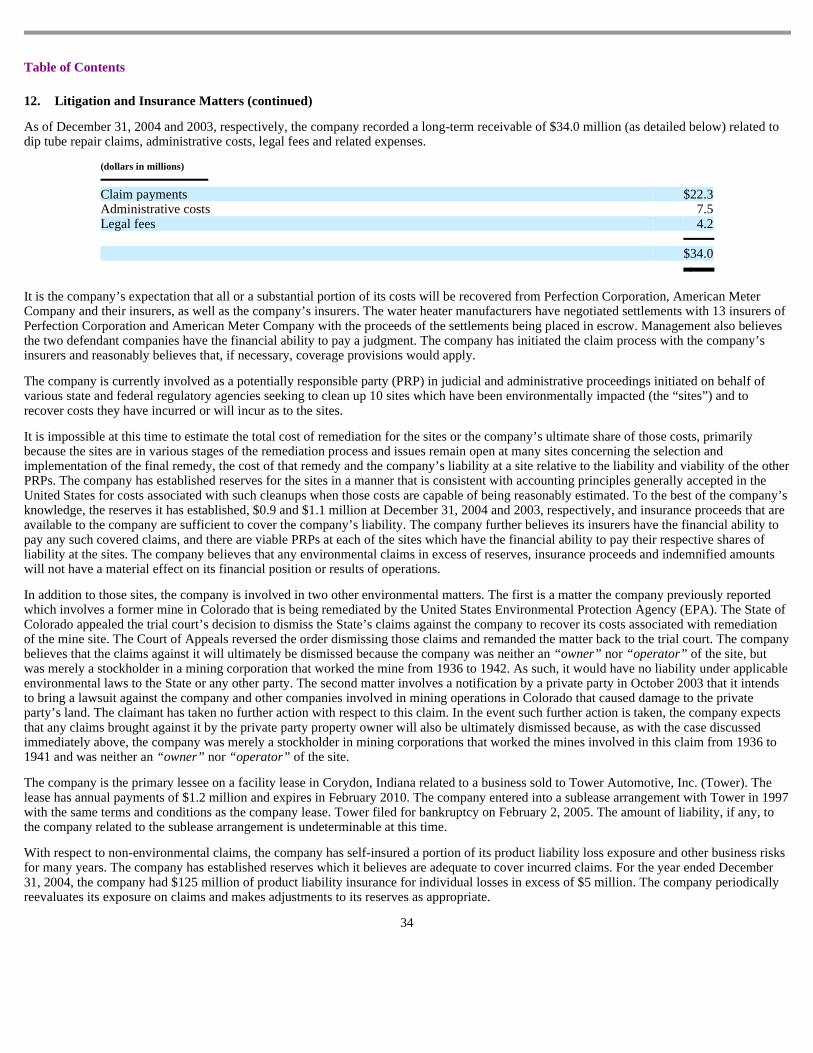
Table of Contents
As of December 31, 2004 and 2003, respectively, the company recorded a long-term receivable of $34.0 million (as detailed below) related to dip tube repair claims, administrative costs, legal fees and related expenses.
It is the company’s expectation that all or a substantial portion of its costs will be recovered from Perfection Corporation, American Meter Company and their insurers, as well as the company’s insurers. The water heater manufacturers have negotiated settlements with 13 insurers of Perfection Corporation and American Meter Company with the proceeds of the settlements being placed in escrow. Management also believes the two defendant companies have the financial ability to pay a judgment. The company has initiated the claim process with the company’s insurers and reasonably believes that, if necessary, coverage provisions would apply. The company is currently involved as a potentially responsible party (PRP) in judicial and administrative proceedings initiated on behalf of various state and federal regulatory agencies seeking to clean up 10 sites which have been environmentally impacted (the “sites”) and to recover costs they have incurred or will incur as to the sites. It is impossible at this time to estimate the total cost of remediation for the sites or the company’s ultimate share of those costs, primarily because the sites are in various stages of the remediation process and issues remain open at many sites concerning the selection and implementation of the final remedy, the cost of that remedy and the company’s liability at a site relative to the liability and viability of the other PRPs. The company has established reserves for the sites in a manner that is consistent with accounting principles generally accepted in the United States for costs associated with such cleanups when those costs are capable of being reasonably estimated. To the best of the company’s knowledge, the reserves it has established, $0.9 and $1.1 million at December 31, 2004 and 2003, respectively, and insurance proceeds that are available to the company are sufficient to cover the company’s liability. The company further believes its insurers have the financial ability to pay any such covered claims, and there are viable PRPs at each of the sites which have the financial ability to pay their respective shares of liability at the sites. The company believes that any environmental claims in excess of reserves, insurance proceeds and indemnified amounts will not have a material effect on its financial position or results of operations. In addition to those sites, the company is involved in two other environmental matters. The first is a matter the company previously reported which involves a former mine in Colorado that is being remediated by the United States Environmental Protection Agency (EPA). The State of Colorado appealed the trial court’s decision to dismiss the State’s claims against the company to recover its costs associated with remediation of the mine site. The Court of Appeals reversed the order dismissing those claims and remanded the matter back to the trial court. The company believes that the claims against it will ultimately be dismissed because the company was neither an “owner” nor “operator” of the site, but was merely a stockholder in a mining corporation that worked the mine from 1936 to 1942. As such, it would have no liability under applicable environmental laws to the State or any other party. The second matter involves a notification by a private party in October 2003 that it intends to bring a lawsuit against the company and other companies involved in mining operations in Colorado that caused damage to the private party’s land. The claimant has taken no further action with respect to this claim. In the event such further action is taken, the company expects that any claims brought against it by the private party property owner will also be ultimately dismissed because, as with the case discussed immediately above, the company was merely a stockholder in mining corporations that worked the mines involved in this claim from 1936 to 1941 and was neither an “owner” nor “operator” of the site. The company is the primary lessee on a facility lease in Corydon, Indiana related to a business sold to Tower Automotive, Inc. (Tower). The lease has annual payments of $1.2 million and expires in February 2010. The company entered into a sublease arrangement with Tower in 1997 with the same terms and conditions as the company lease. Tower filed for bankruptcy on February 2, 2005. The amount of liability, if any, to the company related to the sublease arrangement is undeterminable at this time. With respect to non-environmental claims, the company has self-insured a portion of its product liability loss exposure and other business risks for many years. The company has established reserves which it believes are adequate to cover incurred claims. For the year ended December 31, 2004, the company had $125 million of product liability insurance for individual losses in excess of $5 million. The company periodically reevaluates its exposure on claims and makes adjustments to its reserves as appropriate.
34
12. Litigation and Insurance Matters (continued)
(dollars in millions)
Claim payments $ 22.3 Administrative costs 7.5 Legal fees 4.2 $ 34.0

Table of Contents
13. Operations by Segment
The company has two reportable segments: Electrical Products and Water Systems. The Electrical Products segment manufactures fractional horsepower alternating current (A/C) and direct current (D/C) and integral horsepower motors used in fans and blowers in furnaces, air conditioners and ventilating systems; industrial applications such as material handling; as well as in other consumer products such as home appliances and pumps, swimming pools, hot tubs and spas. In addition, the Electrical Products segment manufactures hermetic motors which are sold worldwide to manufacturers of compressors used in air conditioning and refrigeration systems. The Water Systems segment manufactures residential gas and electric water heaters as well as commercial water heating equipment used in a wide range of applications including hotels, laundries, car washes, factories and large institutions. In addition, the Water Systems segment manufactures copper tube boilers used in large-volume hot water and hydronic heating applications. The accounting policies of the reportable segments are the same as those described in the “Summary of Significant Accounting Policies” outlined in Note 1. Intersegment sales have been excluded from segment revenues and are immaterial. Operating earnings, defined by the company as earnings before interest, taxes, general corporate and corporate research and development expenses, is used to measure the performance of the segments and allocate resources.
There were no sales to customers exceeding 10% of consolidated net sales in 2004. Net sales of the Electrical Products segment include sales to York International Corporation of $157.3 and $173.3 million in 2003 and 2002, respectively. Assets, depreciation and capital expenditures by segment
Corporate assets consist primarily of cash and cash equivalents, deferred income taxes and derivative assets.
35
Net Earnings
Net Sales
Years ended December 31 (dollars in millions) 2004 2003 2002 2004 2003 2002
Electrical Products $ 51.5 $ 54.2 $ 57.6 $ 860.7 $ 824.6 $ 790.4 Water Systems 36.8 57.2 58.4 792.4 706.1 678.7
Total segments – operating earnings 88.3 111.4 116.0 $ 1,653.1 $ 1,530.7 $ 1,469.1
General corporate and research and development expenses (27.3 ) (20.2 ) (23.7 )
Interest expense (13.5 ) (12.2 ) (13.9 )
Earnings before income taxes 47.5 79.0 78.4
Provision for income taxes (12.1 ) (26.8 ) (27.1 )
Net earnings $ 35.4 $ 52.2 $ 51.3
Total Assets
(December 31)
Depreciation and Amortization (Years Ended December 31)
Capital Expenditures (Years Ended December 31)
(dollars in millions) 2004 2003 2002 2004 2003 2002 2004 2003 2002
Electrical Products $ 738.4 $ 732.1 $ 697.4 $ 33.3 $ 33.7 $ 33.1 $ 27.9 $ 27.3 $ 27.0 Water Systems 488.5 466.8 434.7 19.8 17.6 16.9 19.9 20.8 18.6
Total segments 1,226.9 1,198.9 1,132.1 53.1 51.3 50.0 47.8 48.1 45.6 Corporate assets 85.9 81.0 92.8 0.8 0.8 0.7 0.7 0.5 0.7
Total $ 1,312.8 $ 1,279.9 $ 1,224.9 $ 53.9 $ 52.1 $ 50.7 $ 48.5 $ 48.6 $ 46.3

Table of Contents
Net sales and long-lived assets by geographic location
13. Operations by Segment (continued)
The following data by geographic area includes net sales based on product shipment destination and long-lived assets based on physical location. Long-lived assets include net property, plant and equipment and other long-term assets and exclude prepaid pension, other intangibles and long-lived assets of discontinued operations.
Net earnings per share are computed separately for each period and, therefore, the sum of such quarterly per share amounts may differ from the total for the year.
36
Long-lived Assets
Net Sales
(dollars in millions) 2004 2003 2002 2004 2003 2002
United States $ 254.5 $ 267.1 $ 283.0 United States $ 1,384.8 $ 1,295.9 $ 1,282.9
Mexico 111.0 110.3 102.7 Foreign 268.3 234.8 186.2
China 36.6 32.5 26.6 Total $ 1,653.1 $ 1,530.7 $ 1,469.1
Other Foreign 12.5 11.4 9.8
Total $ 414.6 $ 421.3 $ 422.1
14. Quarterly Results of Operations (Unaudited)
1st Quarter
2nd Quarter
3rd Quarter
4th Quarter
(dollars in millions, except per share amounts)
2004
2003
2004
2003
2004
2003
2004
2003
Net sales $ 416.5 $ 387.9 $ 437.3 $ 417.6 $ 389.9 $ 356.4 $ 409.4 $ 368.8 Gross profit 78.1 78.2 88.4 83.8 62.0 61.5 69.5 75.2 Net earnings 10.7 13.7 17.3 19.8 3.0 6.0 4.4 12.7 Net earnings per share
Basic .37 .47 .59 .68 .10 .21 .16 .43 Diluted .36 .46 .58 .67 .10 .20 .15 .42
Common dividends declared .15 .14 .15 .14 .16 .15 .16 .15

Table of Contents
ITEM 9 – CHANGES IN AND DISAGREEMENTS WITH ACCOUNTANTS ON AC COUNTING AND FINANCIAL DISCLOSURE None. ITEM 9A – CONTROLS AND PROCEDURES Evaluation of disclosure controls and procedures Our chief executive officer and chief financial officer have evaluated the effectiveness of our disclosure controls and procedures as of December 31, 2004, and have concluded that these disclosure controls and procedures were adequate and effective to ensure that material information relating to the company and its consolidated subsidiaries would be made known to them by others within those entities. Changes in internal controls There were no significant changes in our internal controls over financial reporting or in other factors that could significantly affect our disclosure controls and procedures nor were there any significant deficiencies or material weaknesses in our internal controls. As a result, no corrective actions were required or undertaken. Management Report on Internal Control The management of A. O. Smith Corporation is responsible for establishing and maintaining adequate internal control over financial reporting. A. O. Smith Corporation’s internal control system was designed to provide reasonable assurance to the company’s management and board of directors regarding the preparation and fair presentation of published financial statements. All internal control systems, no matter how well designed, have inherent limitations. Therefore, even those systems determined to be effective can provide only reasonable assurance with respect to financial statement preparation and presentation. A. O. Smith Corporation management assessed the effectiveness of the company’s internal control over financial reporting as of December 31, 2004. In making this assessment, management used the criteria set forth by the Committee of Sponsoring Organizations of the Treadway Commission (COSO) in Internal Control—Integrated Framework . Based on our assessment we believe that, as of December 31, 2004, the company’s internal control over financial reporting is effective based on those criteria. A. O. Smith Corporation’s independent auditors have issued an audit report on our assessment of the company’s internal control over financial reporting. This report appears on page 38.
37

Table of Contents
Report of Independent Registered Public Accounting Firm The Board of Directors and Stockholders A.O. Smith Corporation We have audited management’s assessment, included in the accompanying Management Report on Internal Control, that A. O. Smith Corporation maintained effective internal control over financial reporting as of December 31, 2004, based on criteria established in Internal Control—Integrated Framework issued by the Committee of Sponsoring Organizations of the Treadway Commission (the COSO criteria). A. O. Smith Corporation’s management is responsible for maintaining effective internal control over financial reporting and for its assessment of the effectiveness of internal control over financial reporting. Our responsibility is to express an opinion on management’s assessment and an opinion on the effectiveness of the company’s internal control over financial reporting based on our audit. We conducted our audit in accordance with the standards of the Public Company Accounting Oversight Board (United States). Those standards require that we plan and perform the audit to obtain reasonable assurance about whether effective internal control over financial reporting was maintained in all material respects. Our audit included obtaining an understanding of internal control over financial reporting, evaluating management’s assessment, testing and evaluating the design and operating effectiveness of internal control, and performing such other procedures as we considered necessary in the circumstances. We believe that our audit provides a reasonable basis for our opinion. A company’s internal control over financial reporting is a process designed to provide reasonable assurance regarding the reliability of financial reporting and the preparation of financial statements for external purposes in accordance with generally accepted accounting principles. A company’s internal control over financial reporting includes those policies and procedures that (1) pertain to the maintenance of records that, in reasonable detail, accurately and fairly reflect the transactions and dispositions of the assets of the company; (2) provide reasonable assurance that transactions are recorded as necessary to permit preparation of financial statements in accordance with generally accepted accounting principles, and that receipts and expenditures of the company are being made only in accordance with authorizations of management and directors of the company; and (3) provide reasonable assurance regarding prevention or timely detection of unauthorized acquisition, use, or disposition of the company’s assets that could have a material effect on the financial statements. Because of its inherent limitations, internal control over financial reporting may not prevent or detect misstatements. Also, projections of any evaluation of effectiveness to future periods are subject to the risk that controls may become inadequate because of changes in conditions, or that the degree of compliance with the policies or procedures may deteriorate. In our opinion, management’s assessment that A. O. Smith Corporation maintained effective internal control over financial reporting as of December 31, 2004, is fairly stated, in all material respects, based on the COSO criteria. Also, in our opinion, A. O. Smith Corporation maintained, in all material respects, effective internal control over financial reporting as of December 31, 2004, based on the COSO criteria . We also have audited, in accordance with the standards of the Public Company Accounting Oversight Board (United States), the consolidated balance sheets of A. O. Smith Corporation as of December 31, 2004 and 2003, and the related consolidated statements of earnings, comprehensive earnings, stockholders’ equity, and cash flows for each of the three years in the period ended December 31, 2004 and our report dated January 31, 2005 expressed an unqualified opinion thereon.
Ernst & Young LLP Milwaukee, Wisconsin January 31, 2005
38

Table of Contents
PART III ITEM 10 - DIRECTORS AND EXECUTIVE OFFICERS OF THE REGISTRANT The information included under the headings “Election of Directors” and “Board Committees” as it relates to the Audit Committee and Report of the Audit Committee in the company’s definitive Proxy Statement for the 2005 Annual Meeting of Stockholders (to be filed with the Securities and Exchange Commission under Regulation 14A within 120 days after the end of the registrant’s fiscal year) is incorporated herein by reference. The information required regarding Executive Officers of the company is included in Part I of this Annual Report on Form 10-K under the caption “Executive Officers of the Company.” The company has a separately designated Audit Committee on which Gene C. Wulf, Dennis J. Martin and Mark D. Smith serve, with Mr. Wulf as Chairperson. All members are independent under applicable SEC and NYSE rules; Mr. Wulf is an “audit committee financial expert” in accordance with SEC rules. The company has adopted a Financial Code of Ethics applicable to its principal executive officer, principal financial officer and principal accounting officer. As a best practice, this code has been executed by all other company officers and key financial and accounting personnel as well. In addition, the company has adopted a general code of business conduct for its directors, officers and all employees, which is known as the A. O. Smith Guiding Principles. The Financial Code of Ethics, the A. O. Smith Guiding Principles and other company corporate governance matters are available on the company’s website at www.aosmith.com. The company intends to disclose on this website any amendments to, or waivers from, the Financial Code of Ethics or the A. O. Smith Guiding Principles that are required to be disclosed pursuant to SEC rules. To date there have been no waivers of the Financial Code of Ethics or the A. O. Smith Guiding Principles. Stockholders may obtain copies of any of these corporate governance documents free of charge by writing to the Corporate Secretary at the address on the cover page of this Form 10-K. The information included under the heading “Compliance with Section 16(a) of the Securities Exchange Act” in the company’s definitive Proxy Statement for the 2005 Annual Meeting of Stockholders (to be filed with the Securities and Exchange Commission under Regulation 14A within 120 days after the end of the registrant’s fiscal year) is incorporated herein by reference. ITEM 11 - EXECUTIVE COMPENSATION The information included under the heading “Executive Compensation” in the company’s definitive Proxy Statement for the 2005 Annual Meeting of Stockholders (to be filed with the Securities and Exchange Commission under Regulation 14A within 120 days after the end of the registrant’s fiscal year) is incorporated herein by reference, except for the information required by paragraphs (i), (k) and (l) of Item 402(a)(8) of Regulation S-K. ITEM 12 - SECURITY OWNERSHIP OF CERTAIN BENEFICIAL OWNERS AND MANAGEMENT The information included under the headings “Principal Stockholders” and “Security Ownership of Directors and Management” in the company’s definitive Proxy Statement for the 2005 Annual Meeting of Stockholders (to be filed with the Securities and Exchange Commission under Regulation 14A within 120 days after the end of the registrant’s fiscal year) is incorporated herein by reference. ITEM 13 - CERTAIN RELATIONSHIPS AND RELATED TRANSACTIONS The information included under the heading “Compensation Committee Interlocks and Insider Participation” in the company’s definitive Proxy Statement for the 2005 Annual Meeting of Stockholders (to be filed with the Securities and Exchange Commission under Regulation 14A within 120 days after the end of the registrant’s fiscal year) is incorporated herein by reference. ITEM 14 - PRINCIPAL ACCOUNTANT FEES AND SERVICES Information required by Item 14 of this Form and the Audit Committee’s pre-approval policy regarding the engagement of the principal accountant are incorporated herein by reference from the company’s definitive Proxy Statement for the 2005 Annual Meeting of Stockholders (to be filed with the Securities and Exchange Commission under Regulation 14A within 120 days after the end of the registrant’s fiscal year) under the heading “Report of the Audit Committee.”
39

Table of Contents
PART IV ITEM 15 - EXHIBITS, FINANCIAL STATEMENT SCHEDULES and REPORTS ON FORM 8-K
(a) Financial Statements and Financial Statement Schedules
Form 10-K Page Number
The following consolidated financial statements of A. O. Smith Corporation are included in Item 8:
Consolidated Balance Sheets at December 31, 2004 and 2003 17
For each of the three years in the period ended December 31, 2004:
- Consolidated Statement of Earnings 18 - Consolidated Statement of Comprehensive Earnings (Loss) 18 - Consolidated Statement of Cash Flows 19 - Consolidated Statement of Stockholders’ Equity 20
Notes to Consolidated Financial Statements 21 - 36
The following consolidated financial statement schedule of A. O. Smith Corporation is included in Item 15(d):
Schedule II - Valuation and Qualifying Accounts 44
Schedules not included have been omitted because they are not applicable.
(b) Reports on Form 8-K
On October 14, 2004, the Company filed a Current Report on Form 8-K, reporting under Items 2.02 and 9.01 announcing the Company’s results for the quarter ended September 30, 2004.
On December 20, 2004, the company filed a Current Report on Form 8-K, reporting under Item 5.02(d), announcing that Paul W. Jones was elected on December 17, 2004, to the Board of Directors.
(c) Exhibits - see the Index to Exhibits on pages 41 - 42 of this report.
Pursuant to the requirements of Rule 14a-3(b)(10) of the Securities Exchange Act of 1934, as amended, the company will, upon request and upon payment of a reasonable fee not to exceed the rate at which such copies are available from the Securities and Exchange Commission, furnish copies to its security holders of any exhibits listed in the Index to Exhibits.
Management contracts and compensatory plans and arrangements required to be filed as exhibits pursuant to Item 15(c) of Form 10-K are listed as Exhibits 10(a) through 10(h) in the Index to Exhibits.
40

Table of Contents
INDEX TO EXHIBITS
41
Exhibit Number
Description
(3)(i)
Restated Certificate of Incorporation of the corporation as amended April 5, 1995, incorporated by reference to the quarterly report on Form 10-Q for the quarter ended March 31, 1995, and as further amended on February 5, 1996, and incorporated by reference to the annual report on Form 10-K for the year ended December 31, 1995.
(3)(ii)
By-laws of the corporation as amended October 7, 1997, incorporated by reference to the quarterly report on Form 10-Q for the quarter ended September 30, 1997.
(4)
(a) Restated Certificate of Incorporation of the corporation as amended April 5, 1995, incorporated by reference to Exhibit 3 to the corporation’s annual report on Form 10-K for the year ended December 31, 1995 (File No. 1-475).
(b) Credit Agreement, dated as of June 10, 2004, among A. O. Smith Corporation, various financial institutions, M&I Marshall & Ilsley Bank, U.S. Bank National Association and Wells Fargo Bank, N.A., as Co-Documentation Agents, and Bank of America, N.A., as Administrative Agent, incorporated by reference to Exhibit 4 to the corporation’s quarterly report on Form 10-Q for the quarter ended June 30, 2004.
(c) The corporation has instruments that define the rights of holders of long-term debt that are not being filed with this Registration Statement in reliance upon Item 601(b)(4)(iii) of Regulation S-K. The Registrant agrees to furnish to the Securities and Exchange Commission, upon request, copies of these instruments.
(10) Material Contracts
(a) A. O. Smith Corporation 1990 Long-Term Executive Incentive Compensation Plan, as amended, incorporated by reference to the Form S-8 Registration Statement filed by the corporation on December 13, 1994, (Reg. No. 33-56827).
(b) A. O. Smith Corporation Long-Term Executive Incentive Compensation Plan incorporated by reference to the Form S-8 Registration Statement filed by the corporation on December 8, 1999, (Reg. No. 333-92329).
(c) A. O. Smith Combined Executive Incentive Compensation Plan, incorporated by reference as Exhibit A to the Proxy Statement filed on March 4, 2002, for the April 8, 2002, Annual Meeting of Stockholders.
(d) Separation Agreement dated June 14, 2004 by and between A. O. Smith Corporation and Donald M. Heinrich.

Table of Contents
INDEX TO EXHIBITS (continued)
42
Exhibit Number
Description
(10)
(e) Executive Life Insurance Plan, incorporated by reference to the Annual Report on Form 10-K for the fiscal year ended December 31, 1992.
(f) Corporate Directors’ Deferred Compensation Plan, as amended, incorporated by reference to the Annual Report on Form 10-K for the fiscal year ended December 31, 1992.
(g) Executive Supplemental Pension Plan incorporated by Reference to the Annual Report on Form 10-K for the fiscal year ended December 31, 2001.
(h) Supplemental Profit Sharing Plan, incorporated by Reference to the Annual Report on Form 10-K for the fiscal year ended December 31, 2001.
(21) Subsidiaries.
(23) Consent of Independent Registered Public Accounting Firm.
(31.1)
Certification by the Chairman and Chief Executive Officer, pursuant to Section 302 of the Sarbanes-Oxley Act, dated February 23, 2004.
(31.2)
Certification by the Senior Vice-President and Chief Financial Officer, pursuant to Section 302 of the Sarbanes-Oxley Act, dated February 23, 2004.
(32) Written Statement of the Chief Executive Officer and the Chief Financial Officer Pursuant to 18 U.S.C. Section 1350.

Table of Contents
SIGNATURES
Pursuant to the requirements of Section 13 or 15(d) of the Securities Exchange Act of 1934, the registrant has duly caused this report to be signed on behalf of the undersigned, thereunto duly authorized.
Pursuant to the requirements of the Securities Exchange Act of 1934, this report has been signed below as of February 15, 2005 by the following persons on behalf of the registrant and in the capacities and on the dates indicated.
43
A. O. SMITH CORPORATION
By: /s/ Robert J. O’Toole Robert J. O’Toole Chief Executive Officer
Date: February 15, 2005
Name and Title
Signature
ROBERT J. O’TOOLE Chairman of the Board of Directors and Chief Executive Officer
/s/ Robert J. O’Toole
Robert J. O’Toole
PAUL W. JONES Director, President and Chief Operating Officer
/s/ Paul W. Jones
Paul W. Jones
KENNETH W. KRUEGER Senior Vice President and Chief Financial Officer
/s/ Kenneth W. Krueger
Kenneth W. Krueger
JOHN J. KITA Vice President, Treasurer and Controller
/s/ John J. Kita
John J. Kita
RONALD D. BROWN Director
/s/ Ronald D. Brown
Ronald D. Brown
WILLIAM F. BUEHLER Director
/s/ William F. Buehler
William F. Buehler
DENNIS J. MARTIN Director
/s/ Dennis J. Martin
Dennis J. Martin
BRUCE M. SMITH Director
/s/ Bruce M. Smith
Bruce M. Smith
MARK D. SMITH Director
/s/ Mark D. Smith
Mark D. Smith
GENE C. WULF Director
/s/ Gene C. Wulf
Gene C. Wulf

Table of Contents
A. O. SMITH CORPORATION
SCHEDULE II - VALUATION AND QUALIFYING ACCOUNTS
(In millions)
Years ended December 31, 2004, 2003 and 2002
Description
Balance at
Beginning
of Year
Charged to
Costs and
Expenses 1
Acquisition
of Businesses
Deductions 2
Balance at
End of Year
2004:
Valuation allowance for trade and notes receivable $ 4.2 $ 1.1 $ — $ (0.7 ) $ 4.6
2003:
Valuation allowance for trade and notes receivable 4.8 0.8 0.3 (1.7 ) 4.2
2002:
Valuation allowance for trade and notes receivable 4.9 2.6 (0.6 ) (2.1 ) 4.8
1 Provision based upon estimated collection.
44
Exhibit 10 (d)
2 Uncollectible amounts/expenditures charged against the reserve.
SEPARATION AGREEMENT DATED JUNE 14, 2004 BY AND BETWEEN A. O. SMITH CORPORATION AND DONALD M. HEINRICH
THIS AGREEMENT, by and between A. O. Smith Corporation, a Delaware corporation, hereinafter referred to as “A O. Smith” and Donald M. Heinrich, an individual, hereinafter referred to as “Heinrich”;
WHEREAS, Heinrich is currently employed by A. O. Smith in the capacity of President of A. O. Smith Electrical Products Company; and
WHEREAS, A. O. Smith and Heinrich desire to terminate the employment relationship under terms acceptable to the parties.
NOW, THEREFORE, in consideration of the mutual covenants herein contained, it is agreed as follows:
1. Heinrich is relieved of his duties of the day-to-day management of the Electrical Products Company of A. O. Smith Corporation business effective May 11, 2004.
2. Heinrich shall remain as an active employee on the A. O. Smith payroll at his current base salary until May 15, 2006. While on the active payroll, Heinrich shall make himself available to perform such duties as may be reasonably requested by Paul W. Jones or his designee.
3. A. O. Smith agrees to continue group insurance coverage for Heinrich and his eligible dependents while he remains on the active payroll. The coverages will include Disability, Health and Dental. Heinrich will continue to participate in the A. O. Smith Retirement Plan and the A. O. Smith Profit Sharing Retirement Plan while he remains on the active employee payroll. Heinrich shall be eligible for the Company Matching Contribution in the A. O. Smith Profit Sharing Retirement Plan in the year he ceases to be actively employed by A. O. Smith.
4. Heinrich will continue to be eligible for the Executive Split Dollar Life Insurance Policy(s) benefit as follows:
• Pre-Retirement Policy(s) : Life insurance protection will continue to be provided under these policies while Heinrich remains on the active payroll with A. O. Smith but no later than May 15, 2006. When Heinrich ceases to be on the active payroll, the split dollar agreements covering these policies shall terminate and A. O. Smith shall release its collateral interest in the policies. When Heinrich begins to collect his benefit under the A. O. Smith Corporation Executive Supplemental Pension Plan, the value of the policies shall be an offset to benefits due under the Plan.
• Post Retirement Policy : Life insurance protection will continue to be provided under this policy while Heinrich remains on the active payroll with A. O. Smith but no later than May 15, 2006. When Heinrich ceases to be on the active payroll of A. O. Smith, the split dollar agreement will be terminated and the policy will be terminated unless Heinrich elects to make arrangements to continue the policy.
5. Supplemental Profit Sharing Plan : Heinrich shall be eligible to receive supplemental profit sharing contributions while he remains on the active payroll. The amount of money in Heinrich’s Supplemental Profit Sharing Plan will be paid out to him in January of the year following his termination from employment.
6. Deferred Incentive Compensation Account : The amount of money in Heinrich’s Deferred Incentive Compensation Account will be paid

to him in January of the year following his termination from employment unless he submits a new election form directing otherwise.
7. Stock Option : No new stock option grants will be made to Heinrich effective with the execution of this Agreement. All stock option agreements held by Heinrich will be amended to extend the period of exercisability to May 15, 2006. The amended stock option agreements will provide that Heinrich’s right to exercise the options will immediately terminate upon any violation of the provisions of paragraph 17 of this Agreement.
45
8. Restricted Stock : No new restricted stock grants will be made to Heinrich. Existing restricted stock will continue to vest while Heinrich remains on the active payroll and restricted dividends will continue to be paid annually to his

Supplemental Profit Sharing Plan account. At the time Heinrich’s employment is terminated, he will become fully vested in any unvested restricted stock grants.
9. In the event that Heinrich obtains other full-time employment before May 15, 2006, the salary payments shall continue through May 15, 2006, but his employment with A. O. Smith and the benefit coverages under Paragraph 3 shall terminate as of the date he commences such employment.
10. Heinrich shall be eligible to receive a bonus under the A. O. Smith Executive Incentive Compensation Plan for 2004. He shall not be eligible for any bonus under the 2005 or 2006 bonus plan.
11. Heinrich shall be eligible for the use of his current company leased car until he has secured other full-time employment but no later than May 31, 2005. At such time, he shall have the option of returning the car or purchasing the car for its then book value. During his use of the company leased car, A. O. Smith shall maintain all existing collision, comprehensive and liability insurance on the car, and Heinrich shall be responsible for all operating and maintenance costs.
12. The payment by A. O. Smith of fees and dues for club membership Heinrich currently is provided will be continued through the end of 2004 but not beyond.
13. Heinrich will be eligible for Deloitte & Touche financial counseling service through December 2004 including income tax preparation for 2004.
14. Executive outplacement services will be provided at the Company’s expense to assist Heinrich in obtaining other employment.
15. A. O. Smith agrees to continue its practice of reimbursing Heinrich for the income taxes due on the imputed or reportable income related to A. O. Smith’s payment of club fees and dues, tax preparation and counseling fees, lease payments on the company car, dividends on Restricted Stock and contributions to the Supplemental Profit Sharing Plan.
16. A. O. Smith agrees to continue to provide Directors & Officers insurance for Heinrich for the period he is considered an officer of the Corporation.
17. In consideration for this Separation Agreement, Heinrich agrees as follows:
A) From the date of execution of this Agreement until May 15, 2006, he will not directly or indirectly engage as an employee, consultant, or representative in any activity for any business or person which is primarily engaged in the manufacture, sale or distribution of electric motors, unless he obtains the prior written consent of Paul Jones, President and COO of A. O. Smith Corporation; and
B) He will not engage in any act or make any statement, which criticizes, maligns, denigrates or disparages A. O. Smith or its affiliates
or their directors, officers or employees; and
C) From the date of execution of the Agreement until May 15, 2009, Heinrich agrees that he will not disclose to any person, firm or corporation any secret, confidential or proprietary information of A. O. Smith or its affiliates, unless such information is in the public domain or is required to be disclosed by law. Such secret, confidential and proprietary information shall include, but not be limited to, such matters as A. O. Smith’s costs, profits, markets, sales, pricing, product lines, policies, operational methods, suppliers, customers and strategic plans; and
46
D) He agrees to release and forever discharge A. O. Smith Corporation and any of their affiliated companies, their officers, directors and employees of and from any and all claims, demands, rights, liabilities and causes of action of whatsoever kind or nature, arising out of or in connection with his employment. This release specifically encompasses all claims of employment discrimination based on race, color, religion, sex and national origin under Title VII of the Civil Rights Act of 1964 or under Section 1981 of the Civil Rights Act of 1866, all claims of age discrimination under the Age Discrimination in Employment Act of 1967 (ADEA), all claims under the Employee Retirement Income Security Act (ERISA), all claims of employment discrimination under the Americans with Disabilities Act (ADA), all claims based on any express or implied employment contract as well as claims under any applicable state or local law concerning employment. This

release shall not apply to any claims for benefits under applicable unemployment compensation law, nor any claim for vested benefits under A. O. Smith’s pension and savings plans. This release shall also not apply to any right or claims under the Age Discrimination and Employment Act of 1967 (ADEA) which arise after the date this Agreement is executed; and
E) In the event that Heinrich violates any of the provisions of Paragraphs 17, A thru D, A. O. Smith shall have the right to terminate
his employment with A. O. Smith, cease making the payments in Paragraph 2 and cease providing the benefit coverages outlined in Paragraph 3 of this Agreement.
18. Heinrich agrees that he will not disclose the terms, amounts and facts of this Agreement to anyone other than to his financial or tax advisor/counselor, attorney or Lori Davis.
19. Heinrich shall have the right to revoke this Agreement within seven (7) days after he executes it, by providing written notice of such revocation to A. O. Smith. This Agreement shall not be effective or enforceable until the seven-day revocation period has expired.
20. Heinrich acknowledges that he has been advised by A. O. Smith to seek the advice of an attorney regarding this Agreement and that he has been given 21 days to decide whether to agree to its terms.
21. The illegality or unenforceability of any provision of this Agreement shall not effect the validity and enforceability of any legal and enforceable provision of this Agreement.
22. This Agreement shall supersede and replace all prior written and oral agreements between the parties regarding the subject matter of this Agreement.
IN WITNESS WHEREOF, the parties have executed this Agreement on the day and year indicated below.
47
Exhibit 21
23. This Agreement will be binding upon any successors and assigns of A. O. Smith.
A. O. SMITH CORPORATION
Dated: June 9, 2004 By: /s/ Edward J. O’Connor
Edward J. O’Connor Vice President Human Resources & Public Affairs
Dated: June 9, 2004 By: /s/ Donald M. Heinrich Donald M. Heinrich
SUBSIDIARIES The following lists all subsidiaries and affiliates of A. O. Smith Corporation.
Name of Subsidiary
Jurisdiction in Which Incorporated
AOS Holding Company Delaware A. O. Smith International Corporation Delaware
State Industries, Inc. Tennessee
A. O. Smith Holdings (Barbados) SRL Barbados
A. O. Smith Enterprises Ltd. Canada
A. O. Smith (China) Water Heater Co., Ltd. China A. O. Smith Electrical Products (Changzhou) Co., Ltd. China A. O. Smith Electrical Products (Shenzhen) Co., Ltd. China A. O. Smith Electrical Products (Suzhou) Co., Ltd. China A. O. Smith Electrical Products (Taizhou) Co., Ltd. China A. O. Smith (Shanghai) Consulting Co., Ltd. China
A. O. Smith L’eau chaude S.a.r.l. France
A. O. Smith Warmwasser-Systemtechnik GmbH Germany
A. O. Smith Electrical Products Limited Liability Company Hungary
A. O. Smith Electric Motors (Ireland) Ltd. Ireland A. O. Smith Holdings (Ireland) Ltd. Ireland
IG-Mex, S. de R.L. de C.V. Mexico Motores Electricos de Juarez, S. de R.L. de C.V. Mexico Motores Electricos de Monterrey, S. de R.L. de C.V. Mexico Productos de Agua, S. de R.L. de C.V. Mexico Productos Electricos Aplicados, S. de R.L. de C.V. Mexico

48
Exhibit 23
A.O. Smith Electrical Products B.V. The Netherlands A.O. Smith Holdings B.V. The Netherlands A.O. Smith Holdings II B.V. The Netherlands A.O. Smith International Holdings B.V. The Netherlands A.O. Smith Products v.o.f. The Netherlands A.O. Smith Water Products Company, B.V. The Netherlands
A. O. Smith Electrical Products (S.E.A.) Pte Ltd. Singapore
A. O. Smith Electrical Products Limited United Kingdom State Water Heaters (U.K.) Limited United Kingdom
CONSENT OF INDEPENDENT REGISTERED PUBLIC ACCOUNTING FIRM We consent to the incorporation by reference in the Registration Statements (Form S-8 Nos. 33-37878, 33-56827, 333-05799, 333-92329 and 333-92482) pertaining to the A. O. Smith Corporation 1990 Long-Term Executive Incentive Compensation Plan, the A. O. Smith Corporation Long-Term Executive Incentive Compensation Plan and the A. O. Smith Combined Executive Incentive Compensation Plan and in the related prospectuses of our reports dated January 31, 2005, with respect to the consolidated financial statements and schedule of A. O. Smith Corporation, A. O. Smith Corporation management’s assessment of the effectiveness of internal control over financial reporting, and the effectiveness of internal control over financial reporting of A. O. Smith Corporation, included in this Annual Report (Form 10-K) for the year ended December 31, 2004.
ERNST & YOUNG LLP Milwaukee, Wisconsin February 15, 2005
49 Exhibit 31.1 CERTIFICATION OF CHIEF EXECUTIVE OFFICER I, Robert J. O’Toole, Chairman and Chief Executive Officer, certify that:
1. I have reviewed this annual report on Form 10-K of A. O. Smith Corporation (the “company”);
2. Based on my knowledge, this report does not contain any untrue statement of a material fact or omit to state a material fact necessary to make the statements made, in light of the circumstances under which such statements were made, not misleading with respect to the period covered by this report;
3. Based on my knowledge, the financial statements and other financial information included in this report, fairly present in all material respects the financial condition, results of operations and cash flows of the company as of, and for, the periods presented in this report;
4. The company’s other certifying officer and I are responsible for establishing and maintaining disclosure controls and procedures (as defined in Exchange Act Rules 13a-15(e) and 15d-15(e)) and internal control over financial reporting (as defined in Exchange Act Rules 13a-15(f) and 15d-15(f)) for the company and we have:
a) Designed such disclosure controls and procedures, or caused such disclosure controls and procedures to be designed under our
supervision, to ensure that material information relating to the company, including its consolidated subsidiaries, is made known to us by others within those entities, particularly during the period in which this report is being prepared;
b) Designed such internal control over financial reporting, or caused such internal control over financial reporting to be designed under
our supervision, to provide reasonable assurance regarding the reliability of financial reporting and the preparation of financial statements for external purposes in accordance with generally accepted accounting principles;
c) Evaluated the effectiveness of the company’s disclosure controls and procedures and presented in this report our conclusions about
the effectiveness of the disclosure controls and procedures, as of the end of the period covered by this report based on such evaluation; and
d) Disclosed in this report any changes in the company’s internal control over financial reporting that occurred during the company’s
most recent fiscal quarter (the company’s fourth fiscal quarter in the case of an annual report) that has materially affected, or is reasonably likely to materially affect, the company’s internal control over financial reporting; and
5. The company’s other certifying officer and I have disclosed, based on our most recent evaluation of internal control over financial reporting, to the company’s auditors and the audit committee of the company’s board of directors (or persons performing the equivalent function):
a) All significant deficiencies and material weaknesses in the design or operation of internal control over financial reporting which are
reasonably likely to adversely affect the company’s ability to record, process, summarize and report financial information; and
Date: February 15, 2005
b) Any fraud, whether or not material, that involves management or other employees who have a significant role in the company’s
internal control over financial reporting.

50
Exhibit 31.2
/s/ Robert J. O’Toole Robert J. O’Toole Chairman and Chief Executive Officer
CERTIFICATION OF CHIEF FINANCIAL OFFICER I, Kenneth W. Krueger, Senior Vice President and Chief Financial Officer, certify that:
1. I have reviewed this annual report on Form 10-K of A. O. Smith Corporation (the “company”);
2. Based on my knowledge, this report does not contain any untrue statement of a material fact or omit to state a material fact necessary to make the statements made, in light of the circumstances under which such statements were made, not misleading with respect to the period covered by this report;
3. Based on my knowledge, the financial statements and other financial information included in this report, fairly present in all material respects the financial condition, results of operations and cash flows of the company as of, and for, the periods presented in this report;
4. The company’s other certifying officer and I are responsible for establishing and maintaining disclosure controls and procedures (as defined in Exchange Act Rules 13a-15(e) and 15d-15(e)) and internal control over financial reporting (as defined in Exchange Act Rules 13a-15(f) and 15d-15(f)) for the company and we have:
a) Designed such disclosure controls and procedures, or caused such disclosure controls and procedures to be designed under our
supervision, to ensure that material information relating to the company, including its consolidated subsidiaries, is made known to us by others within those entities, particularly during the period in which this report is being prepared;
b) Designed such internal control over financial reporting, or caused such internal control over financial reporting to be designed under
our supervision, to provide reasonable assurance regarding the reliability of financial reporting and the preparation of financial statements for external purposes in accordance with generally accepted accounting principles;
c) Evaluated the effectiveness of the company’s disclosure controls and procedures and presented in this report our conclusions about
the effectiveness of the disclosure controls and procedures, as of the end of the period covered by this report based on such evaluation; and
d) Disclosed in this report any changes in the company’s internal control over financial reporting that occurred during the company’s
most recent fiscal quarter (the company’s fourth fiscal quarter in the case of an annual report) that has materially affected, or is reasonably likely to materially affect, the company’s internal control over financial reporting; and
5. The company’s other certifying officer and I have disclosed, based on our most recent evaluation of internal control over financial reporting, to the company’s auditors and the audit committee of the company’s board of directors (or persons performing the equivalent function):
a) All significant deficiencies and material weaknesses in the design or operation of internal control over financial reporting which are
reasonably likely to adversely affect the company’s ability to record, process, summarize and report financial information; and
Date: February 15, 2005
51
Exhibit 32
Written Statement of the Chief Executive Officer and the Chief Financial Officer Pursuant to 18 U.S.C. Section 1350
Pursuant to Section 906 of the Sarbanes-Oxley Act of 2002, 18 U.S.C. Section 1350, each of the undersigned certifies that to the best of our knowledge:
b) Any fraud, whether or not material, that involves management or other employees who have a significant role in the company’s
internal control over financial reporting.
/s/ Kenneth W. Krueger Kenneth W. Krueger Senior Vice President and Chief Financial Officer
(1) the Annual Report on Form 10-K of A. O. Smith Corporation for the year ended December 31, 2004 (the “Report”) fully complies with the requirements of Section 13(a) or Section 15(d) of the Securities Exchange Act of 1934; and
Date: February 15, 2005
(2) the information contained in the Report fairly presents, in all material respects, the financial condition and results of operations of A. O. Smith Corporation.
/s/ Robert J. O’Toole

52
End of Filing
© 2005 | EDGAR Online, Inc.
Robert J. O’Toole Chairman and Chief Executive Officer
/s/ Kenneth W. Krueger Kenneth W. Krueger Senior Vice President and Chief Financial Officer