Smile Curves in Global Value Chains
30
长江产业经济研究院(南京大学) 2020 年 11 月 南京大学长江产业经济研究院 地址:南京大学鼓楼校区北园丙丁楼 网址:www.yangtze-idei.cn 邮箱:[email protected] 微信:长江产经智库 Smile Curves in Global Value Chains Bo MENG,Ming YE
Transcript of Smile Curves in Global Value Chains
长江产业经济研究院(南京大学)
2020 年 11 月
南京大学长江产业经济研究院
地址:南京大学鼓楼校区北园丙丁楼
网址:www.yangtze-idei.cn
微信:长江产经智库
Smile Curves in Global Value Chains
Bo MENG,Ming YE

1
Smile Curves in Global Value Chains:Multinationals vs Domestic Firms; the U.S. vs China
Bo MENG1 and Ming YE2*
Abstract: This paper uses the “smile curve” mapping tool with a Y-axis for value-addedratio and an X-axis for production stages to identify value-added gains, positions, andinterdependencies of multinationals and domestic firms along global value chains(GVCs). Taking the U.S. and China’s ICT firms’ exporting activities as a target, we findthat China’s domestic ICT firms’ value chain appears as a smile curve differing from theU.S. domestic ICT firms’ inverted-U curve, which reflects the considerable difference intheir technical specialization in joining GVCs; multinationals are good at utilizing eachcountry’s comparative advantages and can thus arrange value chains as smile curvesregardless of whether they are located in the U.S. or in China; China’s domestic firmshave increasingly plugged into most ICT value chains. All findings reflect how “sticky”the interdependency among countries along GVCs is and can thus help understandingthe impact of the U.S.–China trade war.
Highlights1) A “smile curve” analysis is applied to mapping the geometry of GVCs for ICT firms2) Value-added gains and positions of multinationals and domestic firms are presented3) China’s domestic ICT firms’ value chain appears as a smile curve4) The U.S. domestic ICT firms’ value chain shows an inverted-U curve5) Multinationals’ ICT value chains appear as smile curves no matter their locations6) Some China’s domestic service-suppliers are plugging into the high-end of GVCs
Key words: smile curve, multinational enterprise, global value chain, trade invalue-added, industrial upgrading, ICT
1: Senior researcher, Institute of Developing Economies - Japan External TradeOrganization (IDE-JETRO); Researcher, Tokyo Foundation for Policy Research (TKFD),Japan2*: Researcher, Yangtze River Industrial Economic Research Institute, NanjingUniversity, China ([email protected])
Acknowledgement: Thanks to Prof. Kyoji Fukao, Dr. Yukihito Sato, Dr. Hitoshi Sato(IDE-JETRO), Prof. Long Ke (TKFD), Dr. Xiang Wei (Yale University) for their helpfulcomments. This study was partly supported by IDE-JETRO’s research project“Re-evaluation of the Total Factor Productivity (TFP) and resource misallocation inChina” (2020-2021), a grant from the Japan Society for the Promotion of ScienceGrant-in-Aid for Scientific Research (C) #20K01674: “The Impact of US-China TradeConflict on Global Value Chains: Considering Heterogeneous Firms” (2020-2022) andthe TKFD’s research project of global supply chains (2020).

2
1. Introduction
Global Value Chains (GVCs) divide the production process so that goods may beproduced in stages in a number of different countries with a little value-added at eachstage in accordance with each country’s comparative advantages (Krugman, 1991).Given the rapid development of GVCs over the past three decades, the “Made in” label,typical of manufactured goods (ranging from large planes to small electronic devices),which attributes them to a specific economy, has become an archaic symbol of a bygoneera as most manufactured goods are now “Made in the World” (WTO-IDE, 2011). Thephenomenon of the rise of GVCs, which accompanied a substantial improvement in theeconomic efficiency of multinationals, has significantly changed the nature andstructure of international trade (Gereffi & Fernandez-Stark, 2011; WTO, 2019) as wellas the topology of interdependency and influencing powers among countries (Xiao et al.,2020). According to a recent report (UNCTAD, 2013), 80% of trade takes place in “valuechains” linked to transnational corporations. Furthermore, as shown in Cadestin et al.,(2019), “multinationals account for roughly for one-half of international trade, one-thirdof output and GDP and one-fourth of employment in the global economy.”
Meanwhile, the complexity and sophistication of GVCs due to the increasinginter- and intra-firm trade of intermediate goods and services, which may cross severalnational borders multiple times, have also created considerable difficulties, such asthose in understanding “who creates added value for whom” and in formulating policiesthat enable countries, industries, and firms with different ownership to clearly identifytheir positions, gains, and potential risks in joining or engaging in GVCs. Betterunderstanding on this issue has very important policy implications as pointed out bythe so-called “Paradoxical Pair of Concerns” (Baldwin et al., 2014) for both developedand developing countries when they join GVCs. That is to say, owing to the differencesin comparative advantages across countries participating in GVCs, rich countries mighttend to engage in high-end and intangible production activities, such as R&D, design,and brand building in the upstream stages and after-sales services and marketing inthe downstream stages. Consequently, rich countries might worry about the hollowingout of their economies as manufacturing jobs are offshored to low-technology, low-wagecountries. Meanwhile, poor countries might tend to focus on low-end and tangibleproduction activities, such as manufacturing and assembly, and might therefore haveconcerns that they are getting the wrong types of jobs and that their economies might belocked into GVCs at the bottom (low-end) of the so-called “smile curve.”
The concept of the smile curve was first proposed around 1992 by Stan Shih,the founder of Acer, a technology company headquartered in Taiwan. Shih (1996)observed that in the personal computer industry, both ends of the value chain commandhigher value-added to the product than the middle part of the value chain. If thisphenomenon is presented in a graph with value-added represented on the Y-axis andthe value chain (stages of production located in different places) represented on theX-axis, the resulting curve appears in the shape of a smile. The logic of the smile curvehas been widely used and discussed in the business literature of GVCs (e.g., Dedrick

3
and Kraemer, 1998; Mudambi, 2008; Shin et al., 2012, etc.). Its theoretical explanationcould be traced in the context of GVCs to three lines of literature.1 They include thebusiness literature concerning the value chain model (Porter, 1985), GVC governance(Gereffi et al., 2005), the organizational choices of firms involved in supply chains(Antràs and Helpman, 2008; Acemoglu et al., 2009; Antràs and Chor, 2013; Alfaro et al.,2015), and the international trade literature concerning trade in tasks andfragmentation production (Jones and Kierzkowski, 1990; Feenstra, 1998; Arndt, 1997;Campa and Goldberg, 1997, Yeats, 2001, Hummels, Ishii and Yi, 2001; Yi, 2003,Grossman and Helpman, 2002a, b; Hanson et al., 2003; Grossman and Rossi-Hansberg,2008; Timmer et al., 2014, 2018).
However, the smile curve phenomenon has rarely been identified, measured, orevaluated by employing real data with explicit consideration of international productionnetworks. A few studies have tried to identify the smile curve phenomenon usinginput–output (IO) data at the industrial level (Kimura, 2003; 2006; Baldwin et al., 2014),firm level (Saliola and Zanfei, 2009; Rungi and Del Prete, 2018), or using project-levelFDI data (Stöllinger, 2019), and none of them have explicitly considered value-addedpropagation processes and country-sector positions along all stages of the value chain.Ye et al. (2015) provided the pioneering idea in identifying smile curves in GVCs,followed by Ito and Vézina (2016) and Meng et al. (2020). The originality and innovationof these works is that they consistently combine both the so-called “trade invalue-added” concept (see Johnson and Noguera, 2012; Koopman et al., 2014; Los et al.,2016) in measuring value-added gains of countries and sectors along GVCs and thevalue-added propagation length (see Antràs et al. 2012; Miller and Temurshoev, 2013;Chen, 2014; Wang et al., 2017) in measuring positions of countries and industries alongGVCs. However, in what is similar to the previously mentioned literature, one of themost critical comments regarding these smile curve research studies is that noperformance of multinationals that are considered the main players of GVCs can beexplicitly identified in the existing smile curve analyses.
Concerning the role of multinationals in GVCs, a massive number of casestudies (e.g., Linden et al., 2009; Dedrick et al., 2010; Xing and Detert, 2010; Xing, 2019,2020) have been developed. These studies rely on “tear down” analyses that assign thevalue of individual components to source companies and their countries. These firm-and product-based case studies can provide intuitive understanding of GVCs in terms ofthe activities of multinationals. However, these “tear down” case studies only focus onthe supply chain of a specific firm and particular products and are clearly notrepresentative of the broader role of production networks and inter-industrial orinter-firm linkages in the whole value creation process.
Owing to the recent novel data developed by the OECD, the analyticalActivities of Multinational Enterprises (AMNE) database (including Inter-Country IOtables split according to firm ownership over the period 2005–2016; see Cadestin, et al.,2018a) makes analyses of multinational production in value-added terms possible (see
1 For a detailed genealogical map of theoretical frameworks for GVCs, one can refer to Inomata(2017).
4
Cadestin, et al., 2018b, 2019; Miroudot and Ye, 2019, 2020). This database also enablesus to fill the gap between approaches mentioned above in measuring smile curves inGVCs. With this new data, we borrow the smile curve concept and focus on Informationand Communications Technology (ICT), including many representative fragmentationproducts (e.g., smartphones, PCs) exporting firms located in China and the U.S. We aimto identify value-added gains, positions, and interdependencies of both domestic andmultinational firms when they participate in GVCs. Understanding the gains fromGVCs and their distribution pattern across countries, sectors, and firm ownership iscrucial for policymakers in the context of reconsidering how world trade and productionwork. So is having a better understanding of the nature and the impact of the recentU.S.–China trade conflict, along with better international governance in the era ofGVCs.
2. Method and Data
2.1 Conceptual GVC setting for measuring smile curves
GVCs can be shown from various perspectives. To give a better mapping of the geometryof GVCs, we first need to give a clear conceptual setting about what we are going tomeasure. The most popular and simple approach is to focus on the export of a specificproduct produced by a specific type of firm and to look at how value is added from onecountry, sector, or type of firm to another country, sector, or type of firm throughout theentirety of production networks, along with how the product is ultimately consumed.For example, we can use Chinese domestic firms’ ICT exports to the world market as astarting point for separating the whole value chain into upstream stages anddownstream stages. All countries, sectors, and different types of firms that directly andindirectly provide intermediate goods and services to the production of ICT exports areconsidered participants in the upstream stages along the value chain. All countries,sectors, and different types of firms involved in the distribution process of those ICTproducts to world consumers are considered participants in the downstream stages.
With regard to how to visualize the above conceptual GVC, we need twofundamental measures. The first measure is used to express the magnitude of thebenefit (i.e., the absolute gain of value-added) for countries, sectors, and firms that areinvolved in GVCs. The second measure is the distance between producers andconsumers in the value-added propagation process, which can be used to identify theposition of a country, sector, or firm in a GVC. These two measures have beenpropounded by Ye et al. (2015) and expounded by Meng et al. (2020). In the followingsections, we simplify the terminology of mathematics used in their methods.
2.2 Value-added gains from exporting
Following the definition of trade in value-added (TiVA: Johnson and Noguera,2012), we can use an IO model to measure value-added gains induced by exporting final

5
goods and services. The advantage of using TiVA is that it can trace value-added createdupstream (GDP by sector) and absorbed downstream (final demands by product)without any double counting because all transaction of intermediates across countries,sectors, and firms are treated as endogenous variables (see Koopman et al., 2014).
For ease of explanation, consider a closed national IO model as follows:
𝐱 = 𝐀𝐱 + 𝐲, (1)
where 𝐱 is the N × 1 gross output vector with N sectors, 𝐲 is the N × 1 final demandvector, and 𝐀 is the N × N input coefficient matrix (the share of intermediate input inoutput). In other words, all gross output (total supply) must be used either as anintermediate product or as a final product (total demand). This equation expresses theex-post equilibrium of market supply and demand in a closed economy. Afterrearranging terms, we have the following:
𝐱 = 𝐈 𝐀 𝟏𝐲 = 𝐋𝐲, (2)
where 𝐋 denotes the N × N block matrix, commonly known as a Leontief inverse, whichis the total requirement matrix that gives the amount of gross output required for aone-unit increase in final demand. We define 𝐯 as a 1 × N value-added coefficient vector.Each element (vs ) in 𝐯 shows the share of value-added in the gross output of sector s.Then, we can measure the value-added gained (𝛑k) by sector induced by exports (𝐞k) of afinal product k as follows:
𝛑k = 𝐯𝐋𝐞k, (3)
where, 𝐯 is the diagonal matrix of 𝐯, 𝐞k is the N × 1 vector, with just an element of theexported final product k. Without loss of generality, this model can be applied to aninter-country input–output (ICIO) model.
2.3 GVC position index
By definition, in an IO system, the following equation always holds true:
𝐯𝐋 = 𝐯 𝐈 + 𝐀 + 𝐀𝟐 + 𝐀𝟑 +⋯ = 𝐮' (4)
where 𝐮' denotes the transformed 𝐮 (an N × 1 unit vector). The value-added (𝐯s ) of aspecific sector s induced by the final demand (𝐲k) of a specific product k can be given as𝐯s𝐋𝐲k (a scalar). Following Antràs et al. (2012) and Meng et al. (2020), the distance froma specific sector s (value-added creator) to consumers of a specific final product k, can bedefined as follows:
Dsk = 𝐯s 1𝐈 + 2𝐀 + 3𝐀𝟐 + 4𝐀𝟑 + ⋯ 𝐲k/𝐯s𝐋𝐲k = 𝐯s𝐋2𝐲k/𝐯s𝐋𝐲k. (5)

6
The aforementioned indicator measures the total number of value-added propagationsteps, on average, when the value-added of a specific sector upstream is embodied in alldownstream steps and ultimately reaches the final demand of a specific product.Without loss of generality, this distance measure could be applied to the ICIO model aswell.
2.4 Data
Data used is the OECD analytical AMNE database, wherein the conventional ICIOtables are split according to firm ownership (D: domestic- and F: foreign-owned) overthe period 2005–2016, with 60 economies (including the “rest of the world” as oneeconomy) and 34 sectors in the ISIC Rev. 4 classification at the basic price.2 It should benoted that foreign-owned firms are defined as foreign affiliates who have at least 50%foreign ownership and that domestic-owned firms include domestic multinationals(domestic firms with foreign affiliates) and domestic firms not involved in internationalinvestment. The layout of this table with N sectors (N=34), G economies (G=60), and 2types of firms is shown in Table 1.
Table 1. The layout of the OECD inter-country input–output tables with firm ownershipinformation included
Note: 𝐙FD12 is the N × N matrix representing the exports of intermediates produced byforeign-owned firms located in Country 1 used by Country 2’s domestic firms; 𝐘F12 is theN × 1 vector representing the exports of final products produced by foreign-owned firmslocated in country 1, used by Country 2. X: the 2NG × 1 column vector of output; Va: the1 × 2NG row vector of value-added. For detailed information about country or regional
2 Main data sources used in compiling the OECD AMNE–ICIO tables include the OECD–ICIO tables,OECD–AMNE statistics, National accounts, and other National sources, Trade by EnterpriseCharacteristics and Services Trade by Enterprise Characteristics (TEC), Micro-level databases.
7
sector classification, one can refer to Appendices 1 and 2. For data explanation, seeCadestin et al. (2018a).
3. Empirical Results
3.1 How to map the geometry of GVCs
By first employing the yearly AMNE–ICIO data to derive binomial regression and thenlabeling the most important participants (country-sector-firm) with value-added gain(represented by the size of circles) above a threshold percentage (e.g., 0.1% of the totalinduced value-added in the whole value chain) in both upstream and downstreamstages, a map of the ICT exports-related GVCs can be created. As shown in the figuresof the next section, the Y-axis denotes the value-added ratio (value-added gained byproducing one unit US$ worth of output). The X-axis denotes position, measured by thevalue-added propagation length between global consumers of ICT products and aspecific participating firm in a specific industry along the corresponding value chain (akind of normalized distance to consumers3). The smooth line is fitted by binomialregression smoothing, and the shadowed area represents the confidence interval aroundthe smooth line (for detailed robustness check on the GVC position index and the shapeof smile curves, one can refer to Appendices 3 and 4). This GVC mapping can help usidentify whether the so-called “smile curve” exists, and if so, what the participants(countries, sectors, and firms) of a specific value chain, as well as their positions andgains, look like.
3.2 Value-added gains in Chinese domestic ICT firms’ export-related value chain
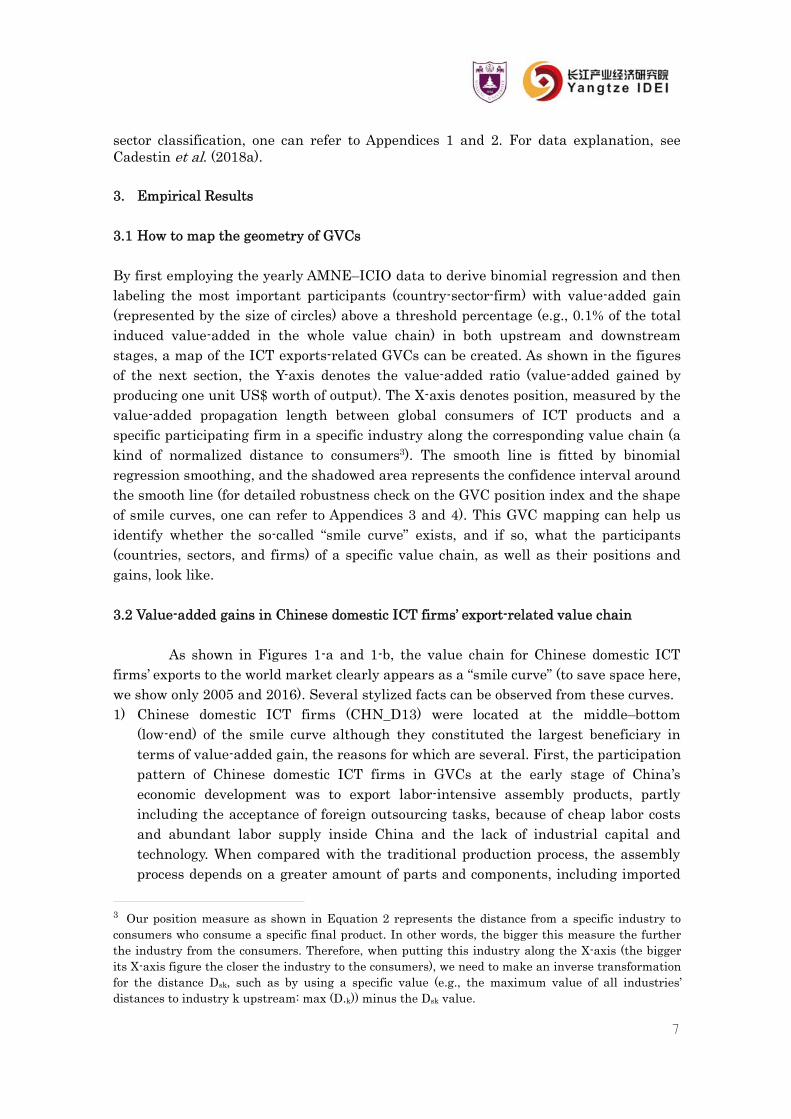
As shown in Figures 1-a and 1-b, the value chain for Chinese domestic ICTfirms’ exports to the world market clearly appears as a “smile curve” (to save space here,we show only 2005 and 2016). Several stylized facts can be observed from these curves.1) Chinese domestic ICT firms (CHN_D13) were located at the middle–bottom
(low-end) of the smile curve although they constituted the largest beneficiary interms of value-added gain, the reasons for which are several. First, the participationpattern of Chinese domestic ICT firms in GVCs at the early stage of China’seconomic development was to export labor-intensive assembly products, partlyincluding the acceptance of foreign outsourcing tasks, because of cheap labor costsand abundant labor supply inside China and the lack of industrial capital andtechnology. When compared with the traditional production process, the assemblyprocess depends on a greater amount of parts and components, including imported
3 Our position measure as shown in Equation 2 represents the distance from a specific industry toconsumers who consume a specific final product. In other words, the bigger this measure the furtherthe industry from the consumers. Therefore, when putting this industry along the X-axis (the biggerits X-axis figure the closer the industry to the consumers), we need to make an inverse transformationfor the distance Dsk, such as by using a specific value (e.g., the maximum value of all industries’distances to industry k upstream: max (D.k)) minus the Dsk value.
8
intermediates. This makes the value-added ratio of Chinese domestic ICT firms verylow, thus explaining their location at the lowest position in this smile curve. This isalso the reason for which many other domestic firms as well as foreign countriesthat directly and
Figure 1a. Chinese domestic ICT firms’ export-related value chain (2005)
Figure 1b. Chinese domestic ICT firms’ export-related value chain (2016)
indirectly provide intermediate products to Chinese domestic ICT firms have been

9
involved in the upstream segment of this value chain. In addition, to deliver thoseassembly ICT products to users around the world, foreign after-services industriesare also needed. Thus, more foreign countries are involved in the downstream stagesof this value chain. Therefore, Chinese domestic ICT firms are naturally located inthe middle–bottom of this smile curve. The value-added gain, then, is self-evident,as Chinese domestic ICT firms were the most direct player in the production of ICTexports.
2) Many other Chinese domestic firms in different sectors (e.g., in the 2005 case,CNH_D21: Wholesale and retail; CHN_D22: Transportation; CHN_D2: Mining;CHN_D11: Basic Metals; CHN_19: Electricity; CHN_8: Chemicals) also benefited byparticipating in the upstream stages of this value chain. This was because most ofthe intermediate inputs directly and indirectly needed by the Chinese domestic ICTfirms to produce exports were presumed to come from other Chinese domestic firms.
3) Other countries’ (regions) domestic firms located in the upstream position of thisvalue chain also obtained a relatively large portion of value-added gain, particularlytheir ICT firms (TWN_D13, KOR_D13, JPN_D13, USA_D13, for the 2005 case).This clearly shows the strong cross-border, intra-industrial linkages between Chinaand the US as well as linkages with other East Asian economies. This is partlybecause of the relatively broad industry classification of ICT in the AMNE (broaderclassification used, more intra-industrial transaction appears). In addition, we canalso see that other countries’ domestic non-ICT firms located in much higherupstream stages could also enjoy value-added gains by joining this value chain.They include many business services providers (USA_D29, JPN_D29, KOR_D29), aswell as some manufacturing intermediate suppliers (JPN_D14: Electricalequipment, JPN_D11: Basic metals, JPN_D8: Chemicals). This reflects the level ofinter-industrial linkages between China and foreign economies.
4) Although the value-added gain was not substantial, it can still be easily identified inthe upstream stage of this value chain for 2005, with the existence of beneficiaries,including both multinationals located in China (CHN_F29: Business services,CHN_F13: ICT) and abroad (SGP_F13: ICT; TWN_F13: ICT; THA_F13: ICT,USA_F21: Business Services). This reflects the fact that multinationals, both insideand outside China, have also been involved in Chinese domestic ICT firm valuechains through the provision of intermediate goods directly and indirectly althoughtheir presence was not substantial when compared with that of domestic firms. Thisis likely because most of those multinationals located in China focus on theproduction of final products rather than intermediates.
5) The main beneficiaries in the downstream stage of this value chain include serviceindustries, such as Wholesale and Retail (21) and Transportation (22) in the U.S.,Japan, the UK, Mexico, and France. This can be explained by the fact that China’sdomestic firms’ ICT products were mainly exported to these countries, which had tobe delivered to their countries’ domestic consumers mainly through the use ofdomestic and international wholesale and transportation services provided by boththeir domestic and multinational firms.

10
Upon examining the evolution of Chinese domestic ICT firms’ exports-relatedsmile curves over time, no significant change in the shape of this curve is seen, but someremarkable structural changes concerning the participating countries and firms can beobserved.1) More Chinese domestic manufacturing firms have been involved in the upstream
stage of this value chain. Their share of value-added gain in the whole chainincreased from 26.3% to 38.9% over time (note the change in the correspondingcircle size between 2005 and 2016). This is mainly because Chinese domesticmanufacturing firms experienced a relatively quick industrial upgrading over thisperiod and can thus provide more complex intermediate inputs to Chinese domesticICT firms as a replacement for foreign imports. For instance, JPN_D14, JPN_D11,JPN_D8 appeared in 2005 and were largely replaced by the corresponding Chinesedomestic firms (CHN_D14, CHN_D11, CHN_D8) in 2016.
2) More Chinese domestic service firms have been involved in the upstream stage ofthis value chain; meanwhile, their value-added gains account for a much largerportion than those of other manufacturing firms do. In addition, in 2005, the largestupstream beneficiaries were the traditional service providers, domestic wholesaleand retail (CHN_D22), and transportation firms (CHN_D21), while in 2016,domestic financial and insurance firms (CHN_D27) and other business servicesfirms (CNH_29) showed a remarkable increasing presence, which took over theshare provided by the U.S., Japan, and Korea’s domestic services firms (USA_D29,JPN_D29, KOR_D29). This clearly reflects the ongoing domestic-orientedservitization of the whole ICT value chain in China since the time increasinglymodern domestic services have been embodied in China’s ICT exports.
3) The value-added ratio of the U.S. domestic ICT firms (USA_D13) that were the mostimportant foreign suppliers of intermediate goods in the upstream of this valuechain increased from 56.4% in 2005 to 81.6% in 2016, while the figure for China’sdomestic ICT firms (CHN_D13) declined slightly, from 24.6% in 2005, to 22.4% in2016. This reflects the fact that the U.S. domestic ICT firms increasinglyconcentrated on high-tech production of more complex intermediate goods (e.g.,computer processors), whereas Chinese domestic ICT firms even then took on moretasks, such as assembling final products using low-skilled labor. This result is veryconsistent with the existing literature (Ye et al., 2015 and Meng et al., 2020).
4) Multinational ICT firms in China (CHN_F13) enhanced their participation in theupstream of this value chain by providing intermediate goods to Chinese domesticICT firms directly and indirectly as a means of realizing more value-added gain.This is probably because, increasingly, Japanese, Korean, and Taiwanese domesticICT firms (JPN_D13, KOR_D13, TWN_D13) located upstream as intermediategoods providers to Chinese domestic ICT firms moved their production capacity toChina to be much closer to their consumer. This can be confirmed by the shrinkingshare of value-added gain for JPA_D13 (66.7% down), KOR_D13 (75.9% down), andTWN_D13 (76.2% down) and the increasing share of CHN_F13 (5.8 times greater) inthe 2016 figure when compared with the corresponding value-added gains in the

11
2005 figure.5) Some developing countries’ services firms (ROW_D21, MEX_D21, ROW_D22,
BRA_D21, RUS_D21, IND_D21) enhanced their participation at the downstreamstage of this value chain. This reflects the fact that those countries imported moreChinese ICT products, including both intermediate goods and final products, whichneed to be shipped to their domestic users. Thus, their domestic services firms(wholesale, retail, and transportation) are able to enjoy more value-added gain.
Figure 2a. China-based multinational ICT firms’ export-related value chain (2005)

12
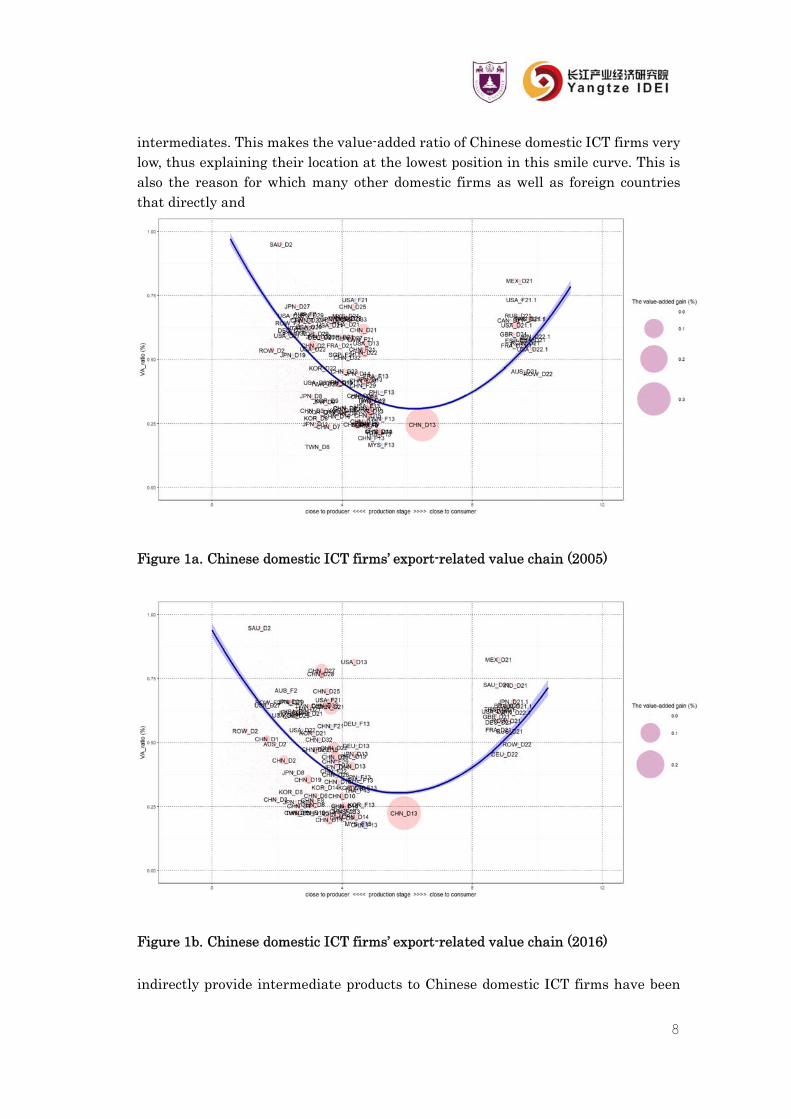
Figure 2b. China-based multinational ICT firms’ export-related value chain (2016)
13
3.2 Value-added gains in the China-based multinational ICT firms’ export-related valuechain
Figures 2-a and 2-b show the participants’ value-added gains as well as their positionsin the value chain related to China-based multinational ICT firms’ exports. Both clearlyappear in the form of “smile curves.” When compared with the smile curves related toChinese domestic ICT firm exports (Figures 1-a and 1-b) over time, a few findings canbe gleaned:1) The position of China-based multinational ICT firms’ exports (CHN_F13) was at the
middle–bottom of the value chain, which is similar to the position of Chinesedomestic ICT-exporting firms (CHN_D13) in Figures 1a and 1b. However, the shareof CHN_F13’s value-added gain and its position in Figures 2a and 2b were smallerand lower than those of CHN_D13 were in Figures 1a and 1b, respectively. This ismainly because almost half of China-based multinational ICT firms are doingprocessing trade, which is more labor-intensive and requires more importedintermediate input when compared with Chinese domestic ICT-exporting firms.
2) When compared with Figure 1a, more foreign domestic firms were involved in theupstream stage of the value chain (Figure 2a). The share of value-added gain forthese firms in the upstream stage of the value chain was 36.9% in Figure 2a, whichwas much greater than that in Figure 1a (27.6%). On the one hand, this isconsistent with the fact that many China-based multinational ICT firms are doingprocessing exports, which need a more substantial amount of intermediate inputsfrom other countries. On the other hand, this also reflects the fact thatmultinational ICT value chains have more variation in arranging intermediateinputs from different locations and types of firms.
3) There is no significant change in the shape of this value chain between 2005 and2016, but a similar structural change concerning the participating membersupstream can be clearly observed. To be precise, Chinese domestic firms, includingthose involved in both manufacturing and services, enhanced their industrialupgrading, thus replacing foreign firms as suppliers of intermediate goods andservices to China-based multinational ICT firms (the share of value-added gain byChinese domestic firms upstream increased from 28.2% to 44.6% over the period).This fact can also be partly confirmed by a recent case study having to do with theiPhone X (Xing, 2020): Chinese companies “contributed 25% of the value-added tothe iPhone X.”
3.3 Value-added gains in the U.S. domestic ICT firms’ export-related value chain
Figures 3-a and 3-b show the mapping result for the value chain in terms of the U.S.domestic ICT firms’ exports. A U-shaped smile curve cannot be clearly identified. Valuechains may not always look like a smile curve, particularly for the U.S.’ domestic ICTfirms. The main features of these figures and their changes over time are summarizedas follows:

14
Figure 3a. The U.S. domestic ICT firms’ export-related value chain (2005)
Figure 3b. The U.S. domestic ICT firms’ export-related value chain (2016)
1) The relatively higher value-added ratio of the U.S.’ domestic ICT firms whencompared with that of other participants upstream and downstream along thisvalue chain is the main reason that it does not look like a smile curve. This ratioeven increased from 56.4% to 81.6% between 2005 and 2016, which made the curveassume a somewhat inverted-U shape. This clearly reflects the fact that producing
15
one unit of output by the U.S.’ domestic ICT firms can create more value-added. Thisis probably due to the fact that more high-skilled laborers with higher wages, andmore sophisticated capital with higher rent are used in these firms.
2) In 2005, there were still many domestic manufacturing firms involved in theupstream stage of this value chain, but in 2016, many of them disappeared, withonly Fabricated Metals (USA_12) and Chemicals (USA_D8) showing a presence as asupplier of intermediates. The share of value-added gain of these firms was 23.6% in2005 but shrunk to 9.3% in 2016. Something similar happened to foreign domesticmanufacturing firms located upstream in this value chain (the share of theirvalue-added gain declined from 8.4% to 3.4% over the period). In 2016, only ICTfirms located in China (CHN_D13 and CHN_F13) enjoyed a value-added gain byjoining the upstream stage of this value chain. The change is also reflected by theexpanding share of value-added gain by USA_D13 in this value chain, from 55.9% in2005 to 77.9% in 2016. Therefore, we can conclude that the US domestic ICT firms’value chain has experienced significant technological upgrading, which hastransitioned to the production of very high value-added products (depending on theavailability of high-skilled labor and high-tech capital) without relying on moredomestic and foreign intermediate input. Those products (being traced at a moredetailed product level by trade statistics) include units of automatic data processingmachines (HS847150, accounting for about 6.3% of their ICT exports), surgicalinstruments and appliances, and electro-diagnostic apparatus (HS901819,accounting for about 2.9% of their ICT exports).
3.4 Value-added gains in the U.S.-based multinational ICT firms’ export-related valuechain
Figures 4-a and 4-b show the mapping results for the value chain in terms of theU.S.-based multinational ICT firms’ exports, which clearly appear as “smile curves.”When compared with previous figures, the main findings can be presented as follows:1) The pattern of value chains shown in Figures 4a and 4b is very similar to that in
Figures 2a and 2b. To be precise, the production of multinational ICT firms’ exportsin both China and the U.S. depended highly on a large amount of intermediate inputprovided by both domestic and foreign suppliers at the upstream stages of the valuechain. This is probably because the U.S. economy is big enough with a relativelylarge differential of primary costs across states; thus, multinational ICT firms canstill arrange their value chains to produce assembly products and export them to theworld market. Another factor possibly contributing to this phenomenon is that mostU.S.-based multinational ICT firms’ exports are final goods although they might bedifferent from those made by China-based multinational ICT firms in terms ofquality and function (we cannot identify the difference because of the broadclassification of sectors used in the data).
2) As mentioned earlier, China has experienced relatively rapid industrial upgrading,which has also enabled more Chinese domestic manufacturing firms (CHN_D13:

16
ICT, CHN_D11: Basic metals, CHN_D14: Electrical equipment, CHN_D8:Chemicals) with lower value-added ratios to be suppliers of intermediate goods in aposition that is upstream of U.S.-based multinational firms in the value chain. Thisalso makes this smile curve much flatter. Simultaneously, Chinese domesticfinancial and insurance (CHN_D27) and business services (CHN_D29) firms couldalso get value-added gain from this value chain. This is mainly because moreservices are embodied in Chinese domestic firm-produced intermediate goods useddirectly and indirectly by U.S.-based multinational ICT firms.
Figure 4a. The U.S.-based multinational ICT firms’ export-related value chain (2005)
Figure 4b. The U.S.-based multinational ICT firms’ export-related value chain (2016)
17
4. Conclusion
With U.S.-based and China-based multinational ICT firms’ exporting activities over theperiod 2005–2016 as our analytical target, our empirical results show that the valuechains in terms of China-based multinational ICT firm exports clearly appear as “smilecurves,” wherein the ICT-exporting firms take the largest portion of value-added gainbut only obtain very low value-added per unit exported. Thus, they are located at thelow-end along these curves. This result is very evident for China-based multinationalICT firms in much the same way as the findings from the case study on iPhone’s supplychain. The value chain, as it relates to the U.S. domestic ICT firms’ exports, shows amuch steeper inverted-U-shaped smile curve over time, in which the U.S. domestic ICTfirms take the majority of value-added gain with much less usage of intermediate inputsprovided by both domestic and foreign firms over time. This result clearly reflects thequick technology upgrading and specialization of U.S. domestic ICT firms, which cancreate more value-added per unit of output, relying on more domestic, high-skilled laborand sophisticated capital. The value chains in terms of U.S.-based multinational ICTfirms’ exports also clearly appear as “smile curves,” implying that multinationals canstill find opportunities in the U.S. to arrange value chains as they do in China becausethe U.S. economy is big enough with large differentials of primary costs across states aswell as the ease of importing cheaper intermediate goods with lower import tariff ratesfrom the world market. Our results also show that more Chinese domestic firmsincluding both manufacturing and services suppliers have been increasingly involved atthe upstream stage of almost all smile curves identified. This clearly reflects the quickindustrial upgrading happening in China, which has enabled more Chinese domesticfirms to replace other suppliers in GVCs.
On the basis of the foregoing findings, we can discuss several highly importantpolicy implications on the recent bilateral trade conflicts between the U.S. and China.First, the recent U.S.–China trade conflicts are due to very complex political, economic,institutional, and cultural factors, which are clearly beyond the scope of our smile curveanalyses. However, on the basis of our results, at least from the economic perspective,we can say that GVCs could play a very important role as an automatic stabilizer ofthose trade conflicts. This is mainly because the development of GVCs is an irreversibleprocess of the ongoing globalization, which is mainly based on each country’scomparative advantages dominated by firms rather than governments; thus, the wholeeconomic efficiency could be guaranteed in the long run. Any exogenous nonmarketshock might tentatively impact GVCs but cannot change the fact that GVCs do followmarket mechanisms. Further, the context of the current U.S.-China trade conflicts istotally different from those of previous U.S.–Japan trade conflicts, which occurredduring 1970–1980. For example, the U.S. and Japan were competitors in exporting carsduring 1970–1980, but the U.S. and China are both competitors and collaborators inproducing ICT products (e.g., smart phones) in the era of GVCs. Without the existenceof a competition–collaboration dynamic, nobody can imagine how such high-quality andcheap (referring to its function) smart phones can be produced (assembled) in China and

18
exported all over the world, while bringing substantial benefits to our lives, as well ashow the massive investment in R&D for innovation in the U.S. could be paid off. Thisrelationship can be clearly recognized in almost all ICT smile curves visualized in thepaper.
On the other hand, the value creation along GVCs mainly follows the marketmechanism although there is no guarantee that the distribution of value-added gainacross countries, sectors, firms, or individuals has been accepted by individuals asincome could always remain equal. This relates not only to the income distribution andredistribution systems adopted domestically, for example, the growing wage gap acrosssectors with different levels of GVC involvement or between high-skilled and low-skilledlabor inside some high-level GVC-participating sectors (for further discussion on theU.S., see Meng et al., 2020; on European countries, see Parteka and Wolszczak-Derlacz,2019) but also to the global income distribution pattern in terms of income shifts amongmultinationals. Examples of this include: “U.S. companies have become more active atshifting income out of the United States…” (see Klassen and Laplante, 2012),“…multinational firms alter the distribution of reported profits to take advantage oflosses…” (Simone et al., 2017). This fact has, at least in part, been a driver of thebacklash against globalization and the breaking out of trade conflicts between the U.S.and China.
Finally, there is a sticky interdependency between the U.S. and China. As bothcompetitors and collaborators along almost all ICT value chains, the so-called“Paradoxical Pair of Concerns” (Baldwin et al., 2014) has been widely recognized byboth sides. China would not want to be locked in at the low-end of GVCs (tangibleactivities) led by multinationals and would thus be likely to adopt very aggressive(somehow radical) innovation strategies to support their firms on more intangibleactivities (R&D, design, finance, and marketing) (see Cheng et al., 2020). Therefore, asshown in our paper, more Chinese domestic firms, especially high value-added servicessuppliers have been able to climb up the ladder to the high-end and enjoy morevalue-added gains directly and indirectly upstream in GVCs. In other words, thequickly increasing presence (or value-added gain) of Chinese firms in GVCs (meaningthe relatively shrinking influencing power of the U.S.) might be another possible triggerfor the U.S.–China trade conflicts. Therefore, the nature of the current U.S.–Chinatrade conflicts may be similar to judgments coming from international politics literature:“relative gains are more important than absolute gains” (Waltz, 1959); “the first concernof states is not to maximize power but to maintain their position in the system” (Waltz,1979).
19
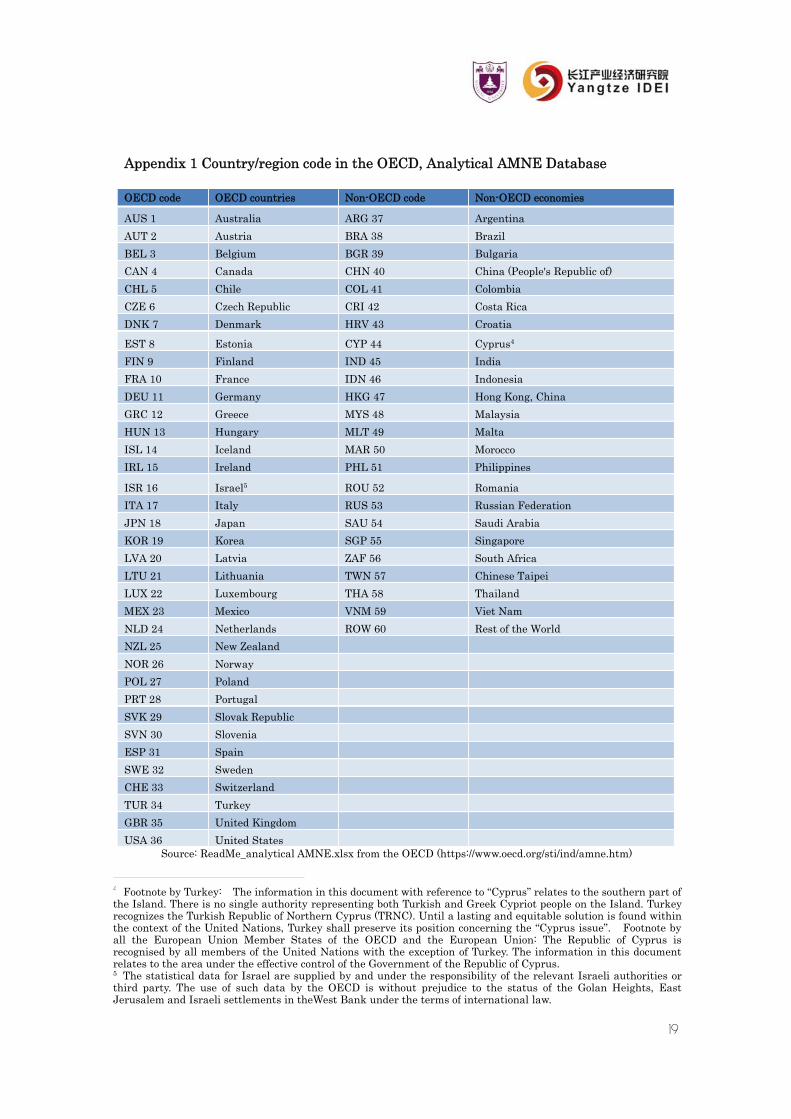
Appendix 1 Country/region code in the OECD, Analytical AMNE Database
OECD code OECD countries Non-OECD code Non-OECD economies
AUS 1 Australia ARG 37 Argentina
AUT 2 Austria BRA 38 Brazil
BEL 3 Belgium BGR 39 Bulgaria
CAN 4 Canada CHN 40 China (People's Republic of)
CHL 5 Chile COL 41 Colombia
CZE 6 Czech Republic CRI 42 Costa Rica
DNK 7 Denmark HRV 43 Croatia
EST 8 Estonia CYP 44 Cyprus4
FIN 9 Finland IND 45 India
FRA 10 France IDN 46 Indonesia
DEU 11 Germany HKG 47 Hong Kong, China
GRC 12 Greece MYS 48 Malaysia
HUN 13 Hungary MLT 49 Malta
ISL 14 Iceland MAR 50 Morocco
IRL 15 Ireland PHL 51 Philippines
ISR 16 Israel5 ROU 52 Romania
ITA 17 Italy RUS 53 Russian Federation
JPN 18 Japan SAU 54 Saudi Arabia
KOR 19 Korea SGP 55 Singapore
LVA 20 Latvia ZAF 56 South Africa
LTU 21 Lithuania TWN 57 Chinese Taipei
LUX 22 Luxembourg THA 58 Thailand
MEX 23 Mexico VNM 59 Viet Nam
NLD 24 Netherlands ROW 60 Rest of the World
NZL 25 New Zealand
NOR 26 Norway
POL 27 Poland
PRT 28 Portugal
SVK 29 Slovak Republic
SVN 30 Slovenia
ESP 31 Spain
SWE 32 Sweden
CHE 33 Switzerland
TUR 34 Turkey
GBR 35 United Kingdom
USA 36 United StatesSource: ReadMe_analytical AMNE.xlsx from the OECD (https://www.oecd.org/sti/ind/amne.htm)
4 Footnote by Turkey: The information in this document with reference to “Cyprus” relates to the southern part ofthe Island. There is no single authority representing both Turkish and Greek Cypriot people on the Island. Turkeyrecognizes the Turkish Republic of Northern Cyprus (TRNC). Until a lasting and equitable solution is found withinthe context of the United Nations, Turkey shall preserve its position concerning the “Cyprus issue”. Footnote byall the European Union Member States of the OECD and the European Union: The Republic of Cyprus isrecognised by all members of the United Nations with the exception of Turkey. The information in this documentrelates to the area under the effective control of the Government of the Republic of Cyprus.5 The statistical data for Israel are supplied by and under the responsibility of the relevant Israeli authorities orthird party. The use of such data by the OECD is without prejudice to the status of the Golan Heights, EastJerusalem and Israeli settlements in theWest Bank under the terms of international law.

20
Appendix 2 Industry (sector) code of the OECD AMNE ICIO data
Code 1 Code 2 Industry
A 1 Agriculture, forestry and fishingB 2 Mining and extraction of energy producing productsC10T12 3 Food products, beverages and tobaccoC13T15 4 Textiles, wearing apparel, leather and related productsC16 5 Wood and products of wood and corkC17T18 6 Paper products and printingC19 7 Coke and refined petroleum productsC20T21 8 Chemicals and pharmaceutical productsC22 9 Rubber and plastic productsC23 10 Other non-metallic mineral productsC24 11 Basic metalsC25 12 Fabricated metal productsC26 13 Computer, electronic and optical productsC27 14 Electrical equipmentC28 15 Machinery and equipment, nec.C29 16 Motor vehicles, trailers and semi-trailersC30 17 Other transport equipment
C31T33 18Other manufacturing; repair and installation ofmachinery and equipment
DTE 19Electricity, gas, water supply, sewerage, waste andremediation services
F 20 ConstructionG 21 Wholesale and retail trade; repair of motor vehiclesH 22 Transportation and storageI 23 Accommodation and food servicesJ58T60 24 Publishing, audiovisual and broadcasting activitiesJ61 25 TelecommunicationsJ62T63 26 IT and other information servicesK 27 Financial and insurance activitiesL 28 Real estate activitiesMTN 29 Other business sector servicesO 30 Public admin. and defence; compulsory social securityP 31 EducationQ 32 Human health and social work
RTS 33Arts, entertainment, recreation and other serviceactivities
T 34 Private households with employed personsSource: ReadMe_analytical AMNE.xlsx from the OECD (https://www.oecd.org/sti/ind/amne.htm)

21
Appendix 3 Robustness check for the GVC position index
To check the robustness of our GVC position index proposed in Section 2.3, we calculatethe distance from sectors by firm type to consumers of a specific product for all countriesand years covered in the OECD’s AMNE–ICIO data. Our conclusion is that although theevolution of industrial and trade structures might impact this position index, thegeneral positions of most industries by firm type are unlikely to change frequently orsignificantly because the most important determinants of position are the inherentproperties of an industry.
Given space limitations, we merely present one example as shown in FiguresA1 and A2, which represent the distance of all countries, industries, and firms toconsumers of Chinese firm-made ICT products between 2005 and 2016. The larger theposition indicator (the darker the color represented on the right side) the moreupstream the position of the relevant industry and firm in the value chain.
FigureA1.GVCposition index for2005

22
FigureA2.GVCposition indexfor2016
Appendix 4 Statistical significance of the measured smile curves
We test the significance of smile curves for both China and the U.S. ICT export-relatedvalue chains during the entire data period (2005–2016) using a weighted quadratic termregression:
vi = α + β1Di + β2Di2 + ϵiwhere vi is the value-added ratio (Y-axis) of a participant i who is involved in Chinese-or U.S.-owned firms’ ICT value chains, α is the fixed effect, Di is the position (X-axis) ofparticipant i in the measured value chain (based on a normalized distance measuregiven in Equation 2) and ϵi is an error term. As shown in Tables 1 and 2, most valuechains measured appear as U-shaped curves except for the value chain concerning U.S.domestic firms. In the following sections, we provide a detailed explanation. It should benoted that the sample upstream is 4,080 strong (60 economies×34 sectors×2 types of

23
firms); the sample downstream is 240 strong (60 economies×2 sectors (transportationand commerce) ×2 types of firms). However, the number of observations may be smallerthan the total sample size. This is because we only count the participants who haveenjoyed value-added gains because they joined the corresponding value chain.
Table 2a. Testing the smile curve for ICT export-related value chain (2005)
USA_D13 USA_F13 CHN_D13 CHN_F13
FE 0.51 ***
(0.49 – 0.53)0.84 ***
(0.81 – 0.86)1.11 ***
(1.08 – 1.13)1.10 ***
(1.07 – 1.13)
dis 0.01(-0.00 – 0.01)
-0.15 ***
(-0.16 – -0.14)-0.26 ***
(-0.27 – -0.25)-0.27 ***
(-0.28 – -0.26)
dis^2 0.00(-0.00 – 0.00)
0.01 ***
(0.01 – 0.01)0.02 ***
(0.02 – 0.02)0.02 ***
(0.02 – 0.02)
Observations 4,087 4,095 4,087 4,095
R2 / R2 adjusted 0.037 / 0.036 0.167 / 0.167 0.382 / 0.382 0.369 / 0.369
* p<0.05 ** p<0.01 *** p<0.001
Table 2b. Testing the smile curve for ICT export-related value chain (2016)
USA_D13 USA_F13 CHN_D13 CHN_F13
FE -0.05 ***
(-0.08 – -0.02)0.70 ***
(0.67 – 0.73)0.94 ***
(0.91 – 0.97)0.94 ***
(0.91 – 0.97)
dis 0.28 ***
(0.27 – 0.29)-0.08 ***
(-0.09 – -0.06)-0.22 ***
(-0.23 – -0.21)-0.23 ***
(-0.24 – -0.22)
dis^2 -0.02 ***
(-0.02 – -0.02)0.01 ***
(0.00 – 0.01)0.02 ***
(0.02 – 0.02)0.02 ***
(0.02 – 0.02)
Observations 4,115 4,123 4,115 4,123
R2 / R2 adjusted 0.466 / 0.466 0.045 / 0.044 0.265 / 0.264 0.255 / 0.255
* p<0.05 ** p<0.01 *** p<0.001

24
Reference
Acemoglu, D., Johnson, S., Mitton, T. (2009). Determinants of Vertical Integration:Financial Development and Contracting Costs. The Journal of Finance 64 (3):1251-1290.
Alfaro, L., Antràs, P., Chor, D., Conconi, P. (2015). Internalizing Global Value Chains: AFirm Level Analysis. NBER Working Paper No. w21582.
Antràs, P., Chor, D. (2013). Organizing the Global Value Chain. Econometrica 81 (6):2127-2204.
Antràs, P., Chor, D., Fally, T., Hillberry, R. (2012). Measuring the Upstreamness ofProduction and Trade Flows. NBER Working Paper No.17819.
Antràs, P., Helpman, E. (2008). Contractual Frictions and Global Sourcing. NBERWorking Paper No.12747.
Arndt, S. (1997). Globalization and the Open Economy. The North American Journal ofEconomics and Finance 8 (1): 71-79.
Baldwin, R., Ito, T., Sato, H. (2014). The Smile Curve: Evolving Sources of Value Addedin Manufacturing, Joint Research Program Series, IDE-JETRO.
Cadestin, C., Backer, K. Desnoyers-James, I., Miroudot, S., Rigo, D., Ye, M. (2018a),Multinational Enterprises and Global Value Chains: The OECD Analytical AMNEDatabase, OECD Trade Policy Papers No. 211.
Cadestin, C., Backer, K. Desnoyers-James, I., Miroudot, S., Rigo, D., Ye, M. (2018b),Multinational Enterprises and Global Value Chains: New Insights on theTrade-Investment Nexus, OECD Science, Technology and Industry Working Papers No.2018/05.
Cadestin, C., Backer, K., Miroudot, S., Moussiegt, L., Rigo, D., Ye, M. (2019),Multinational Enterprises in Domestic Value Chains, OECD Science, Technology andIndustry Policy Papers No. 63.
Campa, J. and Goldberg, L. (1997). The Evolving External Orientation ofManufacturing Industries: Evidence from Four Countries. NBER Working Paper No.5919.
Chen, Q. (2014). The Average Propagation Length: An Extended Analysis. Paperpresented in the 22nd International Input-Output Conference, Lisbon, 2014.

25
Cheng, W., Meng, B., Gao, Y. (2020). China’s Innovation Boom: Miracle or Mirage? IDEDiscussion Paper 777.
Corcos, G., Irac, D.M., Mion, G., Verdier, T. (2013). The Determinants of Intrafirm Trade:Evidence from French Firms. Review of Economics and Statistics 95 (3): 825-838.
Dedrick, J., Kraemer, K.L. (1998). Asia’s Computer Challenge: Threat or Opportunityfor the United States and the World? New York: Oxford University Press.
Dedrick, J., Kraemer, K.L., Linden, G. (2010). Who Profits from Innovation in GlobalValue Chains? A Study of the iPod and Notebook PCs, Industrial and Corporate Change19 (1): 81-116.
Feenstra, R. (1998). Integration of Trade and Disintegration of Production in the GlobalEconomy. Journal of Economic Perspectives 12 (4): 31-50.
Gereffi, G., Humphrey, J., Sturgeon, T. (2005). The Governance of Global Value Chains,Review of International Political Economy 12 (1): 78-104.
Gereffi, G., and Fernandez-Stark, K. (2011). Global Value Chain Analysis: A Primer.Durham, NC: Center on Globalization, Governance and Competitiveness (CGGC), DukeUniversity.
Grieco, J.M. (1988). Anarchy and the Limits of Cooperation: A Realist Critique of theNewest Liberal Institutionalism. International Organization 42 (3): 485-507.
Grossman, G. and Helpman, E. (2002a). Outsourcing in a Global Economy. NBERWorking Paper No. 8728.
Grossman, G. and Helpman, E. (2002b). Integration versus Outsourcing in IndustryEquilibrium. Quarterly Journal of Economics 117: 85-120.
Grossman, G.M. and Rossi-Hansberg, E. (2008). Trading Tasks: A Simple Theory ofOffshoring. The American Economic Review 98 (5): 1978-1997.
Hanson, G., Mataloni, Jr. R. J., Slaughter, M. J. (2003). Vertical Production Networks inMultinational Firms. NBER Working Paper No. 9723.
Hummels, D., Ishii, J. Yi, K. (2001). The Nature and Growth of Vertical Specialization inWorld Trade. Journal of International Economics 54: 75–96.
Inomata, S., (2017). Analytical Frameworks for Global Value Chains: An Overview. In

26
WTO eds. Global Value Chain Development Report 2017.
Ito, T., Vézina P.L. (2016). Production Fragmentation, Upstreamness, and Value added:Evidence from Factory Asia 1990–2005. Journal of The Japanese and InternationalEconomies 42: 1-9.
Johnson, R. and Noguera, G. (2012). Accounting for Intermediates: Production Sharingand Trade in Value-added, Journal of International Economics 86 (2): 224-236.
Jones, R. and Kierzkowski, H. (1990). The Role of Services in Production andInternational Trade: A Theoretical Framework. in R. Jones and A. Krueger (eds.), ThePolitical Economy of International Trade, Basil Blackwell, Oxford.
Kimura, T. (2003). The “Smile Curve” Phenomenon in the Japanese Assembly-TypeManufacturing Industry. FRI Research Report No. 167 (in Japanese).
Kimura, T. (2006). The Continuing Smile Curve Phenomenon in Electronic ComputingEquipment and Accessory Equipment: Further Validation for the Smile Curve. Articlesof Economists/Analysts on Japanese Economy, Fujitsu Research Institute.
Klassen, K., Laplante, S.K. (2012). Are US Multinational Corporations Becoming MoreAggressive Income Shifters? Journal of Accounting Research 50 (5): 1245-1285.
Krugman, P. (1995). Growing World Trade: Causes and Consequences, BrookingsPapers on Economic Activity.
Koopman, R., Wang, Z., Wei, S-J. (2014). Tracing Value-added and Double Counting inGross Exports, American Economic Review 104 (2): 459-494.
Linden, G., Dedrick, J., Kraemer, K.L. (2009). Innovation and Job Creation in a GlobalEconomy: The Case of Apple’s iPod. Working Paper, Personal Computing IndustryCenter,UC Irvine.
Los, B., Timmer, M.P., de Vries, G.J. Tracing value-added and double counting in grossexports: comment. American Economic Review 106 (7): 1958-66
Meng, B., Ye, M., Wei, S.J. (2020). Measuring Smile Curves in Global Value Chains,Oxford Bulletin of Economics and Statistics.
Miller, R.E. and Temurshoev, U. (2013). Output Upstreamness and InputDownstreamness of Industries/Countries in World Production. GGDC Working PapersNo. 133.

27
Miroudot, S. and Ye, M. (2019). Multinational production in value-added terms.Economic Systems Research.
Miroudot, S. and Ye, M. (2020). Decomposing value added in gross exports. EconomicSystems Research.
Mudambi, R. (2008). Location, Control and Innovation in Knowledge-IntensiveIndustries, Journal of Economic Geography 8 (5): 699-725.
Parteka, A., Wolszczak-Derlacz, J. (2019). Global Value Chains and Wages:Multi-Country Evidence from Linked Worker-Industry Data. Open Economies Review30: 505-539.
Porter, M.E. (1985). The Competitive Advantage: Creating and Sustaining SuperiorPerformance. NY: Free Press.
Rungi, A., Del Prete, D. (2018). The Smile Curve at the Firm Level: Where Value isAdded along Supply Chains. Economics Letters 164 (C): 38-42.
Saliola, F., Zanfei, A. (2009). Multinational Firms, Global Value Chains and theOrganization of Knowledge Transfer. Research Policy 38(2): 369-381.
Shih, S. (1996). Me-Too is Not My Style: Challenge Difficulties, Break throughBottlenecks, Create Values (Taipei: The Acer Foundation).
Shin, N., Kraemer, K.L., Dedrick, J. (2012). Value Capture in the Global ElectronicsIndustry: Empirical Evidence for the “Smiling Curve” Concept, Industry and Innovation19 (2), 89-107.
Simone, L.D., Klassen, K., Seidman, J. (2017). Unprofitable Affiliates and IncomeShifting Behavior. The Accounting Review 92 (3): 113-136
Stöllinger, R. (2017). Smile Curves Economics vs Comparative Advantages: DoesFunctional Specialisation Matter for Economic Growth. The Vienna Institute forInternational Economic Studies (WIIW).
Timmer, M.P., Erumban, A.A., Los, B., Stehrer, R., De Vries, G.J. (2014). Slicing upGlobal Value Chains. Journal of Economic Perspectives 28 (2): 99-118.
Timmer, M.P., Miroudot, S., de Vries, G.J. (2019). Functional Specialisation in Trade.Journal of Economic Geography 19 (1), 1-30.

28
UNCTAD (2013). World Investment Report 2013Global Value Chains: Investment andTrade for Development, United Nations Conference on Trade and Development, UnitedNations Publication.
Waltz, K.N. (1959). Man, the State and War. New York: Columbia University Press. (pp.198)
Waltz, K.N. (1979). Theory of International Politics. University of California, Berkeley.Addison-Wesley Publishing Company (pp. 126).
Wang, Z., Wei, S-J., Yu, X., Zhu, K. (2017). Characterizing Global Value Chains:Production Length and Upstreamness. NBER Working Paper No. 23261.
WTO-IDE (2011). Trade Patterns and Global Value Chains in East Asia: From Trade toGoods to Trade in Tasks, printed by the WTO Secretariat.
World Bank-WTO (2019). Global Value Chain Development Report 2019: TechnologicalInnovation, Supply Chain Trade and Workers in a Globalized World. Washington, D.C.:World Bank Group.
Xiao, H., Meng, B., Ye, J., Li, S. (2020). Are Global Value Chains Truly Global? EconomicSystems Research.
Xing, Y., and Detert, H. (2010). How the iPhone Widens the United States Trade Deficitwith the People’s Republic of China, ADBI Working Paper No. 257.
Xing, Y. (2019). How the iPhone widens the US trade deficit with China: The case of theiPhone X, GRIPS Discussion Papers 19-21.
Xing, Y. (2020). Global Value Chains and the “missing exports” of the United States.China Economic Review 61(101429).
Ye, M., Meng, B., Wei, S.J. (2015). Measuring Smile Curves in Global Value Chains, IDEDiscussion Paper 530.
Yeats, A. (2001). Just How Big is Global Production Sharing? In L. Cheng andKierzkowski, H. (eds.), Globalization of Trade and Production in South-East Asia. NewYork: Kluwer Academic Press.
Yi, K.M. (2003). Can Vertical Specialization Explain the Growth of World Trade?
Journal of Political Economy 111 (1): 52-102.