Smart Skills Sanskriti School · Class XI / Economics / 1 Smart Skills Sanskriti School CONTENTS...
74
Class XI / Economics / 1 Smart Skills Sanskriti School CONTENTS Page Number Monthly breakup of syllabus 2 Indian economy at the eve of independence 4 Indian economy (1950 – 1990) 5 Economic reforms since 1991 6 Poverty 7 Human capital formation 8 Rural development 9 Employment- Growth ,In formalisation and other issues 10 Infrastructure 11 Environment and sustainable development 12 Collection and organisation of data 13 Presentation of data 15 Measures of central tendency 18 Measures of dispersion 22 Correlation 24 Index number 26 Inflation 28 Basic mathematical concepts used in economics 30 Project 33 Assignments 35
Transcript of Smart Skills Sanskriti School · Class XI / Economics / 1 Smart Skills Sanskriti School CONTENTS...
Class XI / Economics / 1
Smart Skills Sanskriti School
CONTENTS
Page Number
Monthly breakup of syllabus 2
Indian economy at the eve of independence 4
Indian economy (1950 – 1990) 5
Economic reforms since 1991 6
Poverty 7
Human capital formation 8
Rural development 9
Employment- Growth ,In formalisation and other issues 10
Infrastructure 11
Environment and sustainable development 12
Collection and organisation of data 13
Presentation of data 15
Measures of central tendency 18
Measures of dispersion 22
Correlation 24
Index number 26
Inflation 28
Basic mathematical concepts used in economics 30
Project 33
Assignments 35

Class XI / Economics / 2
Smart Skills Sanskriti School
Academic Session 2016-17
Monthly Syllabus
Month Indian Economics Statistics
April/May o Brief introduction of the state of Indian economy on the eve of independence
o Meaning, Scope and importance of Statistics in Economics
o Collection of data
Primary vs. secondary data
Census vs. sampling method
Concept of sampling methods o Organization of data
Formation of series: individual, discrete, continuous
Frequency distribution
Preparation of questionnaire July o Development policies and
experience(1947-1990)
Common goals of five year plans
Main features , problems and policies of
agriculture, industry and foreign trade
Project : As per CBSE guidelines
o Presentation of data
Frequency curve
Histograms
Polygon and Ogives
Bar diagrams
Pie charts
Time series graphs
Tables
August o Inflation o Economic Reforms since 1991
Need and main features(Liberalization, Privatization and Globalization)
An appraisal of LPG policies
o Index Numbers o Condensation of data
Measures of central tendency (Mean, Median and Partition values)
September o Current challenges facing Indian Economy
Poverty
Employment
Rural development
o Measures of central tendency ( Mode)
October Human capital formation
o Measures of dispersion
Range, Inter quartile range, Mean deviation, Quartile deviation
November Infrastructure – health and energy. Standard deviation, Coefficient of variation
Meaning, construction and application of Lorenz Curve

Class XI / Economics / 3
Smart Skills Sanskriti School
December Environment and sustainable
development
Development experience...allotment of different countries to the students for research on comparative study with India
o Correlation
Scatter diagram
Karl Pearson‟s coefficient of correlation
Spearman‟s coefficient of rank correlation
Spearman‟s coefficient of rank correlation
Mathematical functions and slopes
January Development experience of India - a comparison with neighbours
Submission of project as per CBSE guidelines
OTBA February Revision Revision
Reference Books: Introduction to Indian Economy NCERT Statistics for Economics NM Shah Other handouts, reference articles to be given periodically

Class XI / Economics / 4
Smart Skills Sanskriti School
INDIAN ECONOMY AT THE EVE OF INDEPENDENCE 1 mark Questions 1. What is per capita output? 2. When was Tata Iron and Steel Company incorporated in India? 3. When was India‟s first official census operation undertaken? 4. What is subsistence farming? 5. When was the railways introduced in India? 6. Name an economist who estimated India‟s per capita income during the
colonial period. 7. Name a modern day industry which was in operation at the time of
independence. 8. What is capital goods industry? 9. Give two causes of low productivity in agriculture during colonial rule in
India. 10. How is infant mortality measured? 3 / 4 mark Questions
1. What were the main causes of India‟s low level of economic development during the colonial period?
2. State three ways in which there was a drain of Indian wealth during the colonial period.
3. What objectives did the British intend to achieve through their policies of infrastructure development in India?
4. What were the main causes of India‟s agricultural stagnation during the colonial rule?
5. What was the impact of the destruction of Indian handicraft industries by the British during the colonial period?
6. What was the main motive behind the beginning of railways in India? How did the development and construction of railways in colonial period affect the Indian economy?
7. What is commercialization of agriculture? How did commercialization of agriculture affect the Indian economy during British rule?
8. What was the impact of partition on India‟s agricultural sector at the eve of independence?
9. How did the British policy affect foreign trade in India? 10. “The British rule brought a few advantages to the Indian economy”.
Explain.

Class XI / Economics / 5
Smart Skills Sanskriti School
INDIAN ECONOMY (1950 – 1990)
1 mark Questions 1. What do you mean by consolidation of land holdings? 2. Give the classification of industries according to IPR 1956. 3. What was the idea behind abolition of intermediaries? 4. What is meant by self reliance? 5. What are land reforms? 6. What is meant by land ceiling? 7. What is marketable surplus? 8. What are subsidies? 9. Define a small scale industry. 10. Name two ways in which domestic industries can be protected from
imports. 11. Why is NEP called the policy of “Economic Reforms”? 12. What is bilateral trade? 3 /4 mark Questions
1. Explain the need and types of land reforms implemented in the agricultural sector. Have these reforms been successful in their implementation?
2. “Policy of import substitution can protect domestic industry from foreign competition.” Explain with examples.
3. What are the main features of Indian agriculture? 4. What were the main shortcomings of the green revolution? 5. Why was public sector given a strategic role in industrial development
during the planning period? 6. Why is reservation and protection essential for the growth of small scale
and cottage industries in India? 7. Are subsidies necessary to promote agriculture in India? 8. What role did licensing policy and protectionism play in industrial
development of independent India? 9. What is Green Revolution? What are its features? 10. How do small scale industries promote rural development? 6 mark Questions
1. While subsidies encourage farmers to use new technology, they are a huge burden on government finances. Discuss the usefulness of subsidies in the light of this fact.
2. Why was green revolution implemented in India? Did it benefit the farmers?
3. Why should small and cottage industries be protected in India?

Class XI / Economics / 6
Smart Skills Sanskriti School
ECONOMIC REFORMS SINCE 1991
1mark Questions
1. What is outsourcing? 2. Define disinvestment. 3. Name two companies offering BPO services in India. 4. Give one way by which Indian industries were deregulated. 5. Name two services outsourced from India. 6. Is denationalisation the same as privatisation? 7. What is devaluation of rupee? 8. What is the meaning of quantitative restrictions? 9. Which aim of NEP is achieved by delicensing? 10. What is fiscal policy? 3 /4 mark Questions
1. Why are tariffs imposed? Distinguish between tariff and non-tariff barriers.
2. India has certain advantages which make it a favourite outsourcing destination. What are these advantages?
3. Write a short note on WTO. What is its importance to India? 4. What is IMF? What are its objectives? 5. Highlight the major economic achievements since the introduction of the
NEP 1991. 6. Describe the fiscal reforms undertaken in 1991. 7. Who were given the status of the „Navaratnas”? Why? 8. What is SLR and CRR? What is its effect on investment? 9. What is balance of trade? What is the effect of devaluation on a country's
balance of trade? 10. Inspite of reforms post 1991, the performance of the industrial sector has
been poor. Give reasons. 11. Discuss the changes introduced in India's foreign trade in order to
promote capital inflow and encourage foreign trade. 12. Explain the ways in which a country can receive foreign investment. 6 mark Questions
1. Why were reforms introduced in India in 1991? 2. What are the functions of the RBI? What role does it play in controlling the
operations of the commercial banks? 3. The benefits of the NEP did not trickle down to the agricultural and
industrial sectors. Why? 4. Explain the changing role of the state in the Indian economy since 1991. 5. Explain the steps taken by NEP towards a) liberalisation b) globalisation

Class XI / Economics / 7
Smart Skills Sanskriti School
POVERTY 1 mark Questions
1. What is Head Count Ratio? 2. Which are the BIMARU states? 3. Which projects have been launched to provide self-employment? 4. Which organisation collects data on poverty in India? 5. Name two programmes that aim at improving the food and nutritional
value of the poor. 6. What is „poverty gap‟? 7. What is the minimum calorie intake estimated for rural and urban areas?
3 / 4 mark Questions
1. Differentiate between Relative and Absolute poverty. 2. Explain the three / four main causes of poverty in India.
3. Explain the term “vicious circle of poverty”. 4. Explain the Mahatma Gandhi National Rural Employment Guarantee Act.
How successful has this scheme been so far? 5. What mechanisms can be adopted for redistribution of income? Can this
reduce poverty? 6. Why is population control essential for eradication of poverty? 7. “High growth rate is a necessary but not a sufficient condition for removal
of poverty”. Explain. 8. Describe the main reasons for failure of poverty alleviation programmes in
India. 9. Illustrate the difference between rural and urban poverty. Is it correct to
say that poverty has shifted from rural to urban areas? Use trends in poverty ratio to support your answer.
10. What are the ways to categorise the poor?
6 mark Questions 1. What is poverty line? How is it defined in India? 2. Describe any three measures undertaken to alleviate poverty in India. 3. Write a short note on any two of the following:
a. SwarnaJayanti Gram SwarozgarYojana b. Mahatma Gandhi National Rural Employment Guarantee Scheme c. SwarnaJayantiShahariRozgarYojana
4. What are the causes of poverty in India? 5. Write a short note on regional variation in incidence of poverty. 6. Evaluate the efforts made to solve the problem of poverty.

Class XI / Economics / 8
Smart Skills Sanskriti School
HUMAN CAPITAL FORMATION
1 mark Questions
1. Why do we need to invest in human capital? 2. Why is government intervention necessary in health and education? 3. How is expenditure on education by government measured? 4. Who prepares HDI? 5. What is education cess? Why is it important? 6. Differentiate between physical and human capital. 7. Why does labour migrate? 8. What are the different sources of human capital formation?
3 /4 mark Questions
1. Suggest the capital required for provision of health services in India. Explain with examples.
2. Explain the need for “universalisation of elementary education”. 3. How does human capital formation raise life expectancy? 4. How are economic growth and human capital interrelated? 5. Explain the role of NCERT. 6. Why do we observe regional differences in educational attainment in
India? How is human development a broader term as compared to human capital?
7. What factors contribute to human capital formation? 8. Explain the Right to Education Act implemented by the government in
2010. India has a long way to go in achieving 100% literacy attainments. Mention any four areas that can be improved to achieve these goals.
9. What is an NGO? What role does it play in the economic development of India?
10. In your view is it essential for the government to regulate the fee structure in education and health care institutions? Why?
6 mark Questions
1. Differentiate between a) physical capital and human capital b) human development and human capital.
2. “Adult and female education needs to be given priority in our country” Explain.
3. What are the main problems of human capital formation in India? Suggest two measures to overcome this problem.
4. Explain how investment in education stimulates economic growth.

Class XI / Economics / 9
Smart Skills Sanskriti School
RURAL DEVELOPMENT
One mark Questions
1. What is NABARD? 2. What is meant by rural development? 3. What is „Operation Flood‟? 4. Which sate has an efficient implementation of milk co-operatives? 5. Name the states that are major producers of marine products. 6. What is micro credit? 7. What are the non-institutional sources of agricultural credit? 8. What is public investment? 9. What is organic farming? 10. What are co-operative markets? 11. What is the function of NABARD?
3/ 4 mark Questions
1. How has horticulture encouraged Indian rural development? 2. What is rural credit? Why is it needed? 3. Why has rural banking not been able to give adequate credit to farmers? 4. How does co-operative farming benefit individual farmers? 5. Explain the features of a regulated market. 6. Explain non-farm productive activities. 7. Explain the role of Micro credit in meeting credit requirement in India. 8. What is organic farming? How does it promote sustainable development? 9. What are the different sources of credit in India? 10. Do you think farmers should be encouraged to sell directly to the
consumers? What effect will this have? 6 mark Questions
1. Write short notes on a. MSP b. Buffer Stock c.PDS 2. Information technology has gone a long way to bring about new
developments to help the farmers. Explain the role of „e chaupal‟ in this context.
3. What is organic farming? What are its advantages and its limitations? 4. What are the measures taken by the Government to improve agricultural
marketing in India? 5. Bring out the importance of animal husbandry, fisheries, and horticulture
as a source of diversification. 6. “Information technology plays a significant role in achieving sustainable
development and food security” Comment. 7. Explain the significance of Self Help Groups in rural areas. 8. What are the challenges facing rural development?

Class XI / Economics / 10
Smart Skills Sanskriti School
EMPLOYMENT- GROWTH, INFORMALISATION AND OTHER ISSUES
1 mark Questions
1. What is dependency ratio? 2. What is informalisation of work force? 3. What is economic activity? 4. Define voluntary unemployment. 5. What is jobless growth? 6. Explain the term urban unemployment 7. Why is the worker participation ratio in urban areas lower than in rural
areas in India? 8. Who is a worker? 9. What is the informal sector? 10. What is a small scale industry?
3 /4 mark Questions
1. What are the advantages regular salaried employees have over casual wage labourers?
2. Differentiate between work force and labour force. What is the participation rate?
3. Explain the types of rural unemployment. 4. Write a brief note on the National Rural Employment Guarantee Act 2005. 5. Why are fewer women found in regular salaried employment? 6. Elaborate the role of small scale and cottage industries in generating
employment in the country. 7. State how casualisation of labour is happening in the Indian economy? 8. What is disguised unemployment? Explain how disguised unemployment
can exist in rural and urban areas? Explain with the help of suitable examples.
9. Give two reasons for unemployment amongst the educated. 10. Why is the study of working population useful?
6 mark Questions
1. Explain how the public sector is leading to informalisation of employment since 2000.
2. What role does the government play in generating employment opportunities?
3. Explain the role of self-employment in a country like India. 4. With economic development, labour employment shifts to different
sectors. Explain with reference to India. 5. Differentiate with examples between informal and formal sectors that
promote employment.

Class XI / Economics / 11
Smart Skills Sanskriti School
INFRASTRUCTURE 1 mark Questions
1. Define morbidity. 2. What is medical tourism? 3. What are the types of fuel used by rural women in India? 4. Why is the use of solar energy still not popular in India? 5. What is Unani? 6. Why is CFL being popularised inspite of its high price? 7. What is GBD? 8. Why does infrastructure need to be upgraded? 9. What does plant load factor measure? 10. What is infant mortality rate? 3 /4 mark Questions
1. What are the measures taken to cope with the current challenges facing the power sector?
2. What is the contribution of NGOs in health care in India? 3. Differentiate between commercial and non- commercial sources of energy. 4. What are the emerging challenges in the health sector? 5. How do infrastructure facilities boost production and lead to economic
development of a country? 6. What are the 3 basic sources of generating power in our country? 7. List the six systems of Indian medicine. 8. Explain economic and social infrastructure. 9. What are the indicators to assess the status of health in a country? 10. What does GBD measure? What does the value indicate for India?
6 mark Questions
1. What is the three tier system of health infrastructure in India? 2. Solar energy, wind power and power produced from tides are going to be
future sources of energy. What are their comparative merits and demerits? 3. What are the challenges facing the power sector? 4. How can we increase the effectiveness of healthcare programmes? 5. Suggest ways in which healthcare facilities in India can be improved and
made available to more people in India. 6. What is the state of health facilities being offered in rural India? 7. What are commercial and non-commercial sources of energy? Explain
their consumption pattern in India.

Class XI / Economics / 12
Smart Skills Sanskriti School
ENVIRONMENT AND SUSTAINABLE DEVELOPMENT
1 mark Questions
1. What is carrying capacity of environment? 2. Name two movements to prevent cutting of trees. 3. What is sustainable development? 4. What is an „Eco Mark‟? 5. What are renewable resources? 6. Mention two sources of water pollution. 7. What is Bio-diversity loss? 8. Who monitors pollution control in India? 3 / 4 mark Questions
1. How do thermal and hydro power plants cause adverse impact on environment?
2. How can mini hydel plants sustain environment? 3. Give three steps and strategies to achieve sustainable development in
India. 4. “Solar energy has an important role to play in our lives today”. Critically
evaluate this statement in the Indian context. 5. What happens when the rate of resource extraction exceeds that of their
regeneration? 6. What is global warming? What are the long term repercussions of global
warming? 7. Explain how the opportunity cost of negative environmental impact is
high. 8. India‟s environmental problems pose a dichotomy- they are poverty
induced and, at the same time, due to affluence in living standards. Is this true?
9. Why have environmental issues of waste generation and pollution become critical today?
10. What are the nonconventional sources of energy that need to be encouraged for a cleaner environment?
6 mark Questions
1. How do the following factors contribute to the environmental crisis in India? What problems do they pose for the government? (a) Rising population (b)Affluent consumption standards (c) Illiteracy (d)Lack of waste management
2. What is sustainable development? What according to leading environmentalists must be done to achieve sustainable development? 3. What are the factors responsible for land degradation?

Class XI / Economics / 13
Smart Skills Sanskriti School
COLLECTION AND ORGANISATION OF DATA
1. In a village of 200 farms, a study was conducted to find the cropping pattern. Out of 50 farms surveyed, 50% grew only wheat. Identify the population and the sample size.
2. What kind of classification is depicted in the following table?
Sales of a firm (2003-2005)
Year Sales Rslakhs
2003
2004
2005
80
90
95
3. Prepare a frequency array of marks obtained by 25 students of a class in
an economics test: 20, 15, 20, 30, 40, 25, 25, 30, 40, 20, 35, 35, 50, 15, 50, 25, 40, 40, 30, 50, 25, 30,
30, 15, 45
4. Prepare a frequency distribution of the age of 25 students of class XI as given below:
15, 16, 16, 17, 18, 18, 17, 15, 15, 16, 16, 15, 16, 16, 15, 17, 17, 18, 19, 16 5. From the following data relating to wages of 20 workers, prepare a
frequency distribution of exclusive series with a class interval of 5: 10, 15, 25, 27, 29, 20, 24, 23, 22, 12, 14, 16, 17, 18, 19, 18, 16, 15, 5, 9
6. Construct a frequency distribution of inclusive series with an interval of 4:
10 17 15 22 11 16 19 24 29 18 25 26 32 14 17 20 23 27 30 12 15 18 24 36 18 15 21 28 33 38 34 13 10 16 19 22 29 19 23 31
7. Convert the following inclusive series into exclusive series:
C.I. 1 – 5 6 – 10 11 – 15 16 – 20 21 – 25
No. of workers 10 15 20 25 30
Class XI / Economics / 14
Smart Skills Sanskriti School
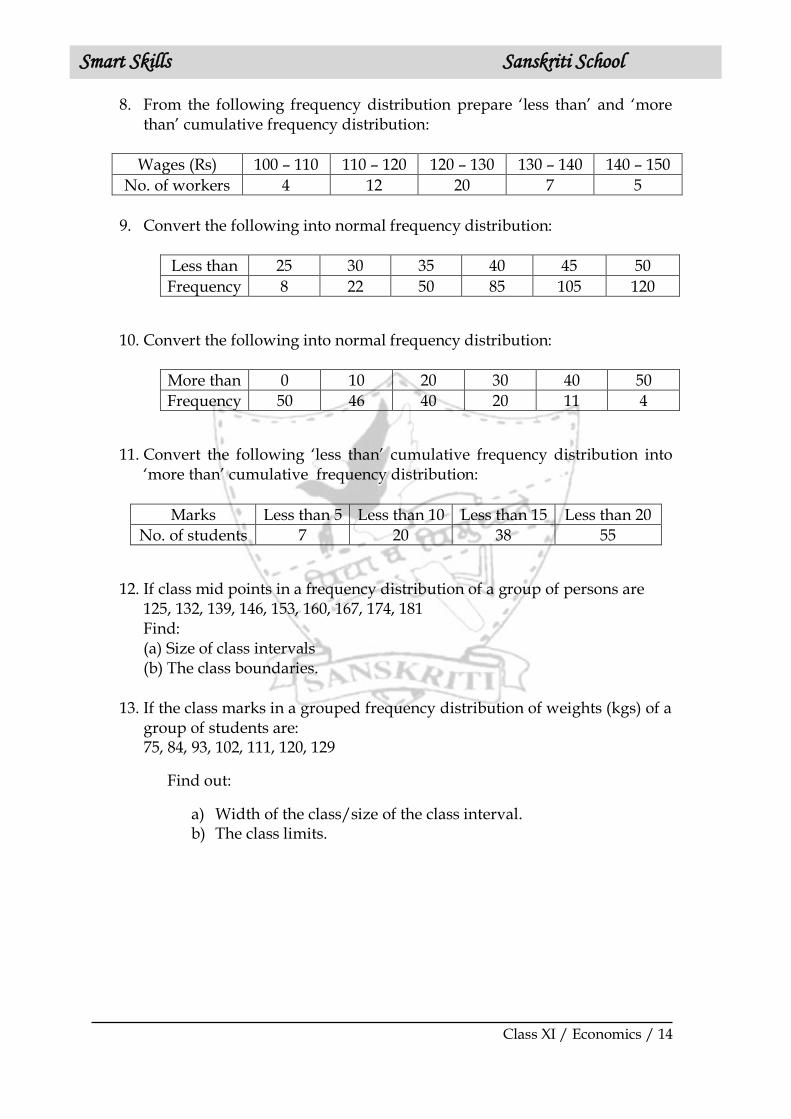
8. From the following frequency distribution prepare „less than‟ and „more than‟ cumulative frequency distribution:
Wages (Rs) 100 – 110 110 – 120 120 – 130 130 – 140 140 – 150
No. of workers 4 12 20 7 5
9. Convert the following into normal frequency distribution:
Less than 25 30 35 40 45 50
Frequency 8 22 50 85 105 120
10. Convert the following into normal frequency distribution:
More than 0 10 20 30 40 50
Frequency 50 46 40 20 11 4
11. Convert the following „less than‟ cumulative frequency distribution into „more than‟ cumulative frequency distribution:
Marks Less than 5 Less than 10 Less than 15 Less than 20
No. of students 7 20 38 55
12. If class mid points in a frequency distribution of a group of persons are 125, 132, 139, 146, 153, 160, 167, 174, 181 Find: (a) Size of class intervals (b) The class boundaries.
13. If the class marks in a grouped frequency distribution of weights (kgs) of a group of students are:
75, 84, 93, 102, 111, 120, 129
Find out:
a) Width of the class/size of the class interval. b) The class limits.

Class XI / Economics / 15
Smart Skills Sanskriti School
PRESENTATION OF DATA
Tabulation
1. Draw a blank table depicting university admission details showing faculty, sex and residence.
2. The Economic Survey of 2002 revealed that in 2001 – 2002, total production of food grains was 1928 lakh tons of which production of rice and wheat was 860 and 708 lakh tons respectively. The rest was production of other crops. Percentage share of rice and wheat in the total production of crops was 44.60 and 36.72 respectively. Construct a suitable table.
3. Point out the mistakes in the following table and rearrange it in the form
of a good table.
Literate Less than 20 20 -30 30 -40 40 and above
Male
Female
4. The Indian Sugar Mills Association reported that “sugar production
during the first fortnight of December, 2001 was 3, 87,000 tons as against 3, 78,000 tons during the same fortnight last year 2000. The off - take of sugar from factories during the first fortnight of December 2001 was 2,83,000 tons for internal consumption and 41,000 tons for exports as against 1,54,000 tons for internal consumption and nil for exports during the same fortnight last season”. Present the data in a tabular form.
5. 70 members of a club went on a picnic and on an average they paid Rs 14.
There were 50 senior citizens each of whom paid Rs 15.The younger members were charged at a higher rate. The number of helpers was 10 (half of them were males) and they were taken free of cost. The number of females was 10 % of the total of which one was a senior citizen.
Tabulate the above information. 6. Out of a total number of 1,807 women who were interviewed for
employment in a textile factory of Mumbai, 512 were from textile areas and the rest from the non-textile areas. Among the married women who belonged to textile areas, 247 were experienced and 73 inexperienced, while for non-textile areas the corresponding figures were 49 and 520 respectively. The total number of inexperienced women was 1,341 of whom 111 resided in textile areas. Of the total number of women, 918 were unmarried, and of these the number of experienced women in the textile and non-textile areas was 154 and 16 respectively. Tabulate the given information
Class XI / Economics / 16
Smart Skills Sanskriti School
Diagrammatic Presentation
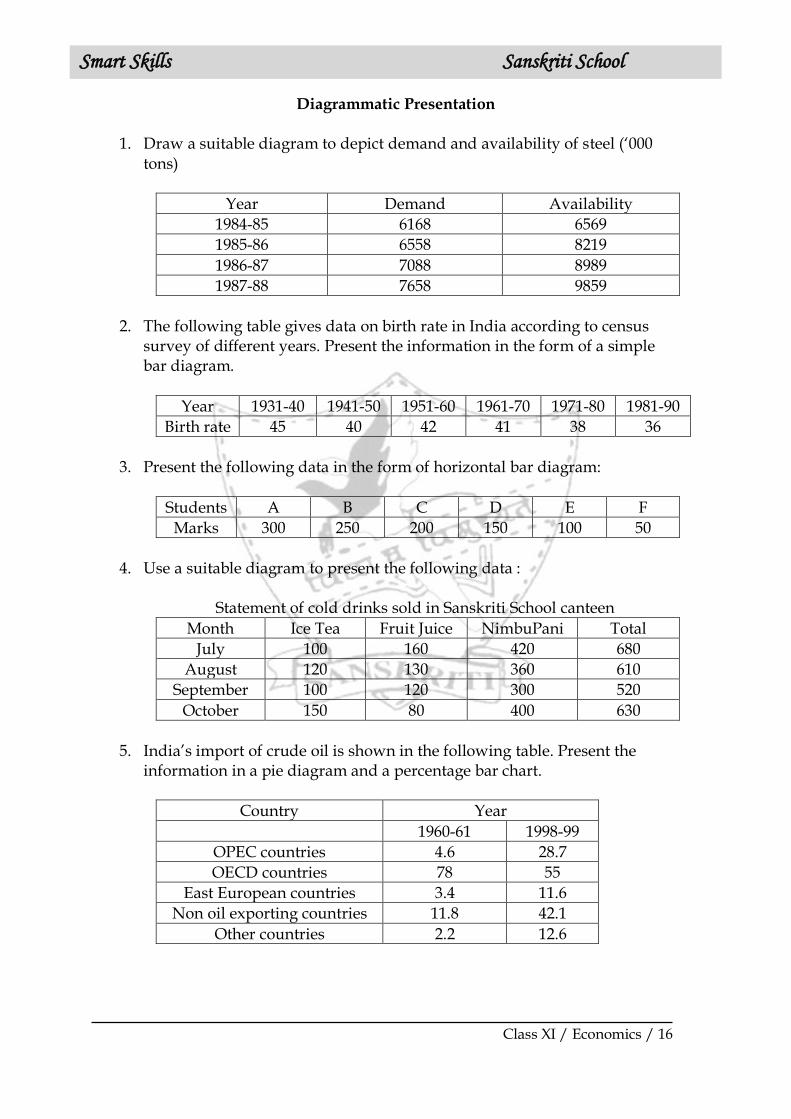
1. Draw a suitable diagram to depict demand and availability of steel („000
tons)
Year Demand Availability
1984-85 6168 6569
1985-86 6558 8219
1986-87 7088 8989
1987-88 7658 9859
2. The following table gives data on birth rate in India according to census
survey of different years. Present the information in the form of a simple bar diagram.
Year 1931-40 1941-50 1951-60 1961-70 1971-80 1981-90
Birth rate 45 40 42 41 38 36
3. Present the following data in the form of horizontal bar diagram:
Students A B C D E F
Marks 300 250 200 150 100 50
4. Use a suitable diagram to present the following data :
Statement of cold drinks sold in Sanskriti School canteen
Month Ice Tea Fruit Juice NimbuPani Total
July 100 160 420 680
August 120 130 360 610
September 100 120 300 520
October 150 80 400 630
5. India‟s import of crude oil is shown in the following table. Present the
information in a pie diagram and a percentage bar chart.
Country Year
1960-61 1998-99
OPEC countries 4.6 28.7
OECD countries 78 55
East European countries 3.4 11.6
Non oil exporting countries 11.8 42.1
Other countries 2.2 12.6
Class XI / Economics / 17
Smart Skills Sanskriti School
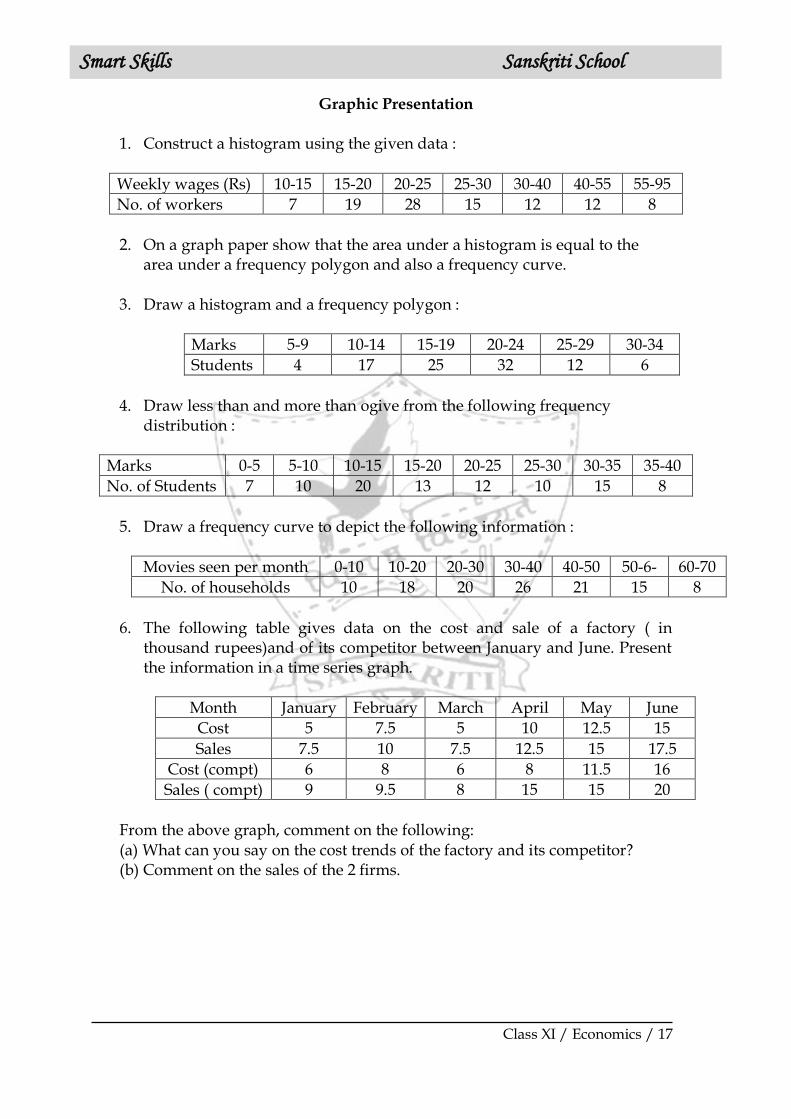
Graphic Presentation
1. Construct a histogram using the given data :
Weekly wages (Rs) 10-15 15-20 20-25 25-30 30-40 40-55 55-95
No. of workers 7 19 28 15 12 12 8
2. On a graph paper show that the area under a histogram is equal to the
area under a frequency polygon and also a frequency curve.
3. Draw a histogram and a frequency polygon :
Marks 5-9 10-14 15-19 20-24 25-29 30-34
Students 4 17 25 32 12 6
4. Draw less than and more than ogive from the following frequency
distribution :
Marks 0-5 5-10 10-15 15-20 20-25 25-30 30-35 35-40
No. of Students 7 10 20 13 12 10 15 8
5. Draw a frequency curve to depict the following information :
Movies seen per month 0-10 10-20 20-30 30-40 40-50 50-6- 60-70
No. of households 10 18 20 26 21 15 8
6. The following table gives data on the cost and sale of a factory ( in
thousand rupees)and of its competitor between January and June. Present the information in a time series graph.
Month January February March April May June
Cost 5 7.5 5 10 12.5 15
Sales 7.5 10 7.5 12.5 15 17.5
Cost (compt) 6 8 6 8 11.5 16
Sales ( compt) 9 9.5 8 15 15 20
From the above graph, comment on the following: (a) What can you say on the cost trends of the factory and its competitor? (b) Comment on the sales of the 2 firms.

Class XI / Economics / 18
Smart Skills Sanskriti School
MEASURES OF CENTRAL TENDENCY Mean
1. The following table gives the daily income of 10 workers in a factory. Find the mean by using direct & step deviation method.
Workers A B C D E F G H I J
Daily income (Rs) 120 150 180 200 250 300 220 350 370 260
2. Using the step deviation method, find the mean of the following:
Marks (Less than) 10 20 30 40 50 60
Frequency 5 12 25 36 45 50
3. Following are the marks obtained by 100 students in economics.
Find the arithmetic mean by using (i) Direct method (ii) Step deviation method.
Marks 0-10 10-20 20-30 30-40 40-50 50-60
No of students 5 10 25 30 20 10
4. The sales of a balloon seller in seven days in a week are as given below:
Days Mon Tue Wed Thurs Fri Sat Sun
Sales(in Rs) 100 150 125 140 160 200 250
If the profit is 20% of sales, find his average profit per day. 5. Find the missing item p of the following distribution where the arithmetic
mean is 11.37.
X 5 7 p 11 13 16 20
F 2 4 29 54 11 8 4
6. Calculate the arithmetic mean from the following data:
Midpoints 5 15 25 35 45 55
Frequency 5 7 12 18 5 3
7. The mean height of 25 male workers in a factory is 61cms, and the mean
height of 35 female workers in the same factory is 58cms. Find the combined mean height of 60 workers in the factory.
8. The mean of 200 items was 50. Later it was discovered that two items were misread as 92 and 8 instead of 192 and 88. Find the correct mean.

Class XI / Economics / 19
Smart Skills Sanskriti School
Median
1. Find the median of the following data: 20, 15, 25, 28, 18, 16, and 30.
2. Calculate the median from the following data by arranging them in
ascending order:
X 160 151 162 164 156
Frequency 5 6 6 2 7
3. Calculate the mean and median from the following data series:
Marks 10-20 20-30 30-40 40-50 50-60 60-70
No of students 5 5 5 20 10 5
4. Using the graphic method locate median from the following information:
Marks 0-10 10-20 20-30 30-40 40-50
No of students 10 20 30 20 10
5. Compute the median for the following data:
Values( Less than) 10 20 30 40 50
Frequency 11 18 34 48 60
6. A survey of small scale units in Thane district indicated the following age
of workers:
Age 16-19 20-29 30-39 40-49 50-59 60-69
Frequency 15 46 49 32 28 14
Calculate the median of the above data.
7. Find the missing frequency of the group 20-30, if the median of the series is 28.
Class intervals 0-10 10-20 20-30 30-40 40-50
Frequency 5 8 X 16 6

Class XI / Economics / 20
Smart Skills Sanskriti School
Mode
1. Calculate the mode of the following data: 3,5,4,7,9,6,5,5,9,1,2,3,5,6.
2. Using the grouping method, calculate the mode of the following data:
Size 30 35 40 45 50 55
Frequency 5 9 16 10 6 4
3. Compute mode from the following data:
Values( Less than) 10 20 30 40 50
Frequency 10 30 60 80 90
4. Calculate the mode of the following data:
Midpoints 5 10 15 20 25 30 35 40 45
Frequency 7 13 19 24 32 28 17 8 6
5. Calculate the mode using the grouping method:
Marks 0-10 10-20 20-30 30-40 40-50 50-60 60-70
No of students 2 5 7 10 7 5 2
6. Calculate mean, median and mode from the following data:
Monthly income
300-500 500-700 700-900 900-1100 1100-1300 1300-1500
No. of households
25 55 30 20 14 6
7. Locate the mode graphically and also calculate it using the inspection
method:
Marks 0-10 10-20 20-30 30-40 40-50 50-60 60-70
No of students 5 10 20 25 20 10 5

Class XI / Economics / 21
Smart Skills Sanskriti School
Positional values
1. The following data shows the monthly wages of 10 workers. Calculate the
lower and upper quartiles: Monthly wages: 120,150,170,180,181,187,190,192,200,210.
2. Calculate Q1 and Q3 from the following data:
Wages 0-5 5-10 10-15 15-20 20-25 25-30
No of workers 4 6 3 8 12 7
3. Calculate P10 and D4 from the following data:
Marks 10 20 30 40 50 60
No. of students 4 10 20 8 6 3
4. Calculate P20,Q1 and median with the help of the following data:
Income (in Rs) 800 1000 1200 1400 1600 1800
No. of persons 16 24 26 30 20 5
5. Find median, first quartile and third quartile of the following series:
Height (in cms)
58 59 60 61 62 63 64 65 66
No. Of persons
2 3 6 15 10 5 4 3 1
6. The following table gives the distribution of wages of 65 employees in a
factory. Draw a 'less than' curve from the above data and estimate the number of employees earning at least Rs63 but less than Rs 75.
Wages in Rs (More than)
50 60 70 80 90 100 110 120
No. of employees
65 57 47 31 17 7 2 0
7. The following series relates to the daily income of workers employed in a firm. Compute:
a) Highest income of lowest 50% workers b) Minimum income earned by top 25% workers c) Maximum income earned by lowest 25% workers
Daily Income (in Rs) 10-14 15-19 20-24 25-29 30-34 35-39
No. of workers 5 10 15 20 10 5

Class XI / Economics / 22
Smart Skills Sanskriti School
MEASURES OF DISPERSION
1. Find range and coefficient of range from the following data:
X 25 27 30 31 32 38 48 30 50
2. Find range and coefficient of range from the following data:
Wages 8 9 10 11 12 13 14
No. of workers 10 15 18 10 4 5 3
3. Find range and coefficient of range from the following data:
Size 0 – 10 10 – 20 20 – 30 30 – 40 40 – 50
Frequency 2 3 12 10 8
4. Calculate Inter- quartile range from the following data:
C.I. 1 – 5 6 – 10 11 – 15 16 – 20 20 – 25
Frequency 5 10 15 6 4
5. Calculate quartile deviation and its coefficient from the following data:
Wages 50 55 58 60 70 90 95 110
No. of workers 5 7 12 10 8 6 2 9
6. Calculate coefficient of quartile deviation from the following data:
Wages(Rs) Less than 35 35 – 37 38 – 40 41 – 43 Over 43
No. of workers 14 62 99 18 7
7. Compute mean deviation from mean and its coefficient from the following
data:
Weekly wages (Rs) 200 – 400 400 – 600 600 – 800 800 – 1000
No. of workers 20 40 30 10
8. Calculate mean deviation from the mean from the following data:
C. I. 45 – 50 50 – 55 55 – 60 60 – 65
Frequency 20 26 38 16
9. Calculate standard deviation and its coefficient from the following data
using direct method: 100, 90, 120, 110, 80, 70, 150, 130, 50, 100
10. Calculate standard deviation from the following data
No. of goals 0 1 2 3 4
No. of matches 27 9 8 5 4

Class XI / Economics / 23
Smart Skills Sanskriti School
11. Calculate standard deviation from the following data using step deviation method:
Marks Below 20 Below 40 Below 60 Below 80 Below 100
No. of students 8 20 50 70 80
12. From the prices of shares X and Y given below, state which share is more
stable in value?
X 41 44 43 48 45 46 49 50 42 40
Y 91 93 96 92 90 97 99 94 98 95
13. The scores of two batsmen A and B in five innings during a certain match
are:
A 32 28 47 63 71
B 19 31 48 53 67
Which batsman is a better scorer and who is a more consistent batsman?
14. Daily wages paid to workers in two factories X and Y are given below:
Daily wages No. of workers
Factory X Factory Y
12 – 13 15 25
13 – 14 30 40
14 – 15 44 60
15 – 16 60 35
16 – 17 30 12
a) Which factory pays higher average wages? b) Which factory has a more consistent wage structure?
15. Draw Lorenz curve from the data given below:
Income 100 200 400 500 800
No. of persons 80 70 50 30 20
16. Draw Lorenz curves for factory A and B and compare the degree of
inequality in incomes in two different factories:
Wages (Rs) No. of workers
Factory A Factory B
10 60 150
12 80 100
14 120 90
16 90 110
20 100 30
28 50 20

Class XI / Economics / 24
Smart Skills Sanskriti School
MEASURES OF CORRELATION
1. If r = + 1 or – 1, what kind of relationship exists between X and Y?
2. Find Karl Pearson‟s coefficient of correlation if N = 50, ∑X = 75, ∑X2 = 130,
∑Y= 70, ∑Y2 = 140 and ∑XY = 128.
3. Can „r ‟ lies outside – 1 and + 1?
4. Draw three hypothetical scatter diagrams showing the following value of
„r ‟:
a) r = - 1 , (b) r = 0 & (c) r = + 1
5. The following data shows respective heights of 8 girls and 8 boys in
inches:
Height of girls 65 63 67 64 68 70 71 69
Height of boys 67 66 68 65 69 68 70 68
Construct a scatter diagram and indicate the nature of correlation.
6. Draw a scatter diagram and interpret whether the correlation is positive or
negative:
X 4 5 6 7 8 9 10 11 12 13 14 15
Y 78 72 66 60 54 48 42 36 30 24 18 12
7. Calculate Karl Pearson‟s coefficient of correlation from the following data:
Price (Rs) 10 12 14 16 18
Quantity (Units) 20 29 21 22 28
8. Calculate Karl Pearson‟s coefficient of correlation from the following data:
Price Index (X) 120 150 190 220 230
Money Supply in Rscrores (Y) 1800 2000 2500 2700 3000

Class XI / Economics / 25
Smart Skills Sanskriti School
9. Calculate Karl Pearson‟s coefficient of correlation between ages of
husband and wife from the following data:
Age of husband 21 22 23 24 25 26 27
Age of wife 16 15 17 18 19 20 21
10. Calculate Karl Pearson‟s coefficient of correlation from the following data:
X 200 190 180 170 160 150
Y 20 30 40 60 70 80
11. A group of 8 students get the following percentage of marks in a test in
statistics and accountancy.
% Marks in Statistics 50 60 65 70 75 40 80 85
% Marks in accountancy 80 71 60 75 90 82 70 50
Compute the coefficient of rank correlation.
12. Five competitors in a beauty contest are ranked by three judges in the
following order:
Rank by judge A 1 2 3 4 5
Rank by judge B 2 4 1 5 3
Rank by judge C 1 3 5 2 4
Using rank correlation coefficient, determine which pair of judges has the
nearest approach to common tastes in beauty.
13. Calculate coefficient of rank correlation from the following data:
X 48 33 40 9 16 16 65 24 16 27
Y 13 13 24 6 15 4 20 9 6 19
14. Calculate Spearman‟s coefficient of correlation from the following data:
X 20 11 24 18 20 22
Y 24 9 20 22 9 21

Class XI / Economics / 26
Smart Skills Sanskriti School
INDEX NUMBER
1. With the help of following data calculate index number for 2007 taking 2006 as the base year using simple aggregative method:
Commodity Price in 2006 (Rs) Price in 2007 (Rs)
A 100 145
B 90 130
C 145 200
D 180 275
E 85 150
2. Compute a price index from the following by simple aggregative & simple average of price relative method:
Commodity A B C D E F
Prices in 2005 200 300 100 250 400 500
Prices in 2008 250 300 150 350 450 550
3. Calculate weighted aggregative price index from the following data by using Paasche‟s method:
Commodities Base Year Current Year
Price Quantity Price Quantity
A 10 30 12 50
B 8 15 10 25
C 6 20 6 30
D 4 10 6 20
4. Construct index numbers of prices from the data given below by applying: (a) Laspeyre‟s method (b) Paasche‟s method
Commodities Base Year Current Year
Price Quantity Price Quantity
A 2 40 3 20
B 1.5 30 2.5 40
C 1 50 1.5 30
D 2.5 20 2 80
5. From the following data compute index number for 2005 taking 2003 as base year by applying weighted average of price relative method:
Commodity Quantity Price (in Rs)
2003 2003 2005
A 5 qtl 100 125
B 5 qtl 200 250
C 1 qtl 80 100
D 3 qtl 120 180
E 5 Kg 8 10
F 80 Kg 2 3

Class XI / Economics / 27
Smart Skills Sanskriti School
6. The monthly per capita expenditure incurred by workers of an industrial centre during 2002 and 2006 on the following items are given below. The weights of these items are 75, 10, 5, 6 and 4 respectively. Prepare a weighted index number for cost of living for 2006 with 2002 as base.
Items Price in 2002 Price in 2006
Food 100 200
Clothing 20 25
Fuel and lighting 15 20
House rent 30 40
Miscellaneous 35 65
7. Construct the Consumer Price Index Numbers for 2005 on the basis of 2004 from the following data using:
(a) Aggregative Expenditure Method (b) Family Budget Method
Articles Quantity consumed in 2004
Price in 2004 (Rs)
Price in 2005 (Rs)
Wheat 2 qtl 150 165
Gram 1 qtl 80 100
Rice 1 qtl 120 150
Bajra 1.5 qtl 60 90
Arhar 1.5 qtl 100 140
Oil 10 qtl 10 12
Gur 40 qtl 2 3
8. What will be the real wage of the consumer if his money wage is Rs 10,000 and the cost of living index is 526?
9. If the salary of a person in the base year is Rs 4000 per annum and the current year salary is Rs 6000. By how much should his salary rise to maintain the same standard of living if the CPI is 400?
10. Calculate the inflation rate from the following data:
Year 1998 – 99 1999 – 2000 2000 – 01 2001 – 02 2002 – 03
WPI (1993 -94 ) 140.7 145.7 155.7 161.3 166.8
11. Below are given the output data for five industries for two years 2002 and
2006. Prepare the index of industrial production for the year 2006 with 2002 as base year.
Industry Output (units)
Weights 2002 2006
Software 100 150 10
Petrochemical 75 100 30
Fabrics 90 90 20
Coal 60 40 15
Machinery 80 100 25
Class XI / Economics / 28
Smart Skills Sanskriti School
Inflation
Price of a commodity is determined by the quantity demanded and quantity
supplied of the commodity. Price rises when either demand increases or supply decreases. However, a mere rise in the price of a commodity or a few commodities in an economy cannot be termed as inflation. Inflation is a situation of persistent and appreciable rise in the general price level of an economy over a period of time leading to a fall in the purchasing power of money. This implies that every unit of rupee can buy fewer goods and services as an economy witnesses inflation. A mild inflation (less than 3%)is good for an economy as it encourages people to invest in productive areas, thereby boosting an economy There are two causes of inflation: demand pull inflation and cost push inflation. Demand pull inflation This happens when the demand for goods and services is greater than their supply. This excess demand tends to push prices up. The main causes are: 1. Increase in disposable income of the consumer: this results in increase in
purchasing power and hence greater demand for goods and services e.g. the implementation of 6th Pay Commission enhanced the purchasing power of many government employees.
2. Increase in population: this raises the number of consumers in the market and hence the total demand.
3. Growth in black money: Illegal and unaccounted for money leads to higher consumption as this money is difficult to save in bank accounts etc.
4. Increase in money supply: RBI may increase money supply in the economy through its monetary policy by lowering the CRR or SLR. This raises the circulation of money in the economy and in turn the demand for goods and services.
5. Increase in Government expenditure: public expenditure e.g. on Commonwealth Games, increases the demand for many goods and services.
Cost push inflation
This occurs at the supply end of the commodity, raising its cost of production. This kind of inflation spreads from one industry to another as they are interdependent.

Class XI / Economics / 29
Smart Skills Sanskriti School
The main causes are: 1. Higher wage rates: when wages and salaries increase, the producers shift
this burden to their consumers who eventually pay the increased price of the product. This increases the cost of living and labour demands higher wages to fight increased cost of living. It leads to a further increase in wages and salaries. This is termed as wage spiral.
2. Higher profit margins:when producers increase their profit margins,prices of commodities go up.
3. Shortage of inputs:a fall in the supply of inputs e.g. decline in procurement of coffee beans due to frost, increases the cost of production.
4. Increased tax structure: when sales tax, excise duty, VAT increases, the cost of production may go up and hence the price of the commodity.
So what causes inflation in India? Demand factors leading to inflation
Growth of population
Rise in income and Employment
Increasing pace of urbanisation: leads to increase in demand for luxury goods due to migration and demonstration effect.
Supply factors leading to cost push inflation
1. Irregular agricultural supply: due to dependence on monsoons or lack of irrigation.
2. Agricultural price policy:the government‟s policy of minimum support price raises price of agricultural goods, in a bid to help the farmers.
3. Hoarding and Black marketing: traders and big farmers hoard essential commodities like onions, oil, medicines and even food grains to create artificial scarcities. This raises the price of the commodities.
4. Inadequate industrial production:when the demand for manufactured goods cannot match the growing demand for the same, it pushes up the price of industrial goods.
5. External factors: rise in price of imports especially crude oil, machinery, raw materials raises the cost of production and eventually the price of goods.
Assignment:
1. Find India‟s annual inflation rates since 2000.
2. Plot a time series graph indicating the above research.
3. Analyse what may be the causes of sharp rises / fall in rates of inflation.

Class XI / Economics / 30
Smart Skills Sanskriti School
Basic Mathematical Concepts used in Economics
Mathematical equations and graphical illustrations play a significant role in
economics. These tools are used to highlight relationships that exist between
different economic variables. Through the use of mathematical language and graphs
we can better understand economic theories. Hence, it is important to understand
some of the basic concepts and terms that we shall be frequently using during the
course next year.
Functions
The concept of functions demonstrates the dependence between variables. These
functions show how one variable changes (dependent variable) due to some other
variables (independent variables). For example there could be a function: C = f(Y).
This equation shows that consumption (C) is a function of income (Y). Here Y is the
independent variable and C is the dependent variable. The symbol „f‟ suggests that
the two variables are related. However, the exact nature of the relationship is given
by a more specific equation.
Functions can be of different types – linear or non-linear including cubic and
quadratic function. However, mostly in our analysis we shall be using a linear
function, which is represented mathematically as the equation of a straight line. It is
typically written as:
y = a + bx
where y is the dependent variable, whose value depends on the value of the
independent variable (x) and two constants – „a‟ and „b‟.
Let us now understand the meaning of „a‟. „a‟ is the value that y will take when x is
equal to zero. In other words, on a graph paper, with x and y axes, „a‟ represents the
y–intercept.
„b‟ measures the slope of the linear function. Slope is a very important concept in
Economics as it tells us how one variable changes in response to a change in another
variable. For example in our linear equation, „b‟ gives the rate of change of y per unit
change in x. More formally, a slope measures the rate of change of the dependent
variable when there is a per unit change in the independent variable. It may show for
example how demand changes when price changes or how consumption changes
when income changes or how sales grow as output changes.

Class XI / Economics / 31
Smart Skills Sanskriti School
Graphing functional relationships
Let us extend our discussion of the linear function by illustrating it graphically.
As shown in figure 1 above, the independent variable is measured along the x-axis
whilst the dependent variable is measured along the y-axis. „a‟ is the value of the y-
intercept. This is the point where x is equal to zero. Since we have a linear function,
the graph is a straight line. The steepness or flatness of the line is determined by its
slope. The greater the slope of a line, the steeper it is. Graphically, the slope is
calculated as
slope = change in y = rise
change in x run
In the diagram the rise is given by the change in y (∆y), whereas the run is given by
the change in x (∆x).
In addition to the steepness, the slope also shows the direction of the linear curve.
This is seen through the sign before the slope. In our linear equation y = a + bx, the
slope b has a positive sign before it. This shows that the linear curve will be an
upward sloping line which from left to right. It reflects a positive relationship
between y and x. If our linear function is y = a – bx, then the slope b has a negative
sign before it. This negative sign would mean that the linear curve will be a
downward sloping line, which moves from left to right, as seen in figure 2 given
below. It shows that y and x have a negative relationship – a positive rise is due to a
negative run and vice versa.
y = a - bx
∆
y ∆
x
a
O
y = a + bx ∆
y ∆
x
x
y
x x O O
a
y y
a
Class XI / Economics / 32
Smart Skills Sanskriti School
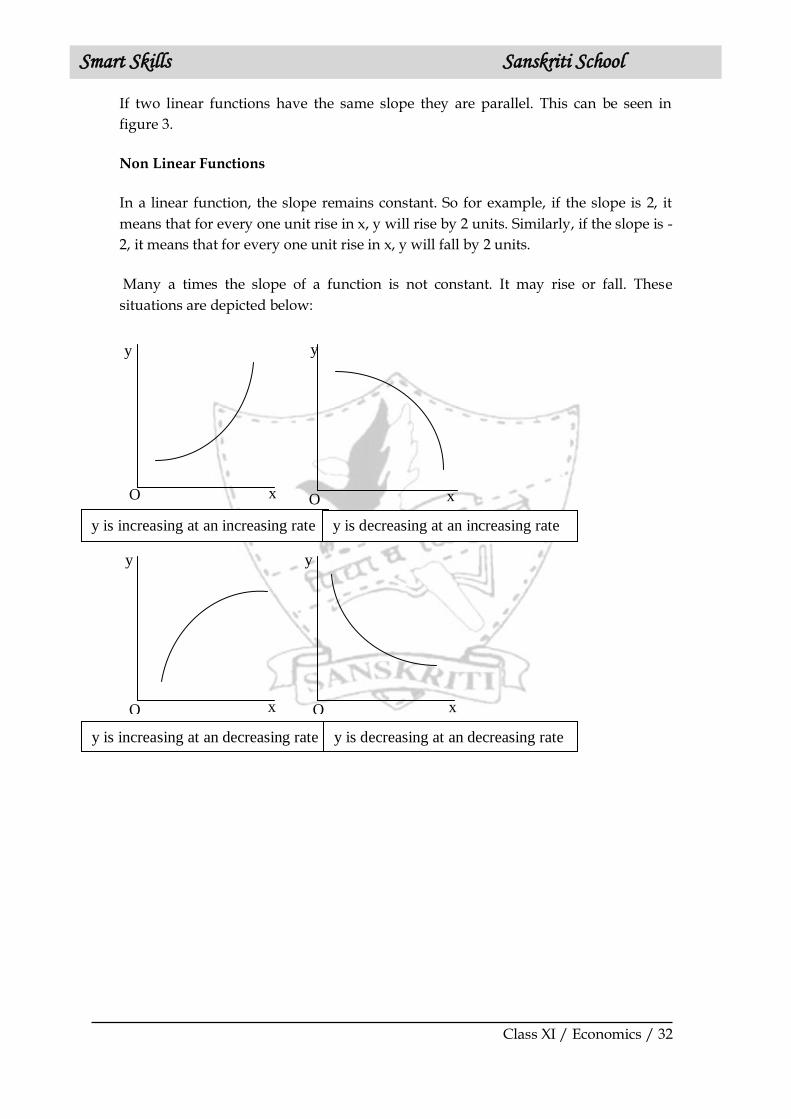
If two linear functions have the same slope they are parallel. This can be seen in
figure 3.
Non Linear Functions
In a linear function, the slope remains constant. So for example, if the slope is 2, it
means that for every one unit rise in x, y will rise by 2 units. Similarly, if the slope is -
2, it means that for every one unit rise in x, y will fall by 2 units.
Many a times the slope of a function is not constant. It may rise or fall. These
situations are depicted below:
O O
x O O
y is increasing at an increasing rate y is decreasing at an increasing rate
y is increasing at an decreasing rate y is decreasing at an decreasing rate
y y
x
y y
x x

Class XI / Economics / 33
Smart Skills Sanskriti School
Project
Economics Research Paper
As part of your assessment for the final term, a research paper has to be submitted by 14th December 2016. You may work individually or form a team with a partner. (This means each team has at most two students). You may choose to write a research paper on any one of the topics suggested in the list. The paper must have a title page, main content, and references. The paper should be typed in font size 11 (Book Antiqua) and should be 3- 5 pages, excluding tables, diagrams and references
Steps involved- 1. Students select a general topic for research and make a list of key words to help
search for information, and get an overview of their topic. 2. Students become “research hounds” when they spend as much time as possible
finding all the research available. This is probably the most time-consuming part of the research paper. Students refine their research subject and write a statement of purpose on their chosen topic.
3. Students brainstorm questions about their focused topic, begin to create an outline and start thinking about the first draft. They list more key words, identify the best sources to use, begin making note cards, and create a “working” thesis statement.
4. Students write the body of their paper from their outline and notes and then the introduction and conclusion.
5. Students spend time finalizing the citations and completing the Works Cited page.
6. Students now must carefully evaluate, revise, and proofread their paper. This is one of the most important parts of the process, and it‟s also the one that students tend to do too quickly. Once finished with the laborious writing of the research paper, they must go through this part of the process more than once in order to submit their very best work.
It is recommended that the first three steps must be completed during the
summer break so that there is enough time to prepare and submit a great research paper. Suggested topics-
1. Impact of MGNREGA on rural- urban migration in India 2. Improved infrastructure due to construction of Delhi Metro and impact on
Delhi‟s per capita income 3. Link between poverty and crime in India 4. Correlation between family income and educational attainment 5. Link between taxes on tobacco and tobacco related deaths. 6. Fertilizer subsidies and agricultural output in India 7. Link between growth of IT sector and employment 8. Contribution of the IT sector to exports in India 9. A study on the banking sector in India as a result of globalization 10. Impact of the New Economic Policy (1991) on the Balance of Payments 11. Effectiveness of cash transfers versus direct subsidies

Class XI / Economics / 34
Smart Skills Sanskriti School
12. Green revolution and its impact on agricultural output and productivity 13. Trends in the dollar- rupee rate and Indian exports since New Economic Policy 14. Changes in interest rates in India and inflow of foreign exchange 15. Indian government‟s spending on education and health and GDP growth rate
Please Note-
1. Submissions after the deadline will not be accepted. 2. Intentional plagiarism will not fetch the student any marks. The paper will carry 10 marks and will be assessed as follows-
Rubric for Grading the Research Paper
Outstanding Good Fair Unacceptable
Visual Presenta-
tion
Cover page with relevant info,
including descriptive title. Section headings.
Good graphics, with appropriate citations.
Clean and professional looking.
Cover page. Sections headings. Graphics included.
Professional looking.
Most relevant
information present. Some section headings,
captions, or graphics used.
Looks like H.S. paper.
Dirty or ragged
appearance. Missing titles, captions,
headings, name of author.
Not professional.
Abstract Abstract is proper length.
Highly informative, complete and easy to understand.
Appropriate vocabulary is used. Abstract makes you want to
read the paper.
Abstract is proper length.
Informative, complete
and understandable. Appropriate
vocabulary is used.
Abstract is proper length. Somewhat informative
and understandable.
Abstract is not the proper length.
Not very informative or
understandable.
Structure Thesis is clear, easy to find,
and appropriate to the assignment.
Thesis is supported by the rest of the paper.
Paper contains a “roadmap” for
the reader. There is a logical flow to the
topics/arguments. Conclusion follows clearly
from the arguments presented.
Thesis is clear and appropriate.
Thesis fairly well supported.
Paper is fairly well organized.
Conclusion follows
from the rest of the
paper.
Thesis is fairly clear. Inconsistent support for
thesis. Paper weakly organized. Conclusion is acceptable.
Thesis unclear and/or inappropriate.
Thesis not supported. Paper is not organized.
Conclusion doesn’t
follow from the rest of
the paper.
Research The evidence comes from a
wide variety of valid sources. The bibliography is complete
and reflects appropriate sources.
The evidence used reflects
multiple views.
The evidence comes from valid sources. The bibliography is
complete. The evidence used
reflects multiple
views.
Valid sources are inconsistently used. The bibliography is
missing some pieces.
The evidence seldom comes from valid
sources. The bibliography is missing significant
information.
Thinking Arguments are pertinent to the
topic. Arguments are logical,
supported with evidence. The key arguments have been
made – no major points have
been left out.
Arguments are pertinent to the topic. Arguments are fairly
logical and reasonably supported.
Most key arguments
have been made.
Arguments are not consistently pertinent, logical, or supported.
Few key arguments have
been made.
Arguments not pertinent. Arguments rarely, if at
all, logical and supported.
Almost no key arguments
have been made.
Interest
factor
Language and style appropriate for intended audience.
Paper presents well-developed
analysis and synthesis. There is nuance, inference and
subtlety to the paper. Main points are memorable.
Reader is very engaged.
Language and style appropriate.
Paper presents
reasonable analysis and synthesis. There is a little
nuance, inference and subtlety.
Main points clear. Reader is engaged.
Language and style only fair.
Less-developed analysis
and synthesis. Nuance, inference and
subtlety lacking. Main points present, not
well made.
Language and style poor. Analysis and synthesis
lacking. Main points not
discernible.

Class XI / Economics / 35
Smart Skills Sanskriti School
ASSIGNMENT: 1
Indian Economy at the eve of independence
1. Explain the following terms:
a. Colonial economy (1)
…………………………………………………………………………………………
…………………………………………………………………………………………
…………………………………………………………………………………………
b. Dependent economy (1)
…………………………………………………………………………………………
…………………………………………………………………………………………
2. Explain the demographic situation in India that showed that India was an
underdeveloped country. (3)
…………………………………………………………………………………………
…………………………………………………………………………………………
…………………………………………………………………………………………
…………………………………………………………………………………………
…………………………………………………………………………………………
…………………………………………………………………………………………
…………………………………………………………………………………………
…………………………………………………………………………………………
…………………………………………………………………………………………
…………………………………………………………………………………………
…………………………………………………………………………………………
3. What were the changes that took place in the composition of foreign trade,
after the arrival of the British in India? (3)
…………………………………………………………………………………………
…………………………………………………………………………………………
…………………………………………………………………………………………
…………………………………………………………………………………………
…………………………………………………………………………………………
…………………………………………………………………………………………
…………………………………………………………………………………………
…………………………………………………………………………………………
…………………………………………………………………………………………
…………………………………………………………………………………………
ECONOMICS DEPARTMENT SANSKRITI SCHOOL
Max Marks: 15

Class XI / Economics / 36
Smart Skills Sanskriti School
4. Explain the state of industrial sector inherited by Indians at the time of
independence. (3)
…………………………………………………………………………………………
…………………………………………………………………………………………
…………………………………………………………………………………………
…………………………………………………………………………………………
…………………………………………………………………………………………
…………………………………………………………………………………………
…………………………………………………………………………………………
…………………………………………………………………………………………
…………………………………………………………………………………………
…………………………………………………………………………………………
…………………………………………………………………………………………
…………………………………………………………………………………………
…………………………………………………………………………………………
…………………………………………………………………………………………
…………………………………………………………………………………………
…………………………………………………………………………………………
5. “The Indian Economy before the British rule was a prosperous self sufficient
economy”. Give 4 reasons to substantiate this statement. (4)
…………………………………………………………………………………………
…………………………………………………………………………………………
…………………………………………………………………………………………
…………………………………………………………………………………………
…………………………………………………………………………………………
…………………………………………………………………………………………
…………………………………………………………………………………………
…………………………………………………………………………………………
…………………………………………………………………………………………
…………………………………………………………………………………………
…………………………………………………………………………………………
…………………………………………………………………………………………
…………………………………………………………………………………………
…………………………………………………………………………………………
…………………………………………………………………………………………
…………………………………………………………………………………………
…………………………………………………………………………………………
…………………………………………………………………………………………
…………………………………………………………………………………………
…………………………………………………………………………………………
…………………………………………………………………………………………

Class XI / Economics / 37
Smart Skills Sanskriti School
ASSIGNMENT: 2
Indian Economy: 1950-1990
1. What was the Mahalanobis model of economic planning? (1)
…………………………………………………………………………………………
…………………………………………………………………………………………
2. What do you understand the term „structural composition of the economy‟?
(1)
…………………………………………………………………………………………
…………………………………………………………………………………………
3. How are the central problems solved in a socialist economy? (1)
…………………………………………………………………………………………
…………………………………………………………………………………………
4. What is cooperative farming? (1)
…………………………………………………………………………………………
…………………………………………………………………………………………
5. Explain the importance of social justice as an objective of planning in India.(3)
…………………………………………………………………………………………
…………………………………………………………………………………………
…………………………………………………………………………………………
…………………………………………………………………………………………
…………………………………………………………………………………………
…………………………………………………………………………………………
…………………………………………………………………………………………
…………………………………………………………………………………………
…………………………………………………………………………………………
…………………………………………………………………………………………
…………………………………………………………………………………………
…………………………………………………………………………………………
…………………………………………………………………………………………
…………………………………………………………………………………………
…………………………………………………………………………………………
ECONOMICS DEPARTMENT SANSKRITI SCHOOL
Max Marks: 15

Class XI / Economics / 38
Smart Skills Sanskriti School
6. Explain the importance of small scale industries for underdeveloped
countries like India. How were these promoted? (4)
…………………………………………………………………………………………
…………………………………………………………………………………………
…………………………………………………………………………………………
…………………………………………………………………………………………
…………………………………………………………………………………………
…………………………………………………………………………………………
…………………………………………………………………………………………
…………………………………………………………………………………………
…………………………………………………………………………………………
…………………………………………………………………………………………
…………………………………………………………………………………………
…………………………………………………………………………………………
…………………………………………………………………………………………
…………………………………………………………………………………………
…………………………………………………………………………………………
…………………………………………………………………………………………
…………………………………………………………………………………………
…………………………………………………………………………………………
7. State two land reforms undertaken post-independence. Were these reforms
successful? Why? (4)
…………………………………………………………………………………………
…………………………………………………………………………………………
…………………………………………………………………………………………
…………………………………………………………………………………………
…………………………………………………………………………………………
…………………………………………………………………………………………
…………………………………………………………………………………………
…………………………………………………………………………………………
…………………………………………………………………………………………
…………………………………………………………………………………………
…………………………………………………………………………………………
…………………………………………………………………………………………
…………………………………………………………………………………………
…………………………………………………………………………………………
…………………………………………………………………………………………
…………………………………………………………………………………………
…………………………………………………………………………………………

Class XI / Economics / 39
Smart Skills Sanskriti School
ASSIGNMENT: 3
Economic Reforms since 1990
1
.
Define privatisation.
……………………………………………………………………………………………….
……………………………………………………………………………………………….
(1)
2. Discuss the fiscal policy reforms undertaken by the government in 1991.
……………………………………………………………………………………………….
……………………………………………………………………………………………….
……………………………………………………………………………………………….
……………………………………………………………………………………………….
……………………………………………………………………………………………….
……………………………………………………………………………………………….
……………………………………………………………………………………………….
……………………………………………………………………………………………….
(3)
3. The table given below shows the GDP growth rate at 1993-94 prices. Draw a time
series graph based on the data and interpret the same.
Year GDP growth rate (%)
1991-92 1.3
1992-93 5.1
1993-94 5.9
1994-95 7.3
1996-97 7.8
1997-98 4.8
1998-99 6.5
2000-01 4.4
2001-02 5.8
2002-03 4.0
(3)
ECONOMICS DEPARTMENT SANSKRITI SCHOOL
Max Marks: 15

Class XI / Economics / 40
Smart Skills Sanskriti School
……………………………………………………………………………………………….
……………………………………………………………………………………………….
……………………………………………………………………………………………….
……………………………………………………………………………………………….
……………………………………………………………………………………………….
……………………………………………………………………………………………….
……………………………………………………………………………………………….
……………………………………………………………………………………………….
4. Differentiate between direct taxes and indirect taxes with the help of examples.
……………………………………………………………………………………………….
……………………………………………………………………………………………….
……………………………………………………………………………………………….
……………………………………………………………………………………………….
……………………………………………………………………………………………….
……………………………………………………………………………………………….
……………………………………………………………………………………………….
……………………………………………………………………………………………….
……………………………………………………………………………………………….
……………………………………………………………………………………………….
……………………………………………………………………………………………….
……………………………………………………………………………………………….
(4)
5. Inspite of the New Economic Policy, reforms have not been able to benefit the
agricultural sector. Give reasons.
,……………………………………………………………………………………………….
……………………………………………………………………………………………….
……………………………………………………………………………………………….
……………………………………………………………………………………………….
……………………………………………………………………………………………….
(4)

Class XI / Economics / 41
Smart Skills Sanskriti School
ASSIGNMENT: 4
Poverty
1. Name two indices used to estimate poverty. (1)
…………………………………………………………………………………………
…………………………………………………………………………………………
2. How does the government encourage self-employment? (1)
…………………………………………………………………………………………
…………………………………………………………………………………………
3. Why are tribals considered part of the rural poor in India? (1)
…………………………………………………………………………………………
…………………………………………………………………………………………
…………………………………………………………………………………………
4. Study the table below and answer the questions
Year Poverty rate (%)
1977-78 51.3
1983 45.65
1987 38.5
1993-94 35.1
1999-2000 26.1
2004-05 22.15
a. In spite of decline in poverty rate over the years the number of poor in
India has risen. Why? (1)
……………………………………………………………………………………
………………………………………………………………………...................
ECONOMICS DEPARTMENT SANSKRITI SCHOOL
Max Marks: 15

Class XI / Economics / 42
Smart Skills Sanskriti School
b. Which period shows the largest decline in poverty levels? How much was
the decline? (2)
……………………………………………………………………………………
……………………………………………………………………………………
……………………………………………………………………………………
……………………………………………………………………………………
c. Why did the decline take place in the period mentioned above? (2)
……………………………………………………………………………………
……………………………………………………………………………………
……………………………………………………………………………………
……………………………………………………………………………………
5. How do scholars identify the poor on the basis of occupation and ownership
of assets in rural areas? Briefly explain each category. (3)
…………………………………………………………………………………………
…………………………………………………………………………………………
…………………………………………………………………………………………
…………………………………………………………………………………………
…………………………………………………………………………………………
…………………………………………………………………………………………
…………………………………………………………………………………………
…………………………………………………………………………………………
…………………………………………………………………………………………
…………………………………………………………………………………………
…………………………………………………………………………………………
…………………………………………………………………………………………
…………………………………………………………………………………………
…………………………………………………………………………………………
6. Write a short note on poverty alleviation schemes that aim at improving food and nutritional status among the poor. (Use additional sheet). (4)
…………………………………………………………………………………………
…………………………………………………………………………………………
…………………………………………………………………………………………
…………………………………………………………………………………………
…………………………………………………………………………………………

Class XI / Economics / 43
Smart Skills Sanskriti School
ASSIGNMENT: 5
Human capital Formation
1. What is Human Capital?
…………………………………………………………………………………………
…………………………………………………………………………………………
…………………………………………………………………………………………
(1)
2. What are the different sources of human capital?
……………………………………………………………………………………………….
……………………………………………………………………………………………….
……………………………………………………………………………………………….
(1)
3. Mention 2 core areas for expenditure on health in India.
……………………………………………………………………………………………….
……………………………………………………………………………………………….
……………………………………………………………………………………………….
(1)
4. What do you understand by primary dropout rate?
……………………………………………………………………………………………….
……………………………………………………………………………………………….
……………………………………………………………………………………………….
(1)
5. Explain with example how a well-developed information system facilitates
human capital formation.
……………………………………………………………………………………………….
……………………………………………………………………………………………….
……………………………………………………………………………………………….
……………………………………………………………………………………………….
……………………………………………………………………………………………….
……………………………………………………………………………………………….
……………………………………………………………………………………………….
……………………………………………………………………………………………….
(3)
ECONOMICS DEPARTMENT SANSKRITI SCHOOL
Max Marks: 15

Class XI / Economics / 44
Smart Skills Sanskriti School
6. How is migration a source of human capital?
……………………………………………………………………………………………….
……………………………………………………………………………………………….
……………………………………………………………………………………………….
……………………………………………………………………………………………….
……………………………………………………………………………………………….
……………………………………………………………………………………………….
……………………………………………………………………………………………….
……………………………………………………………………………………………….
(4)
7. The Government has passed “the right to education" bill. What does this mean for
the economy?
……………………………………………………………………………………………….
……………………………………………………………………………………………….
……………………………………………………………………………………………….
……………………………………………………………………………………………….
……………………………………………………………………………………………….
……………………………………………………………………………………………….
……………………………………………………………………………………………….
……………………………………………………………………………………………….
……………………………………………………………………………………………….
……………………………………………………………………………………………….
……………………………………………………………………………………………….
……………………………………………………………………………………………….
……………………………………………………………………………………………….
……………………………………………………………………………………………….
……………………………………………………………………………………………….
……………………………………………………………………………………………….
(4)
Class XI / Economics / 45
Smart Skills Sanskriti School
ASSIGNMENT: 6
Rural Development
1. What is “Golden Revolution”?
…………………………………………………………………………………………
…………………………………………………………………………………………
(1)
2. “Information Technology can play a critical role in bringing about rural
development”. Explain.
(3)
……………………………………………………………………………………………….
……………………………………………………………………………………………….
……………………………………………………………………………………………….
……………………………………………………………………………………………….
……………………………………………………………………………………………….
……………………………………………………………………………………………….
……………………………………………………………………………………………….
……………………………………………………………………………………………….
……………………………………………………………………………………………….
……………………………………………………………………………………………….
……………………………………………………………………………………………….
3. Explain how diversification helps to bring about rural development.
……………………………………………………………………………………………….
……………………………………………………………………………………………….
……………………………………………………………………………………………….
……………………………………………………………………………………………….
……………………………………………………………………………………………….
……………………………………………………………………………………………….
……………………………………………………………………………………………….
……………………………………………………………………………………………….
(3)
ECONOMICS DEPARTMENT SANSKRITI SCHOOL
Max Marks: 15
Class XI / Economics / 46
Smart Skills Sanskriti School
4. Why is state intervention required to regulate market activities in rural areas? What are the measures initiated by the government to improve agricultural marketing?
……………………………………………………………………………………………….
……………………………………………………………………………………………….
……………………………………………………………………………………………….
……………………………………………………………………………………………….
……………………………………………………………………………………………….
……………………………………………………………………………………………….
……………………………………………………………………………………………….
……………………………………………………………………………………………….
……………………………………………………………………………………………….
……………………………………………………………………………………………….
……………………………………………………………………………………………….
……………………………………………………………………………………………….
(4)
5. Analyse the role of Khadi and Village Industries Commission in promoting rural development in India. You may use may use the internet or any other source of information.
……………………………………………………………………………………………….
……………………………………………………………………………………………….
……………………………………………………………………………………………….
……………………………………………………………………………………………….
……………………………………………………………………………………………….
……………………………………………………………………………………………….
……………………………………………………………………………………………….
……………………………………………………………………………………………….
……………………………………………………………………………………………….
(4)

Class XI / Economics / 47
Smart Skills Sanskriti School
ASSIGNMENT: 7
Employment - Growth, Informalisation and other issues
1. What is jobless growth? When did India experience jobless growth?
……………………………………………………………………………………………….
……………………………………………………………………………………………….
……………………………………………………………………………………………….
……………………………………………………………………………………………….
(2)
2. Categorise the following into formal and informal sector.
a. Domestic help
b. Bus Driver in Sanskriti School
c. Shopkeeper selling export surplus clothing in Janpath.
d. Ticket checker in Indian Railways
(2)
3. Despite economic growth, India is still plagued with high levels of unemployment.
Why?
……………………………………………………………………………………………….
……………………………………………………………………………………………….
……………………………………………………………………………………………….
……………………………………………………………………………………………….
……………………………………………………………………………………………….
……………………………………………………………………………………………….
(4)
4. Give reasons to explain the urban-rural disparity and male-female disparity in
employment in our country.
……………………………………………………………………………………………….
……………………………………………………………………………………………….
……………………………………………………………………………………………….
……………………………………………………………………………………………….
……………………………………………………………………………………………….
……………………………………………………………………………………………….
(4)
ECONOMICS DEPARTMENT SANSKRITI SCHOOL
Max Marks: 15

Class XI / Economics / 48
Smart Skills Sanskriti School
5. Read the following passage and answer the following questions
a. What led to the closures of textile mills in 1980s?
………………………………………………………………………………………
……………………………………………………………………………………………….
b. What kind of unemployment did this lead to?
……………………………………………………………………………………………….
c. What is „recession‟?
…………………………………………………………………………………………….
……………………………………………………………………………………………….
d. What do you understand by the term „informal sector‟?
……………………………………………………………………………………………….
……………………………………………………………………………………………….
(4)
Class XI / Economics / 49
Smart Skills Sanskriti School
ASSIGNMENT: 8
Infrastructure
1. How is communication both an economic and social infrastructure?
………………………………………………………………………………………………
……………………………………………………………………………………………….
……………………………………………………………………………………………….
(1)
2. Why is the share of power and telecommunication infrastructure greater in high
income countries?
……………………………………………………………………………………………….
……………………………………………………………………………………………….
……………………………………………………………………………………………….
(1)
3. What kind of economic and social infrastructure is required by the Sanskriti School
canteen in order to operate efficiently?
……………………………………………………………………………………………….
……………………………………………………………………………………………….
……………………………………………………………………………………………….
……………………………………………………………………………………………….
……………………………………………………………………………………………….
……………………………………………………………………………………………….
……………………………………………………………………………………………….
……………………………………………………………………………………………….
……………………………………………………………………………………………….
……………………………………………………………………………………………….
……………………………………………………………………………………………….
……………………………………………………………………………………………….
……………………………………………………………………………………………….
……………………………………………………………………………………………….
(3)
ECONOMICS DEPARTMENT SANSKRITI SCHOOL
Max Marks: 15

Class XI / Economics / 50
Smart Skills Sanskriti School
4. Some scholars suggest that India needs to generate more electricity through atomic
source. Do you agree?
…………………………………………………………………………………………….
……………………………………………………………………………………………….
……………………………………………………………………………………………….
……………………………………………………………………………………………….
……………………………………………………………………………………………….
……………………………………………………………………………………………….
……………………………………………………………………………………………….
……………………………………………………………………………………………….
……………………………………………………………………………………………….
……………………………………………………………………………………………….
……………………………………………………………………………………………….
……………………………………………………………………………………………….
……………………………………………………………………………………………….
……………………………………………………………………………………………….
(4)
5. Write a short note on „Jan DhanYojana‟ and „Swach Bharat Abhiyan‟.
(Use internet for information)
……………………………………………………………………………………………….
……………………………………………………………………………………………….
……………………………………………………………………………………………….
……………………………………………………………………………………………….
……………………………………………………………………………………………….
……………………………………………………………………………………………….
……………………………………………………………………………………………….
……………………………………………………...……………………………………….
(6)

Class XI / Economics / 51
Smart Skills Sanskriti School
ASSIGNMENT: 9
Environment and Sustainable Development
1. What is environment?
……………………………………………………………………………………………….
……………………………………………………………………………………………….
……………………………………………………………………………………………….
(1)
2. Name 2 native Indian plants that have medicinal value and needs to be
encouraged.
……………………………………………………………………………………………….
……………………………………………………………………………………………….
……………………………………………………………………………………………….
(1)
3. What is the function of CPCB?
……………………………………………………………………………………………….
……………………………………………………………………………………………….
……………………………………………………………………………………………….
(1)
4. What is „clean technology‟?
……………………………………………………………………………………………….
……………………………………………………………………………………………….
……………………………………………………………………………………………….
(1)
5. Why should mini hydel plants be encouraged as compared to big dams?
……………………………………………………………………………………………….
……………………………………………………………………………………………….
……………………………………………………………………………………………….
……………………………………………………………………………………………….
……………………………………………………………………………………………….
……………………………………………………………………………………………….
……………………………………………………………………………………………….
……………………………………………………………………………………………….
(3)
ECONOMICS DEPARTMENT SANSKRITI SCHOOL
Max Marks: 15

Class XI / Economics / 52
Smart Skills Sanskriti School
6. What are the four basic functions of the environment?
……………………………………………………………………………………………….
……………………………………………………………………………………………….
……………………………………………………………………………………………….
……………………………………………………………………………………………….
……………………………………………………………………………………………….
……………………………………………………………………………………………….
……………………………………………………………………………………………….
……………………………………………………………………………………………….
……………………………………………………………………………………………….
……………………………………………………………………………………………….
……………………………………………………………………………………………….
……………………………………………………………………………………………….
(4)
7. Explain the carrying capacity and the absorptive capacity of the environment.
What happens when the absorptive capacity is (a) less than the pollution levels
(b) more than the pollution levels.
……………………………………………………………………………………………….
……………………………………………………………………………………………….
……………………………………………………………………………………………….
……………………………………………………………………………………………….
……………………………………………………………………………………………….
……………………………………………………………………………………………….
……………………………………………………………………………………………….
……………………………………………………………………………………………….
……………………………………………………………………………………………….
……………………………………………………………………………………………….
……………………………………………………………………………………………….
……………………………………………………………………………………………….
……………………………………………………………………………………………….
……………………………………………………………………………………………….
(4)

Class XI / Economics / 53
Smart Skills Sanskriti School
ASSIGNMENT: 10
Collection and Organisation of data
1. A research organization collects data on driving habits of urban Indians
which is used by the traffic police. What kind of data is it for the
organization and the police?
……………………………………………………………………………………
……………………………………………………………………………………
(1)
2. We have the following information on the monthly expenditure on food
( in rupees) for 30 households in a locality
115
256
184
144
220
159
271
234
135
238
196
310
245
172
278
205
129
241
173
243
212
335
265
229
220
223
169
298
243
238
a) Obtain a frequency distribution using the following class intervals
100-150, 150-200, 200-250, 250-300, 300-350
b) What percentage of households spends less than Rs 250 per
month and what percentage of households spends more than Rs
200 per month?
…………………………………………………………………………... ………
……………………………………………………………………………………
……………………………………………………………………………………
……………………………………………………………………………………
(3)
ECONOMICS DEPARTMENT SANSKRITI SCHOOL
Max Marks: 15

Class XI / Economics / 54
Smart Skills Sanskriti School
3. Convert the following inclusive series into an exclusive series
……………………………………………………………………………………
……………………………………………………………………………………
……………………………………………………………………………………
Marks 10 – 14 15-19 20 – 24 25 – 29 30 – 34
No. of students 4 5 8 5 4
Marks
No. of students
(3)
4. In a survey it was found that 50 families bought milk in the following
quantities in a particular month. Classify the following data in a discrete
series, continuous series and „less than‟ and „more than‟ cumulative
frequency series.
19
11
20
10
25
11
8
16
16
23
25
7
16
23
22
11
5
22
11
22
12
10
22
19
5
21
10
22
16
10
21
11
16
11
19
17
20
23
22
7
20
12
17
19
17
25
23
12
17
21
(Attach an additional sheet of paper)
(8)
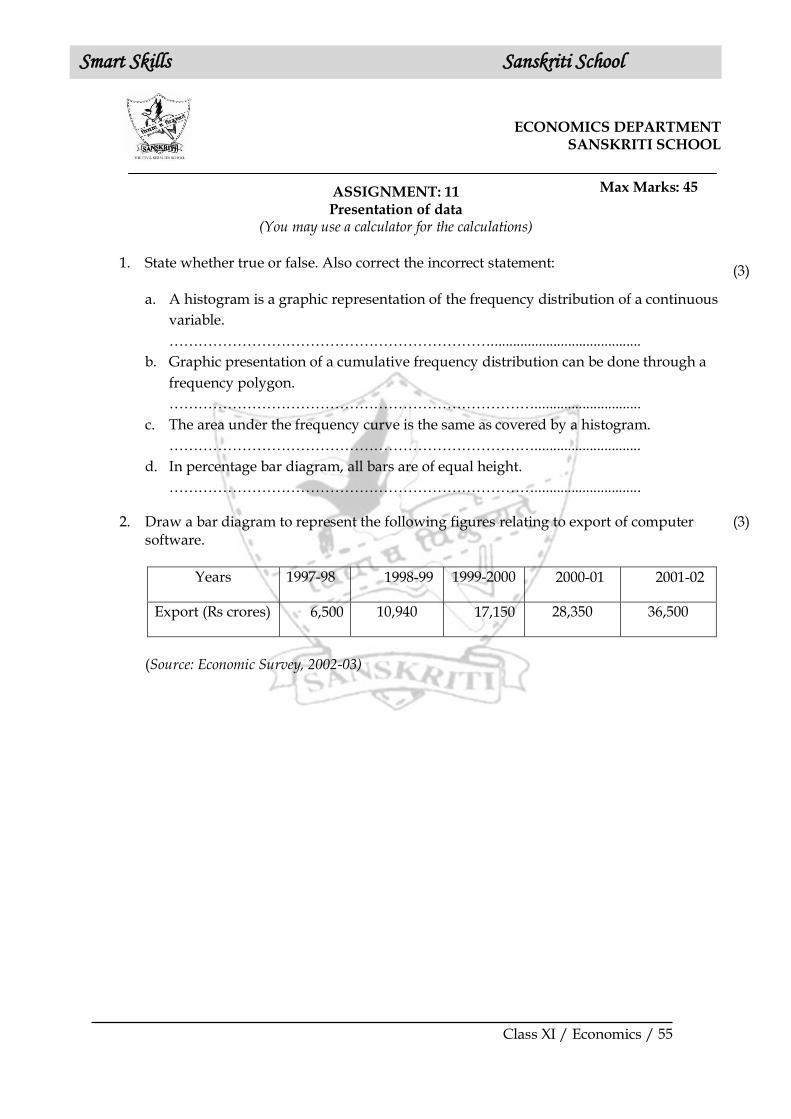
Class XI / Economics / 55
Smart Skills Sanskriti School
ASSIGNMENT: 11 Presentation of data
(You may use a calculator for the calculations)
1. State whether true or false. Also correct the incorrect statement: a. A histogram is a graphic representation of the frequency distribution of a continuous
variable.
………………………………………………………….........................................
b. Graphic presentation of a cumulative frequency distribution can be done through a
frequency polygon.
………………………………………………………………….............................
c. The area under the frequency curve is the same as covered by a histogram.
………………………………………………………………….............................
d. In percentage bar diagram, all bars are of equal height.
………………………………………………………………….............................
(3)
2. Draw a bar diagram to represent the following figures relating to export of computer software.
Years 1997-98 1998-99 1999-2000 2000-01 2001-02
Export (Rs crores) 6,500 10,940 17,150 28,350 36,500
(Source: Economic Survey, 2002-03)
(3)
ECONOMICS DEPARTMENT SANSKRITI SCHOOL
Max Marks: 45

Class XI / Economics / 56
Smart Skills Sanskriti School
3. Draw a suitable diagram to represent the following information. (4)
Statement of crimes in running passenger trains
Year Murder Robbery Loot Total
1998 108 82 321 511
1999 131 115 386 632
2000 97 144 352 593
2001 102 70 285 457
2002 75 68 245 388
4. Represent the following data in a pie diagram. (4)
Items of Expenditure Family A % Degrees
Food 400
Clothing 250
Rent 150
Education 40
Miscellaneous 160
Total 800 100 3600

Class XI / Economics / 57
Smart Skills Sanskriti School
5. Draw a „less than‟ ogive for the following data: (4)
Marks 0-10 10-20 20-30 30-40 40-50 50-60 60-70
No. of students 4 4 7 10 12 8 5

Class XI / Economics / 58
Smart Skills Sanskriti School
5. Construct a histogram from the following distribution of total marks obtained by 65 students of a school in a Board Examination. (4)
Mid points No. of students
150 8
160 10
170 25
180 12
190 7
200 3
6. Categorise the following classification as qualitative, quantitative, geographical and chronological. Give reasons. (5)
a. Sales of a firm (2006-08) b. No. of firms producing bicycles
………………………………….. ……………………………………….
Year 2006 2007 2008
Sales
(Rs)
80 90 95
Place Punjab Haryana UP
No. of firms 30 20 25

Class XI / Economics / 59
Smart Skills Sanskriti School
c. Annual profit of SSIs d. Literacy rate in Bihar
……………………………………… ……………………………………....
e. Yearly sales of a teashop
…………………………………………….
7. Of the 1,125 students studying in a school during 2003-2004, 720 were
Hindus, 628 were boys and 440 were science students. The number of Hindu
boys was 392 and the number of Hindu boys studying science was 205 while
the number of boys studying science was 262. The number of science students
among the non-Hindus was 148. Compile this information in a table,
obtaining relevant information wherever not given. The information was
provided in ABC research paper. (6)
Annual
profit
0-10 10-20 20-30
No. of
firms
5 150 1500
Sex Rural Urban Total
Male 57.70 80.80 60.32
Female 30.03 63.30 33.57
Year 1995 1996 1997 1998 1999
Sales (Rs) 79.2 81.3 82.4 80.5 100.2

Class XI / Economics / 60
Smart Skills Sanskriti School
8. Present the following figures for export in tea on a graph. (6)
What can you infer about the export of the two varieties of tea?
a. ………………………………………………………………………...................……………
…………………………………………………………………………………….......................
b. ……………………………………………………………………………………..................
…………………………………………………………………………………….....................
c. ……………………………………………………………………………………..................
…………………………………………………………………………………….......................
9. Represent the following data with the help of a histogram. What kind of curve
does the data reflect? (6)
(Please attach a graph to answer this question)
Year 1997 1998 1999 2000 2001 2002
Assam Tea 250 492 584 800 850 860
Darjeeling Tea 300 596 782 900 762 640
Daily Wages (Rs) 10-15 15-20 20-25 25-30 30-40 40-60 60-80
No. of workers 7 19 28 15 12 12 8

Class XI / Economics / 61
Smart Skills Sanskriti School
ASSIGNMENT 12
Measures of Central Tendency-Arithmetic Mean, Median and Mode Max Marks: 50
(You may use a calculator)
Test
Test scores for a class of 20 students are as follows: (1)
1.
Frequency
Scores 93, 84, 97, 98, 100, 78, 86, 100, 85, 92, 72, 55, 91, 90, 75,
91-100
94, 83, 60, 81, 95
a) Complete the table shown at the left. 81-90
71-80
b) Find the modal interval.
61-70
51-60
………………………………………………………………………………………………..
2. The following table gives the daily income of ten workers in a factory.
Find the arithmetic mean. (2)
Workers A B C D E F G H I J
Daily Income (in Rs) 120 150 180 200 250 300 220 350 370 260
………………………………………………………………………………………………………
………………………………………………………………………………………………………
……………………………………………………………………………………………………….
4. Calculate median and upper quartile for the following data showing monthly wages
of 10 workers: (3)
120, 150, 170, 180, 181, 187, 190, 192, 200, 210
Median Upper quartile
ECONOMICS DEPARTMENT SANSKRITI SCHOOL

Class XI / Economics / 62
Smart Skills Sanskriti School
4. Comment whether the following statements are true or false. Correct the incorrect
statement. (4)
(i)The sum of deviation of items from mean is 1.
………………………………………………………………………………………………
(ii)In order to find the Median, one needs to first order the data values from the least
to the highest.
………………………………………………………………………………………………
(iii)Arithmetic mean is a positional average.
………………………………………………………………………………………………
(iv)Arithmetic mean is based on all observations.
………………………………………………………………………………………………
(v)Arithmetic mean can be located graphically with the help of ogives.
………………………………………………………………………………………………..
5. Calculate the fourth decile from the following data: (4)
Wages (in Rs) 50-60 60-70 70-80 80-90 90-100 100-110 110-120
No. of workers 8 10 16 14 10 5 2
6. The arithmetic mean of the data given below is 28, find the missing frequency using direct method. (5)
Profit 0-10 10-20 20-30 30-40 40-50 50-60
No. of shops 12 18 27 - 17 6

Class XI / Economics / 63
Smart Skills Sanskriti School
7. Indicate mode on a graph for the following distribution: (5)
Sales
53-56
56-59
59-62
62-65
65-68
68-71
(Rs thousand)
Number of days
5
7
9
25
20
18
8. Following table gives the distribution of companies according to the size of capital.
Using step deviation method, find out the mean size of the capital of a company. (6)
Capital
(in lacs)
Less
than 5
Less
than 10
Less
than 15
Less
than 20
Less
than 25
Less
than 30
No. of
companies 20
27
29
38
48
53
…………………………………………………………………………………………………
…………………………………………………………………………………………………
…………………………………………………………………………………………………
…………………………………………………………………………………………………
…………………………………………………………………………………………………
…………………………………………………………………………………………………
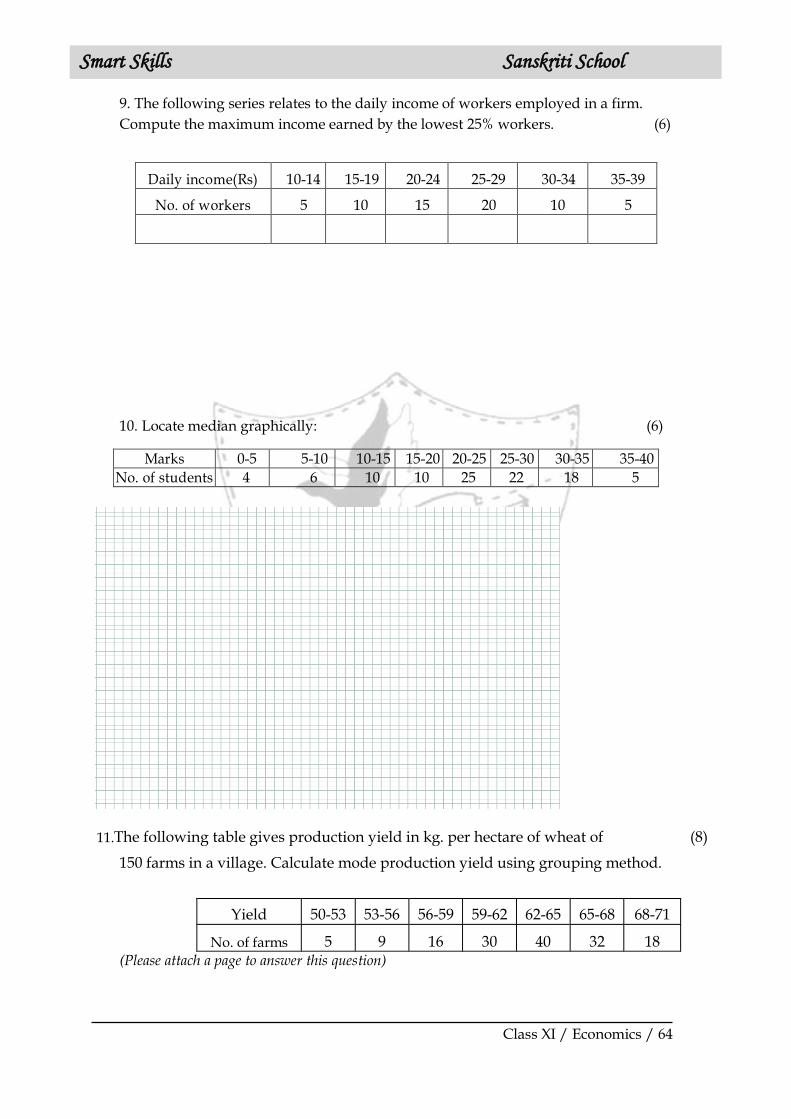
Class XI / Economics / 64
Smart Skills Sanskriti School
9. The following series relates to the daily income of workers employed in a firm.
Compute the maximum income earned by the lowest 25% workers. (6)
10. Locate median graphically: (6)
Marks 0-5 5-10 10-15 15-20 20-25 25-30 30-35 35-40
No. of students 4 6 10 10 25 22 18 5
11. The following table gives production yield in kg. per hectare of wheat of (8)
150 farms in a village. Calculate mode production yield using grouping method.
Yield 50-53 53-56 56-59 59-62 62-65 65-68 68-71
No. of farms 5 9 16 30 40 32 18 (Please attach a page to answer this question)
Daily income(Rs) 10-14 15-19 20-24 25-29 30-34 35-39
No. of workers 5 10 15 20 10 5

Class XI / Economics / 65
Smart Skills Sanskriti School
ASSIGNMENT: 13
Measures of Dispersion
1. In a town, 25% of the persons earned more than Rs45, 000 whereas 75% earned
more than Rs18000. Calculate the absolute and relative values of dispersion. (3)
………………………………………………………………………………………………
………………………………………………………………………………………………
………………………………………………………………………………………………
………………………………………………………………………………………………
………………………………………………………………………………………………
………………………………………………………………………………………………
………………………………………………………………………………………………
……………………………………………………………………………………………
2. For two firms A and B belonging to the same industry, the following data is given: (5)
Firm A Firm B
No. of wage earners 586 648
Average monthly wages (Rs) 52.5 47.5
Standard deviation 10 11
a) Which firm A or B pays larger amount as monthly wages? b) Which firm shows greater variability in the wage rate?
………………………………………………………………………………………………
………………………………………………………………………………………………
………………………………………………………………………………………………
………………………………………………………………………………………………
ECONOMICS DEPARTMENT SANSKRITI SCHOOL
Max Marks: 30

Class XI / Economics / 66
Smart Skills Sanskriti School
………………………………………………………………………………………………
………………………………………………………………………………………………
………………………………………………………………………………………………
………………………………………………………………………………………………
3. From the following data calculate variance: (7)
Marks Number of
Students (f)
Mid values
(X)
d d‟ f .d‟ f.d‟2
0 – 20 2
20 – 40 4
40 – 60 6
60 – 80 1
80 - 100 7
∑ f = ∑ f .d‟ =
………………………………………………………………………………………………
………………………………………………………………………………………………
………………………………………………………………………………………………
………………………………………………………………………………………………
………………………………………………………………………………………………
………………………………………………………………………………………………
……………………………………………………………………………………..............

Class XI / Economics / 67
Smart Skills Sanskriti School
4. Draw Lorenz curves for rural and urban households and compare the degree of
inequality in the two districts: (8)
Income(Rs)
Number of
households
Urban Rural
0 – 1000 100 500
1000 – 5000 500 800
5000 – 10000 700 500
10000 - 20000 500 150
20000 - 40000 200 50
………………………………………………………………………………………………
………………………………………………………………………………………………
…………………………………………………………………………………..............…
……………………………………………………………………………………………

Class XI / Economics / 68
Smart Skills Sanskriti School
5. Find the coefficient of mean deviation from mean from the following data. (7)
CI 0 -10 10 -20 20 -30 30 – 40 40 -50
Frequency 2 4 6 4 2

Class XI / Economics / 69
Smart Skills Sanskriti School
ASSIGNMENT: 14
Measures of Correlation (You may use a calculator)
1. What does the value of r = 0 imply? (1)
………………………………………………………………………………………………
………………………………………………………………………………………………
2. Can coefficient of correlation be 1.98? Why? (1)
………………………………………………………………………………………………
………………………………………………………………………………………………
3. Draw a scatter diagram and indicate the nature of correlation. (3)
X 10 20 30 40 50 60 70 80
Y 5 10 15 20 25 30 35 40
.....................................................
......................................................
......................................................
.....................................................
......................................................
......................................................
.....................................................
......................................................
......................................................
ECONOMICS DEPARTMENT SANSKRITI SCHOOL
Max Marks: 35

Class XI / Economics / 70
Smart Skills Sanskriti School
4. Seven methods of teaching Economics in two universities were ranked by
students of two universities. Calculate Rank difference correlation. What kind
of correlation does it indicate? (6)
Teaching
methods
Rank of A‟s
students
Rank of B‟s
students
D = D2
I 2 1
II 1 3
III 5 2
IV 3 4
V 4 7
VI 7 5
VII 6 6
∑ D2 =
…………………………………………………………………………………………………
…………………………………………………………………………………………………
…………………………………………………………………………………………………
…………………………………………………………………………………………………
5. Calculate Karl Pearson‟s coefficient of correlation between the index of industrial
production and the number of unemployed in an economy. How does industrial
production affect the level of unemployment? The assumed mean for IIP is 105
and 120 for number unemployed. (9)
IIP Unemployed dx dy dx2 dy2 dxdy
100 120
102 134
104 150
107 115
105 110
112 140
103 142
99 100

Class XI / Economics / 71
Smart Skills Sanskriti School
…………………………………………………………………………………………………
…………………………………………………………………………………………………
…………………………………………………………………………………………………
…………………………………………………………………………………………………
…………………………………………………………………………………………………
…………………………………………………………………………………………………
…………………………………………………………………………………………………
…………………………………………………………………………………………………
…………………………………………………………………………………………………
………………………………………………………………………………………………....
6. Calculate coefficient of rank correlation between the marks of Indian Economics
and Statistics, as indicated by 8 answer books of each of the two examiners. (6)
Marks in
Indian Eco
Marks in
Statistics
R1 R2 D = D2
15 16
10 14
20 10
28 12
12 11
10 15
16 18
18 12
∑ D2 =
…………………………………………………………………………………………………
…………………………………………………………………………………………………
…………………………………………………………………………………………………
…………………………………………………………………………………………………
…………………………………………………………………………………………………
…………………………………………………………………………………………………
…………………………………………………………………………………………………
…………………………………………………………………………………………………

Class XI / Economics / 72
Smart Skills Sanskriti School
7. Calculate Karl Pearson‟s coefficient of correlation between X and Y and comment
on their relationship. (9)
X Y dx = dy = dx2 dy2 dxdy
1 2
3 6
4 8
5 10
7 14
8 16
∑ dx = ∑ dy = ∑ dx2 = ∑ dy2 = ∑ dxdy =
…………………………………………………………………………………………………
…………………………………………………………………………………………………
…………………………………………………………………………………………………
…………………………………………………………………………………………………
…………………………………………………………………………………………………
…………………………………………………………………………………………………
…………………………………………………………………………………………………
…………………………………………………………………………………………………
…………………………………………………………………………………………………
…………………………………………………………………………………………………

Class XI / Economics / 73
Smart Skills Sanskriti School
ASSIGNMENT: 17
Index Numbers (You may use a calculator)
1. During a certain period, the cost of living index number goes up from 110 to
200 and the salary of the worker is also raised from Rs 325 to Rs 500. Does
the worker really gain? Why?
……………………………………………………………………………………
……………………………………………………………………………………
……………………………………………………………………………………
……………………………………………………………………………………
(2)
2. Using the simple aggregate method, calculate the price index number for
2002 with base as 1995 from the following data:
Commodities Price in 1995 Price in 2002
A
B
C
D
E
100
80
160
220
40
140
120
180
240
40
……………………………………………………………………………………
……………………………………………………………………………………
……………………………………………………………………………………
……………………………………………………………………………………
(3)
3. Construct index number by simple average of price relatives method for 2007 taking the price of 2006 as base from the data given below:
Commodity A B C D E
Prices in 2006 30 40 60 80 10
Prices in 2007 45 50 72 88 13
Price relative
……………………………………………………………………………………
……………………………………………………………………………………
(3)
ECONOMICS DEPARTMENT SANSKRITI SCHOOL
Max Marks: 15
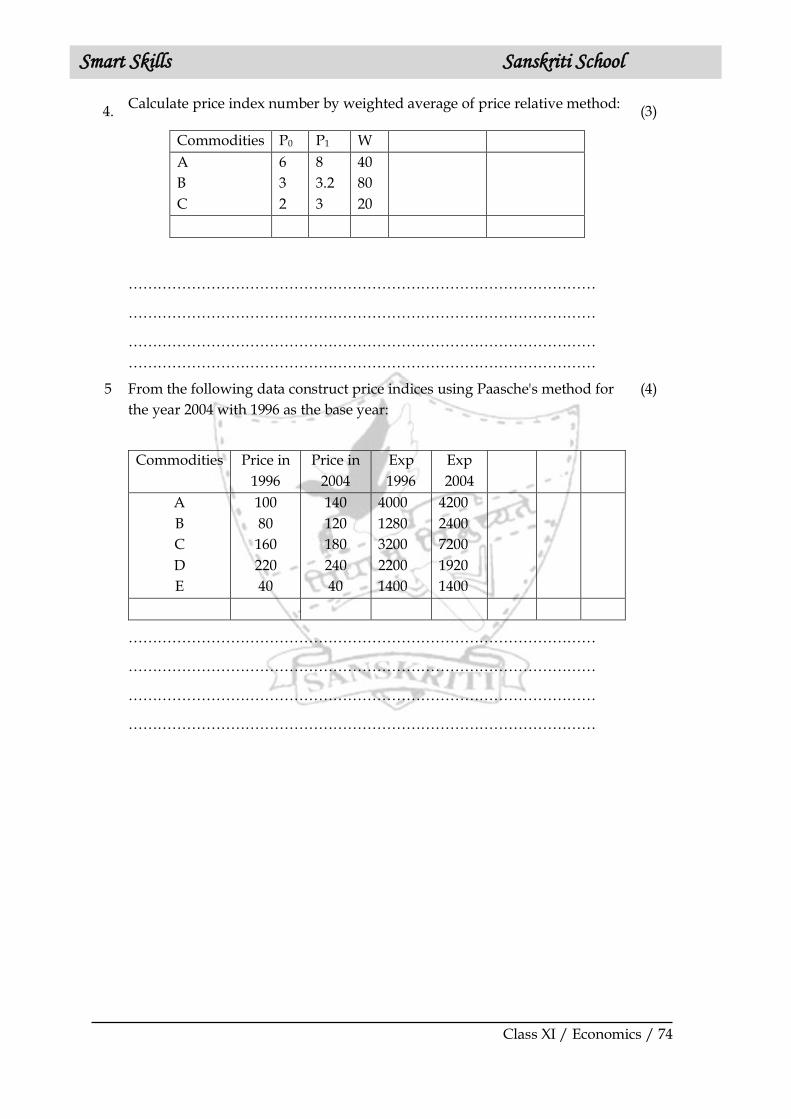
Class XI / Economics / 74
Smart Skills Sanskriti School
4. Calculate price index number by weighted average of price relative method:
Commodities P0 P1 W
A
B
C
6
3
2
8
3.2
3
40
80
20
……………………………………………………………………………………
……………………………………………………………………………………
……………………………………………………………………………………
……………………………………………………………………………………
(3)
5 From the following data construct price indices using Paasche's method for
the year 2004 with 1996 as the base year:
Commodities Price in
1996
Price in
2004
Exp
1996
Exp
2004
A
B
C
D
E
100
80
160
220
40
140
120
180
240
40
4000
1280
3200
2200
1400
4200
2400
7200
1920
1400
……………………………………………………………………………………
……………………………………………………………………………………
……………………………………………………………………………………
……………………………………………………………………………………
(4)