
Smart Models for Smart Cities - Modeling of Dynamics, Sensors, Urban Indicators, and Planning...
50
Technische Universität München Lehrstuhl für Geoinformatik Smart Models for Smart Cities – Modeling of Dynamics, Sensors, Urban Indicators, and Planning Actions Thomas H. Kolbe Chair of Geoinformatics Technische Universität München [email protected] 29th of October 2015 Joint International Geoinformation Conference JIGC 2015, Kuala Lumpur
-
Upload
technische-universitaet-muenchen -
Category
Science
-
view
1.057 -
download
0
Transcript of Smart Models for Smart Cities - Modeling of Dynamics, Sensors, Urban Indicators, and Planning...

Technische Universität München Lehrstuhl für Geoinformatik
Smart Models for Smart Cities –
Modeling of Dynamics, Sensors,
Urban Indicators, and Planning Actions
Thomas H. Kolbe Chair of Geoinformatics Technische Universität München
[email protected] 29th of October 2015 Joint International Geoinformation Conference JIGC 2015, Kuala Lumpur

Technische Universität München Lehrstuhl für Geoinformatik
2 29.10.2015
Model Entities
(Resources, Objects)
Actors (Agents, Stakeholders,
Citizens)
Processes (Activities,
Actions, Flows)
City System Modeling
T. H. Kolbe – Smart Models for Smart Cities
represented by
City System

Technische Universität München Lehrstuhl für Geoinformatik
3 29.10.2015
Today: Separate Modeling by Sectors
T. H. Kolbe – Smart Models for Smart Cities
Energ
y
• Commu-nity
• Models
• Indicators
• Evalua -tion
• Planning
Mo
bili
ty
• Commu-nity
• Models
• Indicators
• Evalua -tion
• Planning E
co
log
y
• Commu-nity
• Models
• Indicators
• Evalua -tion
• Planning
Eco
no
my
• Commu-nity
• Models
• Indicators
• Evalua -tion
• Planning
City System
Technische Universität München Lehrstuhl für Geoinformatik
4 29.10.2015
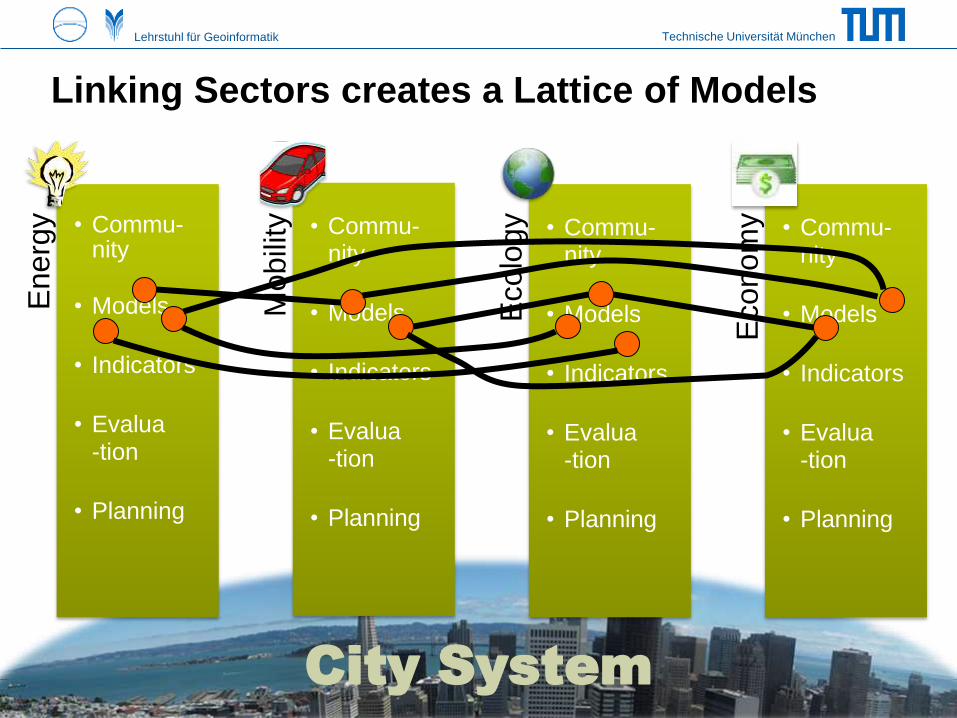
Linking Sectors creates a Lattice of Models
T. H. Kolbe – Smart Models for Smart Cities
Energ
y
• Commu-nity
• Models
• Indicators
• Evalua -tion
• Planning
Mo
bili
ty
• Commu-nity
• Models
• Indicators
• Evalua -tion
• Planning E
co
log
y
• Commu-nity
• Models
• Indicators
• Evalua -tion
• Planning
Eco
no
my
• Commu-nity
• Models
• Indicators
• Evalua -tion
• Planning
City System
Technische Universität München Lehrstuhl für Geoinformatik
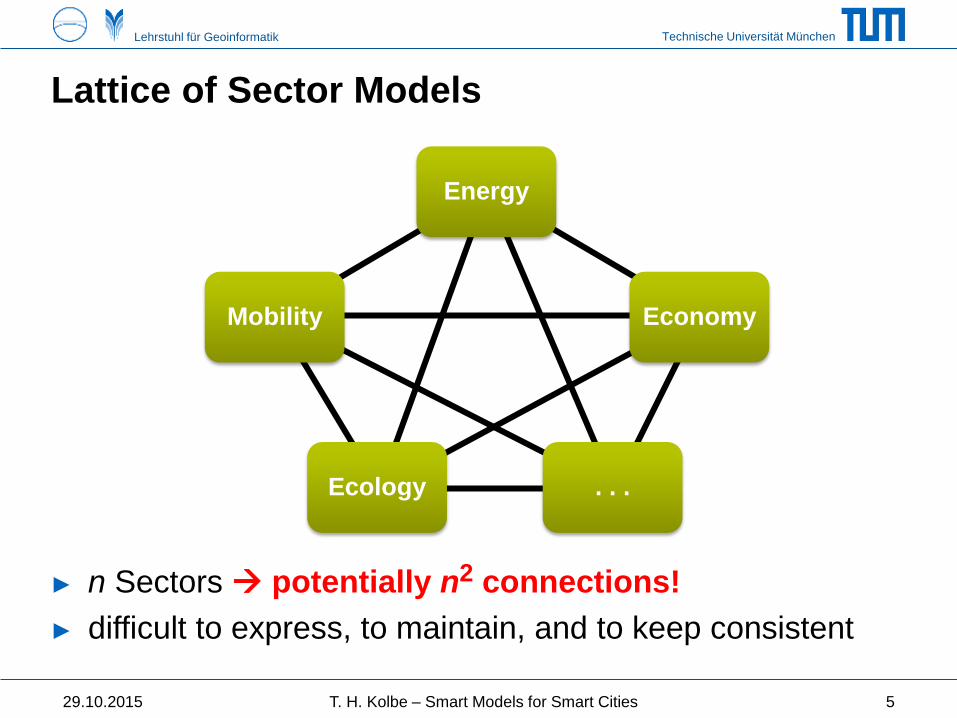
Lattice of Sector Models
29.10.2015 T. H. Kolbe – Smart Models for Smart Cities 5
► n Sectors potentially n2 connections!
► difficult to express, to maintain, and to keep consistent
Energy
Economy
. . . Ecology
Mobility
Technische Universität München Lehrstuhl für Geoinformatik
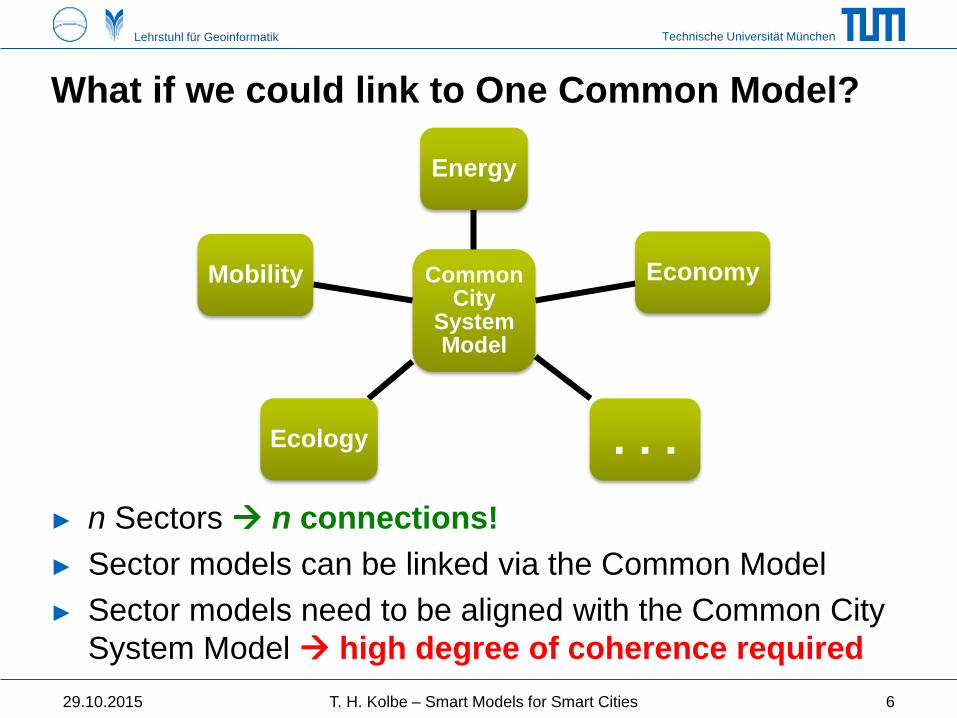
What if we could link to One Common Model?
29.10.2015 T. H. Kolbe – Smart Models for Smart Cities 6
► n Sectors n connections!
► Sector models can be linked via the Common Model
► Sector models need to be aligned with the Common City
System Model high degree of coherence required
Common City
System Model
Energy
Economy
. . . Ecology
Mobility

Technische Universität München Lehrstuhl für Geoinformatik
7 29.10.2015
Is there such an integrative model? Candidates?
T. H. Kolbe – Smart Models for Smart Cities
City System
Common City
System Model
Energy
Economy
. . . Ecology
Mobility
repre-
sented
by

Technische Universität München Lehrstuhl für Geoinformatik
29.10.2015
Semantic
3D City Models

Technische Universität München Lehrstuhl für Geoinformatik
3D Decomposition of Urban Space
► City is decomposed into meaningful objects with clear
semantics and defined spatial and thematic properties
● buildings, roads, railways, terrain, water bodies, vegetation, bridges
● buildings may be further decomposed into different storeys
(and even more detailed into apartments and single rooms)
● application specific data are associated with the different objects
Image: Paul Cote, Harvard Graduate School of Design
29.10.2015 T. H. Kolbe – Smart Models for Smart Cities 9

Technische Universität München Lehrstuhl für Geoinformatik
City Geography Markup Language – CityGML
Application independent Geospatial Information Model for semantic 3D city and landscape models
► comprises different thematic areas (buildings, vegetation, water, terrain, traffic, tunnels, bridges etc.)
► Internat‘l Standard of the Open Geospatial Consortium
● V1.0.0 adopted in 08/2008; V2.0.0 adopted in 3/2012
► Data model (UML) + Exchange format (based on GML3)
CityGML represents
► 3D geometry, 3D topology, semantics, and appearance
► in 5 discrete scales (Levels of Detail, LOD)
29.10.2015 T. H. Kolbe – Smart Models for Smart Cities 10
Technische Universität München Lehrstuhl für Geoinformatik
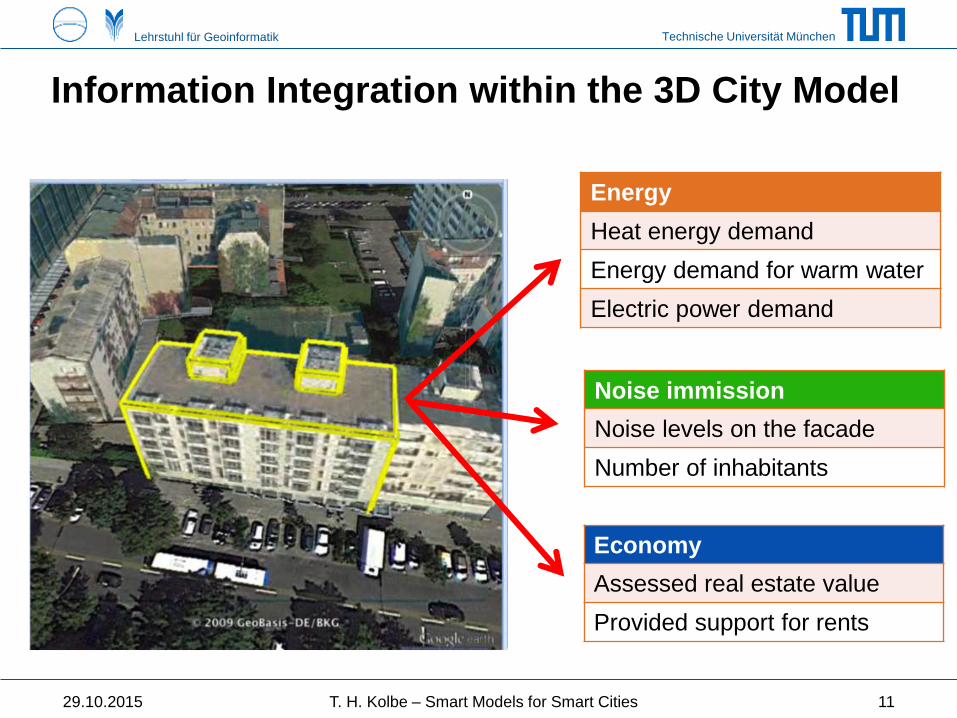
Energy
Heat energy demand
Energy demand for warm water
Electric power demand
Noise immission
Noise levels on the facade
Number of inhabitants
Economy
Assessed real estate value
Provided support for rents
Information Integration within the 3D City Model
T. H. Kolbe – Smart Models for Smart Cities 11 29.10.2015

Technische Universität München Lehrstuhl für Geoinformatik
New: CityGML Model of New York City in LOD 0&1
29.10.2015 T. H. Kolbe – Smart Models for Smart Cities 12
> 1,000,000 buildings
> 866,000 land lots
> 149,000 streets
> 16,000 parks
> 9,500 water bodies
> DTM with 1m resolution
• fully-automatically generated
from the 2D geodata
published in the NYC Open
Data Portal
• semantic and geometric
transformations
• all objects have 3D geometry
• rich semantic information
(5 - 75 attributes per object
resulting from combining
different NYC datasets)
• integrated within 1 dataset! The 3D CityGML model is Open Data! Download:
www.gis.bgu.tum.de/en/projects/new-york-city-3d/
[Barbara Burger, Berit Cantzler 2015]

Technische Universität München Lehrstuhl für Geoinformatik
Web-based 3D Visualization & Data Inspection
► Using the Open Source 3DCityDB + the new Webclient
● www.3dcitydb.net & https://github.com/3dcitydb/3dcitydb-web-map
29.10.2015 T. H. Kolbe – Smart Models for Smart Cities 13

Technische Universität München Lehrstuhl für Geoinformatik
29.10.2015
Current Challenges
in the light of
Smart City Projects

Technische Universität München Lehrstuhl für Geoinformatik
3D City Models – State of the Art + Challenges (I)
► Semantic 3D City Models
● Standardization (CityGML) provides a common vocabulary &
common ways to represent the many urban objects
● Semantic 3D city models are provided by official authorities
high reliability, stability, full coverage
● Objects of a semantic city model are a good platform to organize
and integrate data & sensors
► Today, 3D city models are mostly being used to describe
the current / a specific state of the city
● But: cities are constantly changing and there are many
dynamic aspects (moving objects, time variant attributes)
● Some of the time varying properties are provided by sensors
● Dynamics and processes not addressed much so far
29.10.2015 T. H. Kolbe – Smart Models for Smart Cities 15

Technische Universität München Lehrstuhl für Geoinformatik
3D City Models – State of the Art + Challenges (II)
► 3D City Models are used as a data source for simulations
and decision support in multiple application sectors
● these are interested in (computing) their specific indicators
● different application sectors have their own models and rules how
to compute indicator values (e.g. in the energy or mobility sectors)
► In planning & decision support it is important to have
immediate impact analyses of planned actions
● 3D City Model needs be modified according to some planned action
(like the energetic retrofitting of a building)
● Then, the (change of) relevant indicators should be derived from the
modified city model
● Planned actions mean complex transactions on the 3D city model
with specific meanings semantic modeling of actions
29.10.2015 T. H. Kolbe – Smart Models for Smart Cities 16

Technische Universität München Lehrstuhl für Geoinformatik
Modeling City Systems (MCS)
► Climate-KIC Innovation Project
► Project partners: ETH Zürich (iA, CVL), Imperial College,
TU Berlin, TU München, SmarterBetterCities, TNO, ESRI
► Project duration: 1. 1. 2014 – 31. 12. 2015 (2 years)
► EIT Funding (total): 2.4 Mio €
29.10.2015 T. H. Kolbe – Smart Models for Smart Cities 17

Technische Universität München Lehrstuhl für Geoinformatik
New Frameworks developed in the MCS Project
► General Indicator Model (GIM)
► General Planning Actions Model (GPAM)
● GIM and GPAM are based on Model Driven Engineering (MDE)
concepts defined in Software Engineering
► Dynamics in CityGML 3.0
● Two frequencies: low frequency changes evolution of the city
presentation of Kanishk Chaturvedi this morning
● Dynamic properties and behaviours of city objects (like the current
energy consumption, solar power production, traffic density)
introducing “Dynamizers“
29.10.2015 T. H. Kolbe – Smart Models for Smart Cities 18

Technische Universität München Lehrstuhl für Geoinformatik
29.10.2015
General Indicator
Model (GIM)

Technische Universität München Lehrstuhl für Geoinformatik
City (and its parts)
Measuring City Performance
29.10.2015 T. H. Kolbe – Smart Models for Smart Cities 20
Energy
Indicators Ecological
Indicators
Financial
Indicators Social
Indicators
Mobility
Indicators
► Evaluation is typically based on indicators,
the most relevant are called Key Performance Indicators (KPIs)
Source: shuttersock.com

Technische Universität München Lehrstuhl für Geoinformatik
Indicators Geobase data
29.10.2015 T. H. Kolbe – Smart Models for Smart Cities 21
Energy
Indicators
Mobility
Indicators
Ecological
Indicators
Social
Indicators
Financial
Indicators
CityGML Data
Data from National
Topography Models
LADM Data
INSPIRE Data
BIM Data
Technische Universität München Lehrstuhl für Geoinformatik
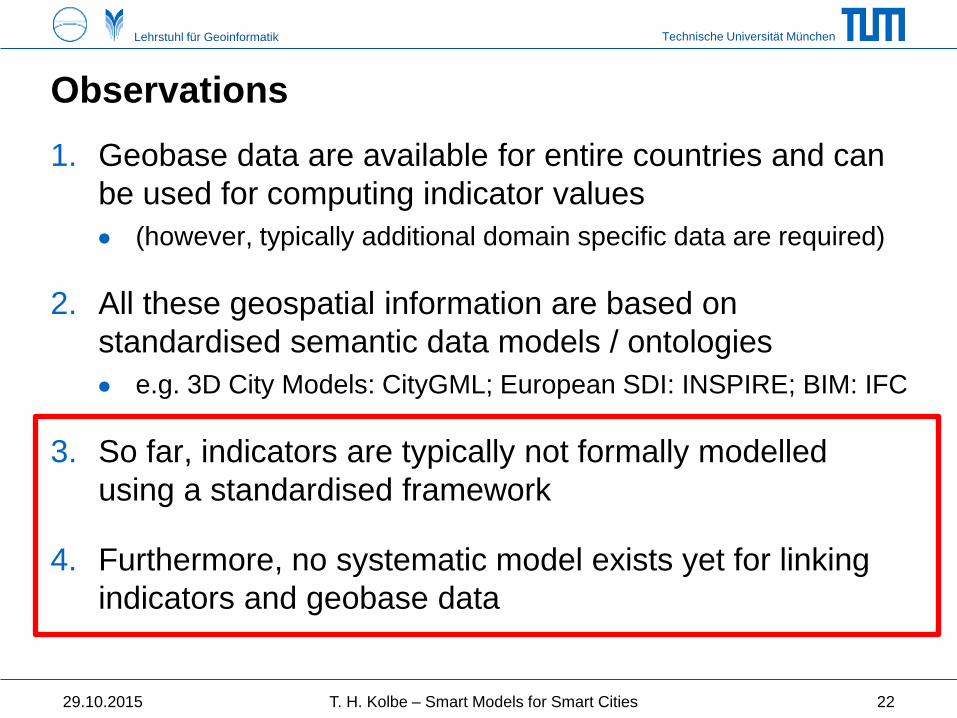
Observations
1. Geobase data are available for entire countries and can
be used for computing indicator values
● (however, typically additional domain specific data are required)
2. All these geospatial information are based on
standardised semantic data models / ontologies
● e.g. 3D City Models: CityGML; European SDI: INSPIRE; BIM: IFC
3. So far, indicators are typically not formally modelled
using a standardised framework
4. Furthermore, no systematic model exists yet for linking
indicators and geobase data
29.10.2015 T. H. Kolbe – Smart Models for Smart Cities 22

Technische Universität München Lehrstuhl für Geoinformatik
Model Driven Engineering (MDE)
► … is a software engineering paradigm which began to
evolve in the 1980s
► MDE puts the “model” in the form of formal specifications
in the center of software analysis and design
● Application relevant structures are represented by formal data
models (e.g. using Unified Modeling Language, UML)
● Program code is automatically derived from models
► MDE also addresses the linking of different models
● This is called Model Weaving
● Different models are linked by a weaving model which takes care
of data transformation across the models
29.10.2015 T. H. Kolbe – Smart Models for Smart Cities 23

Technische Universität München Lehrstuhl für Geoinformatik
29.10.2015 T. H. Kolbe – Smart Models for Smart Cities 24
General Feature
Model
ISO 19109
CityGML
Application
Schema
M1: Model
M2: Metamodel
X Y Z
This is the general schema which
all geospatial data models follow
(e.g. CityGML, INSPIRE, LADM,
national cadastre & topogr. models)
This is the data model of the
3D city model (here: CityGML)
It defines the structures of all
possible 3D city models
3D city model data, e.g. the objects
of the 3D city model of Berlin M0: Instance
Geospatial Information Modelling

Technische Universität München Lehrstuhl für Geoinformatik
29.10.2015 T. H. Kolbe – Smart Models for Smart Cities 25
General Feature
Model
ISO 19109
CityGML
Application
Schema
General
Indicator
Model
Energy Related
KPIs Application
Schema
Climate Related
KPIs Application
Schema
KPI A Building Y
KPI B Building Z
M1: Model
M2: Metamodel
X Y Z
M0: Instance
Indicator Modelling
Domain specific
indicators follow a
General Ind. Model
These are the
indicator models
from different
application
domains
Concrete indicators
for concrete city /
landscape objects

Technische Universität München Lehrstuhl für Geoinformatik
Requirements for Indicator Models
► Different types of indicators need to be distinguished
(i.e. numerical, textual, categorical indicators)
► Complex indicators can be composed & computed from
● attribute values from associated city / landscape model objects
● constants
● mathematical expressions (unary / binary arithmetic operations)
on other indicators
► Indicator value aggregation (e.g. summation, average,
maximum, etc.) of other indicators
► Augment indicator values with meta information like
accuracy, lineage / source etc.
● allowing for automatic sensitivity analysis
29.10.2015 T. H. Kolbe – Smart Models for Smart Cities 26

Technische Universität München Lehrstuhl für Geoinformatik
Domain Specific Indicator Modelling (I)
29.10.2015 T. H. Kolbe – Smart Models for Smart Cities 28
HeatDemand
+ value
Numeric
Indicator
General Indicator
Model
Domain
Indicators
Energy Planner
Where do I get the data from?
Domain of the stakeholder/application specialist
Energy Planner
Domain of the stakeholder/application specialist

Technische Universität München Lehrstuhl für Geoinformatik
29.10.2015 T. H. Kolbe – Smart Models for Smart Cities 29
-volume
Building
District
HeatDemand
+ value
Numeric
Indicator
DistrictHeat
EnergyDemand
+ compute()
BuildingHeat
EnergyDemand
OCL Rule 2
General Indicator
Model
Domain
Indicators
Object Related
Domain Indicators
Reference
Objects
«Aggregation»num
Energy Planner
Where do I get the data from?
Domain of the stakeholder/application specialist
**
Domain Specific Indicator Modelling (II)
Many of the
reference objects in
the context of urban
indicators are
spatial objects
Energy Planner
Domain of the stakeholder/application specialist

Technische Universität München Lehrstuhl für Geoinformatik
Linking Geospatial and Indicator Models
Building CityObject
GroupBuilding
Connector
District
Connector
-volume
Building
District
HeatDemand
+ value
Numeric
Indicator
CityObjectDistrictHeat
EnergyDemand
+ compute()
BuildingHeat
EnergyDemandSolid
OCL Rule 2
General Indicator
Model
Domain
Indicators
Object Related
Domain Indicators
Reference
Objects
«Aggregation»num
geometry
Geospatial Application Model
(e.g. CityGML)
Energy Planner
Where do I get the data from?
City Modeler
What can we do with our data?
Weaving
Model
Domain of the geodata provider Domain of the stakeholder/application specialist
**
*
OCL Rule 1
29.10.2015 T. H. Kolbe – Smart Models for Smart Cities 30
City Modeler Energy Planner
Domain of the stakeholder/application specialist Domain of the geodata provider

Technische Universität München Lehrstuhl für Geoinformatik
General Indicator Modeling Framework
► Each Indicator Application Model is defined purely from
the viewpoint and requirements of the domain specialist
● data is modeled and structured according to application domain
needs only – and not according to a given geospatial data model
► The data model is separated into 5 consecutive sections
1. Abstract Indicator classes (e.g. numeric indicator)
2. Domain specific indicators (e.g. heat demand)
3. Object-related domain specific indicators (e.g. building heat demand)
4. Reference Objects for the indicators (e.g. building)
► The 5th section addresses linking of the indicator model with
a geospatial application schema (like CityGML)
● Weaving Classes relate Reference Objects with Feature Types from
the geospatial application schema
29.10.2015 T. H. Kolbe – Smart Models for Smart Cities 31

Technische Universität München Lehrstuhl für Geoinformatik
Linking Geospatial and Indicator Models
Building CityObject
GroupBuilding
Connector
District
Connector
-volume
Building
District
HeatDemand
+ value
Numeric
Indicator
CityObjectDistrictHeat
EnergyDemand
+ compute()
BuildingHeat
EnergyDemandSolid
OCL Rule 2
General Indicator
Model
Domain
Indicators
Object Related
Domain Indicators
Reference
Objects
«Aggregation»num
geometry
Geospatial Application Model
(e.g. CityGML)
Energy Planner
Where do I get the data from?
City Modeler
What can we do with our data?
Weaving
Model
Domain of the geodata provider Domain of the stakeholder/application specialist
**
*
OCL Rule 1
29.10.2015 T. H. Kolbe – Smart Models for Smart Cities 32
City Modeler Energy Planner
Domain of the stakeholder/application specialist Domain of the geodata provider
1 2 3 4 5

Technische Universität München Lehrstuhl für Geoinformatik
Linking of an Indicator Model to
different Geospatial Application Models and BIM
Reference Object Classes
Weaving Classes 1
Weaving Classes 2
Weaving Classes 3
CityGML
INSPIRE
BIM / IFC
Object Related Indicators Domain A
Object Related Indicators Domain B
General Indicator Model
29.10.2015 T. H. Kolbe – Smart Models for Smart Cities 33
Domain of the stakeholder/application specialist Domains of
the geodata /
BIM providers
Model Weavings
Reference Object Classes
Weaving Classes 1
Weaving Classes 2
Weaving Classes 3
CityGML
INSPIRE
BIM / IFC
Object Related Indicators Domain A
Object Related Indicators Domain B
General Indicator Model
HeatDemand
+ value
Numeric
Indicator
General Indicator
Model
Domain
Indicators
Energy Planner
Where do I get the data from?
Domain of the stakeholder/application specialist
Building CityObject
GroupBuilding
Connector
District
Connector
-volume
Building
District
HeatDemand
+ value
Numeric
Indicator
CityObjectDistrictHeat
EnergyDemand
+ compute()
BuildingHeat
EnergyDemandSolid
OCL Rule 2
General Indicator
Model
Domain
Indicators
Object Related
Domain Indicators
Reference
Objects
«Aggregation»num
geometry
Geospatial Application Model
(e.g. CityGML)
Energy Planner
Where do I get the data from?
City Modeler
What can we do with our data?
Weaving
Model
Domain of the geodata provider Domain of the stakeholder/application specialist
**
*
OCL Rule 1
We can analyse & compare how good /
easy an indicator model fits to a
specific geospatial application model!
Technische Universität München Lehrstuhl für Geoinformatik
29.10.2015
General Planning
Actions Model
(GPAM)

Technische Universität München Lehrstuhl für Geoinformatik
present
t0
past
t-1
future
t1
Reality t-1
City Model t-1
KPIs t-1
Reality t0
City Model t0
KPIs t0
registration/
update registration
Reality t1 ?
City Model t1
KPIs t1
City Model t1‘
Reality t1‘ ?
KPIs t1‘
NO data
collection
possible
calculation
change
calculation
T. H. Kolbe – Smart Models for Smart Cities 29.10.2015 35

Technische Universität München Lehrstuhl für Geoinformatik
Formalization of Action Plans
100 %
0 %
political text regulation ontology for
actions
T. H. Kolbe – Smart Models for Smart Cities
Aim: making action plans virtually executable on 3D city models!
29.10.2015 36

Technische Universität München Lehrstuhl für Geoinformatik
Properties of Planning Actions (I)
► Actions cause a change of the geometry or the
attributes of the city objects
● they are planned modifications / operations on the entities of a city
► Actions always pursue a specific goal
● that is of different nature / motivation (e.g. monetary, cultural,
personal) and is politically intended
● can be measured by the impact on some key performance
indicators (KPIs)
► Types of actions
● extend existing objects (by new parts, properties, relations)
● change existing objects (update attributes, relations)
● remove existing objects (delete whole & parts, properties, relations)
T. H. Kolbe – Smart Models for Smart Cities 29.10.2015 37
Technische Universität München Lehrstuhl für Geoinformatik
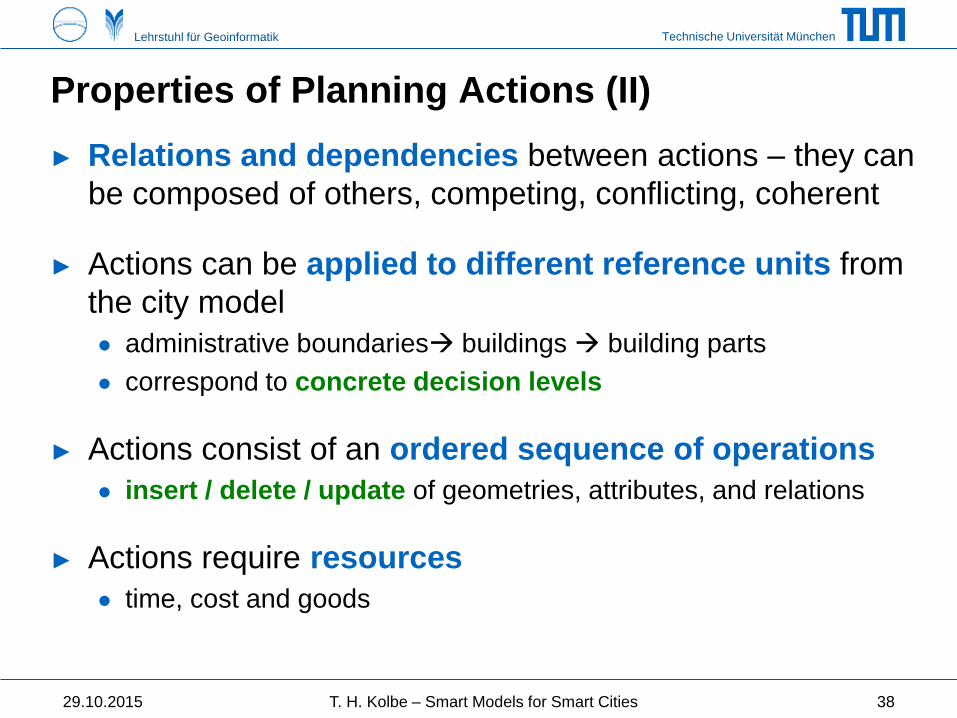
Properties of Planning Actions (II)
► Relations and dependencies between actions – they can
be composed of others, competing, conflicting, coherent
► Actions can be applied to different reference units from
the city model
● administrative boundaries buildings building parts
● correspond to concrete decision levels
► Actions consist of an ordered sequence of operations
● insert / delete / update of geometries, attributes, and relations
► Actions require resources
● time, cost and goods
T. H. Kolbe – Smart Models for Smart Cities 29.10.2015 38

Technische Universität München Lehrstuhl für Geoinformatik
29.10.2015 T. H. Kolbe – Smart Models for Smart Cities 39
Data Model
Aus dem Dissertationsvorhaben
von Maximilian Sindram

Technische Universität München Lehrstuhl für Geoinformatik
29.10.2015 T. H. Kolbe – Smart Models for Smart Cities 40
General Planning Actions Model (Draft)
Aus dem Dissertationsvorhaben
von Maximilian Sindram

Technische Universität München Lehrstuhl für Geoinformatik
29.10.2015 T. H. Kolbe – Smart Models for Smart Cities 41
General Planning Actions Model (Draft)
Aus dem Dissertationsvorhaben
von Maximilian Sindram

Technische Universität München Lehrstuhl für Geoinformatik
Prototypical Action
Specific Action
Semantic 3D City Model
Fra
me
P
ara
mete
r
Instance
T. H. Kolbe – Smart Models for Smart Cities 29.10.2015 42

Technische Universität München Lehrstuhl für Geoinformatik
German regulation
11 and 12 main street
Buildings (11, 12 and 13 main street)
• refurbishment (energy) (A): policy measure
(1bn Euro)
• sub action (SA): renovation of a building
• facade renovation (S1): insulation of a wall causes a
change of U-value (of the wall)
• window renovation (S2): exchanging windows causes a
change of UW-values (of the window)
11 12 13
S1 S2
A
SA
• (A): political funding
(1m Euro in Munich)
• (SA): renovation of all buildings in main street
• (S1) and (S2): insulation of all buildings with:
bricks (24cm) U-value > 0,8 W/m2K and
double-glazed windows UW-Wert > 1,1 W/m2K
• 11 main street: U-value = 0,7 and UW-value = 2,0
• 12 main street: listed building (age: 200)
• 13 main street: U-value = 1,8 and UW-value = 3,9
11 partial renovation / 12 no renovation / 13 renovation
I
I
I
I
I
I I
T. H. Kolbe – Smart Models for Smart Cities 29.10.2015 43

Technische Universität München Lehrstuhl für Geoinformatik
29.10.2015
Bringing it
all together

Technische Universität München Lehrstuhl für Geoinformatik
General Feature
Model
ISO 19109
General Indicator
Model General Planning
Actions Model
Energy Related
KPIs Application
Schema
Climate Related
KPIs Application
Schema
Energy Planning
Application
Schema
Traffic Planning
Application
Schema
KPI
building X
KPI
building Y Facade
retrofitting
building X
CityGML
Application
Schema
29.10.2015 T. H. Kolbe – Smart Models for Smart Cities 45

Technische Universität München Lehrstuhl für Geoinformatik
29.10.2015
Outlook: Dynamics
in CityGML 3.0
&
Conclusions

Technische Universität München Lehrstuhl für Geoinformatik
An Outlook to CityGML 3.0
► CityGML 3.0 is currently under development in the OGC
● release of the new version expected in 2017
► New CityGML 3.0 features (subject to voting)
● data model based on ISO 19136 (GML 3.2.1); automatic derivation
of the exchange format (i.e. the CityGML application schema)
● more flexible LOD concept – separate indoor & outdoor LODs
possible; the previous LOD 0-4 concept is retained as a profile
● new feature types (e.g. for non-building constructions) &
refinements (e.g. building units)
● versioning and historization
● dynamic, i.e. time-dependent object properties e.g. for energy
consumption, energy production, moving objects
● direct linking of sensor data to object properties
● tabulated & interpolated values; simple & complex patterns
29.10.2015 T. H. Kolbe – Smart Models for Smart Cities 47

Technische Universität München Lehrstuhl für Geoinformatik
Dynamic Data in CityGML 3.0
► Two distinct approaches
● For slow changes / city model evolution: versioning & historization
● For fast changes: time-variant properties (attributes, geometry)
29.10.2015 T. H. Kolbe – Smart Models for Smart Cities 48
CityGML
V2
V3
How to organize
the state of our
world
Dynamizer
Dynamic variations
Periodic patterns
Mechanism
required to
ensure that
within one
version we
have a
consistent
city model
Provides
replacers /
overriders,
replacing the
attributes in
the static
CityGML
model
Dynamic Data Schema
Versioning Schema City Model
V2
V3
V1 V1
[Kanishk Chaturvedi 2015]

Technische Universität München Lehrstuhl für Geoinformatik
Conclusions
► Semantic 3D city models are good platforms to structure
and organize urban data – but mostly in a static way so far!
► We propose two new frameworks complementing the
General Feature Model (GFM) ISO 19109
► General Indicator Model (GIM)
● allows to specify domain specific indicator models independent from
geospatial application schemas
● concept for linking indicator models to geospatial application schemas
● programs for indicator computations are automatically derivable
► General Planning Actions Model (GPAM)
● allows to formalize planning actions in different application domains
● consideration of affected KPIs, modified objects, transactions
29.10.2015 T. H. Kolbe – Smart Models for Smart Cities 49
Technische Universität München Lehrstuhl für Geoinformatik
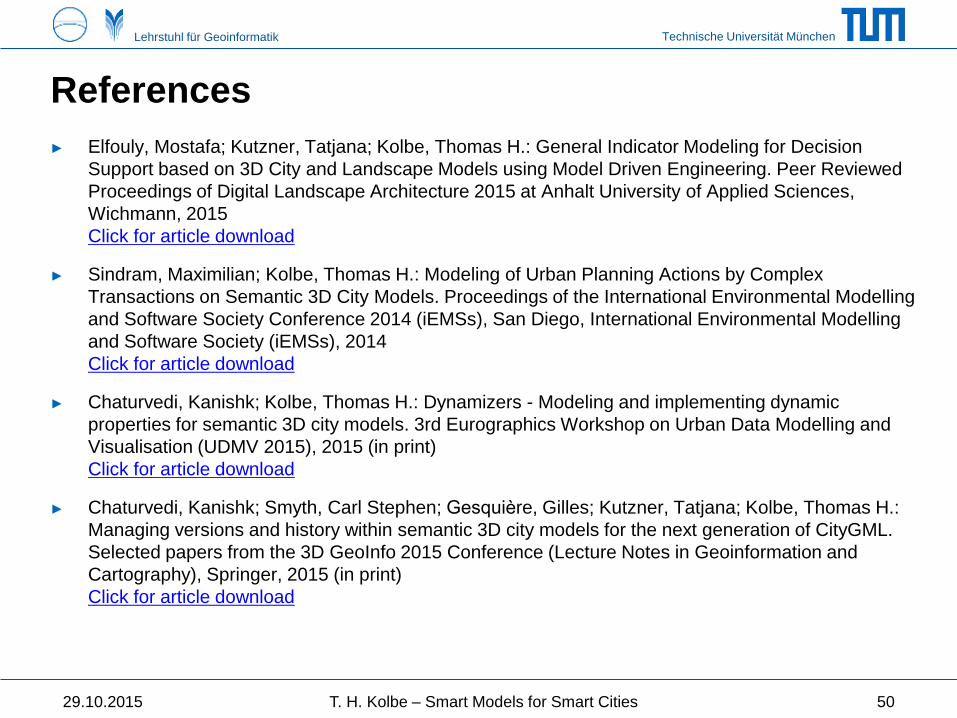
References
► Elfouly, Mostafa; Kutzner, Tatjana; Kolbe, Thomas H.: General Indicator Modeling for Decision
Support based on 3D City and Landscape Models using Model Driven Engineering. Peer Reviewed
Proceedings of Digital Landscape Architecture 2015 at Anhalt University of Applied Sciences,
Wichmann, 2015
Click for article download
► Sindram, Maximilian; Kolbe, Thomas H.: Modeling of Urban Planning Actions by Complex
Transactions on Semantic 3D City Models. Proceedings of the International Environmental Modelling
and Software Society Conference 2014 (iEMSs), San Diego, International Environmental Modelling
and Software Society (iEMSs), 2014
Click for article download
► Chaturvedi, Kanishk; Kolbe, Thomas H.: Dynamizers - Modeling and implementing dynamic
properties for semantic 3D city models. 3rd Eurographics Workshop on Urban Data Modelling and
Visualisation (UDMV 2015), 2015 (in print)
Click for article download
► Chaturvedi, Kanishk; Smyth, Carl Stephen; Gesquiere, Gilles; Kutzner, Tatjana; Kolbe, Thomas H.:
Managing versions and history within semantic 3D city models for the next generation of CityGML.
Selected papers from the 3D GeoInfo 2015 Conference (Lecture Notes in Geoinformation and
Cartography), Springer, 2015 (in print)
Click for article download
29.10.2015 T. H. Kolbe – Smart Models for Smart Cities 50

Technische Universität München Lehrstuhl für Geoinformatik
Credits
► The projects Energy Atlas, Modeling City Systems,
Smart Sustainable Districts have been funded
by Climate-KIC of the European Institute
for Innovation and Technology (EIT)
29.10.2015 T. H. Kolbe – Smart Models for Smart Cities 51