Smart homes - Statista Dossier Statista Dossier © Statista, Inc. (NY)
43
Smart homes - Statista Dossier Statista Dossier © Statista, Inc. (NY)
-
Upload
sharlene-campbell -
Category
Documents
-
view
225 -
download
3
Transcript of Smart homes - Statista Dossier Statista Dossier © Statista, Inc. (NY)
Smart homes - Statista DossierStatista Dossier
© Statista, Inc. (NY)

Table of ContentsSmart homes - Statista Dossier
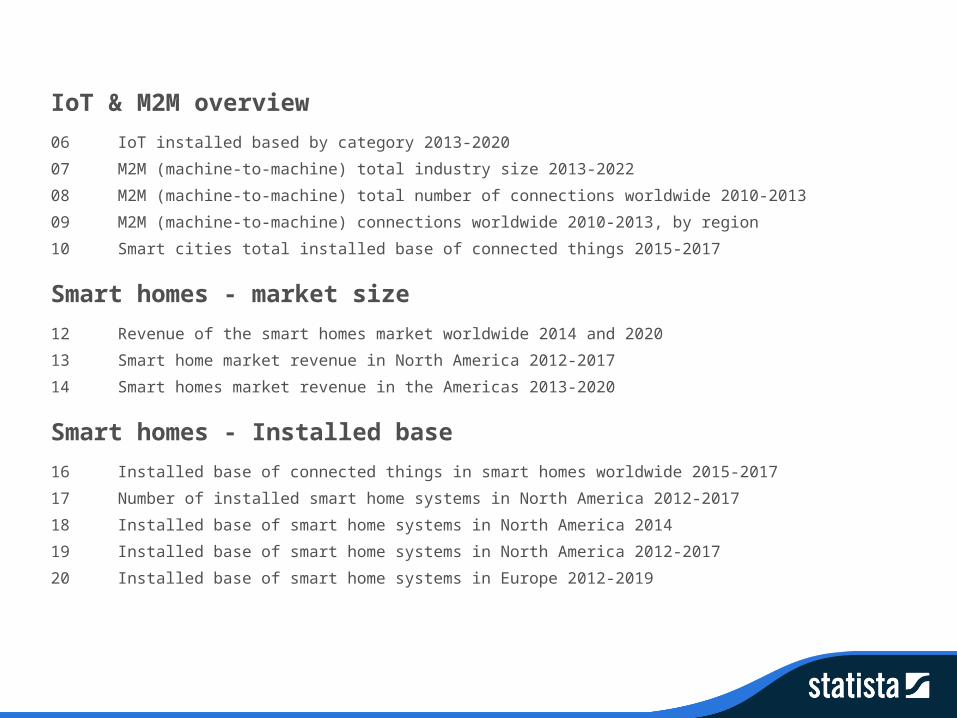
IoT & M2M overview
06 IoT installed based by category 2013-2020
07 M2M (machine-to-machine) total industry size 2013-2022
08 M2M (machine-to-machine) total number of connections worldwide 2010-2013
09 M2M (machine-to-machine) connections worldwide 2010-2013, by region
10 Smart cities total installed base of connected things 2015-2017
Smart homes - market size
12 Revenue of the smart homes market worldwide 2014 and 2020
13 Smart home market revenue in North America 2012-2017
14 Smart homes market revenue in the Americas 2013-2020
Smart homes - Installed base
16 Installed base of connected things in smart homes worldwide 2015-2017
17 Number of installed smart home systems in North America 2012-2017
18 Installed base of smart home systems in North America 2014
19 Installed base of smart home systems in North America 2012-2017
20 Installed base of smart home systems in Europe 2012-2019
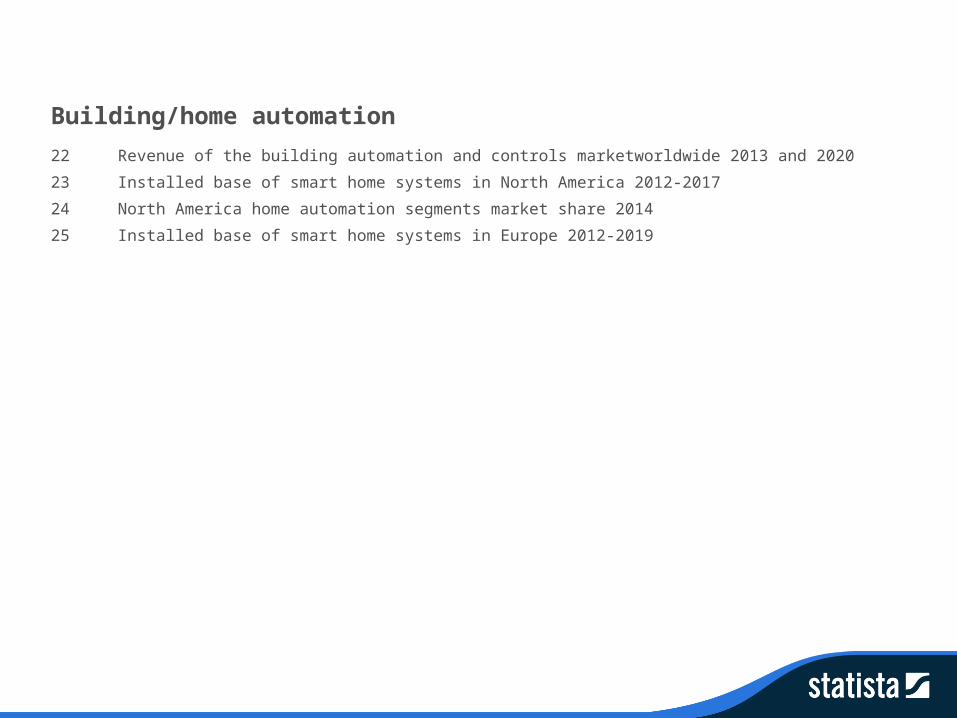
Building/home automation
22 Revenue of the building automation and controls marketworldwide 2013 and 2020
23 Installed base of smart home systems in North America 2012-2017
24 North America home automation segments market share 2014
25 Installed base of smart home systems in Europe 2012-2019

IoT & M2M overviewSmart homes - Statista Dossier
IoT & M2M overview
Further information regarding this statistic can be found on page 27.
6
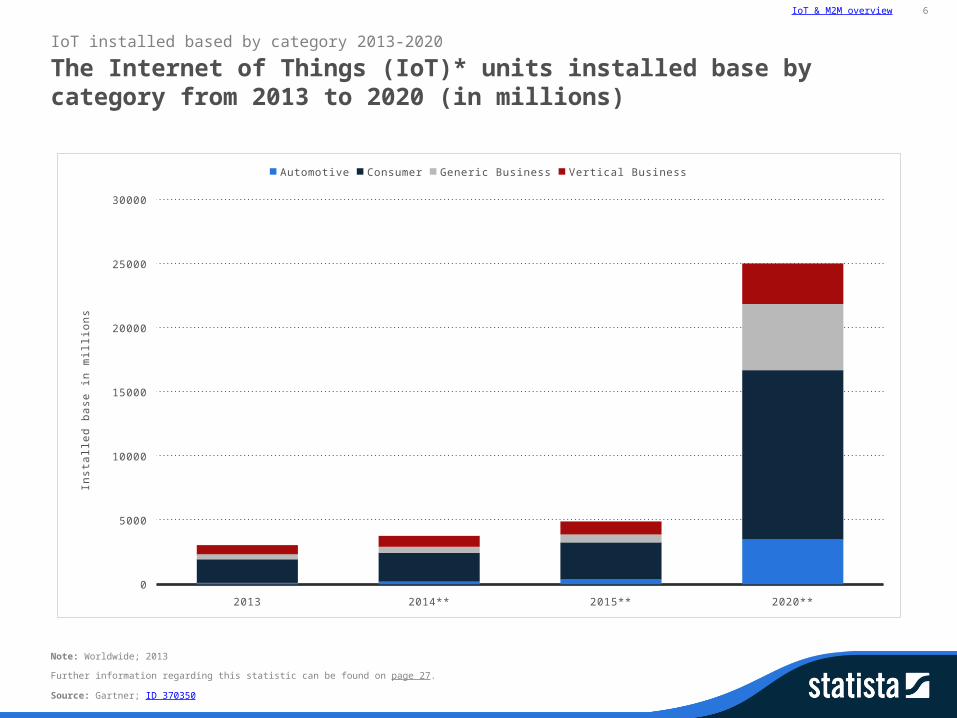
The Internet of Things (IoT)* units installed base by category from 2013 to 2020 (in millions)
IoT installed based by category 2013-2020
Note: Worldwide; 2013
Source: Gartner; ID 370350
2013 2014** 2015** 2020**
0
5000
10000
15000
20000
25000
30000
Automotive Consumer Generic Business Vertical Business
Ins
talle
d b
as
e in
mill
ion
s
IoT & M2M overview
Further information regarding this statistic can be found on page 28.
7
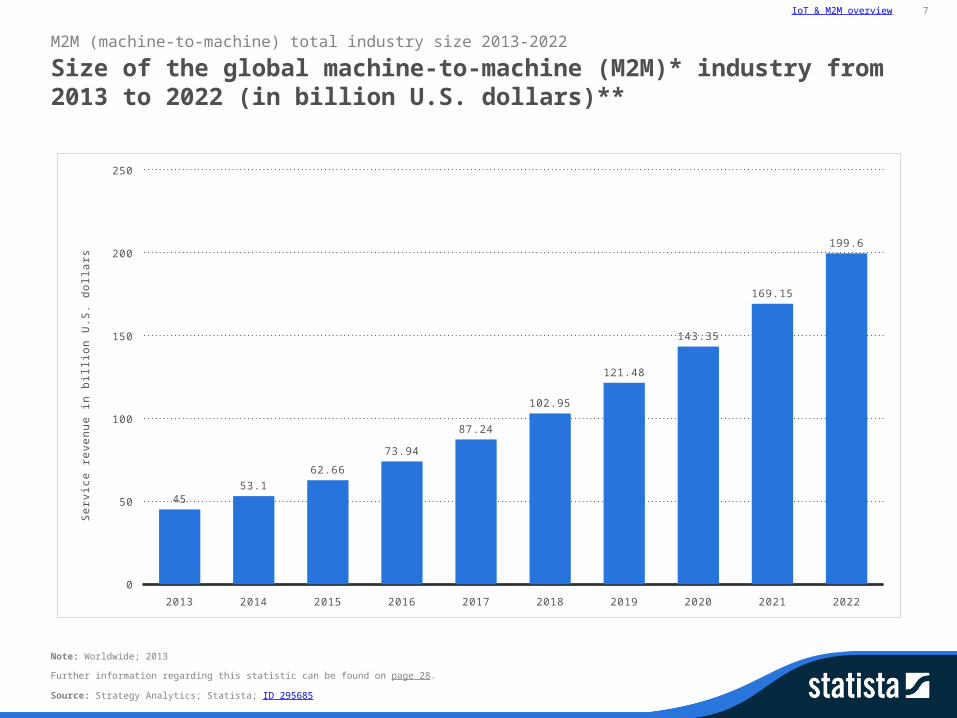
Size of the global machine-to-machine (M2M)* industry from 2013 to 2022 (in billion U.S. dollars)**
M2M (machine-to-machine) total industry size 2013-2022
Note: Worldwide; 2013
Source: Strategy Analytics; Statista; ID 295685
2013 2014 2015 2016 2017 2018 2019 2020 2021 2022
0
50
100
150
200
250
4553.1
62.66
73.94
87.24
102.95
121.48
143.35
169.15
199.6
Se
rvic
e r
ev
en
ue
in b
illio
n U
.S.
do
llars
IoT & M2M overview
Further information regarding this statistic can be found on page 29.
8
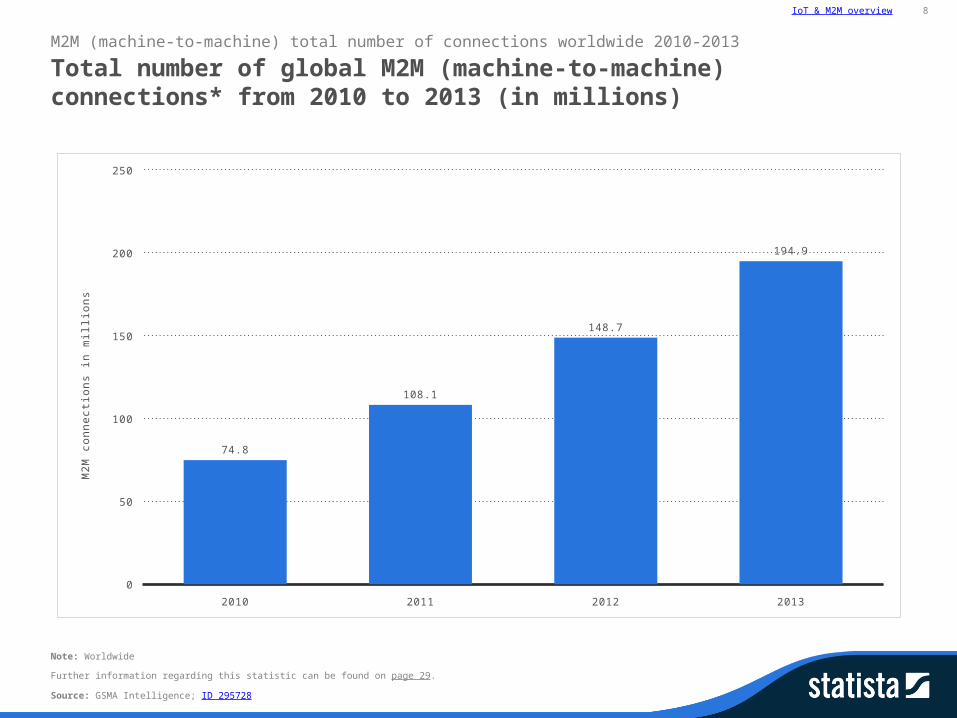
Total number of global M2M (machine-to-machine) connections* from 2010 to 2013 (in millions)
M2M (machine-to-machine) total number of connections worldwide 2010-2013
Note: Worldwide
Source: GSMA Intelligence; ID 295728
2010 2011 2012 2013
0
50
100
150
200
250
74.8
108.1
148.7
194.9
M2
M c
on
ne
ctio
ns
in m
illio
ns
IoT & M2M overview
Further information regarding this statistic can be found on page 30.
9
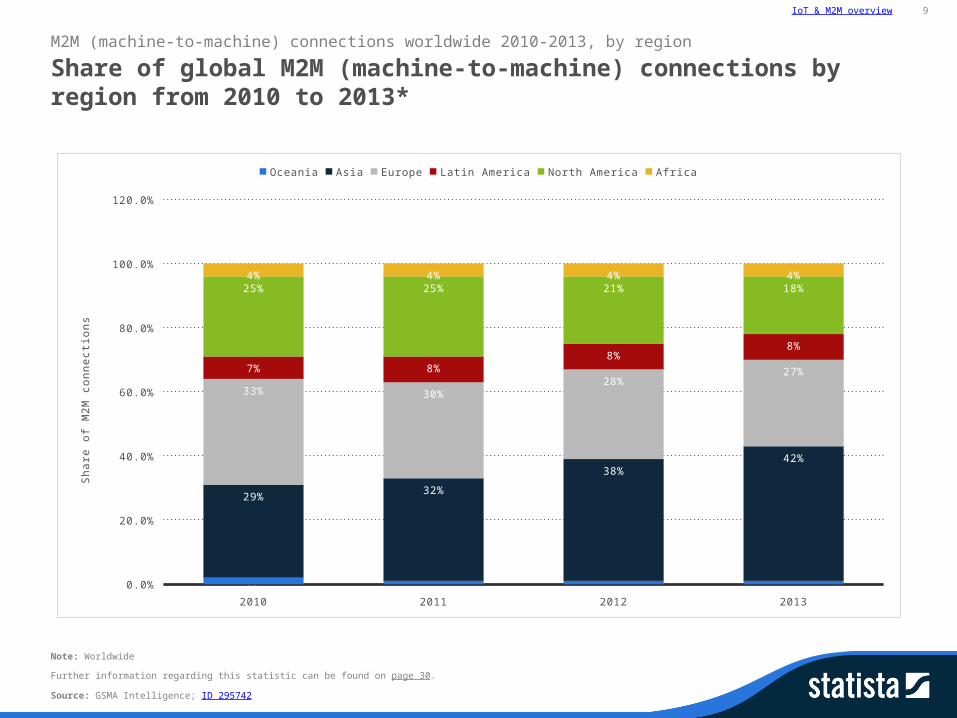
Share of global M2M (machine-to-machine) connections by region from 2010 to 2013*
M2M (machine-to-machine) connections worldwide 2010-2013, by region
Note: Worldwide
Source: GSMA Intelligence; ID 295742
2010 2011 2012 2013
0.0%
20.0%
40.0%
60.0%
80.0%
100.0%
120.0%
2% 1% 1% 1%
29%32%
38%42%
33% 30%28%
27%7% 8%8%
8%
25% 25% 21% 18%4% 4% 4% 4%
Oceania Asia Europe Latin America North America Africa
Sh
are
of
M2
M c
on
ne
ctio
ns
IoT & M2M overview
Further information regarding this statistic can be found on page 31.
10
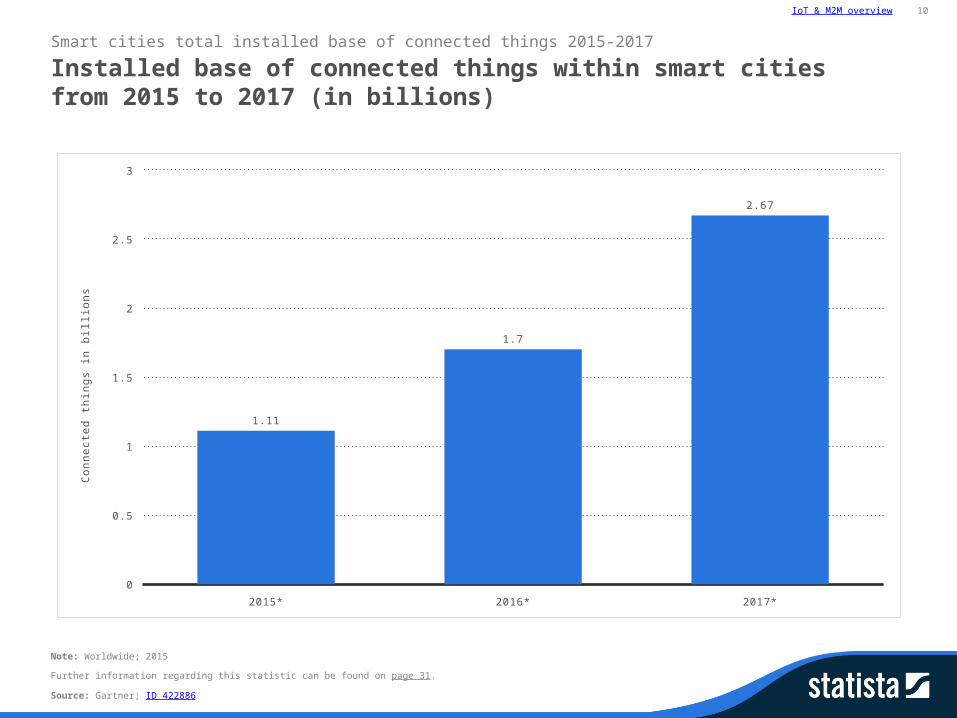
Installed base of connected things within smart cities from 2015 to 2017 (in billions)
Smart cities total installed base of connected things 2015-2017
Note: Worldwide; 2015
Source: Gartner; ID 422886
2015* 2016* 2017*
0
0.5
1
1.5
2
2.5
3
1.11
1.7
2.67
Co
nn
ec
ted
th
ing
s in
bill
ion
s
Smart homes - market sizeSmart homes - Statista Dossier
Smart homes - market size
Further information regarding this statistic can be found on page 32.
12
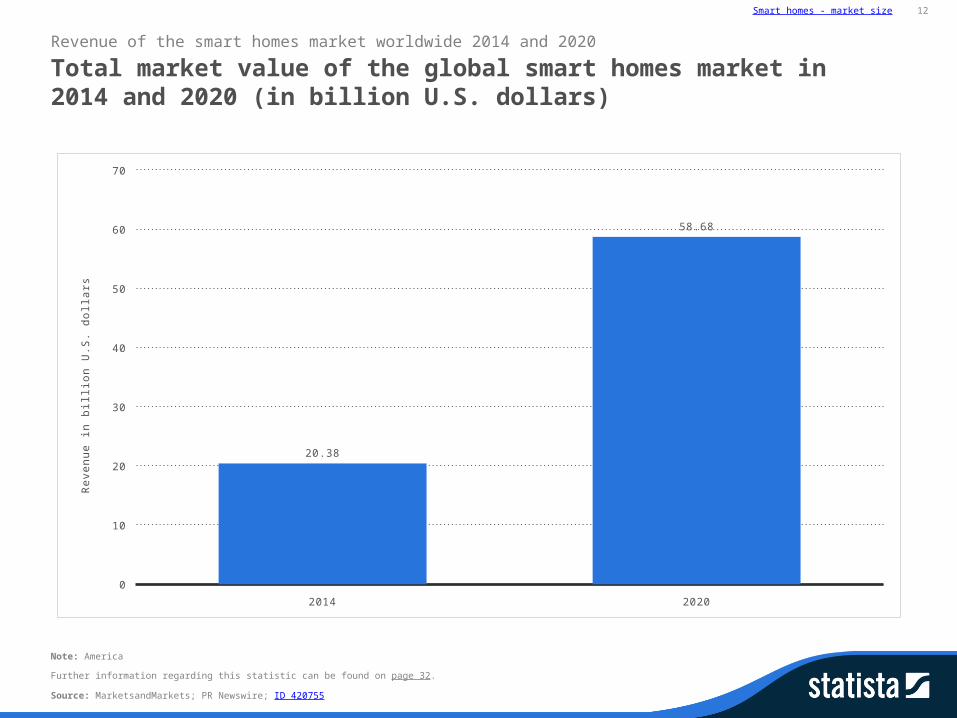
Total market value of the global smart homes market in 2014 and 2020 (in billion U.S. dollars)
Revenue of the smart homes market worldwide 2014 and 2020
Note: America
Source: MarketsandMarkets; PR Newswire; ID 420755
2014 2020
0
10
20
30
40
50
60
70
20.38
58.68
Re
ve
nu
e in
bill
ion
U.S
. d
olla
rs
Smart homes - market size
Further information regarding this statistic can be found on page 33.
13
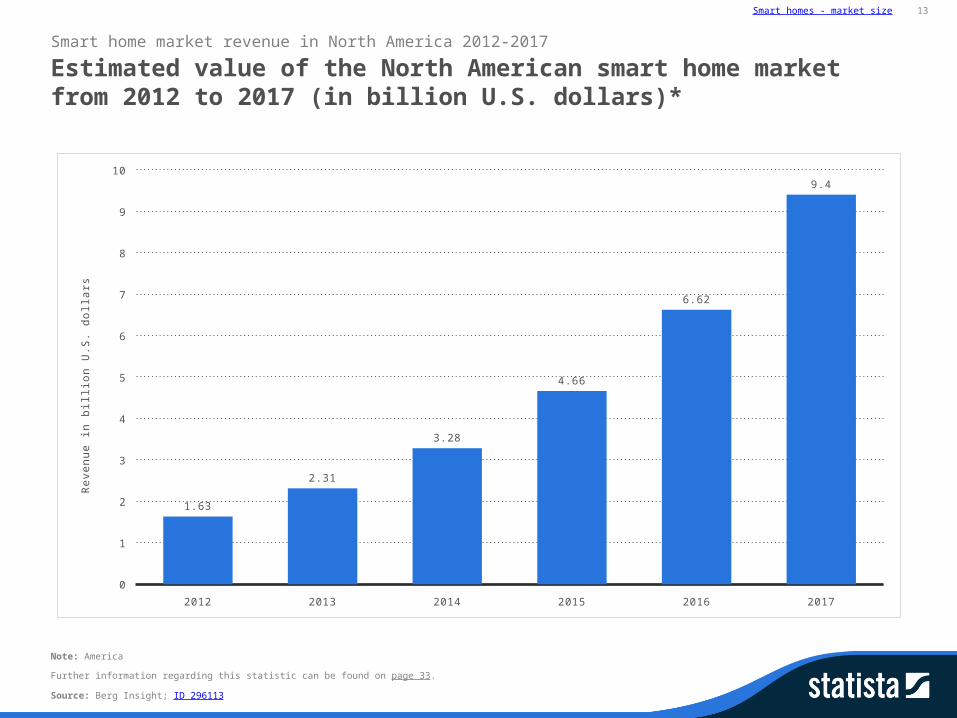
Estimated value of the North American smart home market from 2012 to 2017 (in billion U.S. dollars)*
Smart home market revenue in North America 2012-2017
Note: America
Source: Berg Insight; ID 296113
2012 2013 2014 2015 2016 2017
0
1
2
3
4
5
6
7
8
9
10
1.63
2.31
3.28
4.66
6.62
9.4
Re
ve
nu
e in
bill
ion
U.S
. d
olla
rs
Smart homes - market size
Further information regarding this statistic can be found on page 34.
14
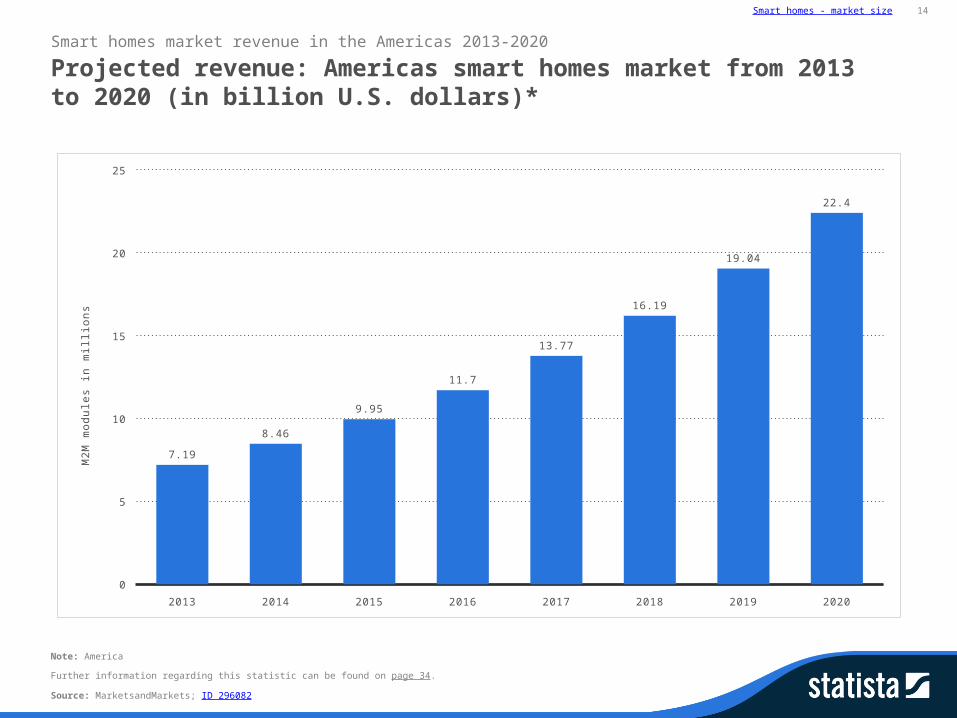
Projected revenue: Americas smart homes market from 2013 to 2020 (in billion U.S. dollars)*
Smart homes market revenue in the Americas 2013-2020
Note: America
Source: MarketsandMarkets; ID 296082
2013 2014 2015 2016 2017 2018 2019 2020
0
5
10
15
20
25
7.19
8.46
9.95
11.7
13.77
16.19
19.04
22.4
M2
M m
od
ule
s in
mill
ion
s

Smart homes - Installed baseSmart homes - Statista Dossier
Smart homes - Installed base
Further information regarding this statistic can be found on page 35.
16
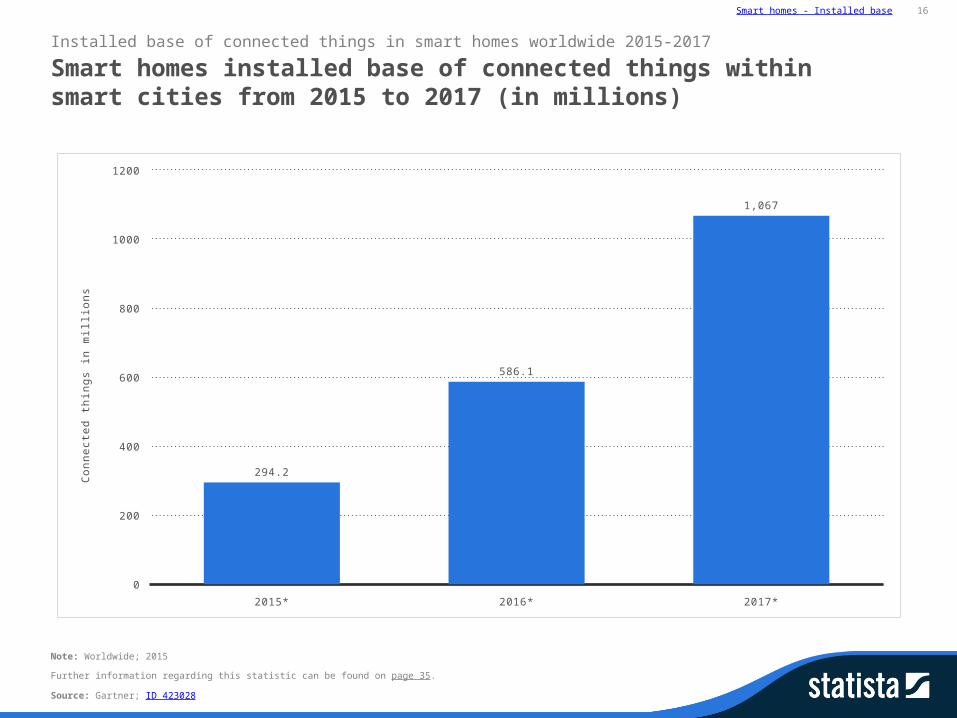
Smart homes installed base of connected things within smart cities from 2015 to 2017 (in millions)
Installed base of connected things in smart homes worldwide 2015-2017
Note: Worldwide; 2015
Source: Gartner; ID 423028
2015* 2016* 2017*
0
200
400
600
800
1000
1200
294.2
586.1
1,067
Co
nn
ec
ted
th
ing
s in
mill
ion
s
Smart homes - Installed base
Further information regarding this statistic can be found on page 36.
17
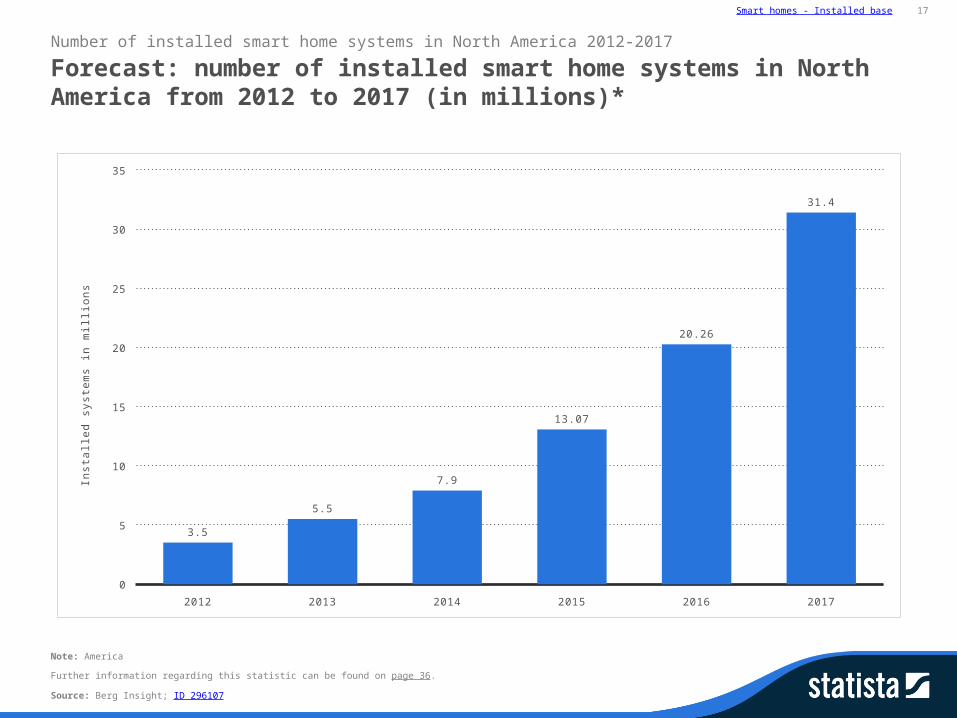
Forecast: number of installed smart home systems in North America from 2012 to 2017 (in millions)*
Number of installed smart home systems in North America 2012-2017
Note: America
Source: Berg Insight; ID 296107
2012 2013 2014 2015 2016 2017
0
5
10
15
20
25
30
35
3.5
5.5
7.9
13.07
20.26
31.4
Ins
talle
d s
ys
tem
s in
mill
ion
s
Smart homes - Installed base
Further information regarding this statistic can be found on page 37.
18
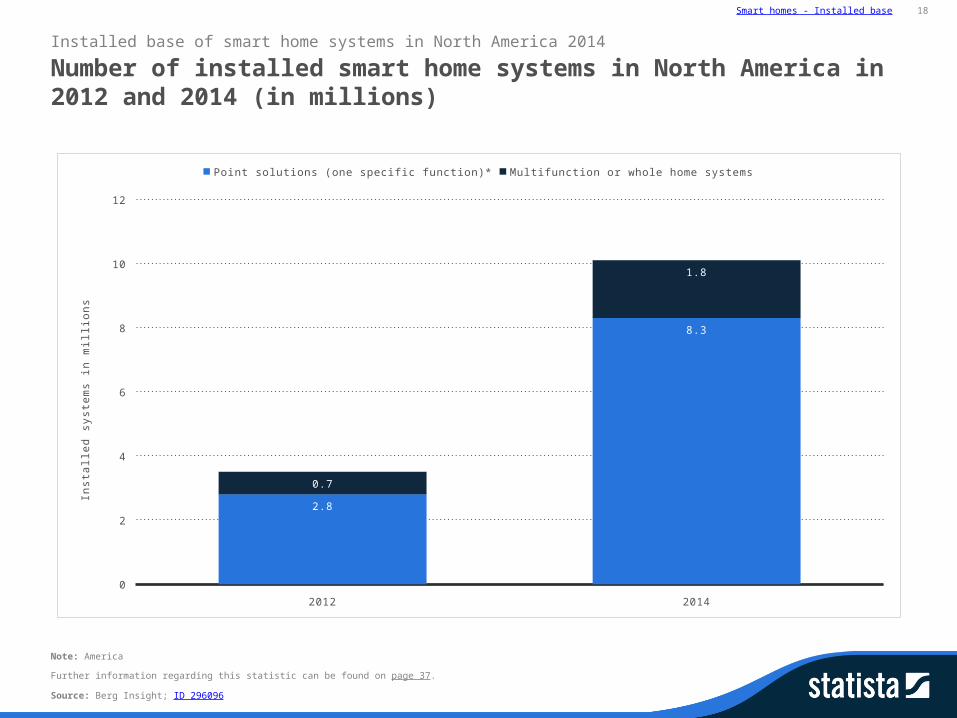
Number of installed smart home systems in North America in 2012 and 2014 (in millions)
Installed base of smart home systems in North America 2014
Note: America
Source: Berg Insight; ID 296096
2012 2014
0
2
4
6
8
10
12
2.8
8.3
0.7
1.8
Point solutions (one specific function)* Multifunction or whole home systems
Ins
talle
d s
ys
tem
s in
mill
ion
s

Smart homes - Installed base
Further information regarding this statistic can be found on page 38.
19
Installed base of home automation/smart home systems in the United States from 2012 to 2017 (in millions)
Installed base of smart home systems in North America 2012-2017
Note: United States
Source: PR Newswire; ID 286813
2012 2013 2014 2017
0
5
10
15
20
25
30
35
3.5
5.5
10.2
31.4
Ins
talle
d b
as
e in
mill
ion
s
Smart homes - Installed base
Further information regarding this statistic can be found on page 39.
20
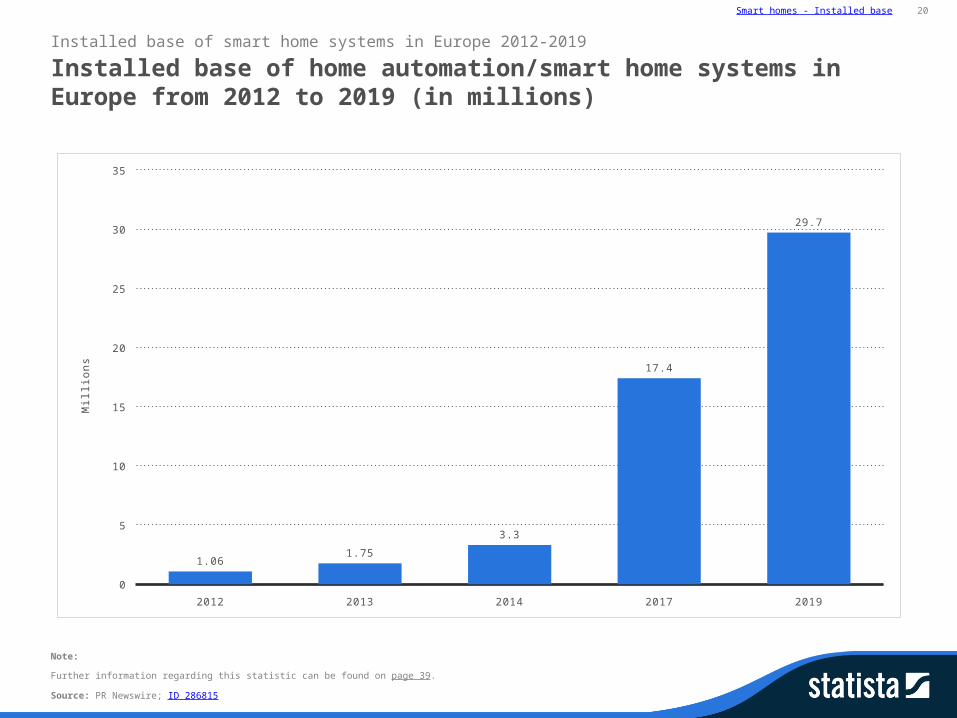
Installed base of home automation/smart home systems in Europe from 2012 to 2019 (in millions)
Installed base of smart home systems in Europe 2012-2019
Note:
Source: PR Newswire; ID 286815
2012 2013 2014 2017 2019
0
5
10
15
20
25
30
35
1.061.75
3.3
17.4
29.7
Mill
ion
s

Building/home automationSmart homes - Statista Dossier
Building/home automation
Further information regarding this statistic can be found on page 40.
22
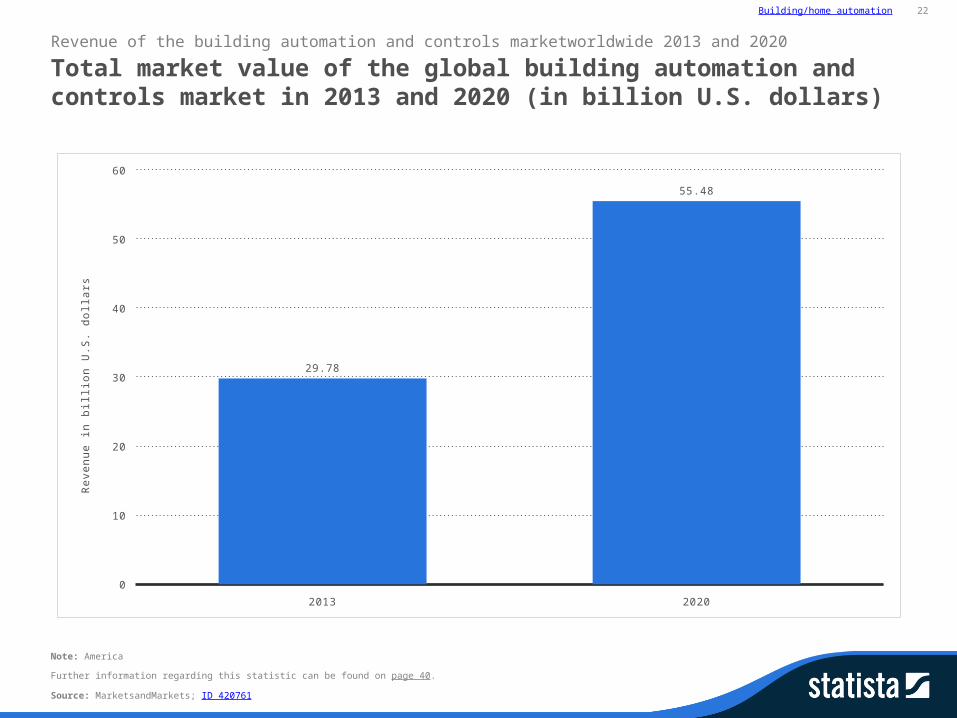
Total market value of the global building automation and controls market in 2013 and 2020 (in billion U.S. dollars)
Revenue of the building automation and controls marketworldwide 2013 and 2020
Note: America
Source: MarketsandMarkets; ID 420761
2013 2020
0
10
20
30
40
50
60
29.78
55.48
Re
ve
nu
e in
bill
ion
U.S
. d
olla
rs
Building/home automation
Further information regarding this statistic can be found on page 41.
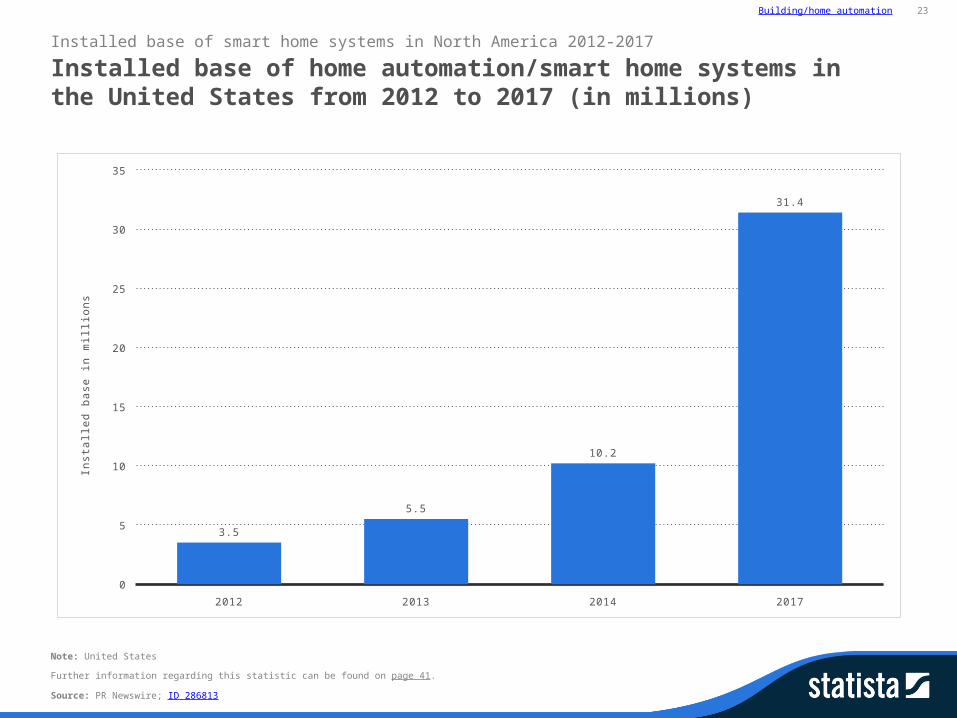
23
Installed base of home automation/smart home systems in the United States from 2012 to 2017 (in millions)
Installed base of smart home systems in North America 2012-2017
Note: United States
Source: PR Newswire; ID 286813
2012 2013 2014 2017
0
5
10
15
20
25
30
35
3.5
5.5
10.2
31.4
Ins
talle
d b
as
e in
mill
ion
s
Building/home automation
Further information regarding this statistic can be found on page 42.
24
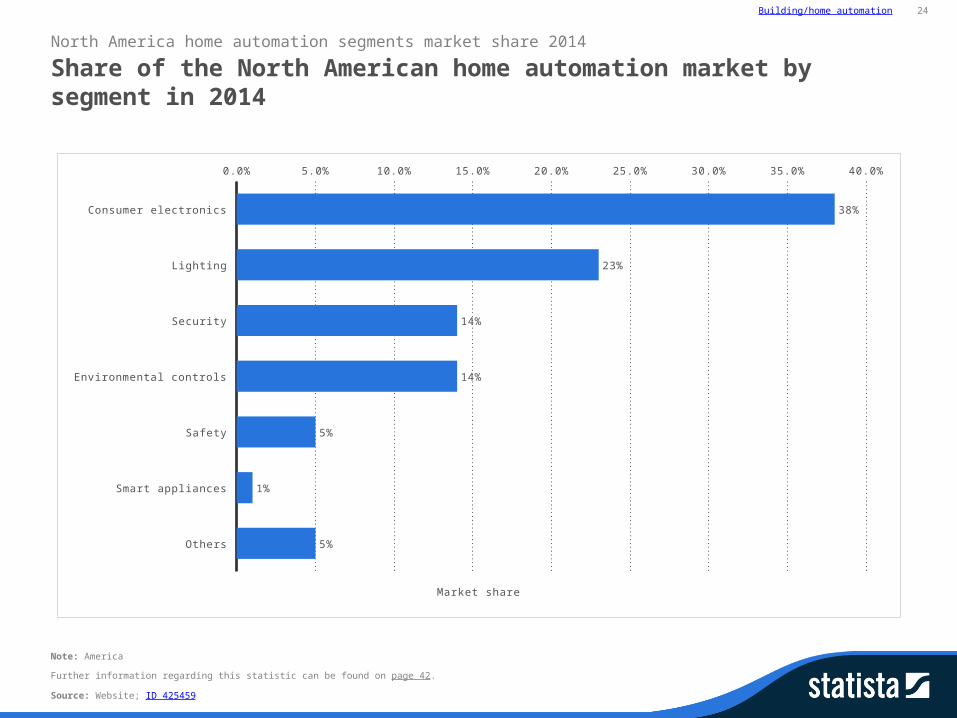
Share of the North American home automation market by segment in 2014
North America home automation segments market share 2014
Note: America
Source: Website; ID 425459
Consumer electronics
Lighting
Security
Environmental controls
Safety
Smart appliances
Others
0.0% 5.0% 10.0% 15.0% 20.0% 25.0% 30.0% 35.0% 40.0%
38%
23%
14%
14%
5%
1%
5%
Market share

Building/home automation
Further information regarding this statistic can be found on page 43.
25
Installed base of home automation/smart home systems in Europe from 2012 to 2019 (in millions)
Installed base of smart home systems in Europe 2012-2019
Note:
Source: PR Newswire; ID 286815
2012 2013 2014 2017 2019
0
5
10
15
20
25
30
35
1.061.75
3.3
17.4
29.7
Mill
ion
s

ReferencesSmart homes - Statista Dossier

References 27
The Internet of Things (IoT)* units installed base by category from 2013 to 2020 (in millions)
Source and methodology information
Source Gartner
Conducted by Gartner
Survey period 2013
Region Worldwide
Number of respondents n.a.
Age group n.a.
Special characteristics n.a.
Published by Gartner
Publication date November 2014
Original source gartner.com
Website URL http://www.statista.com/statistics/370350/internet-of-things-installed-base-by-category/
IoT installed based by category 2013-2020
Notes:
* The IoT is the network of dedicated physical objects (things) that contain embedded technology to sense or interact with their internal state or external environment. The IoT comprises an ecosystem that includes things, communication, applications and data analysis.
** Forecast
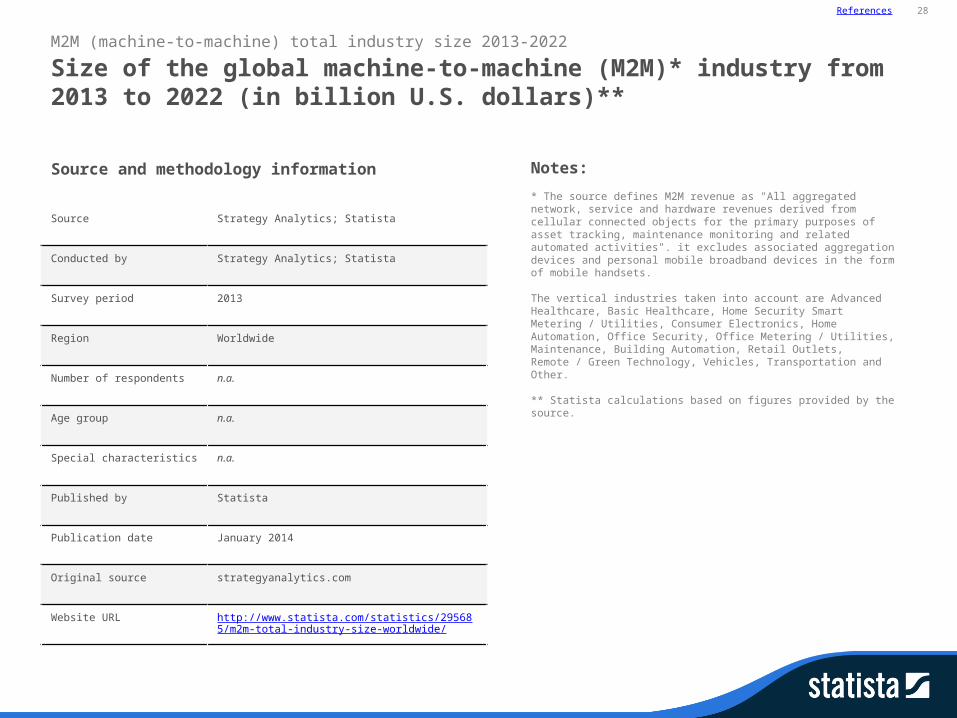
References 28
Size of the global machine-to-machine (M2M)* industry from 2013 to 2022 (in billion U.S. dollars)**
Source and methodology information
Source Strategy Analytics; Statista
Conducted by Strategy Analytics; Statista
Survey period 2013
Region Worldwide
Number of respondents n.a.
Age group n.a.
Special characteristics n.a.
Published by Statista
Publication date January 2014
Original source strategyanalytics.com
Website URL http://www.statista.com/statistics/295685/m2m-total-industry-size-worldwide/
M2M (machine-to-machine) total industry size 2013-2022
Notes:
* The source defines M2M revenue as "All aggregated network, service and hardware revenues derived from cellular connected objects for the primary purposes of asset tracking, maintenance monitoring and related automated activities". it excludes associated aggregation devices and personal mobile broadband devices in the form of mobile handsets. The vertical industries taken into account are Advanced Healthcare, Basic Healthcare, Home Security Smart Metering / Utilities, Consumer Electronics, Home Automation, Office Security, Office Metering / Utilities, Maintenance, Building Automation, Retail Outlets, Remote / Green Technology, Vehicles, Transportation and Other. ** Statista calculations based on figures provided by the source.
References 29
Total number of global M2M (machine-to-machine) connections* from 2010 to 2013 (in millions)
Source and methodology information
Source GSMA Intelligence
Conducted by GSMA Intelligence
Survey period 2010 to 2013
Region Worldwide
Number of respondents n.a.
Age group n.a.
Special characteristics n.a.
Published by GSMA Intelligence
Publication date February 2014
Original source From concept to delivery: the M2M market today, page 9
Website URL http://www.statista.com/statistics/295728/m2m-total-number-of-connections-worldwide/
M2M (machine-to-machine) total number of connections worldwide 2010-2013
Notes:
* The source defines M2M connections as follows: "A unique SIM card registered on the mobile network at the end of the period, enabling mobile data transmissions between machines. It excludes computing devices in consumer electronics such as smartphones, dongles, tablets, e-readers, routers, and hotspots.
References 30
Share of global M2M (machine-to-machine) connections by region from 2010 to 2013*
Source and methodology information
Source GSMA Intelligence
Conducted by GSMA Intelligence
Survey period 2010 to 2013
Region Worldwide
Number of respondents n.a.
Age group n.a.
Special characteristics n.a.
Published by GSMA Intelligence
Publication date February 2014
Original source From concept to delivery: the M2M market today, page 9
Website URL http://www.statista.com/statistics/295742/m2m-connections-worldwide-regional-breakdown/
M2M (machine-to-machine) connections worldwide 2010-2013, by region
Notes:
* The source defines M2M connections as follows: "A unique SIM card registered on the mobile network at the end of the period, enabling mobile data transmissions between machines. It excludes computing devices in consumer electronics such as smartphones, dongles, tablets, e-readers, routers, and hotspots."

References 31
Installed base of connected things within smart cities from 2015 to 2017 (in billions)
Source and methodology information
Source Gartner
Conducted by Gartner
Survey period 2015
Region Worldwide
Number of respondents n.a.
Age group n.a.
Special characteristics n.a.
Published by Gartner
Publication date March 2015
Original source gartner.com
Website URL http://www.statista.com/statistics/422886/smart-cities-connected-things-installed-base/
Smart cities total installed base of connected things 2015-2017
Notes:
* Forecast
References 32
Total market value of the global smart homes market in 2014 and 2020 (in billion U.S. dollars)
Source and methodology information
Source MarketsandMarkets; PR Newswire
Conducted by MarketsandMarkets
Survey period 2015
Region America
Number of respondents n.a.
Age group n.a.
Special characteristics n.a.
Published by PR Newswire
Publication date February 2015
Original source prnewswire.com
Website URL http://www.statista.com/statistics/420755/global-smart-homes-market-value/
Revenue of the smart homes market worldwide 2014 and 2020
Notes:
n.a.
References 33
Estimated value of the North American smart home market from 2012 to 2017 (in billion U.S. dollars)*
Source and methodology information
Source Berg Insight
Conducted by Statista; Berg Insight
Survey period 2013
Region America
Number of respondents n.a.
Age group n.a.
Special characteristics n.a.
Published by Berg Insight
Publication date November 2013
Original source berginsight.com
Website URL http://www.statista.com/statistics/296113/north-america-smart-home-market-revenue/
Smart home market revenue in North America 2012-2017
Notes:
* Statista calculations based on figures provided by the source. Includes revenue from hardware, services and installation.
According to the source smart home systems can be grouped into six primary categories: energy management and climate control systems, home appliances, healthcare and assisted living systems, security and access control systems, audio-visual and entertainment systems and lighting, window and appliance control systems.

References 34
Projected revenue: Americas smart homes market from 2013 to 2020 (in billion U.S. dollars)*
Source and methodology information
Source MarketsandMarkets
Conducted by Statista; MarketsandMarkets
Survey period 2013
Region America
Number of respondents n.a.
Age group n.a.
Special characteristics n.a.
Published by MarketsandMarkets
Publication date December 2013
Original source marketsandmarkets.com
Website URL http://www.statista.com/statistics/296082/the-americas-smart-home-market-revenue/
Smart homes market revenue in the Americas 2013-2020
Notes:
* Statista calculations based on figures provided by the source.
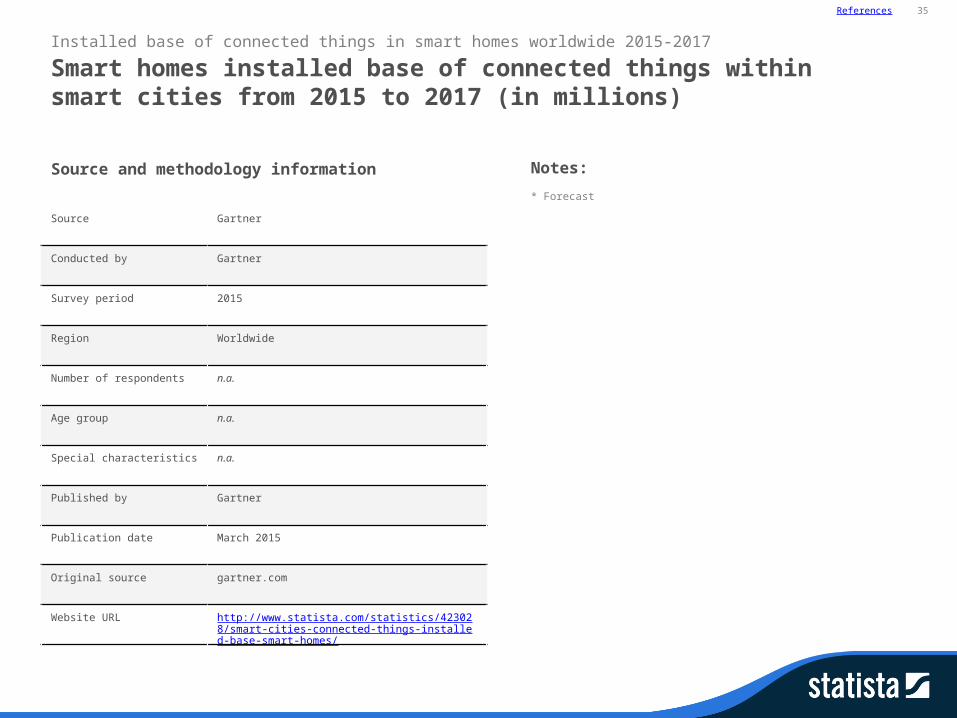
References 35
Smart homes installed base of connected things within smart cities from 2015 to 2017 (in millions)
Source and methodology information
Source Gartner
Conducted by Gartner
Survey period 2015
Region Worldwide
Number of respondents n.a.
Age group n.a.
Special characteristics n.a.
Published by Gartner
Publication date March 2015
Original source gartner.com
Website URL http://www.statista.com/statistics/423028/smart-cities-connected-things-installed-base-smart-homes/
Installed base of connected things in smart homes worldwide 2015-2017
Notes:
* Forecast
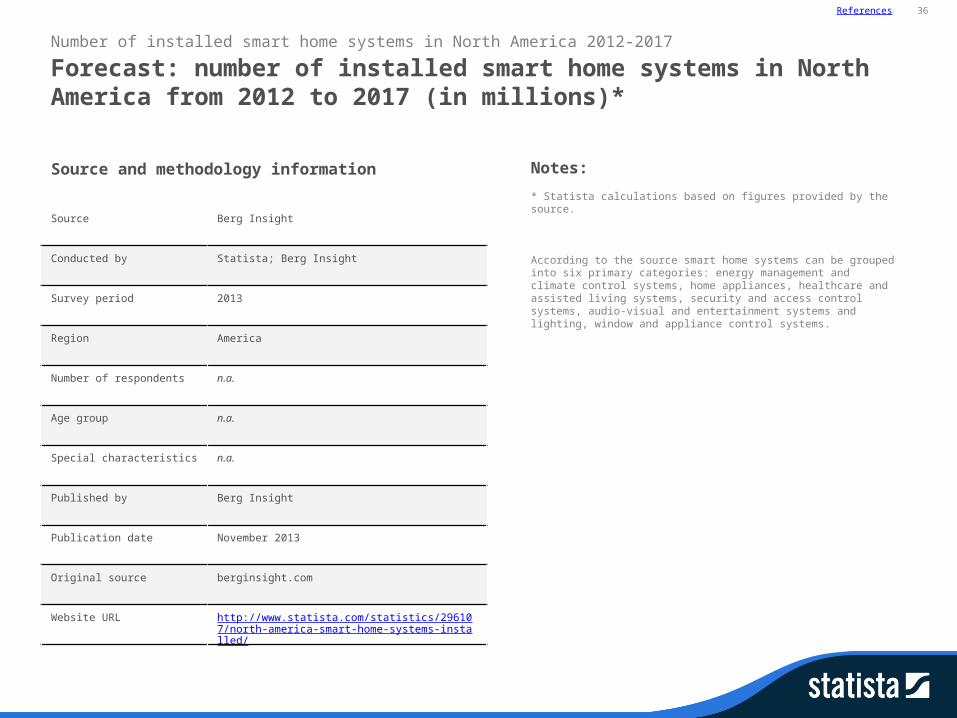
References 36
Forecast: number of installed smart home systems in North America from 2012 to 2017 (in millions)*
Source and methodology information
Source Berg Insight
Conducted by Statista; Berg Insight
Survey period 2013
Region America
Number of respondents n.a.
Age group n.a.
Special characteristics n.a.
Published by Berg Insight
Publication date November 2013
Original source berginsight.com
Website URL http://www.statista.com/statistics/296107/north-america-smart-home-systems-installed/
Number of installed smart home systems in North America 2012-2017
Notes:
* Statista calculations based on figures provided by the source.
According to the source smart home systems can be grouped into six primary categories: energy management and climate control systems, home appliances, healthcare and assisted living systems, security and access control systems, audio-visual and entertainment systems and lighting, window and appliance control systems.

References 37
Number of installed smart home systems in North America in 2012 and 2014 (in millions)
Source and methodology information
Source Berg Insight
Conducted by Statista; Berg Insight
Survey period 2012 to 2014
Region America
Number of respondents n.a.
Age group n.a.
Special characteristics n.a.
Published by Berg Insight
Publication date December 2014
Original source berginsight.com
Website URL http://www.statista.com/statistics/296096/north-america-smart-home-systems-installed/
Installed base of smart home systems in North America 2014
Notes:
* For example: climate control or security systems.
According to the source smart home systems can be grouped into six primary categories: energy management and climate control systems, home appliances, healthcare and assisted living systems, security and access control systems, audio-visual and entertainment systems and lighting, window and appliance control systems.

References 38
Installed base of home automation/smart home systems in the United States from 2012 to 2017 (in millions)
Source and methodology information
Source PR Newswire
Conducted by PR Newswire
Survey period 2012 to 2014
Region United States
Number of respondents n.a.
Age group n.a.
Special characteristics n.a.
Published by PR Newswire
Publication date January 2015
Original source prnewswire.com
Website URL http://www.statista.com/statistics/286813/installed-base-of-smart-home-systems-us/
Installed base of smart home systems in North America 2012-2017
Notes:
n.a.

References 39
Installed base of home automation/smart home systems in Europe from 2012 to 2019 (in millions)
Source and methodology information
Source PR Newswire
Conducted by PR Newswire
Survey period 2012 to 2014
Region Europe
Number of respondents n.a.
Age group n.a.
Special characteristics n.a.
Published by PR Newswire
Publication date January 2015
Original source prnewswire.com
Website URL http://www.statista.com/statistics/286815/smart-home-systems-installed-in-europe/
Installed base of smart home systems in Europe 2012-2019
Notes:
n.a.
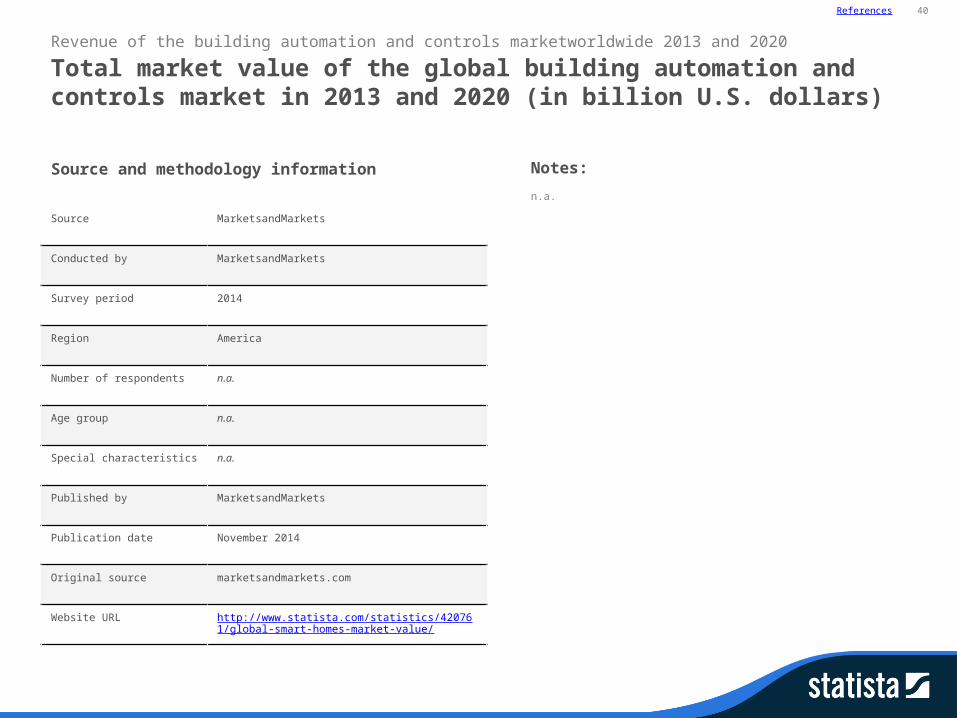
References 40
Total market value of the global building automation and controls market in 2013 and 2020 (in billion U.S. dollars)
Source and methodology information
Source MarketsandMarkets
Conducted by MarketsandMarkets
Survey period 2014
Region America
Number of respondents n.a.
Age group n.a.
Special characteristics n.a.
Published by MarketsandMarkets
Publication date November 2014
Original source marketsandmarkets.com
Website URL http://www.statista.com/statistics/420761/global-smart-homes-market-value/
Revenue of the building automation and controls marketworldwide 2013 and 2020
Notes:
n.a.

References 41
Installed base of home automation/smart home systems in the United States from 2012 to 2017 (in millions)
Source and methodology information
Source PR Newswire
Conducted by PR Newswire
Survey period 2012 to 2014
Region United States
Number of respondents n.a.
Age group n.a.
Special characteristics n.a.
Published by PR Newswire
Publication date January 2015
Original source prnewswire.com
Website URL http://www.statista.com/statistics/286813/installed-base-of-smart-home-systems-us/
Installed base of smart home systems in North America 2012-2017
Notes:
n.a.
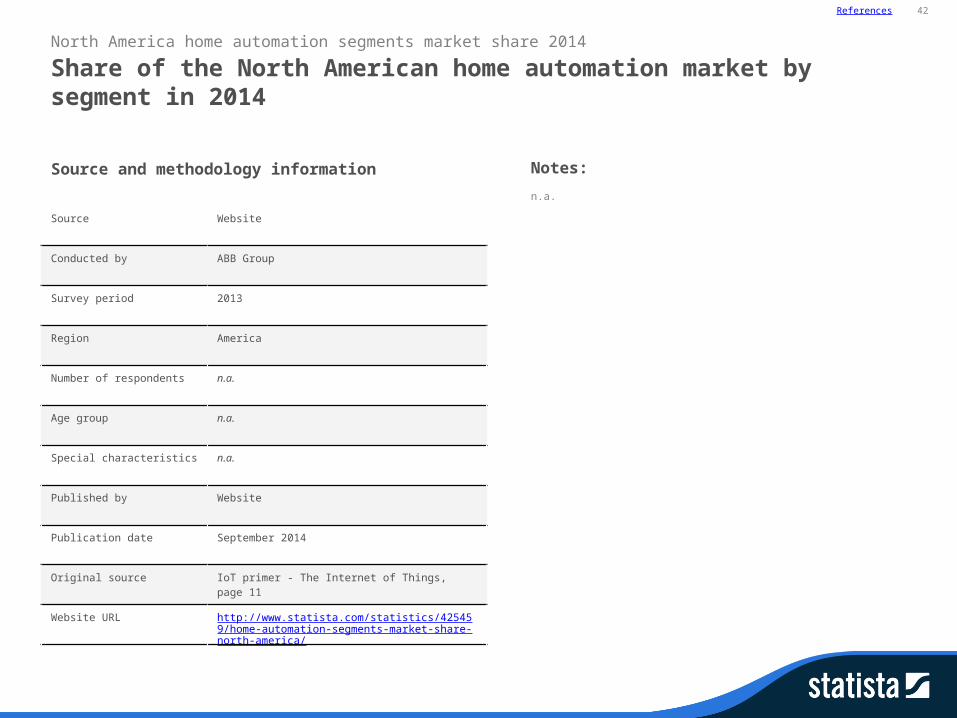
References 42
Share of the North American home automation market by segment in 2014
Source and methodology information
Source Website
Conducted by ABB Group
Survey period 2013
Region America
Number of respondents n.a.
Age group n.a.
Special characteristics n.a.
Published by Website
Publication date September 2014
Original source IoT primer - The Internet of Things, page 11
Website URL http://www.statista.com/statistics/425459/home-automation-segments-market-share-north-america/
North America home automation segments market share 2014
Notes:
n.a.

References 43
Installed base of home automation/smart home systems in Europe from 2012 to 2019 (in millions)
Source and methodology information
Source PR Newswire
Conducted by PR Newswire
Survey period 2012 to 2014
Region Europe
Number of respondents n.a.
Age group n.a.
Special characteristics n.a.
Published by PR Newswire
Publication date January 2015
Original source prnewswire.com
Website URL http://www.statista.com/statistics/286815/smart-home-systems-installed-in-europe/
Installed base of smart home systems in Europe 2012-2019
Notes:
n.a.