Smart Eco-Water Use
18
Demonstration Project Team Registration Number: D01 Smart Eco-Water Use: Towards a Climate-Resilient Campus Student Members Department of Civil and Environmental Engineering Hydraulic Eng. Linlong Bian (Team Lead); Vivek Verma Mechanical Eng. Sumit R. Zanje; Zeda Yin Civil Engineering Dogukan Ozecik Department of Enterprise and Logistics Engineering Engineering Mgmt. Jianwei Li Department of Architecture G.I. Design Jennyfer Hernandez; Alejandro Loayza Info. Visualization Ligia A. Filgueiras; David S. Diez Lead Faculty Advisor Dr. Arturo S. Leon Dept. of Civil and Environmental. Eng. Additional Advisors Dr. Biayna Bogosian Department of Architecture Nicholas Ogle College of Arts, Sciences & Education FIU Facilities Coordinator Stuart M. Grant Department of Facilities Planning ABSTRACT Florida International University (FIU), located in Miami-Dade County, has two campuses and an Engineering Center (EC) that rely on evaporative cooling towers and central chillers to maintain temperature and humidity inside buildings. From July 2017 to June 2020, the FIU EC used over 14 million gallons of utility-supplied potable water per year to make up for evaporative cooling losses in the campus central chiller plant with a cost of over $130,000 annually. Water is sometimes a limited resource, and the Water and Sewer Department (MD-WASD) promotes water conservation as a core ethic. MD-WASD has implemented water restrictions many times in past decades, with some permanent restrictions enforced year-round, as all area water is supplied by wells in the Biscayne Aquifer, which is being adversely affected by saltwater intrusion from population-driven pumping drawdown and sea-level rise. Our project proposes using remotely operated and self- cleaning rainwater harvesting systems to capture rainwater from solar panel canopies and green infrastructures such as green roofs and green facades to reduce demand for potable water and electricity at the EC while also improving the campus aesthetics. The project has multiple benefits, including flooding reduction during heavy rainfall and promoting carbon sequestration by using green infrastructures. This project and other EC components will showcase alternative energy and climate-resilience elements for tours by K-12 and college students on-campus and use augmented reality demonstrations and interactive activities at off-campus and virtual community events. Findings are transferable to commercial, institutional and industrial buildings relying on chilled water plants for cooling. 1| Page
Transcript of Smart Eco-Water Use

Demonstration Project Team Registration Number D01
Smart Eco-Water Use Towards a Climate-Resilient Campus
Student Members Department of Civil and Environmental Engineering Hydraulic Eng Linlong Bian (Team Lead) Vivek Verma Mechanical Eng Sumit R Zanje Zeda Yin Civil Engineering Dogukan Ozecik Department of Enterprise and Logistics Engineering Engineering Mgmt Jianwei Li Department of Architecture GI Design Jennyfer Hernandez Alejandro Loayza Info Visualization Ligia A Filgueiras David S Diez
Lead Faculty Advisor Dr Arturo S Leon Dept of Civil and Environmental Eng
Additional Advisors Dr Biayna Bogosian Department of Architecture Nicholas Ogle College of Arts Sciences amp Education
FIU Facilities Coordinator Stuart M Grant Department of Facilities Planning
ABSTRACT Florida International University (FIU) located in Miami-Dade County has two campuses and an Engineering Center (EC) that rely on evaporative cooling towers and central chillers to maintain temperature and humidity inside buildings From July 2017 to June 2020 the FIU EC used over 14 million gallons of utility-supplied potable water per year to make up for evaporative cooling losses in the campus central chiller plant with a cost of over $130000 annually Water is sometimes a limited resource and theWater and Sewer Department (MD-WASD) promoteswater conservation as a core ethic MD-WASD has implemented water restrictions many times in past decades with some permanent restrictions enforced year-round as all area water is supplied by wells in the Biscayne Aquifer which is being adversely affected by saltwater intrusion from population-driven pumping drawdown and sea-level rise Our project proposes using remotely operated and self-cleaning rainwater harvesting systems to capture rainwater from solar panel canopies and green infrastructures such as green roofs and green facades to reduce demand for potable water and electricity at the EC while also improving the campus aesthetics The project has multiple benefits including flooding reduction during heavy rainfall and promoting carbon sequestration by using green infrastructures This project and other EC components will showcase alternative energy and climate-resilience elements for tours by K-12 and college students on-campus and use augmented reality demonstrations and interactive activities at off-campus and virtual community events Findings are transferable to commercial institutional and industrial buildings relying on chilled water plants for cooling
1 | P a g e
INTRODUCTION As demands for resources increase worldwide large educational institutions like colleges and universities need to adopt forward-thinking solutions to reduce the use of electricity and potable water to minimize costs and promote sustainability practices Rainwater collected from roofs can be a good alternative water source that can reduce the demand for precious potable water Building roofs can provide the catchment surface for rainwater collection and implementation of rainwater harvesting systems (RHS) After working with the FIU Facilities Department our team learned that the evaporative cooling towers located at the FIU consume more potable water than any other type of use at the university Evaporative cooling towers and central chillers play a vital role in removing heat from large commercial institutional and industrial buildings as they are far more efficient than air-cooled chillers However water losses from evaporative cooling in the towers increase the concentration of minerals in the water system loop and scaling occurs decreasing the heat exchanges effectiveness and damaging equipment unless the mineral concentration is controlled Freshwater must be added to the cooling tower water system loop to make up for evaporative losses and part of the water in the cooling tower needs to be drained to decrease the concentration of minerals
This demonstration projects top three objectives are to (1) use rainwater for cooling tower water makeup reducing stormwater runoff on campus (2) implement smart green roofs and green facades to mitigate the heat island effect and promote carbon sequestration and (3) decrease the temperature inside the building to save the campus electricity usage Also the smart green infrastructures will aid in public outreach and education providing community learning opportunities This projects implementation is expected to significantly reduce campus demand for potable water and electricity without compromising the cooling towers performance and the comfortable temperature inside the buildings
SITE CHALLENGES AND OPPORTUNITIES Figure 1 shows the implementation area of the proposed Rainworks demonstration project The proposed area includes four solar panel canopies with a total surface area of 195 acres (84942 ft2) and the FIU EC OperationsUtility (OU) building with a total occupied area of 057 acres The total surface area of the proposed green infrastructures including the FIU EC OU building and the four solar panel canopies is about 4 acres which is below the 15 acres maximum required for the Rainworks demonstration category
The FIU EC is located in Miami-Dade County Florida According to the US Geological Survey [1] the Miami-Dade County location of the FIU EC can be characterized by distinct wet seasons high rainfall temperature and evaporation rates The average temperature between 1981 and 2010 was 769 degF and ranged from a low of 598 degF in January to a high of 907 degF in August Average relative humidity in Miami ranges from a low of 67 in April to average highs of about 78 in September and October Air conditioning is required 247 year-round for thermal comfort and for the control of indoor humidity which must be maintained below 60 to avoid the growth of mold and mildew According to the FIU Facilities Department water supplied to the cooling tower was 1462 million gallons between July 2017 and June 2018 1405 million gallons between July 2018
2 | P a g e
and June 2019 and 1435 million gallons between July 2019 and June 2020 The corresponding water usage costs were $129468 $131529 and $138156 respectively Figure 2 shows that the rainy season coincides with the peak cooling season creating the opportunity to use rainwater to reduce potable water consumption by the cooling system
Figure 1 Schematic of the implementation area on the FIU EC for the proposed Rainworks demonstration project
RAINWATER QUANTITY ANALYSIS The daily rainfall records between 1948 and 2017 for the Miami International Airport weather station were used in the rainfall analysis This station was used because it is the closest to the FIU EC (336 mi)
Figure 2 Cooling tower water makeup vs average monthly rainfall
According to the Food and Agriculture Organization (FAO) [2] the classification criteria to determine the hydrological year depends on the exceedance probability in a year The hydrological year is classified as dry normal and wet when the exceedance probability in a year is 80 50 and 20 respectively The frequency analysis steps are not shown herein due to space limitations
A rainfall-runoff model is developed based on SWMM 51 to estimate the rainwater volumes harvested from the solar panel canopies The rainfall hyetographs were developed for the three
3 | P a g e
hydrological year conditions These hyetographs are used as input data in the SWMMmodel Moreover the Rational Method (RM) is used for comparison purposes
Figure 3 Proportion of rainwater to total cooling tower water makeup
Table 1 presents the rainwater volumes that would be harvested from the solar panel canopies for the three hydrological year conditions Since the results obtained with the Rational method and SWMM are within 5 the results calculated from SWMMwere used for the analysis The results in Table 1 show that 17 to 24 (Figure 3) of the total cooling tower water makeup can be satisfied by the collected rainwater Such a significant amount of rainwater is worth harvesting to replace part of the potable water used for the cooling tower water makeup By collecting rainwater the annual reduction in runoff volume is expected to be between 257 and 358 million gallons (see Table 1)
Table 1 Rainwater volumes harvested from the solar panel canopies for the three hydrological year conditions
Year Type RM (MGyr) SWMM (MGyr)
Difference between RM and SWMM
Dry Year 262 257 2
Normal Year 324 313 3 Wet Year 374 358 4
1 (MGyr) indicates million gallons per year 2 RM indicates the Rational Method 3 Difference between models is calculated by (RM-SWMM)SWMM
RAINWATER QUALITY ANALYSIS Rainwater samples were collected directly from the surface runoff of the solar panel canopies Since the first flush that runs off the solar panel canopies has different water quality from clean rainwater our team decided to test these two different water types According to the geometric parameters of the solar panel canopies the time for the first flush is calculated as shown below by assuming sheet flow condition on the rooftop of the solar panel canopies [3]
0007()
= = Eq 1 (amp)(
where is travel time (hr) is Mannings roughness coefficient equal to 0011 (smooth surface) is flow length (ft) equal to 55 feet amp is 2-year24-hour rainfall (in) equal to 47 inches is the surface slope (ftft) equal to 010 The concentration time is 20 seconds The area of a solar panel canopy is 21725 square feet Based on the rational method the first flush volume is around 15 gallons A runoff depth between 00079 to 0079 inches is recommended for the estimation of the first flush volume [4] Since the surface of the solar panel canopies is clean the runoff depth of
4 | P a g e
00079 inches is selected The calculated first flush volume is equal to 106 gallons which is 7 times the result calculated by the rational method Therefore 140 seconds are recommended to separate the first flush and clean rainwater and it is also used for the pre-set system timer for the remotely operated and self-cleaning rainwater tank system
Table 2 shows our laboratory results for the water quality parameters for tap water and rainwater collected from the existing solar panel canopies and cooling towers Column 7 of Table 2 shows the recommended ranges for target water quality parameters for cooling towers [5] [6] The results in Table 2 show that the collected rainwater has significantly lower concentrations of TDS calcium and alkalinity than tap water and the water in the existing cooling tower
Table 2 Laboratory results for the water quality parameters for tap water and rainwater collected from the existing solar panel canopies and cooling towers
Parameter Unit Tap water
Solar Paneld1
Solar Panel d2
Cooling towere
Recmd for CTf
of sample
Method
TSS mgL
mgL
-
-
76 a1
(plusmn46) 23 a1
(plusmn8)
-
10 (plusmn5)
30-50 NA
NA
7
7
Standard Methodsg
TDSb mgL 135 (plusmn6)
5 (plusmn6)
8 (plusmn8) 622-694 lt1000 7 Machineh
pH -745 (plusmn03)
65 (plusmn03)
69 (plusmn05)
794-884
6-9 7 Machinei
Calcium Hardnessc1
mgL 405 (plusmn31) lt10g lt10g 250-428 30-750 7 HACH8204
Total Alkalinityc2
mgL 656 (plusmn60) lt10g lt10g 204-399 lt500 7 HACH8203
a1 Total suspended solids measured using the rainwater collected from the first flash a2 Total suspended solids measured using the rainwater collected after the first flash a3 Stand method 2540D Some of the equipment did not use without influencing the results due to the lab equipments limitation b Total dissolved solids via Conductivity readings expressed in micro-Siemens and multiply 06 to convert into TDS c1 c2 Calcium hardness and total alkalinity are measured as CaCO3 d1 The water samples were collected from the solar panel without sand filtration d2 The water samples were collected from the solar panel with sand filtration e The water sample was collected from the cooling tower f The recommended value for cooling tower operation [5] [6] g Stand method 2540D Some of the equipment did not use without influencing the results due to the lab equipments limitation h Brand HoneyForest Model YL-TDS2-A range 0-9990 mgL-1 resolution +- 1 mgL-1 i Brand Thermo Scientific Dual Star pHISEmV Meter Only Model Mfr2115000 resolution0001
According to the rainwater quantity results rainwater supply cannot replace potable water as the sole makeup water source Therefore different blend ratios of sand-filtrated rainwater and tap water were analyzed to ensure the values of the water quality parameters are within the recommended range for cooling towers Three blend ratios (sand-filtrated rainwater tap water) 15 20 and 25 were explored to assess whether the water quality parameters of the blended water are within the recommended ranges for cooling towers Figure 4 shows that the values of the water quality parameters for the three different blends are within the recommended range for the cooling tower as shown in Table 2 Therefore these three blends meet the cooling towers water quality requirements
5 | P a g e
Blends of sand-filtrated rainwatertap water Figure 4 Water quality for different blends of tap and rainwater
RAINWATER HARVESTING SYSTEM DESIGN Remotely Controlled and Self-Cleaning Rainwater Tank System A traditional RHS often requires manual operation and maintenance[7] [8] To overcome these limitations we propose to integrate a remote control technology developed at FIU [9] into a traditional RHS architecture This system is remotely operated and has an automated system for cleaning the sand filter
The architecture of the remotely operated and self-cleaning rainwater tank system (ROSCRTS) is shown in Figure 5 The ROSCRTS can be broadly divided into four layers [11] namely the decision-making system layer Internet communication layer automation control layer and the rainwater tank system (RTS) itself with trigger components
Figure 5 The architecture of the ROSCRTS (only parts of the wired connection is shown in the figure)
Our decision-making system layer is a graphic user interface (GUI) software developed in C This user interface displays the working status of each trigger component and allows a manual or automated operation In the manual mode the user can control the individual components of the system In automated control the operation can be programmed to fulfill a desired set of conditions The Internet communication layer has a virtual private network (VPN) router which uses a cellular network to interface between the decision-making layer and the automation control
6 | P a g e
layer The automation control layer uses the Programmable Logic Controller (PLC) which directly connects to the field hardware The PLC performs a diagnostic of the system by collecting information on the status of the sensors and electrical devices The last layer is the RTS and the trigger components The trigger components consist of water level switches (LS) bilge pumps (BP) and actuated butterfly valves (ABV) which are shown in Figures 5 and 6
Figure 6 Sketch of the remotely operated and self-cleaning rain tank system
As shown in Figure 6 the RTS consists of three tanks The first tank is the pre-filtration tank (PreFT) which is intended for capturing sand and other fine sediments that settle in the tank The second tank is the filtration tank (FT) that is intended to remove suspended solids The third tank is the post-filtration tank (PostFT) that is intended to store the filtrated rainwater The water in the PostFT is used for the evaporative cooling tower makeup and also can be used for backwashing the sand-filtration in the FT
The proposed ROSCRTS has two novel functionalities The first novelty is the automated sand filter cleaning functionality The automated cleaning is achieved by pumping water in the PostFT backward through the filtrationmaterial The biomass and fine sediments attached to the filtration materials will be suspended in the water and flow out throughout the backwash outlet The second novelty is the automated first flush diverter To be specific ABV1 is closed before a rainfall event When rainwater flowing into the first flush diverter submerges LS1 the pre-set system timer (140 sec) starts counting down During this period the first flush flows out of the diverter When the pre-set system timer finishes ABV1 will open and the clean rainwater will flow into the tank
Filtration Material Design and Pretreatment Previous research introduced slow sand filtration to conduct rainwater treatment due to its simplicity efficiency and economy [11] According to the slow sand filtration design criteria [12] the top layer of the filtration material (see Figure 6) should have a depth of 3-feet filled with 035-mm diameter fine sands The medium layer should have a depth of 1-feet filled with 060-mm diameter coarse sands The base layer should have a depth of 1-feet filled with 476-mm diameter gravel According to the slow sand filtration design criteria the water depth above the filter (the
7 | P a g e
supernatant water depth) should be kept between 3 and 5 feet The filter will be cleaned before first use
Filtration Rate Analysis and Rainwater Tank Size Design The size of the FT is calculated by matching the rainwater volume collected from the solar panel canopies with the daily filtrated rainwater volume This can be written as
) = Eq 2
where is the runoff coefficient equal to 098 [13] ) is designed rainfall intensity (47 inches which corresponds to the 2-year 24-hour rainfall) is the rainwater catchment area equal to 195 acres (84942 ft2) q is the filtration rate and is the cross-sectional area of the filtration tank A filtration rate simulation was conducted using the GeoStudio software [14] The conductivity of sand filtrationmaterial was set to 328 times 10( feet per second which corresponds to poor graded fine sands [15]
According to the GeoStudio simulation results when the supernatant water depth is 3 feet the filtration rate ( ) reaches the minimum value which is 523 times 10( cubic feet per second per square feet (4517 feetday) The cross-sectional area of the FT using Equation 2 gives 72241 square feet Therefore the minimum diameter of the FT should be 303 feet After reviewing industrial tank sizes the Model 3303 [16] is selected as FT This tank has a diameter of 32 feet 10 inches a height of 11 feet and a usable volume of 63306 gallons The volume of the sand filtration materials inside the FT is 31680 gallons which is calculated using the cross-sectional area of the FT and a sand filtration thickness of 5 feet According to the rational method the collected rainwater volume is 244000 gallons per day and thus the filtration capacity should exceed 244000 gallons per day Figure 7 shows the GeoStudio simulations for three different supernatant water depths (3 4 5 feet) The simulation results show that the FT can treat between 286286 and 357994 gallons per day The filtration time is between 068 and 085 days (16 to 20 hours)
Figure 7 Filtration rate simulations for three supernatant water depths
The solar panel canopies are about 15 feet tall Therefore the height of PreFTs should not exceed this height Based on the commercially available tanks we propose to use four PreFT tanks with a height of 11 feet for each solar panel canopy Therefore the recommended size for PreFT should
8 | P a g e
be slightly bigger than a quarter of the rainwater volume in FT which is 7920 gallons The recommended PreFT is Model 1203 [16] which has a usable volume of 8371 gallons with a diameter of 11 feet 11 inches and a height of 11 feet Due to the layout of the rain gutter design (see details in Rain Gutter and Downspout Pipe Design) three affiliated PreFTs with storage size equal to a quarter of PreFT are set along the length of each solar panel canopy every 100 feet The recommended industrial size for the affiliated PreFT is Model 603 [16] with a diameter of 5 feet 11 inches and a height of 11 feet The usable volume is 2093 gallons The recommended PostFT is Model 2104 [16] which has a usable volume of 35037 gallons with a diameter of 20 feet 11 inches and a height of 14 feet 8 inches Figure 8 shows the bird view of the entire RHS
Figure 8 RHS around the four solar panel canopies at the FIU EC (The tanks are as per the scale)
Rain Gutter and Downspout Pipe Design According to [17] the design of rain gutters in Miami Dade County should use the 10-year 24-hour rainfall (79 inches) The Soil Conservation Service (SCS) type III rainfall distribution method is recommended for South Florida [3] Figure 9 shows the storm rainfall hyetograph developed using the SCS type III rainfall distribution method As shown in this figure the peak rainfall intensity is 20 inches per hour
Figure 9 10-year 24-hour rainfall hyetograph for EC The length of the existing solar panel canopy parallel to the gutter is close to 400 feet The gutter slope is set to 14 inch per 10 feet to keep the gutter close to the edge of the solar panel canopies [18] The downspout pipe is installed every 100 feet along the length of the solar panel canopies That results in three downspout pipes with their corresponding affiliated PreFTs According to our hydraulic calculations we recommend a
9 | P a g e
downspout pipe having a diameter of 8 inches and a K-type rain gutters [19] with a minimum width of 9 inches and a depth of 5 inches
GREEN INFRASTRUCTURE DESIGN AND ANALYSIS Green roofs and green facades are used in our demonstration project as they are known to mitigate the urban heat-island effect promote carbon sequestration and improve site aesthetics [20] The green infrastructure design also serves as the buildings insulator to decrease temperature and reduce the electric energy used by the air conditioner [21] A major limitation of green infrastructures especially in tropical and subtropical cities like Miami is that they require a significant amount of irrigation water [22] This demonstration project proposes a smart irrigation system with water demands fully satisfied by the collected rainwater
Irrigation for Green Roof and Green Facades The irrigation water demands are determined for a hydrologically dry-year condition which is the worst-case scenario Equation 3 can provide the ratio of green roof area to the total catchment area satisfying zero-irrigation water demands [23]
+ times = Eq 3 ( times + times )
where is the runoff coefficient equal to 098 for rooftops [13] is the design rainfall intensity equal to 50 inches per year (014 inday) for a hydrologically dry-year condition as shown in Table 1 + is the area of green roofs is the total catchment area including is a historic evapotranspiration coefficient (inday) derived for the FIU EC campus which is given in Table 3 [24] and is the plant factor equal to 08 to 09 [23]
Table 3 Historic evapotranspiration for FIU EC [24]
The calculated + ratio is around 050 to 053 Thus 50 of the rooftop of the FIU EC OU building is designed to be occupied with green roofs Therefore 0285 out of 057 acres of the FIU EC OU buildingrsquos rooftop are used to collect rainwater
The irrigation water for green facades is calculated as below [23]
= times times + times 0623 (gal ) Eq 4
The area of the green facades is 015 acres (650 feet long and 10 feet tall) The irrigation demand for green facades is 0182 million gallons per year
10 | P a g e
The 2-year 24-hour rainfall is used to design the irrigation tank Using the rational method an irrigation tank (Model 2703 [16]) having a diameter of 26 feet 10 inches and a height of 11 feet is proposed to fulfill the irrigation needs of the green infrastructures The irrigation tank has a storage volume of 42379 gallons We propose a drip irrigation system for watering the green infrastructures The drip irrigation system supplies water directly onto the plant roots and thus eliminates water losses due to evaporation and runoff compared to sprinkler irrigation
Green Roofs and Green Facades Design Generally green roofs can be classified into two types namely intensive and extensive green roofs Intensive green roofs usually require additional structural reinforcement and drainage systems increasing the technical complexity and associated costs [21] Extensive green roofs are characterized by a shallow depth of the substrate layer and lower weight than intensive ones The main advantages of extensive green roofs are low capital cost and maintenance low water requirements and lower weight [21] To minimize structural support of the FIU EC OU building the extensive type of green roofs was selected for our demonstration project The design tasks can be divided into the roofing system and the green roof vegetation
Figure 10 Green roof and green facade design for the FIU EC OU building
Figure 10 shows the details of the design of the roofing system As shown in Figure 10 the roofing system consists of the following components from bottom to top a 18-inch-thick waterproofing membranemade of Elasto-Plastomeric a 316-inch-thick anti-root barriermade of plywood sheet a 18-inch-thick protection layer made of polystyrene a 14-inch-thick water storage and drainage layer made of the granular materials a filter layer using non-woven geotextiles a 3-inch-thick substrate layer using loamy soil and selected vegetation The weight of the substrate layer varies from 245 ndash 287 lbsft2 [25]
11 | P a g e
Green facades are an exterior wall with planted vegetation mainly used for aesthetic and ecological purposes To create the vertical green facades the vegetation must be of certain characters and the living wall system must be equipped with both soil and water systems [26] The designed living wall system in our project consists of a module-type wall planted with mixed species (evergreen climbing plants and small shrubs)
Vegetation Selection and Introduction Owing to the thin substrate layer of the green roofs and the unique module-type living wall of the green facades only limited types of vegetation can be utilized for the proposed green infrastructures The species selected for the green infrastructures are Wild Sweet Basil Giant Sword Fern Wild Everglades Tomatos Yellow Jasmine and native grass Since these species are native to tropical environments they are expected to adapt and thrive under the harsh conditions of the South Florida climate Additionally these species are adapted to direct sunlight conditions so there will be no need for shading devices to protect them
The Impact of Green Infrastructures on Temperature Inside a Building The ANSYS three-dimensional numerical model is used to investigate the impact of green roofs and green facades on the temperature inside the FIU EC OU building Following [27] the absorptance rate is assumed to be 05 on the canopy 06 on the soil and 07 on structural materials (eg concrete cement) The ambient temperature used in the heat convection is set to be the Miami average temperature of a sunny day in September [28] Figure 11 shows the simulated solar heat flux on the FIU EC OU building at 900 1200 1500 and 1800 hours for September 13th 2020 The simulation results for the above conditions show that solar heat flux achieves a maximum value of 87705 Wm2 at 1316 (116 PM)
Figure 11 Simulated solar heat flux on FIU EC OU building at 900 1200 1500 and 1800 hours
Figure 12 shows the FIU EC OU buildingrsquos interior temperature with and without green infrastructures for 24 hours in September The simulation results show that the green infrastructures reduce the room temperature by an average of 108 degF during a period of 24 hours The maximum temperature difference between a bare concrete building and the building with green infrastructure is 36 degF that occurs at 1320 h The energy savings are computed by using the
12 | P a g e
temperature reduction after adapting green infrastructures The electricity saving at the FIU OU building is 43911 kWh per year after adapting the green roofs and green facades Based on the Miami electricity rate (872 centkWh) [29] the electricity cost savings are calculated to be $3829 per year by green roofs and green facades
Figure 12 FIU EC OU buildingrsquos interior temperature vs time
Heat Island Reduction and Carbon Sequestration from Green Infrastructures The installation of green infrastructure has multiple benefits for the urban environment including heat island reduction and carbon sequestration Taking heat island reduction as an example according to our heat flux simulations before applying the green infrastructure the average sensible heat flux on the bare concrete building with asphalt roofing surface is around 600 Wm2 while after applying green infrastructures its value significantly decreases to about 80 Wm2 From the perspective of carbon sequestration based on [30] and [31] the average vegetation consists of 725 drymatter and 275 moisture and the average carbon content is generally 50 of the treersquos dry total weight The weight of CO2 is determined by the ratio of CO2 to C equal to 4412 = 367 Therefore to determine the weight of carbon sequestered in the tree we multiply the weight of carbon in the tree by 3671 [31] We estimate that 511 lbs of carbon are sequestered each year in our green infrastructure system
PUBLIC OUTREACH AND EDUCATION To increase the impact reach and the likelihood of replication of our demonstration project various education outreach components will be developed and implemented There are various on-campus outreach programs in existence with proven reach and attendance that can be leveraged to include this demonstration project The EC campus hosts an engineering expo annually with over 1600 K-12 students from the surrounding community visiting to experience a multitude of interactive activities related to STEM careers and research Additionally the Wall of Wind hurricane simulator brings classes and community stakeholders to the campus regularly for field trips and tours Not only will the project and its component be added as stops on these visits but the incorporation of augmented reality technology will provide a novel way for K-12 college students and community leaders to experience and understand the benefits of green infrastructure and sustainable building design especially as it relates to rainwater collection and use Figure 13 shows a portion of the green facades displaying an app for public outreach and education By scanning bar codes placed strategically at interest points of the project with smartphones or dedicated tour tablets fascinating educational animations will interact with the real-world green infrastructure environment These AR overlays allow additional information to
13 | P a g e
be presented such as watching carbon sequestration and plant biological function happening in real-time or animations of the inner workings of the rain capture systems accompanied with data displaying up-to-date water and energy savings The addition of AR gameplay mechanics will increase engagement further increasing the education effectiveness for K-12 and college students
Figure 13 Green facades displaying an app for public outreach and education
To engage the community off-campus the team will develop an interactive activity based on rainwater collection and filtration techniques paired with 360deg videos of the project displayed on VR goggles to be used in existing university education outreach programs This includes community green fairs and hands-on STEM learning days Family STEM festivals hosted at schools and libraries as well as publishing FIUHome articles a free resource available online
This multi-pronged approach aims to increase public awareness of the importance of water resource conservation inspire the next generation of problem solvers by presenting a concrete example of solutions created through STEM learning and to encourage the use of green infrastructure in the community and beyond
PROJECT PHASING PLAN This project will be divided into 5 construction phases namely Preparation Rainwater Harvesting System Green Roofs Green Facades and Commissioning The construction period was estimated to be 183 working days from May 3rd 2021 to Jan 12th 2022 Please refer to Table 4 for the detailed project phasing plan
FINANCING AND CONSTRUCTION ANDMAINTENANCE COST Construction Cost The total construction cost of our proposed project is $468116 The calculations relied mostly on the unit price of materials displayed on the HOME DEPOTwebsite and the quotations provided by
14 | P a g e
suppliers Also we used information on similar local engineering practices and current labor unit prices Please refer to Table 5 for the detailed construction costs
Maintenance Activities and Cost The maintenance cost comprises three parts namely Rainwater Harvesting System Green Roofs and Green Facades Typical maintenance activities include removal of debris inspection and repair of components replacement of filtration materials pruning fertilization and pest and disease management Please refer to Table 6 for detailed maintenance activities and costs
Cost-benefit Analysis and Funding sources Table 7 presents a summary of the proposed strategies the estimated costs for construction and maintenance the anticipated economic benefits and environmental benefits as well as the possibilities for funding As shown in Table 7 the initial investment for the RHS and the green infrastructures is $468116 and the annual maintenance cost is about $15825 The direct economic benefit is estimated to be $31450 per year with a return on investment (ROI) of 334 From the perspective of sustainable development this project brings benefits that are not readily quantifiable such as reducing the probability of ponding decreasing greenhouse gas emissions increasing carbon sequestration and reducing the urban heat island effect The most important benefit may be improving campus aesthetics which has been shown by many studies to promote recruitment and enhance academic success
Due to the multiple benefits provided by the proposed strategies many opportunities for loans and grant funding are available For example Governor DeSantis and the Florida Legislature approved $40 million in statewide funding for developing water supply and water resource development projects The application is open each year through the South Florida Water Management District (SFWMD) Coop Funding Our team is contacting the SFWMD to establish a partnership for our demonstration project Also the Clean Water State Revolving Fund Loan Program (CWSRF) provides low-interest loans to design and build water pollution control facilities Floridarsquos Section 319 Grant Program is another funding option that aims at reducing nonpoint sources of pollution Eligible activities include demonstration and evaluation of urban and agricultural stormwater best management practices stormwater retrofits and public education
Table 4 Project phasing plan
15 | P a g e
Table 5 Construction Cost Summary
No Alternative Unit Price Quantity Total Cost
100 Rainwater Harvesting System $ 265533 101 Gutters $ 1147 ft 1600 ft $ 18352
102 Gutter Mesh (Optional) $ 700 - 1000 ft 1600 ft $ 15242
103 Gutter Outlets $ 962 unit 16 unit $ 15392
104 Downspout $ 1128 10 ft 100 ft $ 113
105 Tank Inlet Screens $ 4408900 unit 16 unit $ 192
106 Pre FT (Model 1203)amp Base $ 660000 unit 4 unit $ 26400
107 AffiliatePreFT (Model 603) $ 240000 unit 12 unit $ 28800
108 FT (Model 3303)amp Base $ 3100000 unit 1 unit $ 31000
109 Post FT (Model 2104)amp Base $ 2000000 unit 1 unit $ 20000
110 Pump $ 15000 - 20000 unit 19 unit $ 3325
111 Filtration Media 476mm gravel $ 2000 - 5000 ftsup3 847 ftsup3 $ 25410
112 Filtration Media 035mm sand $ 2000 - 5000 ftsup3 2541 ftsup3 $ 50820
113 Filtration Media 060mm sand $ 2000 - 5000 ftsup3 847 ftsup3 $ 16940
114 Level Switch $ 1885 unit 12 unit $ 226
115 Valve $ 40000-45000 unit 12 unit $ 5100
116 Water Pipesamp Fittings (2 inch) $ 248 ft 1660 ft $ 4117
117 Water Pipesamp Fittings (4 inch) $ 463 ft 580 ft $ 1343
118 StorageTank $ 1800000 unit 1 unit $ 18000
200 Green Roof (12415 ftsup2) $ 148909 201 WaterproofingMembrane (18 inch) $ 287 ftsup2 1241460 ftsup2 $ 35630
202 Anti-root Barrier (316 inch plywood) $ 180 ftsup2 1241460 ftsup2 $ 22346
203 Protection Layer (18 inch polystyrene) $ 180 - 300 ftsup2 1241460 ftsup2 $ 24829
204 Drainage Layer (14 inch) $ 075 ftsup2 1241460 ftsup2 $ 9311
205 Filter Layer (non-woven geotextiles) $ 008 ftsup2 1241460 ftsup2 $ 993
206 Substrate (3 inch Loamy Soil) $ 500 - 1000 ftsup3 310365 ftsup3 $ 23184
207 Vegetation (Asiatic Jasmine) $ 107 plant 650000 plant $ 6955
208 Irrigation Tank (Model 2703) $ 25600 unit 1 unit $ 25600
209 Drip Irrigation Tubing $ 753 100 ft 800 ft $ 6024
300 Green Facades (65010 feet) $ 53674 301 Trellis System $ 687 ftsup2 650000 ftsup2 $ 44655
302 Drip Irrigation Tubing $ 753 100 ft 3900 ft $ 294
303 Water Pump $ 15000-20000 unit 7 unit $ 1225
304 Substrate and planter boxes $ 2000 unit 260 unit $ 5200
305 Green climbing $ 050-500 plant 1000 plant $ 2300
Total Cost $ 468116
16 | P a g e
Table 6 Maintenance Cost Summary Strategy Activity Schedule Costtime Costyear
Rainwater
Harvesting
System
Total cost onmaintenance per year $ 12430 Remove leaves and debris from gutters and downspouts Semi-annually $ 250 $ 500
Inspect and clean prescreening devices Quarterly $ 140 $ 560
Inspect and clean storage tank lids Annually $ 140 $ 140
Inspect and repair any clogging Annually $ 280 $ 280
Inspect tank and removedeposed sediment Quarterly $ 200 $ 800
Inspect electronic components of RHS (eg BP ABV etc) Every 3 years $ 1000 $ 333
Replace the filter media in FT Every 10 years $ 93170 $ 9317
Replacedamaged or defective system components As needed $ 500 $ 500
Green
Infrastructure
(Green roof
and
Green facades)
Total cost onmaintenance per year $ 3395 Pruning and weeding Semi-annually $ 480 $ 960
Fertilization As needed $ 660 $ 660
Spring cleanup As needed $ 525 $ 525
Maintenance inspection Monthly $ 70 $ 840
Replacement of planter beds and plants As needed $ 110 $ 110
Soil test to manage soil for maximum plant vigor while also
minimizing nutrient leaching Aannually $ 300 $ 300
Table 7 Summary of Costs Benefits and Funding Sources
Strategy Estimated Cost Anticipated Outcomes
FundingOptions Constructio n
Annual Maintenance
Direct Economic Benefit Environmental Benefit Social Value
Rainwater Harvesting System $265533 $12430
Save17-24 of potablewater used for cooling tower every year saving $27621
Maximizewater use efficiency reduce stormwater runoff from a property reducea storms peak flow volumeand velocity in local creeks and rivers
Flood reduction Saveprecious water resources Irrigation supply
FIU SFWMD Coop Funding CleanWater StateRevolving Fund (SRF) Loan Program Floridas Section 319 Grant Program
Green Roof $148909
$3395
Annual electricity savings of 43911 kWh and electricity cost savings of $3829
Adjust microclimates mitigate theurban heat-island effect reduces greenhousegas emissions improveair quality and provideurban amenities
Beautification Promote the recruitment and academic success
FIU SFWMD Coop Funding FloridaDEP Nonpoint Source Funds Environmental Finance Center Network (EFCN) Green Facades $53674
Total $468116 $15825 $31450
REFERENCES [1] J D Hughes and J T White ldquoHydrologic conditions in urban Miami-Dade County Florida and the effect of
groundwater pumpage and increased sea level on canal leakage and regional groundwater flowrdquo US Geol Surv no Scientific Investigations Report 2014-5162 p 175 2014 [Online] Available httpspubsusgsgovsir20145162
[2] FAO ldquoWorld-wide agroclimatic databaserdquo Environ Nat Resour Work p 5 2000 [3] USDA ldquoUrban Hydrology for Small Watershed TR-55rdquo Soil Conserv no Technical Release 55 (TR-55) p 164 1986
[Online] Available httpscholargooglecomscholarhl=enampbtnG=Searchampq=intitleUrban+Hydrology+for+Small+watersheds1
[4] K C Doyle ldquoSizing the first flush and its effect on the storage-reliability-yield behavior of rainwater harvesting in Rwandardquo Citeseer 2008
[5] C Towers ldquoWhite Paper ndash Monitoring Water Quality for Cooling Towers Sanitizationrdquo [6] X Feng ldquoDesign Experience of Roof Rainwater Recycled as Makeup Water for Cooling Towerrdquo Urban Environ Urban
17 | P a g e
Ecol vol 21 no 6 pp 40ndash42 2008 [7] E S Costello ldquoUtilization of Rainwater as a Supplementary Water Source for Cooling Tower Makeup A Sustainability
Strategy for Potable Water Use Reductionrdquo 2012 [8] J Mun and M Han ldquoDesign and operational parameters of a rooftop rainwater harvesting system Definition
sensitivity and verificationrdquo J Environ Manage vol 93 no 1 pp 147ndash153 2012 [9] A S Leon ldquoThe WISE research group remotely controlled siphon systemrdquo 2020 httpswebengfiueduarleon
(accessed Oct 20 2020) [10] V Verma L Bian A Rojali D Ozecik and A Leon ldquoA Remotely Controlled Framework for Gravity-Driven Water
Release in Shallow and Not Shallow Storage Pondsrdquo in World Environmental and Water Resources Congress 2020 Nov 2020 pp 12ndash22 doi doi1010619780784482940002
[11] R F Moreira Neto M L Calijuri I de C Carvalho and A da F Santiago ldquoRainwater treatment in airports using slow sand filtration followed by chlorination Efficiency and costsrdquo Resour Conserv Recycl vol 65 pp 124ndash129 2012 doi httpsdoiorg101016jresconrec201206001
[12] J T Visscher ldquoSlow sand filtration Design operation and maintenancerdquo J Am Water Work Assoc vol 82 no 6 pp 67ndash71 1990 doi 101002j1551-88331990tb06979x
[13] P Bedient W Huber and B Vieux Hydrology and Floodplain Analysis 6th ed Pearson 2018 [14] J Krahn ldquoSeepage modeling with SEEPW An engineering methodologyrdquo GEO-SLOPE Int Ltd Calgary 2004 [15] STRUCT ldquoHydraulic Conductivity Ranges of Various Soil Typesrdquo httpsstructxcomSoil_Properties_007html [16] R System ldquoRainFlo Corrugated Tank Sizerdquo httpswwwrainharvestcomrainflo-corrugated-tank-sizesasp [17] D A Chin ldquoAn Overview of Urban Stormwater Management Practices in Miami-Dade County Floridardquo 2004 [Online]
Available httpspubsusgsgovof20041346pdfofr20041346pdf [18] Hunker ldquoHow To Calculate Gutter Sloperdquo httpswwwhunkercom13414625how-to-calculate-slope-rain-gutter-
installation (accessed Nov 04 2020) [19] Guttersuplly ldquoThe Advantages of K-style Guttersrdquo httpswwwguttersupplycomblogthe-advantages-of-k-style-
gutters (accessed Dec 02 2020) [20] AMEC Environment amp Infrastructure ldquoGreen Infrastructure Stormwater Management Practices for Small Commercial
Development City of Atlanta Stormwater Guidelinesrdquo no April 2014 [Online] Available httpwwwatlantawatershedorgdefaultlinkServID=6B82F82F-5178-46B9-804C065FD9D912CCampshowMeta=2ampext=pdf
[21] E Oberndorfer et al ldquoGreen roofs as urban ecosystems Ecological structures functions and servicesrdquo Bioscience vol 57 no 10 pp 823ndash833 2007 doi 101641B571005
[22] C Van Mechelen T Dutoit and M Hermy ldquoAdapting green roof irrigation practices for a sustainable future A reviewrdquo Sustain Cities Soc vol 19 pp 74ndash90 2015 doi httpsdoiorg101016jscs201507007
[23] C for L amp U Horticulture ldquoUsing ANSIASABE S623 amp SLIDE to Estimate Landscape Water Requirementsrdquo httpsucanredusitesUrbanHortWater_Use_of_Turfgrass_and_Landscape_Plant_MaterialsSLIDE__Simplified_Irrig ation_Demand_Estimation (accessed Nov 02 2020)
[24] R M C System ldquoHistoric ET by Zip Coderdquo httpwwwrainmastercomhistoricETaspx (accessed Nov 02 2020) [25] S Cascone ldquoGreen roof design State of the art on technology and materialsrdquo Sustain vol 11 no 11 2019 doi
103390su11113020 [26] A R Othman and N Sahidin ldquoVertical greening facade as passive approach in sustainable designrdquo Procedia-social
Behav Sci vol 222 pp 845ndash854 2016 [27] K-T Lei J-S Tang and P-H Chen ldquoNumerical simulation and experiments with green roofs for increasing indoor
thermal comfortrdquo J Chinese Inst Eng vol 42 no 4 pp 346ndash365 2019 [28] H G Jones Plants and microclimate a quantitative approach to environmental plant physiology Cambridge university
press 2013 [29] ldquoMiami FL Electricity Statisticsrdquo ELECTRICITY LOCAL 2020 httpswwwelectricitylocalcomstatesfloridamiami
(accessed Dec 02 2020) [30] S J DeWald S J Josiah and R Erdkamp Heating with wood Producing harvesting and processing firewood
Operative Extension Institute of Agriculture and Natural Resources 2005 [31] E C Toochi ldquoCarbon sequestration how much can forestry sequester CO2rdquo For Res Eng Int J vol 2 no 3 pp 148ndash
150 2018
18 | P a g e
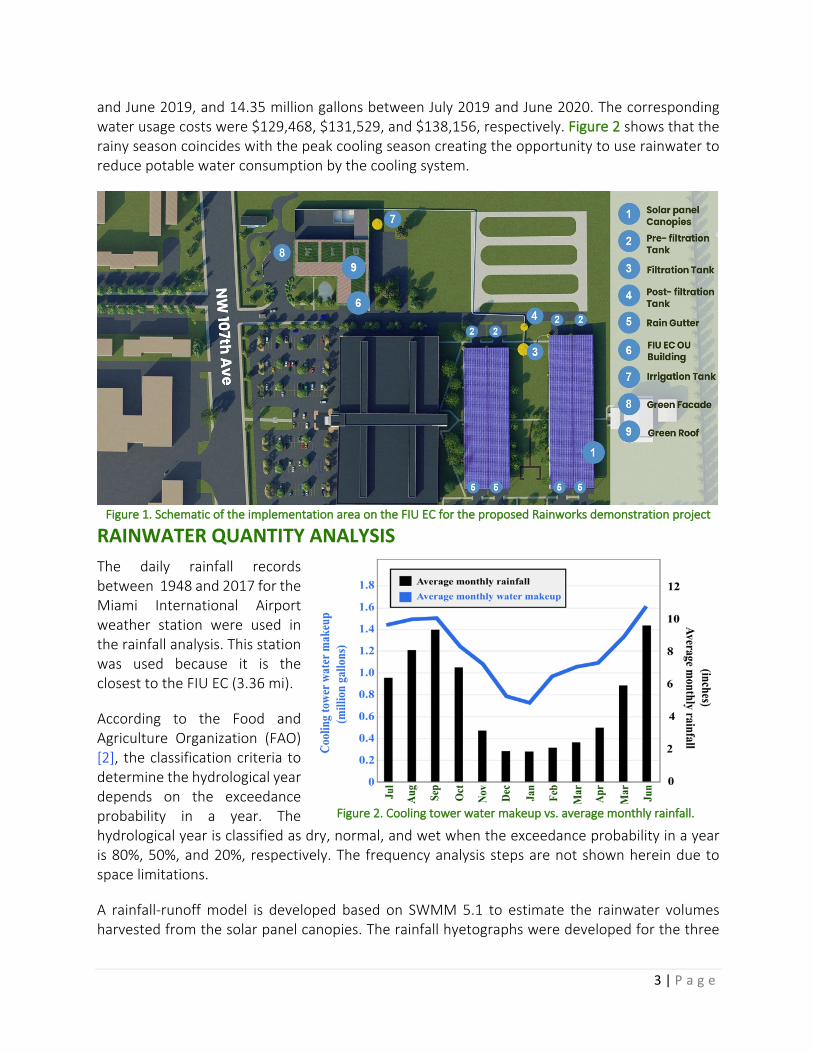
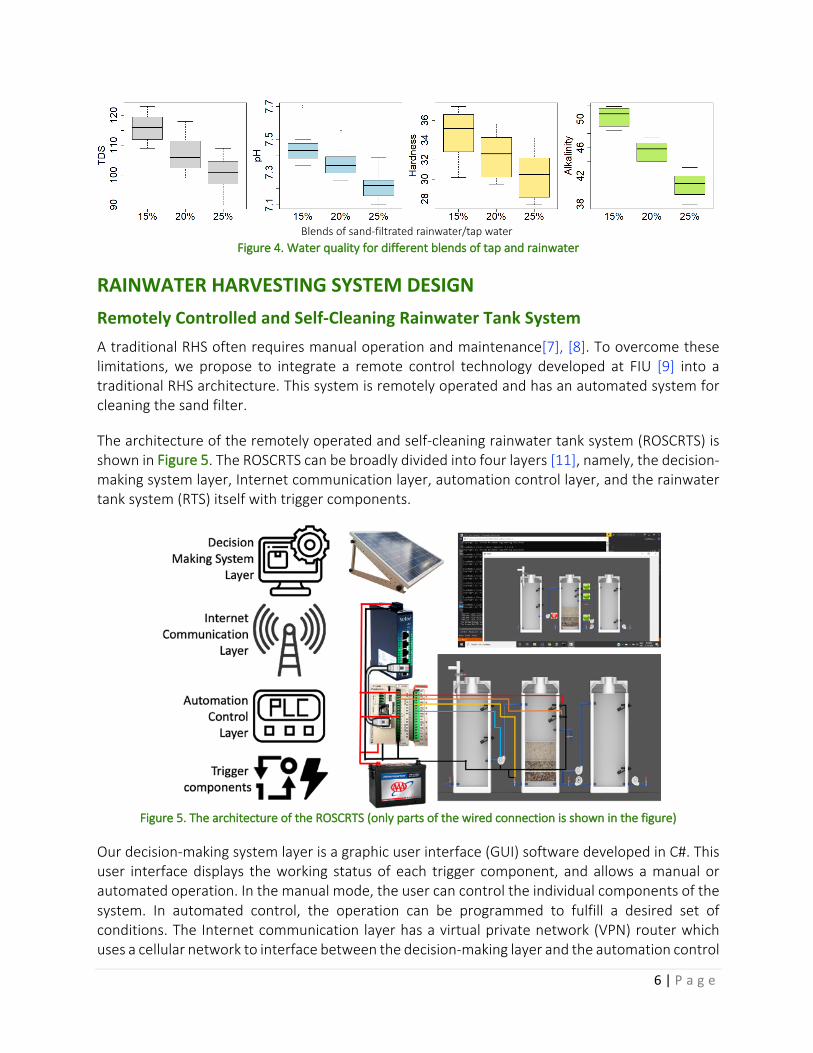