Smart Cities - arup.com · services. In these cities “smart technologies” are creating more...
32
Smart Cities Transforming the 21st century city via the creative use of technology
-
Upload
vuongxuyen -
Category
Documents
-
view
217 -
download
0
Transcript of Smart Cities - arup.com · services. In these cities “smart technologies” are creating more...
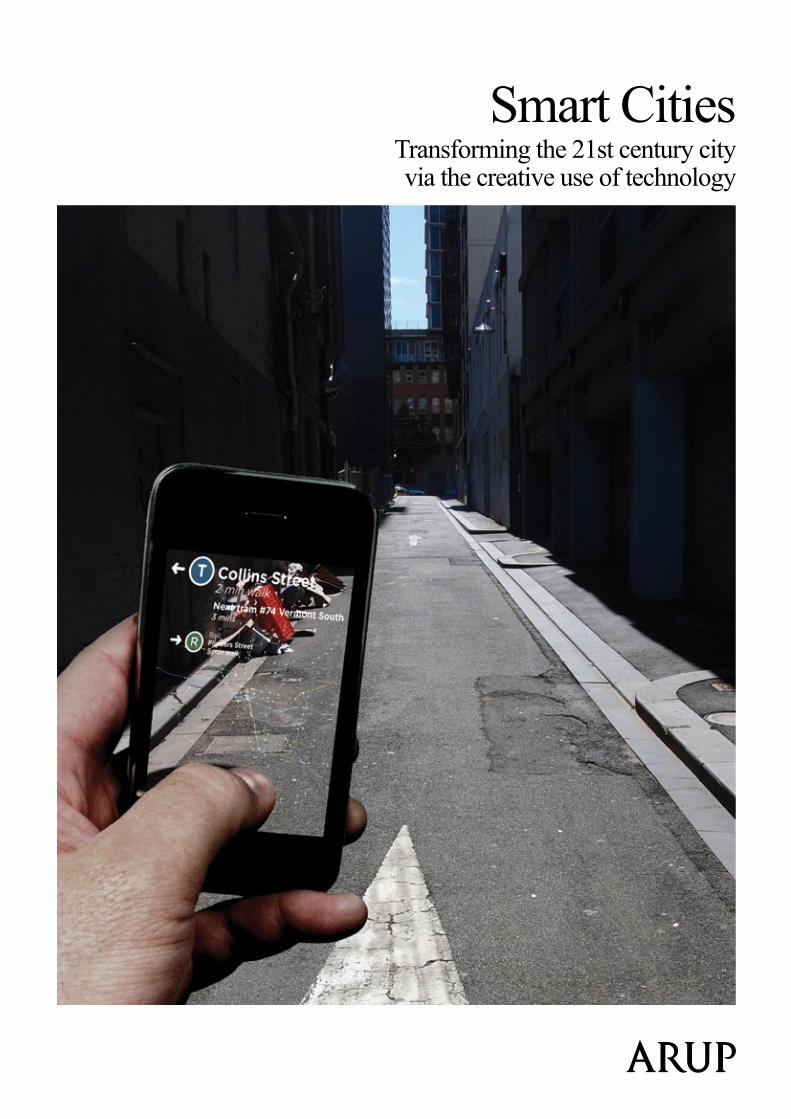
Smart CitiesTransforming the 21st century city via the creative use of technology
Contents
3 Executive summary
4 21st century smart cities4 Smart cities5 Why the smart city?6 New urban user experience7 Smart cities as a system8 Smart behavioural change9 Smart city strategies11 Feedback loops12 Cities have a choice
13 What we do13 Strategy and organisation13 Urban informatics13 Business systems and architecture13 Infrastructure
14 Smart cities workshop reports
16 Smart cities case studies
24 Urban informatics examples
ContactsLondonVolker Buscher [email protected]éan Doody [email protected] KongMichael Tomordy [email protected] San FranciscoGareth Ashley [email protected] Tabet [email protected] McDermott [email protected]
First published September 2010
Written by informatics specialists from Arup’s IT and Communications Systems team, this report is informed by their experiences of working on cities in the Ecological Age, and the opportunities and challenges faced.
The next report will focus on key smart city issues including: the value case for ICT in cities; a road map for political and civil leaders; and financing of smart solutions.
Page 2
Arup | Smart Cities Page 3
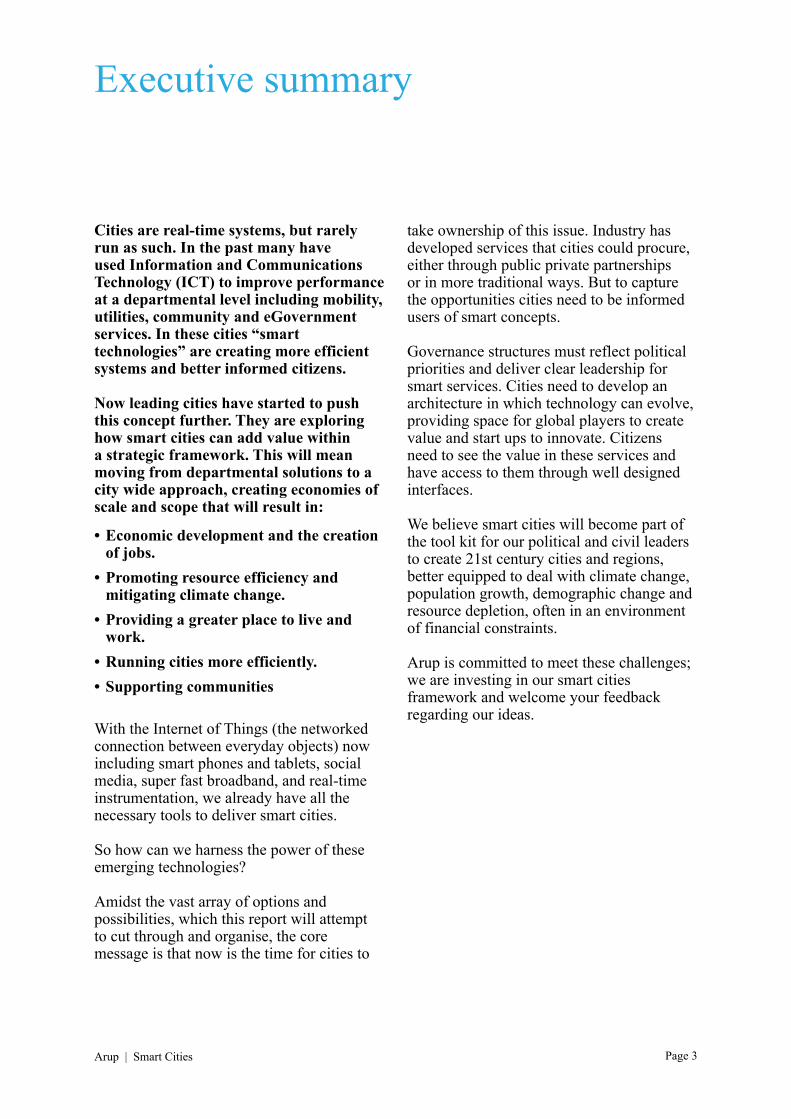
Executive summary
Cities are real-time systems, but rarely run as such. In the past many have used Information and Communications Technology (ICT) to improve performance at a departmental level including mobility, utilities, community and eGovernment services. In these cities “smart technologies” are creating more efficient systems and better informed citizens.
Now leading cities have started to push this concept further. They are exploring how smart cities can add value within a strategic framework. This will mean moving from departmental solutions to a city wide approach, creating economies of scale and scope that will result in:
•Economic development and the creation of jobs.
•Promoting resource efficiency and mitigating climate change.
•Providing a greater place to live and work.
•Running cities more efficiently.•Supporting communities
With the Internet of Things (the networked connection between everyday objects) now including smart phones and tablets, social media, super fast broadband, and real-time instrumentation, we already have all the necessary tools to deliver smart cities.
So how can we harness the power of these emerging technologies?
Amidst the vast array of options and possibilities, which this report will attempt to cut through and organise, the core message is that now is the time for cities to
take ownership of this issue. Industry has developed services that cities could procure, either through public private partnerships or in more traditional ways. But to capture the opportunities cities need to be informed users of smart concepts.
Governance structures must reflect political priorities and deliver clear leadership for smart services. Cities need to develop an architecture in which technology can evolve, providing space for global players to create value and start ups to innovate. Citizens need to see the value in these services and have access to them through well designed interfaces.
We believe smart cities will become part of the tool kit for our political and civil leaders to create 21st century cities and regions, better equipped to deal with climate change, population growth, demographic change and resource depletion, often in an environment of financial constraints.
Arup is committed to meet these challenges; we are investing in our smart cities framework and welcome your feedback regarding our ideas.
Page 4
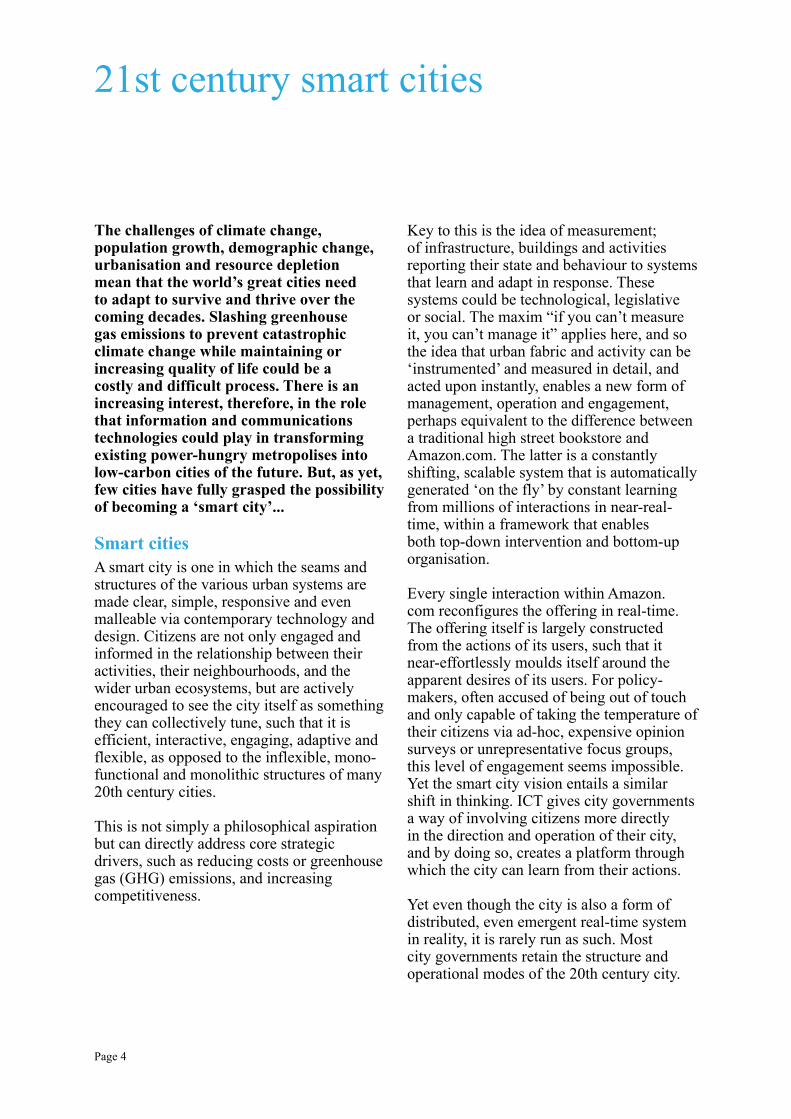
The challenges of climate change, population growth, demographic change, urbanisation and resource depletion mean that the world’s great cities need to adapt to survive and thrive over the coming decades. Slashing greenhouse gas emissions to prevent catastrophic climate change while maintaining or increasing quality of life could be a costly and difficult process. There is an increasing interest, therefore, in the role that information and communications technologies could play in transforming existing power-hungry metropolises into low-carbon cities of the future. But, as yet, few cities have fully grasped the possibility of becoming a ‘smart city’...
Smart citiesA smart city is one in which the seams and structures of the various urban systems are made clear, simple, responsive and even malleable via contemporary technology and design. Citizens are not only engaged and informed in the relationship between their activities, their neighbourhoods, and the wider urban ecosystems, but are actively encouraged to see the city itself as something they can collectively tune, such that it is efficient, interactive, engaging, adaptive and flexible, as opposed to the inflexible, mono-functional and monolithic structures of many 20th century cities.
This is not simply a philosophical aspiration but can directly address core strategic drivers, such as reducing costs or greenhouse gas (GHG) emissions, and increasing competitiveness.
Key to this is the idea of measurement; of infrastructure, buildings and activities reporting their state and behaviour to systems that learn and adapt in response. These systems could be technological, legislative or social. The maxim “if you can’t measure it, you can’t manage it” applies here, and so the idea that urban fabric and activity can be ‘instrumented’ and measured in detail, and acted upon instantly, enables a new form of management, operation and engagement, perhaps equivalent to the difference between a traditional high street bookstore and Amazon.com. The latter is a constantly shifting, scalable system that is automatically generated ‘on the fly’ by constant learning from millions of interactions in near-real-time, within a framework that enables both top-down intervention and bottom-up organisation.
Every single interaction within Amazon.com reconfigures the offering in real-time. The offering itself is largely constructed from the actions of its users, such that it near-effortlessly moulds itself around the apparent desires of its users. For policy-makers, often accused of being out of touch and only capable of taking the temperature of their citizens via ad-hoc, expensive opinion surveys or unrepresentative focus groups, this level of engagement seems impossible. Yet the smart city vision entails a similar shift in thinking. ICT gives city governments a way of involving citizens more directly in the direction and operation of their city, and by doing so, creates a platform through which the city can learn from their actions.
Yet even though the city is also a form of distributed, even emergent real-time system in reality, it is rarely run as such. Most city governments retain the structure and operational modes of the 20th century city.
21st century smart cities
Arup | Smart Cities Page 5
In contrast, many if not all contemporary business and cultural sectors are being transformed by the internet, and businesses themselves increasingly understand and position themselves as data-driven organisations. This often entails moving information management, and its associated ICT, from a back-room activity right to the front of organisations in which they are reconceived as key strategic drivers. If the city is to be increasingly run on data, ICT can become a major tool of public policy in smart cities.
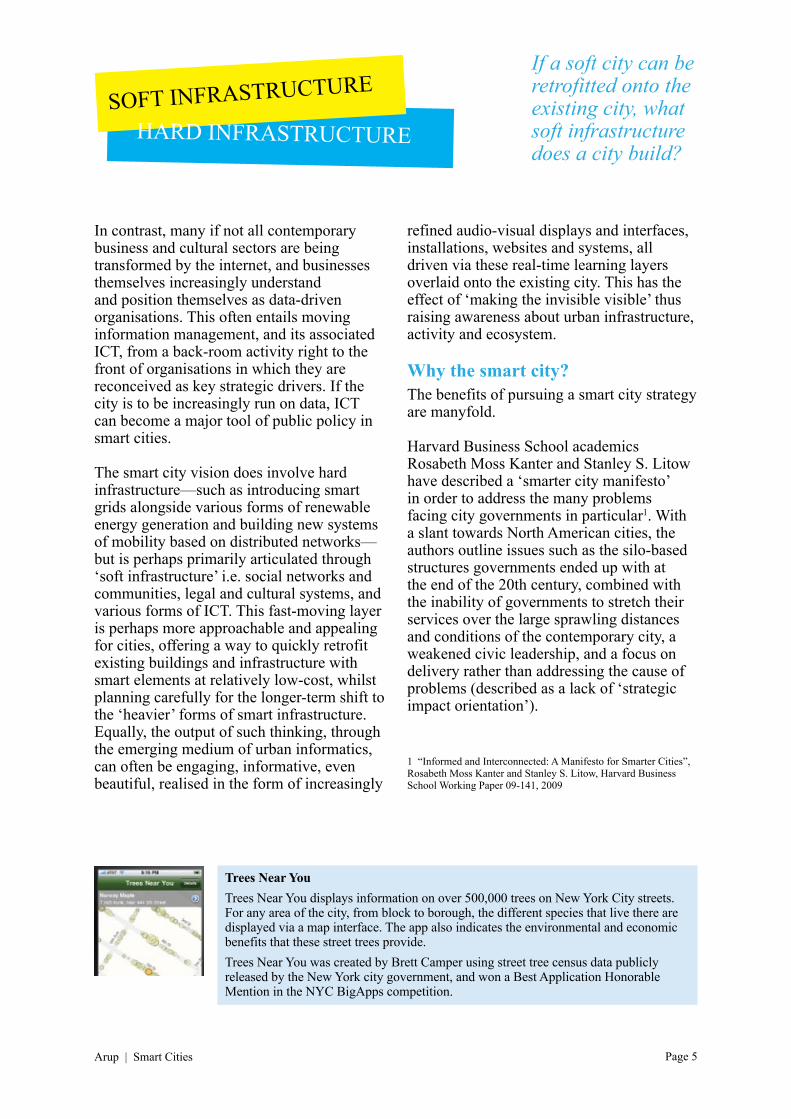
The smart city vision does involve hard infrastructure—such as introducing smart grids alongside various forms of renewable energy generation and building new systems of mobility based on distributed networks—but is perhaps primarily articulated through ‘soft infrastructure’ i.e. social networks and communities, legal and cultural systems, and various forms of ICT. This fast-moving layer is perhaps more approachable and appealing for cities, offering a way to quickly retrofit existing buildings and infrastructure with smart elements at relatively low-cost, whilst planning carefully for the longer-term shift to the ‘heavier’ forms of smart infrastructure.Equally, the output of such thinking, through the emerging medium of urban informatics, can often be engaging, informative, even beautiful, realised in the form of increasingly
refined audio-visual displays and interfaces, installations, websites and systems, all driven via these real-time learning layers overlaid onto the existing city. This has the effect of ‘making the invisible visible’ thus raising awareness about urban infrastructure, activity and ecosystem.
Why the smart city?The benefits of pursuing a smart city strategy are manyfold.
Harvard Business School academics Rosabeth Moss Kanter and Stanley S. Litow have described a ‘smarter city manifesto’ in order to address the many problems facing city governments in particular1. With a slant towards North American cities, the authors outline issues such as the silo-based structures governments ended up with at the end of the 20th century, combined with the inability of governments to stretch their services over the large sprawling distances and conditions of the contemporary city, a weakened civic leadership, and a focus on delivery rather than addressing the cause of problems (described as a lack of ‘strategic impact orientation’).
Trees Near YouTrees Near You displays information on over 500,000 trees on New York City streets. For any area of the city, from block to borough, the different species that live there are displayed via a map interface. The app also indicates the environmental and economic benefits that these street trees provide.Trees Near You was created by Brett Camper using street tree census data publicly released by the New York city government, and won a Best Application Honorable Mention in the NYC BigApps competition.
HARD INFRASTRUCTURESOFT INFRASTRUCTURE
If a soft city can be retrofitted onto the existing city, what soft infrastructure does a city build?
1 “Informed and Interconnected: A Manifesto for Smarter Cities”, Rosabeth Moss Kanter and Stanley S. Litow, Harvard Business School Working Paper 09-141, 2009
Page 6
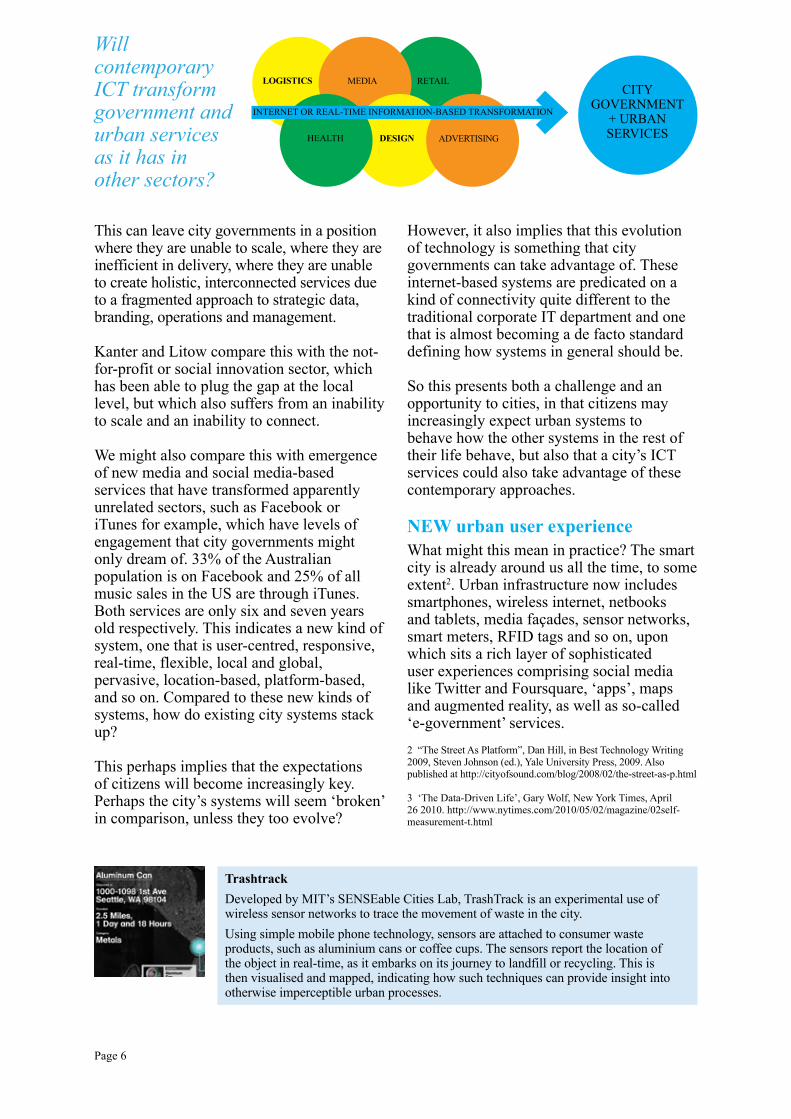
Will contemporary ICT transform government and urban services as it has in other sectors?
CITY GOVERNMENT
+ URBAN SERVICES
RETAILMEDIALOGISTICS
HEALTH ADVERTISING
INTERNET OR REAL-TIME INFORMATION-BASED TRANSFORMATION
TrashtrackDeveloped by MIT’s SENSEable Cities Lab, TrashTrack is an experimental use of wireless sensor networks to trace the movement of waste in the city. Using simple mobile phone technology, sensors are attached to consumer waste products, such as aluminium cans or coffee cups. The sensors report the location of the object in real-time, as it embarks on its journey to landfill or recycling. This is then visualised and mapped, indicating how such techniques can provide insight into otherwise imperceptible urban processes.
This can leave city governments in a position where they are unable to scale, where they are inefficient in delivery, where they are unable to create holistic, interconnected services due to a fragmented approach to strategic data, branding, operations and management.
Kanter and Litow compare this with the not-for-profit or social innovation sector, which has been able to plug the gap at the local level, but which also suffers from an inability to scale and an inability to connect.
We might also compare this with emergence of new media and social media-based services that have transformed apparently unrelated sectors, such as Facebook or iTunes for example, which have levels of engagement that city governments might only dream of. 33% of the Australian population is on Facebook and 25% of all music sales in the US are through iTunes. Both services are only six and seven years old respectively. This indicates a new kind of system, one that is user-centred, responsive, real-time, flexible, local and global, pervasive, location-based, platform-based, and so on. Compared to these new kinds of systems, how do existing city systems stack up?
This perhaps implies that the expectations of citizens will become increasingly key. Perhaps the city’s systems will seem ‘broken’ in comparison, unless they too evolve?
However, it also implies that this evolution of technology is something that city governments can take advantage of. These internet-based systems are predicated on a kind of connectivity quite different to the traditional corporate IT department and one that is almost becoming a de facto standard defining how systems in general should be.
So this presents both a challenge and an opportunity to cities, in that citizens may increasingly expect urban systems to behave how the other systems in the rest of their life behave, but also that a city’s ICT services could also take advantage of these contemporary approaches.
NEW urban user experienceWhat might this mean in practice? The smart city is already around us all the time, to some extent2. Urban infrastructure now includes smartphones, wireless internet, netbooks and tablets, media façades, sensor networks, smart meters, RFID tags and so on, upon which sits a rich layer of sophisticated user experiences comprising social media like Twitter and Foursquare, ‘apps’, maps and augmented reality, as well as so-called ‘e-government’ services. 2 “The Street As Platform”, Dan Hill, in Best Technology Writing 2009, Steven Johnson (ed.), Yale University Press, 2009. Also published at http://cityofsound.com/blog/2008/02/the-street-as-p.html
3 ‘The Data-Driven Life’, Gary Wolf, New York Times, April 26 2010. http://www.nytimes.com/2010/05/02/magazine/02self-measurement-t.html
DESIGN
Page 7
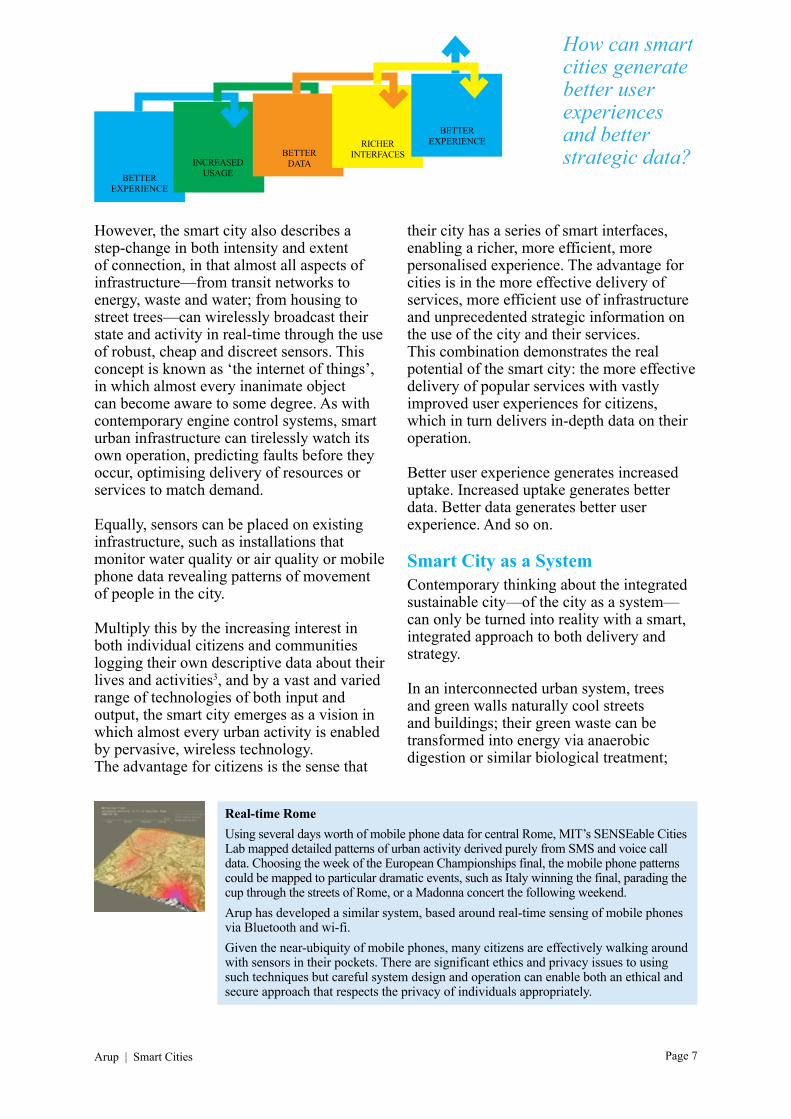
How can smart cities generate better user experiences and better strategic data?
BETTER EXPERIENCE
INCREASED USAGE
BETTER DATA
RICHER INTERFACES
BETTER EXPERIENCE
Real-time RomeUsing several days worth of mobile phone data for central Rome, MIT’s SENSEable Cities Lab mapped detailed patterns of urban activity derived purely from SMS and voice call data. Choosing the week of the European Championships final, the mobile phone patterns could be mapped to particular dramatic events, such as Italy winning the final, parading the cup through the streets of Rome, or a Madonna concert the following weekend.Arup has developed a similar system, based around real-time sensing of mobile phones via Bluetooth and wi-fi. Given the near-ubiquity of mobile phones, many citizens are effectively walking around with sensors in their pockets. There are significant ethics and privacy issues to using such techniques but careful system design and operation can enable both an ethical and secure approach that respects the privacy of individuals appropriately.
However, the smart city also describes a step-change in both intensity and extent of connection, in that almost all aspects of infrastructure—from transit networks to energy, waste and water; from housing to street trees—can wirelessly broadcast their state and activity in real-time through the use of robust, cheap and discreet sensors. This concept is known as ‘the internet of things’, in which almost every inanimate object can become aware to some degree. As with contemporary engine control systems, smart urban infrastructure can tirelessly watch its own operation, predicting faults before they occur, optimising delivery of resources or services to match demand.
Equally, sensors can be placed on existing infrastructure, such as installations that monitor water quality or air quality or mobile phone data revealing patterns of movement of people in the city.
Multiply this by the increasing interest in both individual citizens and communities logging their own descriptive data about their lives and activities3, and by a vast and varied range of technologies of both input and output, the smart city emerges as a vision in which almost every urban activity is enabled by pervasive, wireless technology.The advantage for citizens is the sense that
their city has a series of smart interfaces, enabling a richer, more efficient, more personalised experience. The advantage for cities is in the more effective delivery of services, more efficient use of infrastructure and unprecedented strategic information on the use of the city and their services. This combination demonstrates the real potential of the smart city: the more effective delivery of popular services with vastly improved user experiences for citizens, which in turn delivers in-depth data on their operation.
Better user experience generates increased uptake. Increased uptake generates better data. Better data generates better user experience. And so on.
Smart City as a SystemContemporary thinking about the integrated sustainable city—of the city as a system—can only be turned into reality with a smart, integrated approach to both delivery and strategy.
In an interconnected urban system, trees and green walls naturally cool streets and buildings; their green waste can be transformed into energy via anaerobic digestion or similar biological treatment;
Arup | Smart Cities
Page 8
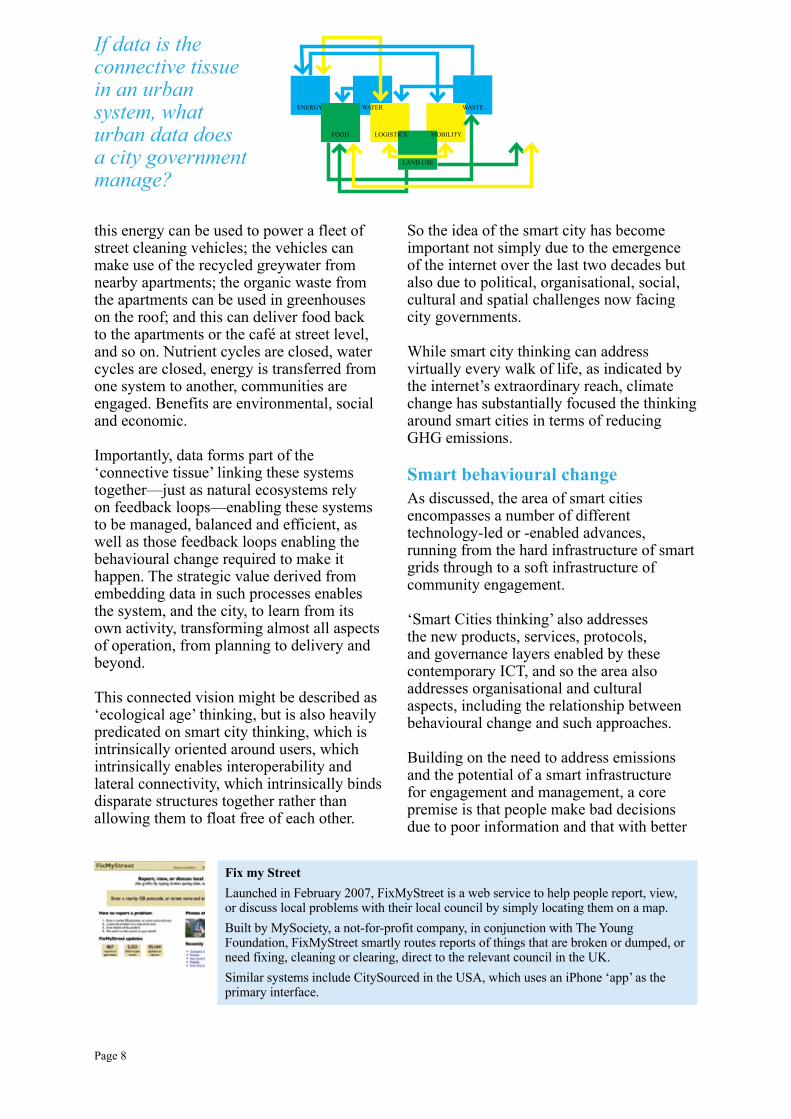
this energy can be used to power a fleet of street cleaning vehicles; the vehicles can make use of the recycled greywater from nearby apartments; the organic waste from the apartments can be used in greenhouses on the roof; and this can deliver food back to the apartments or the café at street level, and so on. Nutrient cycles are closed, water cycles are closed, energy is transferred from one system to another, communities are engaged. Benefits are environmental, social and economic.
Importantly, data forms part of the ‘connective tissue’ linking these systems together—just as natural ecosystems rely on feedback loops—enabling these systems to be managed, balanced and efficient, as well as those feedback loops enabling the behavioural change required to make it happen. The strategic value derived from embedding data in such processes enables the system, and the city, to learn from its own activity, transforming almost all aspects of operation, from planning to delivery and beyond.
This connected vision might be described as ‘ecological age’ thinking, but is also heavily predicated on smart city thinking, which is intrinsically oriented around users, which intrinsically enables interoperability and lateral connectivity, which intrinsically binds disparate structures together rather than allowing them to float free of each other.
So the idea of the smart city has become important not simply due to the emergence of the internet over the last two decades but also due to political, organisational, social, cultural and spatial challenges now facing city governments.
While smart city thinking can address virtually every walk of life, as indicated by the internet’s extraordinary reach, climate change has substantially focused the thinking around smart cities in terms of reducing GHG emissions.
Smart behavioural changeAs discussed, the area of smart cities encompasses a number of different technology-led or -enabled advances, running from the hard infrastructure of smart grids through to a soft infrastructure of community engagement.
‘Smart Cities thinking’ also addresses the new products, services, protocols, and governance layers enabled by these contemporary ICT, and so the area also addresses organisational and cultural aspects, including the relationship between behavioural change and such approaches.
Building on the need to address emissions and the potential of a smart infrastructure for engagement and management, a core premise is that people make bad decisions due to poor information and that with better
Fix my StreetLaunched in February 2007, FixMyStreet is a web service to help people report, view, or discuss local problems with their local council by simply locating them on a map.Built by MySociety, a not-for-profit company, in conjunction with The Young Foundation, FixMyStreet smartly routes reports of things that are broken or dumped, or need fixing, cleaning or clearing, direct to the relevant council in the UK. Similar systems include CitySourced in the USA, which uses an iPhone ‘app’ as the primary interface.
If data is the connective tissue in an urban system, what urban data does a city government manage?
LAND USE
MOBILITYLOGISTICSFOOD
WATER WASTEENERGY
Page 9
information, behaviour change will follow, which can cut emissions and increase quality of life.
This premise is supported by behavioural psychology research that indicates two key drivers of behavioural change are ‘active learning’ and ‘social proof’ i.e. trying something out, and seeing others doing it too. Contemporary ICT, such as social media, can enable this self-learning and self-reflection, as well as reinforce these broader social patterns, essentially making ‘social proof’ visible. Drawing out these wider civic patterns of use may balance the individualising tendencies of only seeing personal data, say via smart meters, as well as leading to greater behavioural change.
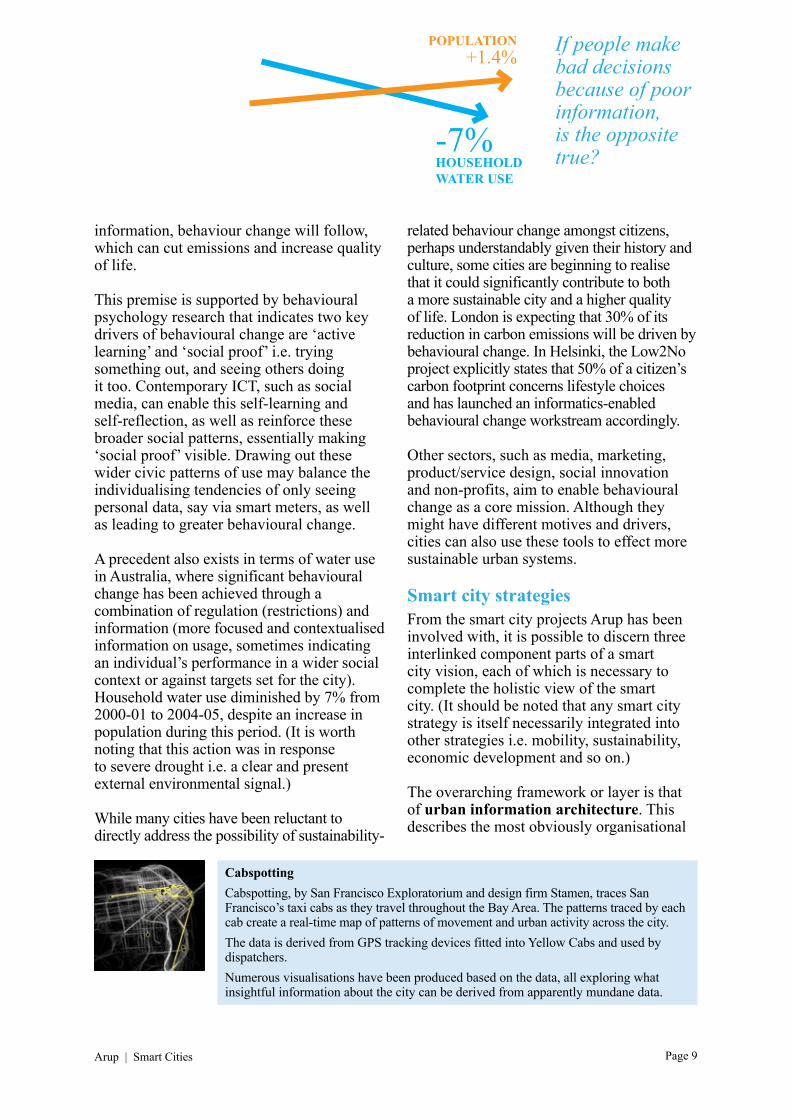
A precedent also exists in terms of water use in Australia, where significant behavioural change has been achieved through a combination of regulation (restrictions) and information (more focused and contextualised information on usage, sometimes indicating an individual’s performance in a wider social context or against targets set for the city). Household water use diminished by 7% from 2000-01 to 2004-05, despite an increase in population during this period. (It is worth noting that this action was in response to severe drought i.e. a clear and present external environmental signal.)
While many cities have been reluctant to directly address the possibility of sustainability-
related behaviour change amongst citizens, perhaps understandably given their history and culture, some cities are beginning to realise that it could significantly contribute to both a more sustainable city and a higher quality of life. London is expecting that 30% of its reduction in carbon emissions will be driven by behavioural change. In Helsinki, the Low2No project explicitly states that 50% of a citizen’s carbon footprint concerns lifestyle choices and has launched an informatics-enabled behavioural change workstream accordingly.
Other sectors, such as media, marketing, product/service design, social innovation and non-profits, aim to enable behavioural change as a core mission. Although they might have different motives and drivers, cities can also use these tools to effect more sustainable urban systems.
Smart city strategiesFrom the smart city projects Arup has been involved with, it is possible to discern three interlinked component parts of a smart city vision, each of which is necessary to complete the holistic view of the smart city. (It should be noted that any smart city strategy is itself necessarily integrated into other strategies i.e. mobility, sustainability, economic development and so on.)
The overarching framework or layer is that of urban information architecture. This describes the most obviously organisational
CabspottingCabspotting, by San Francisco Exploratorium and design firm Stamen, traces San Francisco’s taxi cabs as they travel throughout the Bay Area. The patterns traced by each cab create a real-time map of patterns of movement and urban activity across the city.The data is derived from GPS tracking devices fitted into Yellow Cabs and used by dispatchers.Numerous visualisations have been produced based on the data, all exploring what insightful information about the city can be derived from apparently mundane data.
If people make bad decisions because of poor information, is the opposite true?
+1.4%POPULATION
HOUSEHOLD WATER USE
-7%
Arup | Smart Cities
Page 10
Tracing Velib’Researcher Fabien Girardin has created a visualisation of daily usage patterns for both the Bicing bike-sharing network in Barcelona, and its equivalent, Velib’, in Paris.Using a technique known as ‘scraping’, Girardin used the data published on the bike-sharing network websites, indicating the number of bikes left at each hub. He then overlaid a simple Excel-style visualisation over a Google Map of the city, creating an animation of how the bikes move around the city. In this way, it is easy to see, for example, how the bikes in Barcelona move from the city to the beach and back again, on a sunny Sunday afternoon, or how the bikes shift in and out of the centre of Paris around lunchtime. Simple daily patterns are perceptible in the performance of infrastructure, and such data can be drawn simply from municipal websites.
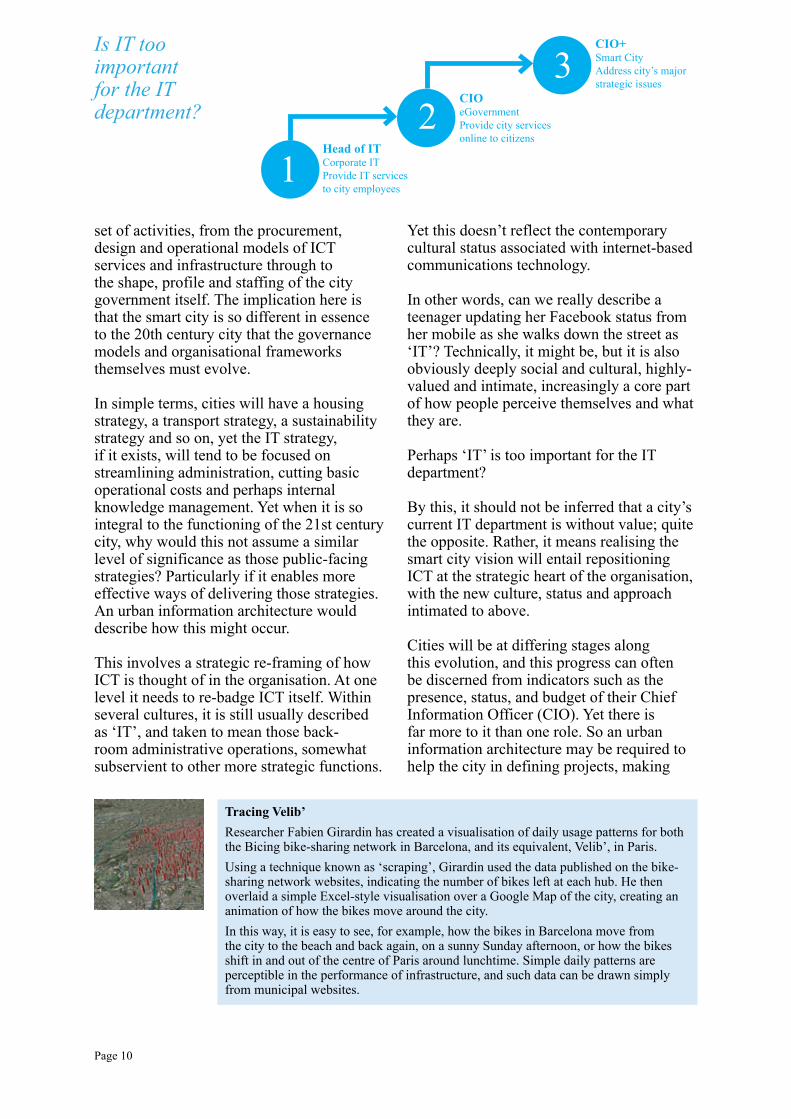
1Head of IT Corporate IT Provide IT services to city employees
23
CIO eGovernment Provide city services online to citizens
CIO+ Smart City Address city’s major strategic issues
Is IT too important for the IT department?
set of activities, from the procurement, design and operational models of ICT services and infrastructure through to the shape, profile and staffing of the city government itself. The implication here is that the smart city is so different in essence to the 20th century city that the governance models and organisational frameworks themselves must evolve.
In simple terms, cities will have a housing strategy, a transport strategy, a sustainability strategy and so on, yet the IT strategy, if it exists, will tend to be focused on streamlining administration, cutting basic operational costs and perhaps internal knowledge management. Yet when it is so integral to the functioning of the 21st century city, why would this not assume a similar level of significance as those public-facing strategies? Particularly if it enables more effective ways of delivering those strategies. An urban information architecture would describe how this might occur.
This involves a strategic re-framing of how ICT is thought of in the organisation. At one level it needs to re-badge ICT itself. Within several cultures, it is still usually described as ‘IT’, and taken to mean those back-room administrative operations, somewhat subservient to other more strategic functions.
Yet this doesn’t reflect the contemporary cultural status associated with internet-based communications technology.
In other words, can we really describe a teenager updating her Facebook status from her mobile as she walks down the street as ‘IT’? Technically, it might be, but it is also obviously deeply social and cultural, highly-valued and intimate, increasingly a core part of how people perceive themselves and what they are.
Perhaps ‘IT’ is too important for the IT department?
By this, it should not be inferred that a city’s current IT department is without value; quite the opposite. Rather, it means realising the smart city vision will entail repositioning ICT at the strategic heart of the organisation, with the new culture, status and approach intimated to above.
Cities will be at differing stages along this evolution, and this progress can often be discerned from indicators such as the presence, status, and budget of their Chief Information Officer (CIO). Yet there is far more to it than one role. So an urban information architecture may be required to help the city in defining projects, making
Page 11
Medialab PradoThe media façade offers the opportunity to create feedback loops into civic spaces. Here, the MediaLab Prado’s well-designed LED display is integrated into the form of the building and the content is integrated into the programming of the organisation. Here, the feedback loops concern the work created by the organisation rather than any particular sustainability information, yet indicate how informatics might highlight and reinforce patterns of work and play as well as infrastructure.
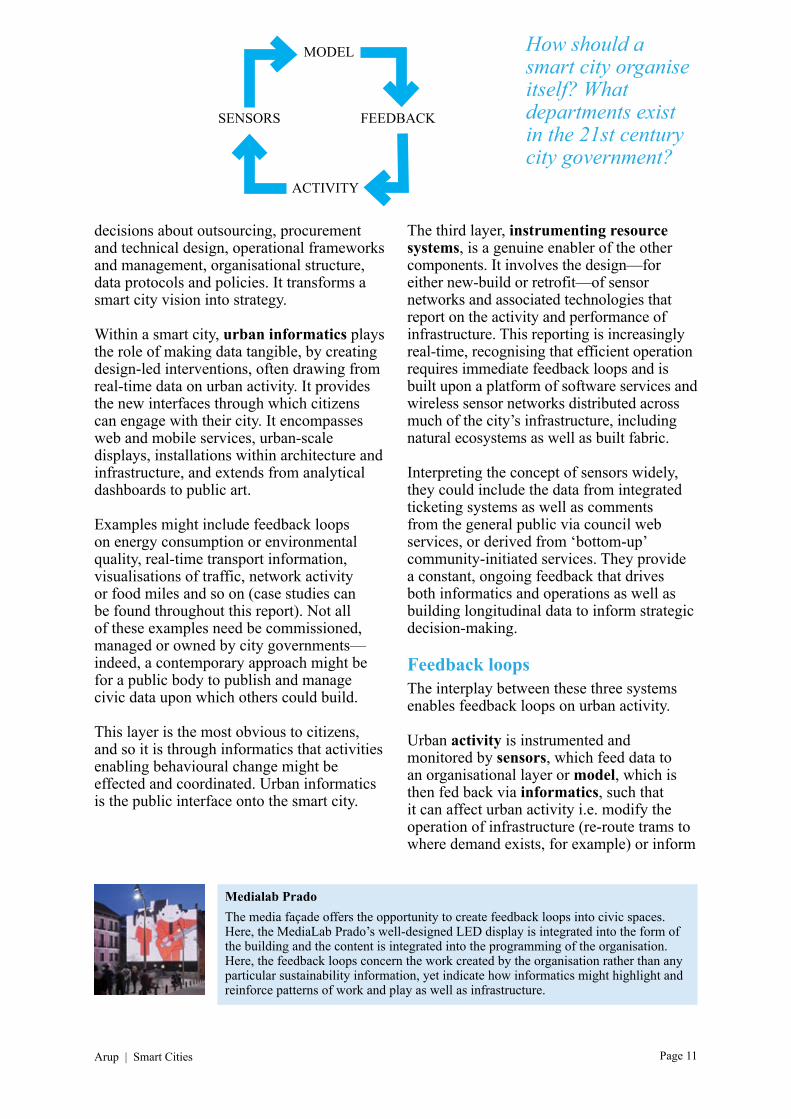
How should a smart city organise itself? What departments exist in the 21st century city government?
SENSORS FEEDBACK
ACTIVITY
MODEL
decisions about outsourcing, procurement and technical design, operational frameworks and management, organisational structure, data protocols and policies. It transforms a smart city vision into strategy.
Within a smart city, urban informatics plays the role of making data tangible, by creating design-led interventions, often drawing from real-time data on urban activity. It provides the new interfaces through which citizens can engage with their city. It encompasses web and mobile services, urban-scale displays, installations within architecture and infrastructure, and extends from analytical dashboards to public art.
Examples might include feedback loops on energy consumption or environmental quality, real-time transport information, visualisations of traffic, network activity or food miles and so on (case studies can be found throughout this report). Not all of these examples need be commissioned, managed or owned by city governments—indeed, a contemporary approach might be for a public body to publish and manage civic data upon which others could build.
This layer is the most obvious to citizens, and so it is through informatics that activities enabling behavioural change might be effected and coordinated. Urban informatics is the public interface onto the smart city.
The third layer, instrumenting resource systems, is a genuine enabler of the other components. It involves the design—for either new-build or retrofit—of sensor networks and associated technologies that report on the activity and performance of infrastructure. This reporting is increasingly real-time, recognising that efficient operation requires immediate feedback loops and is built upon a platform of software services and wireless sensor networks distributed across much of the city’s infrastructure, including natural ecosystems as well as built fabric.
Interpreting the concept of sensors widely, they could include the data from integrated ticketing systems as well as comments from the general public via council web services, or derived from ‘bottom-up’ community-initiated services. They provide a constant, ongoing feedback that drives both informatics and operations as well as building longitudinal data to inform strategic decision-making.
Feedback loopsThe interplay between these three systems enables feedback loops on urban activity.
Urban activity is instrumented and monitored by sensors, which feed data to an organisational layer or model, which is then fed back via informatics, such that it can affect urban activity i.e. modify the operation of infrastructure (re-route trams to where demand exists, for example) or inform
Arup | Smart Cities
Page 12
citizens about environmental qualities, and so on. This can create a virtuous cycle, if well-designed and well-run.
At a basic level, this is how smart meters can modify energy use in the home. The meter (sensor) monitors energy use (activity), which is then quickly analysed (modelled) and displayed (feedback) to the user, whose energy use drops. While the longitudinal patterns of activity around these simple feedback loops indicate that this needs to be part of a wider series of behavioural change strategies and activities, this ‘smart meter effect’ begins to indicate their potential nonetheless.
Cities have a choicePolitical and civil leaders working with businesses and the community can create a 21st century city using Arup’s Smart Cities Framework, described above, as a guide.
Globally, many cities are beginning to explore these new approaches. Some are introducing a top-down approach starting with a strategic framework and then deploying this to guide major urban development projects; others are developing specific, distributed interventions for buildings, open data or mobility, before trying to connect these dots. Either approach is valid and in 2010, it is more important to act than to stand back and wait to be transformed.
Page 13
What we do
Our Smart Cities offering is a service for policy makers, executives, city departments, developers, and industry.
We help our clients improve economic performance, resource efficiency, climate change mitigation, operational efficiency and to deliver a greater place to live and work. We advise our clients on defining how much to invest and how much value they can get from being “smart”.
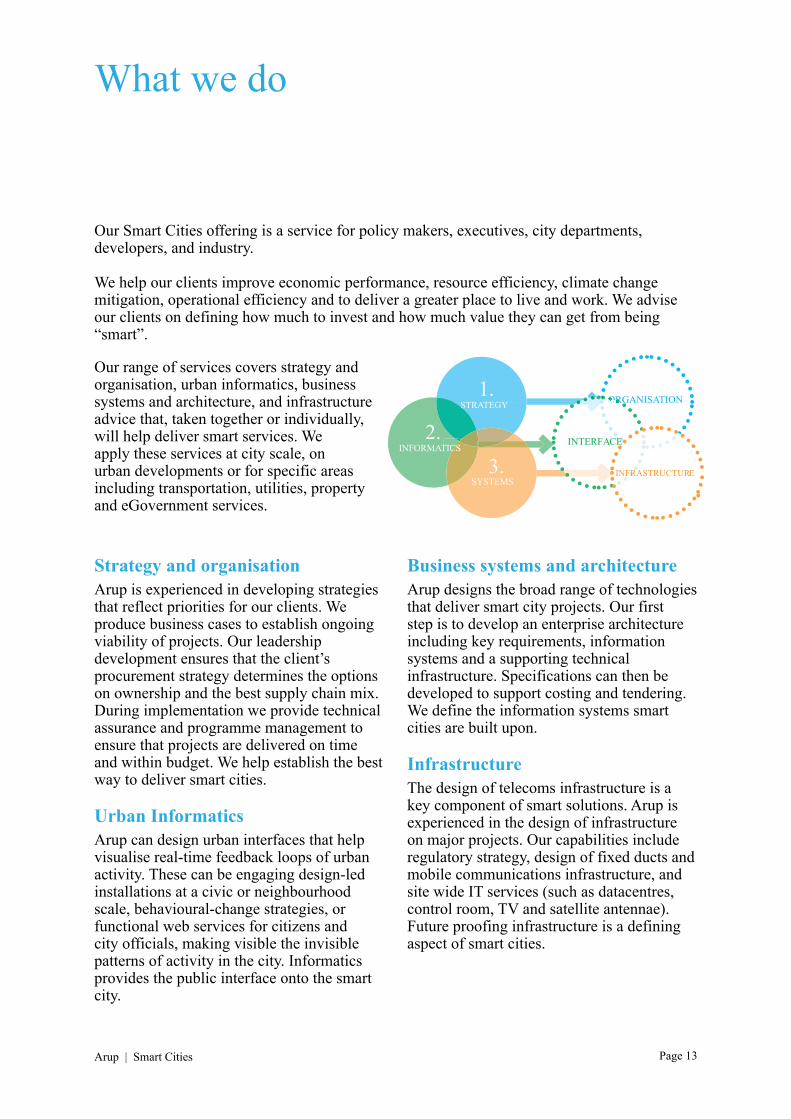
Strategy and organisationArup is experienced in developing strategies that reflect priorities for our clients. We produce business cases to establish ongoing viability of projects. Our leadership development ensures that the client’s procurement strategy determines the options on ownership and the best supply chain mix. During implementation we provide technical assurance and programme management to ensure that projects are delivered on time and within budget. We help establish the best way to deliver smart cities.
Urban InformaticsArup can design urban interfaces that help visualise real-time feedback loops of urban activity. These can be engaging design-led installations at a civic or neighbourhood scale, behavioural-change strategies, or functional web services for citizens and city officials, making visible the invisible patterns of activity in the city. Informatics provides the public interface onto the smart city.
Business systems and architectureArup designs the broad range of technologies that deliver smart city projects. Our first step is to develop an enterprise architecture including key requirements, information systems and a supporting technical infrastructure. Specifications can then be developed to support costing and tendering. We define the information systems smart cities are built upon.
InfrastructureThe design of telecoms infrastructure is a key component of smart solutions. Arup is experienced in the design of infrastructure on major projects. Our capabilities include regulatory strategy, design of fixed ducts and mobile communications infrastructure, and site wide IT services (such as datacentres, control room, TV and satellite antennae). Future proofing infrastructure is a defining aspect of smart cities.
1. ORGANISATIONAR
2. S
OROR
INTERFACEE
INFRASTRUCTURE
CSCS
3.
STRATEGY
SYSTEMS
CSINFORMATICS
Our range of services covers strategy and organisation, urban informatics, business systems and architecture, and infrastructure advice that, taken together or individually, will help deliver smart services. We apply these services at city scale, on urban developments or for specific areas including transportation, utilities, property and eGovernment services.
Arup | Smart Cities
Page 14
Smart Cities workshop reports
Arup’s Smart Cities workshop reports are the output of Arup Smart Cities workshops.
The workshop report is designed to collate into one concise document the workshop findings, key recommendations and a tailored road map to a Smart City that provides a bespoke solution to each city’s environmental, social, economic and political context, with case studies and research as supporting evidence. It can include prototypes of urban services, such as those described later in ‘Urban Informatics examples’.
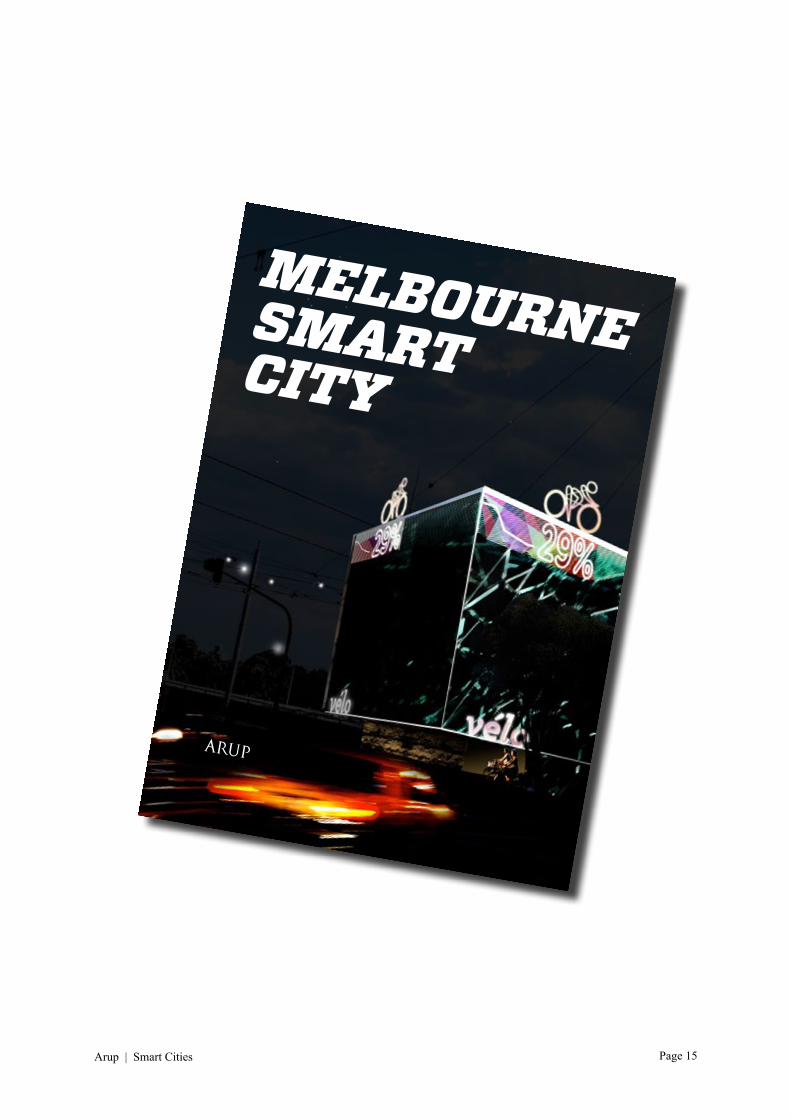
Melbourne Smart City is one such report produced as a result of the C40 UrbanLife workshop in March 2010, and is available to C40 cities and others, via the contacts listed at the back of this document.
Arup and the City of Melbourne worked together to produce a workshop under the C40 UrbanLife programme in March 2010.
The workshop addressed the possibilities of a ‘smart city’ in terms of reduction of greenhouse gas emissions (GHG) as part of a broader urban sustainability agenda for Melbourne.
Within this scope, particular focus was placed on the possibilities of enabling behavioural change via community engagement using contemporary information and communications technology (ICT) to generate a resilient and sustainable urbanism.
The report is primarily centred on initially helping reduce Melbourne’s GHG but also drawing in other aspects of sustainability (mobility, food, systems, economic development and so on).
As such, the workshop decribed an initial approach to understanding this new soft infrastructure of the city, seeing the city as a system in an ‘ecological age ‘vision, enabling behavioural change and demand management through urban informatics as well as deploying efficient operation and governance.
Page 15
MELBOURNESMARTCITY
Arup | Smart Cities
Page 16
Smart Cities case studies
The following case studies indicate the range of smart city work being conducted by Arup globally and highlight the potential of the smart city approach.
Page 17
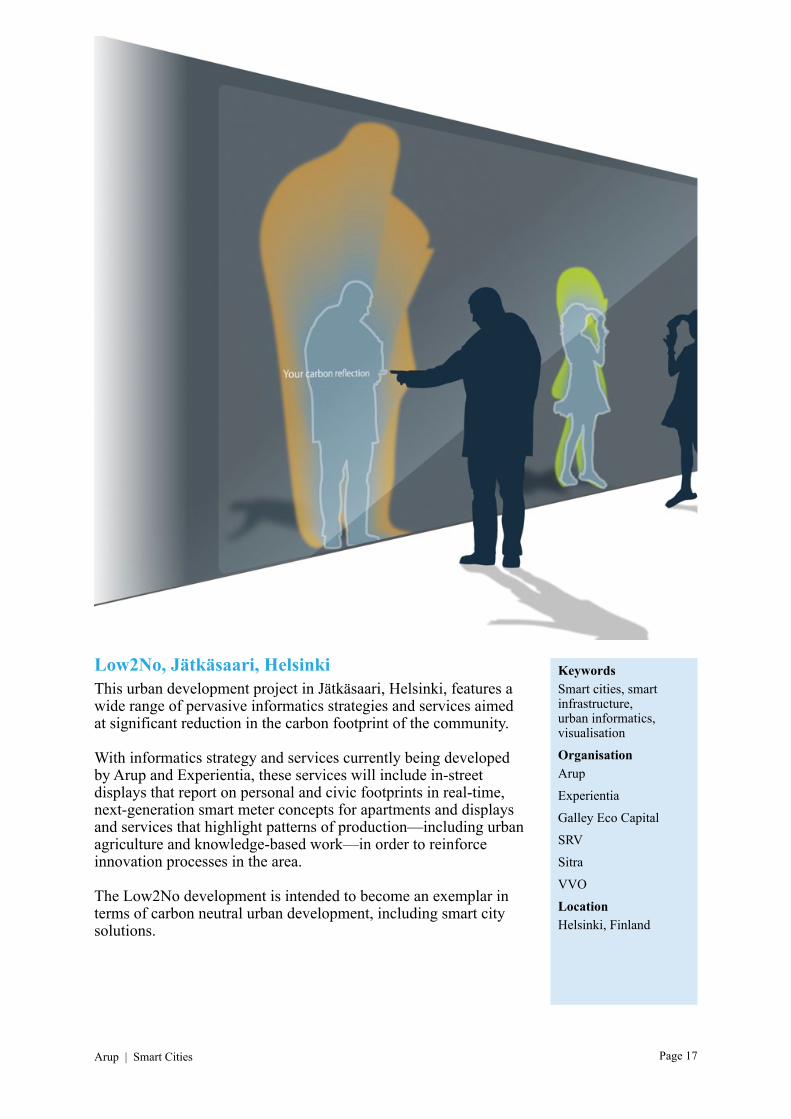
Low2No, Jätkäsaari, HelsinkiThis urban development project in Jätkäsaari, Helsinki, features a wide range of pervasive informatics strategies and services aimed at significant reduction in the carbon footprint of the community.
With informatics strategy and services currently being developed by Arup and Experientia, these services will include in-street displays that report on personal and civic footprints in real-time, next-generation smart meter concepts for apartments and displays and services that highlight patterns of production—including urban agriculture and knowledge-based work—in order to reinforce innovation processes in the area.
The Low2No development is intended to become an exemplar in terms of carbon neutral urban development, including smart city solutions.
KeywordsSmart cities, smart infrastructure, urban informatics, visualisation
OrganisationArup
Experientia
Galley Eco Capital
SRV
Sitra
VVO
LocationHelsinki, Finland
Arup | Smart Cities
Page 18
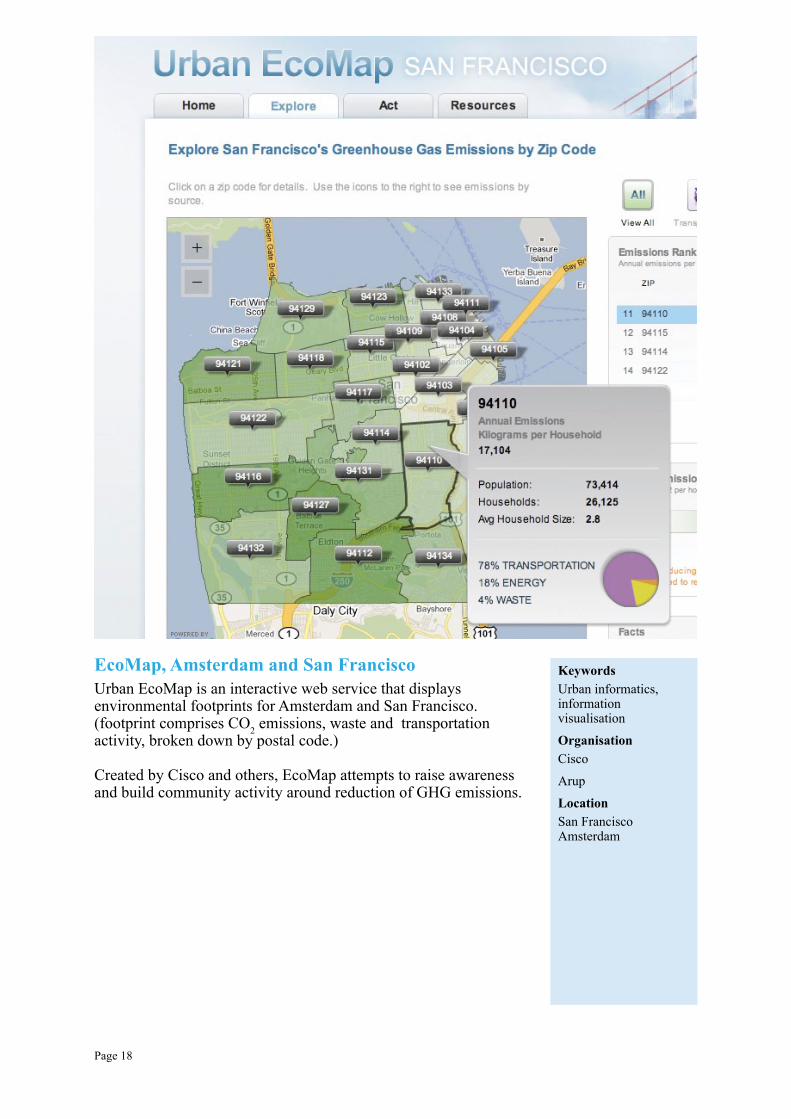
EcoMap, Amsterdam and San FranciscoUrban EcoMap is an interactive web service that displays environmental footprints for Amsterdam and San Francisco. (footprint comprises CO2 emissions, waste and transportation activity, broken down by postal code.)
Created by Cisco and others, EcoMap attempts to raise awareness and build community activity around reduction of GHG emissions.
KeywordsUrban informatics, information visualisation
OrganisationCisco
Arup
LocationSan Francisco Amsterdam
Page 19
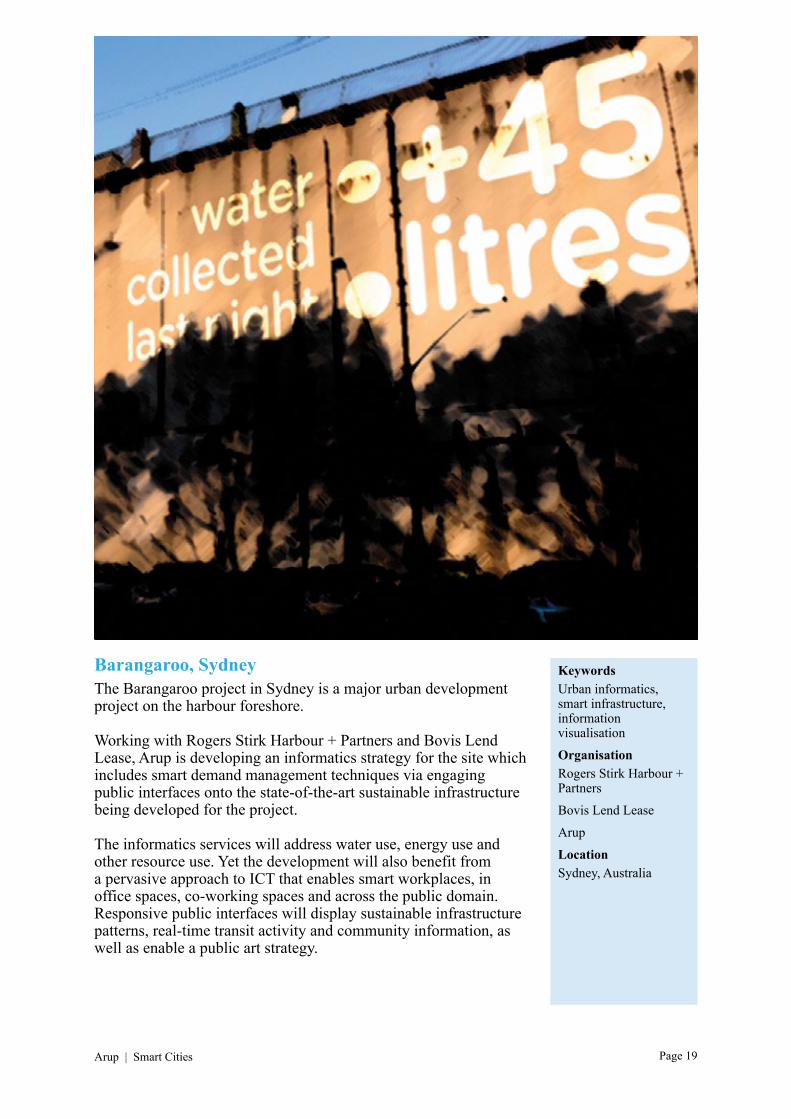
Barangaroo, SydneyThe Barangaroo project in Sydney is a major urban development project on the harbour foreshore.
Working with Rogers Stirk Harbour + Partners and Bovis Lend Lease, Arup is developing an informatics strategy for the site which includes smart demand management techniques via engaging public interfaces onto the state-of-the-art sustainable infrastructure being developed for the project.
The informatics services will address water use, energy use and other resource use. Yet the development will also benefit from a pervasive approach to ICT that enables smart workplaces, in office spaces, co-working spaces and across the public domain. Responsive public interfaces will display sustainable infrastructure patterns, real-time transit activity and community information, as well as enable a public art strategy.
KeywordsUrban informatics, smart infrastructure, information visualisation
OrganisationRogers Stirk Harbour + Partners
Bovis Lend Lease
Arup
LocationSydney, Australia
Arup | Smart Cities
Page 20
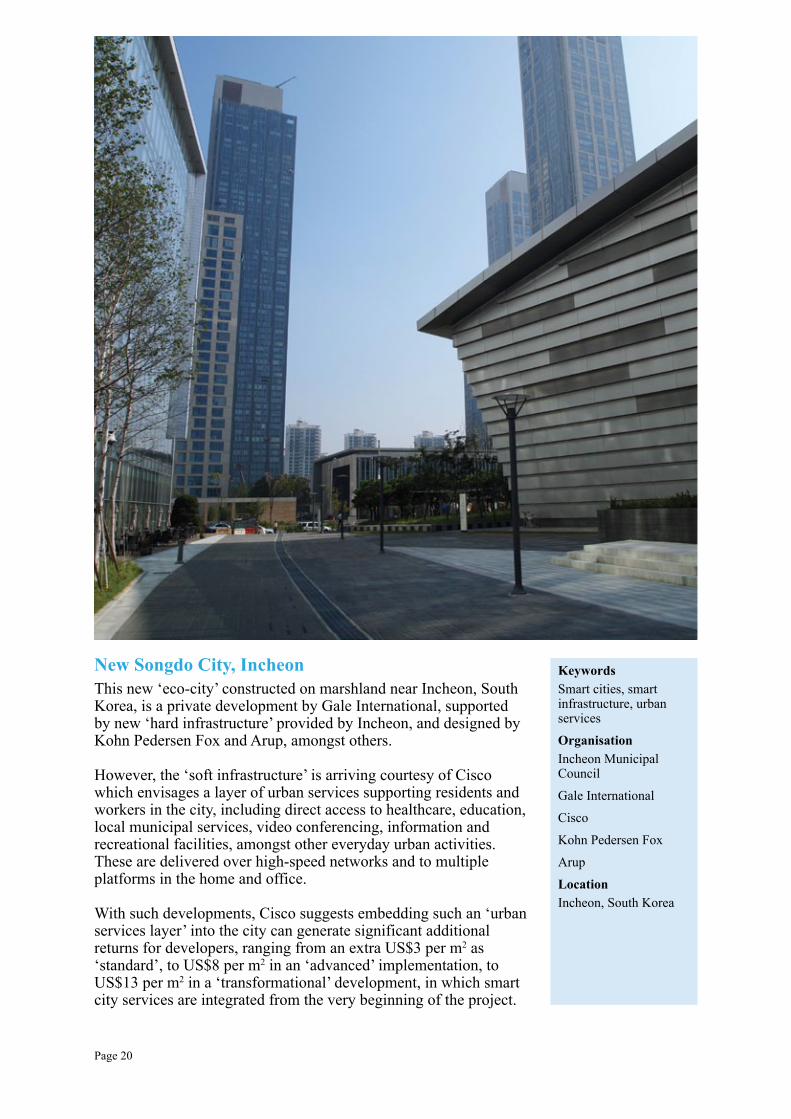
New Songdo City, IncheonThis new ‘eco-city’ constructed on marshland near Incheon, South Korea, is a private development by Gale International, supported by new ‘hard infrastructure’ provided by Incheon, and designed by Kohn Pedersen Fox and Arup, amongst others.
However, the ‘soft infrastructure’ is arriving courtesy of Cisco which envisages a layer of urban services supporting residents and workers in the city, including direct access to healthcare, education, local municipal services, video conferencing, information and recreational facilities, amongst other everyday urban activities. These are delivered over high-speed networks and to multiple platforms in the home and office.
With such developments, Cisco suggests embedding such an ‘urban services layer’ into the city can generate significant additional returns for developers, ranging from an extra US$3 per m2 as ‘standard’, to US$8 per m2 in an ‘advanced’ implementation, to US$13 per m2 in a ‘transformational’ development, in which smart city services are integrated from the very beginning of the project.
KeywordsSmart cities, smart infrastructure, urban services
OrganisationIncheon Municipal Council
Gale International
Cisco
Kohn Pedersen Fox
Arup
LocationIncheon, South Korea
Page 21
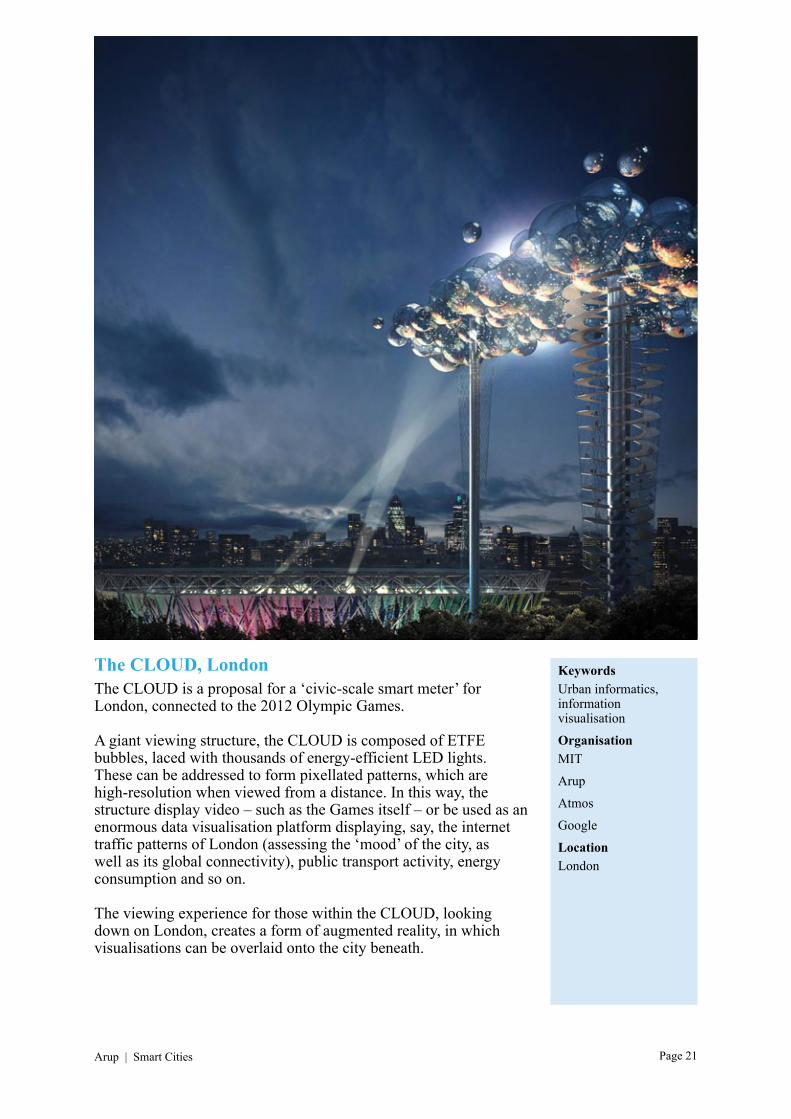
The CLOUD, LondonThe CLOUD is a proposal for a ‘civic-scale smart meter’ for London, connected to the 2012 Olympic Games. A giant viewing structure, the CLOUD is composed of ETFE bubbles, laced with thousands of energy-efficient LED lights. These can be addressed to form pixellated patterns, which are high-resolution when viewed from a distance. In this way, the structure display video – such as the Games itself – or be used as an enormous data visualisation platform displaying, say, the internet traffic patterns of London (assessing the ‘mood’ of the city, as well as its global connectivity), public transport activity, energy consumption and so on.
The viewing experience for those within the CLOUD, looking down on London, creates a form of augmented reality, in which visualisations can be overlaid onto the city beneath.
KeywordsUrban informatics, information visualisation
OrganisationMIT
Arup
Atmos
LocationLondon
Arup | Smart Cities
Page 22
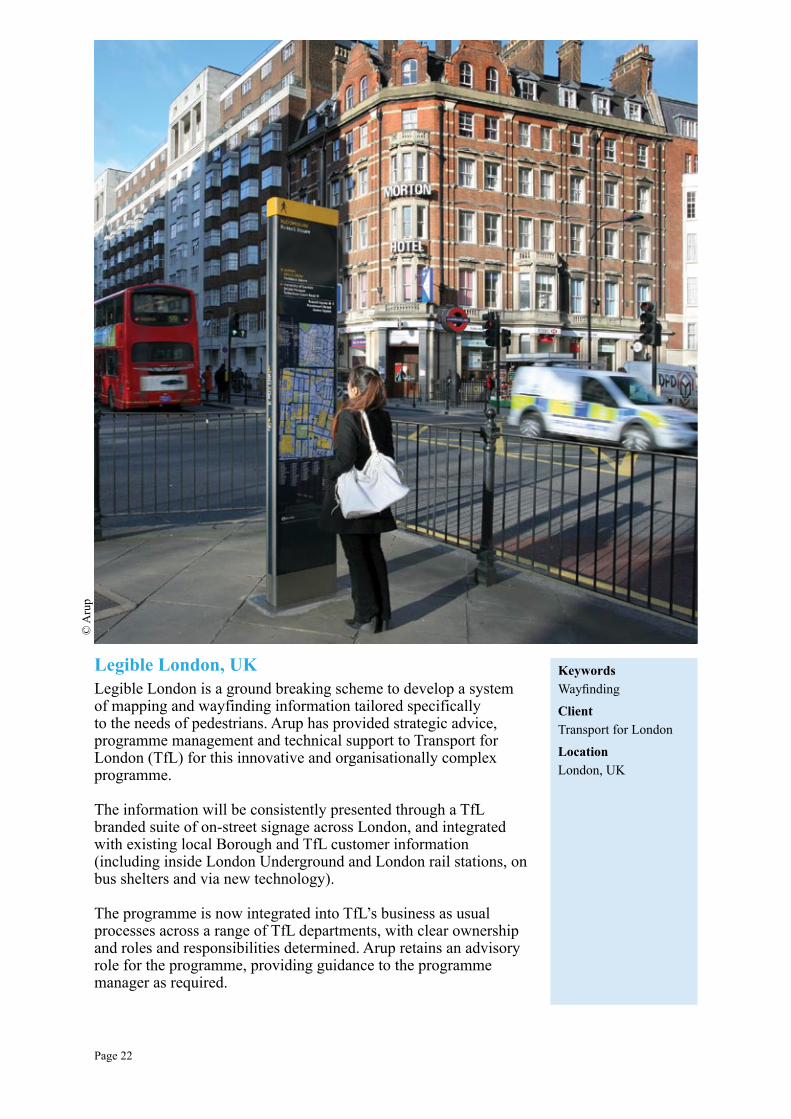
Legible London, UKLegible London is a ground breaking scheme to develop a system of mapping and wayfinding information tailored specifically to the needs of pedestrians. Arup has provided strategic advice, programme management and technical support to Transport for London (TfL) for this innovative and organisationally complex programme.
The information will be consistently presented through a TfL branded suite of on-street signage across London, and integrated with existing local Borough and TfL customer information (including inside London Underground and London rail stations, on bus shelters and via new technology).
The programme is now integrated into TfL’s business as usual processes across a range of TfL departments, with clear ownership and roles and responsibilities determined. Arup retains an advisory role for the programme, providing guidance to the programme manager as required.
KeywordsWayfinding
ClientTransport for London
LocationLondon, UK
© A
rup
Page 23
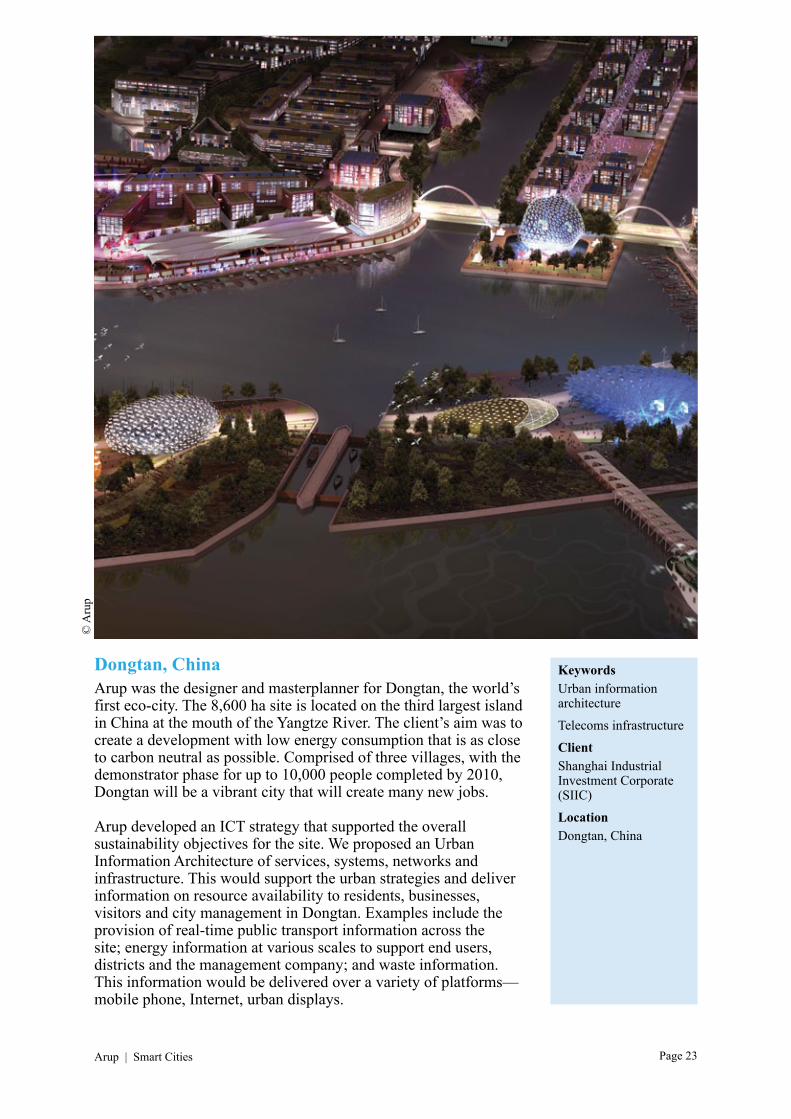
Dongtan, ChinaArup was the designer and masterplanner for Dongtan, the world’s first eco-city. The 8,600 ha site is located on the third largest island in China at the mouth of the Yangtze River. The client’s aim was to create a development with low energy consumption that is as close to carbon neutral as possible. Comprised of three villages, with the demonstrator phase for up to 10,000 people completed by 2010, Dongtan will be a vibrant city that will create many new jobs.
Arup developed an ICT strategy that supported the overall sustainability objectives for the site. We proposed an Urban Information Architecture of services, systems, networks and infrastructure. This would support the urban strategies and deliver information on resource availability to residents, businesses, visitors and city management in Dongtan. Examples include the provision of real-time public transport information across the site; energy information at various scales to support end users, districts and the management company; and waste information. This information would be delivered over a variety of platforms—mobile phone, Internet, urban displays.
KeywordsUrban information architecture
Telecoms infrastructure
ClientShanghai Industrial Investment Corporate (SIIC)
LocationDongtan, China
© A
rup
Arup | Smart Cities
Page 24
Urban informatics examples
Arup produced a series of fictional example visualisations of potential informatics services for a C40 UrbanLife workshop in Melbourne in March 2010.
The images centre on both Melbourne and the workshop’s themes, and worked as ‘sketches’ to help make concrete the content of the workshop without directing it. Note that not all are intended to be exemplars; some illustrate issues with visualisation- or informatics-led approaches, and are used in a collaborative workshop context.
Page 25
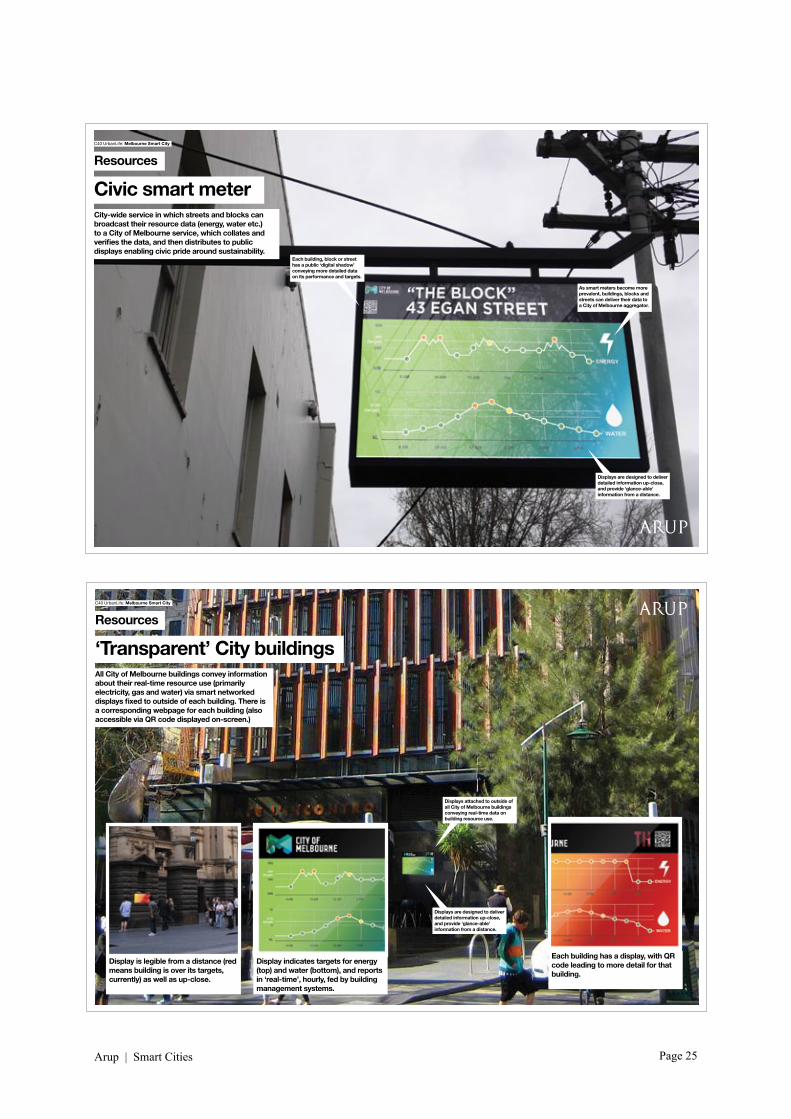
Civic smart meterCity-wide service in which streets and blocks can broadcast their resource data (energy, water etc.) to a City of Melbourne service, which collates and verifies the data, and then distributes to public displays enabling civic pride around sustainability.
Resources
Each building, block or street has a public ‘digital shadow’ conveying more detailed data on its performance and targets.
As smart meters become more prevalent, buildings, blocks and streets can deliver their data to a City of Melbourne aggregator.
C40 UrbanLife: Melbourne Smart City
Displays are designed to deliver detailed information up-close, and provide ‘glance-able’ information from a distance.
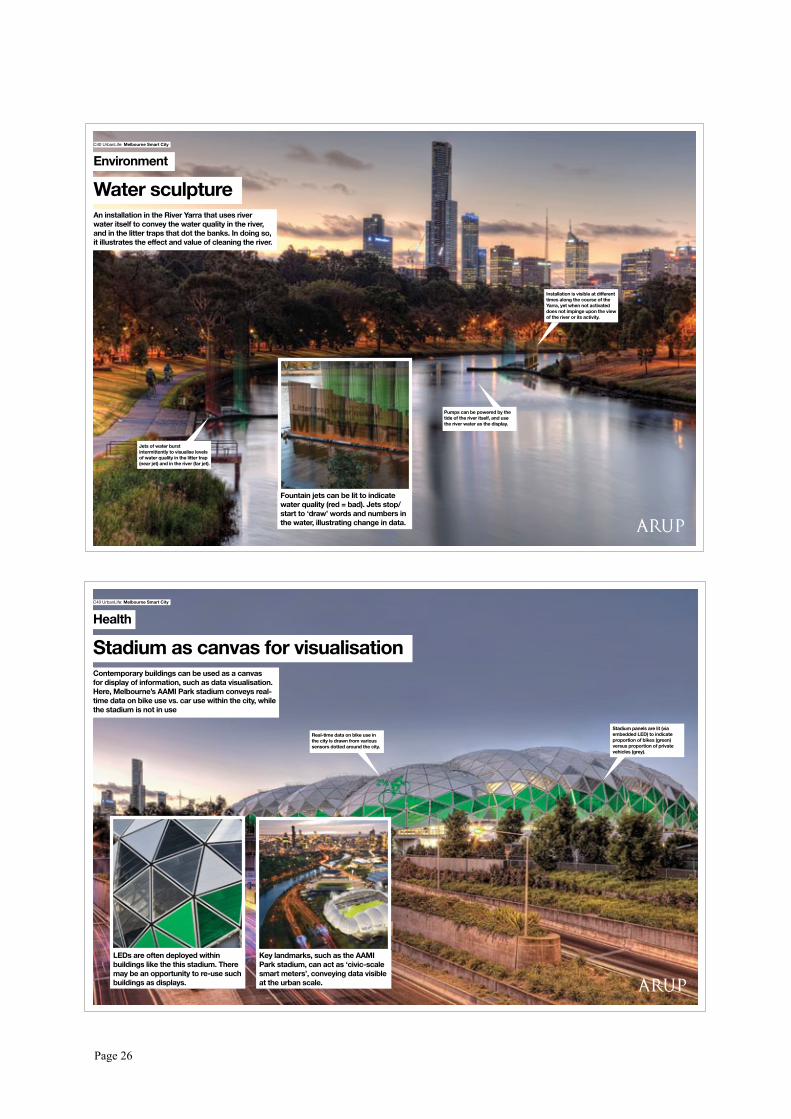
‘Transparent’ City buildingsAll City of Melbourne buildings convey information about their real-time resource use (primarily electricity, gas and water) via smart networked displays fixed to outside of each building. There is a corresponding webpage for each building (also accessible via QR code displayed on-screen.)
Resources
Displays attached to outside of all City of Melbourne buildings conveying real-time data on building resource use.
Displays are designed to deliver detailed information up-close, and provide ‘glance-able’ information from a distance.
C40 UrbanLife: Melbourne Smart City
Display indicates targets for energy (top) and water (bottom), and reports in ‘real-time’, hourly, fed by building management systems.
Each building has a display, with QR code leading to more detail for that building.
Display is legible from a distance (red means building is over its targets, currently) as well as up-close.
Arup | Smart Cities
Page 26
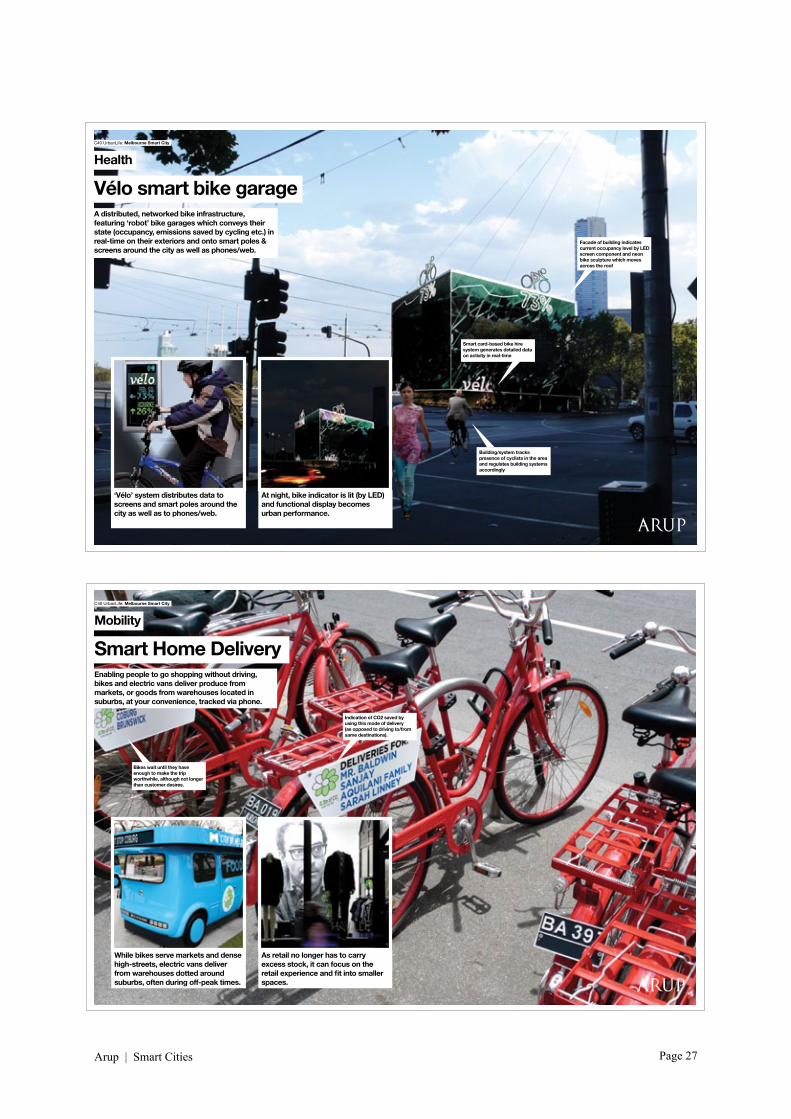
Water sculptureAn installation in the River Yarra that uses river water itself to convey the water quality in the river, and in the litter traps that dot the banks. In doing so, it illustrates the effect and value of cleaning the river.
Environment
Installation is visible at different times along the course of the Yarra, yet when not activated does not impinge upon the view of the river or its activity.
Pumps can be powered by the tide of the river itself, and use the river water as the display.
Jets of water burst intermittently to visualise levels of water quality in the litter trap (near jet) and in the river (far jet).
Fountain jets can be lit to indicate water quality (red = bad). Jets stop/start to ‘draw’ words and numbers in the water, illustrating change in data.
C40 UrbanLife: Melbourne Smart City
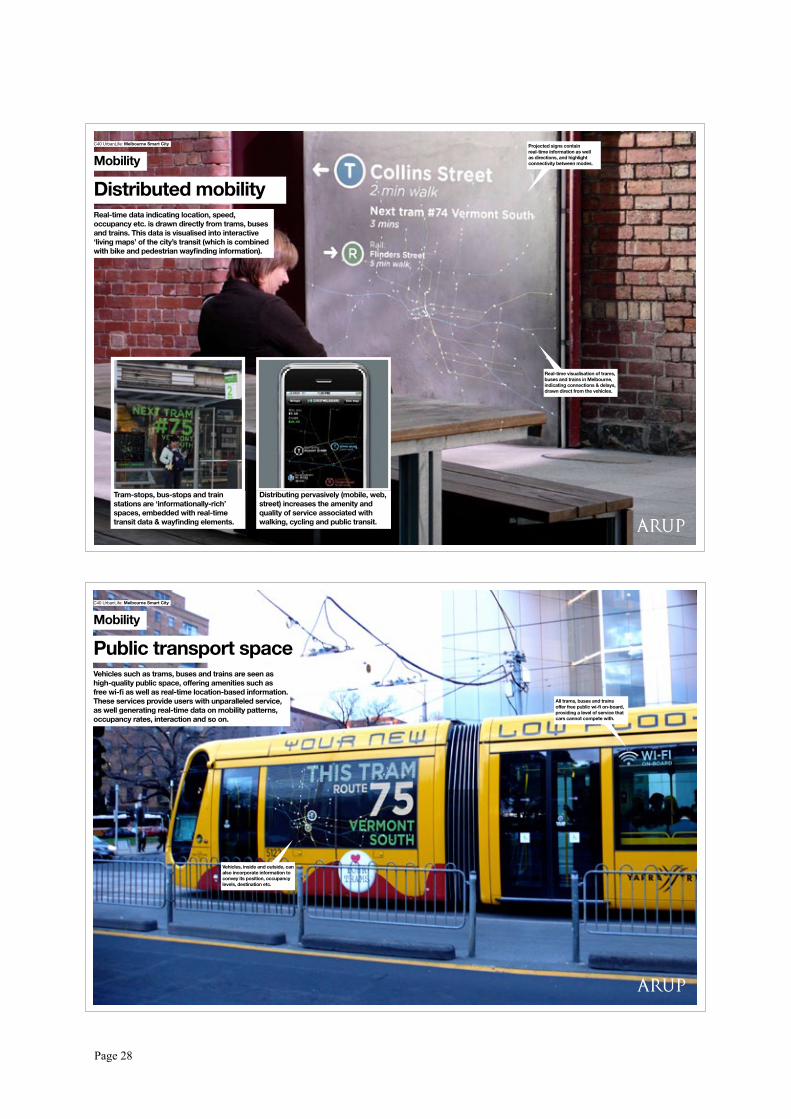
Stadium as canvas for visualisationContemporary buildings can be used as a canvas for display of information, such as data visualisation. Here, Melbourne’s AAMI Park stadium conveys real-time data on bike use vs. car use within the city, while the stadium is not in use
Health
Stadium panels are lit (via embedded LED) to indicate proportion of bikes (green) versus proportion of private vehicles (grey).
Real-time data on bike use in the city is drawn from various sensors dotted around the city.
LEDs are often deployed within buildings like the this stadium. There may be an opportunity to re-use such buildings as displays.
Key landmarks, such as the AAMI Park stadium, can act as ‘civic-scale smart meters’, conveying data visible at the urban scale.
C40 UrbanLife: Melbourne Smart City
Page 27
Vélo smart bike garageA distributed, networked bike infrastructure, featuring ‘robot’ bike garages which conveys their state (occupancy, emissions saved by cycling etc.) in real-time on their exteriors and onto smart poles & screens around the city as well as phones/web.
Health
Facade of building indicates current occupancy level by LED screen component and neon bike sculpture which moves across the roof
Building/system tracks presence of cyclists in the area and regulates building systems accordingly
Smart card-based bike hire system generates detailed data on activity in real-time
At night, bike indicator is lit (by LED) and functional display becomes urban performance.
‘Vélo’ system distributes data to screens and smart poles around the city as well as to phones/web.
C40 UrbanLife: Melbourne Smart City
Smart Home DeliveryEnabling people to go shopping without driving, bikes and electric vans deliver produce from markets, or goods from warehouses located in suburbs, at your convenience, tracked via phone.
Mobility
Indication of CO2 saved by using this mode of delivery (as opposed to driving to/from same destinations).
As retail no longer has to carry excess stock, it can focus on the retail experience and fit into smaller spaces.
While bikes serve markets and dense high-streets, electric vans deliver from warehouses dotted around suburbs, often during off-peak times.
C40 UrbanLife: Melbourne Smart City
Bikes wait until they have enough to make the trip worthwhile, although not longer than customer desires.
Arup | Smart Cities
Page 28
Distributed mobilityReal-time data indicating location, speed, occupancy etc. is drawn directly from trams, buses and trains. This data is visualised into interactive ‘living maps’ of the city’s transit (which is combined with bike and pedestrian wayfinding information).
Mobility
Real-time visualisation of trams, buses and trains in Melbourne, indicating connections & delays, drawn direct from the vehicles.
Tram-stops, bus-stops and train stations are ‘informationally-rich’ spaces, embedded with real-time transit data & wayfinding elements.
Distributing pervasively (mobile, web, street) increases the amenity and quality of service associated with walking, cycling and public transit.
C40 UrbanLife: Melbourne Smart City Projected signs contain real-time information as well as directions, and highlight connectivity between modes.
Public transport spaceVehicles such as trams, buses and trains are seen as high-quality public space, offering amenities such as free wi-fi as well as real-time location-based information. These services provide users with unparalleled service, as well generating real-time data on mobility patterns, occupancy rates, interaction and so on.
Mobility
C40 UrbanLife: Melbourne Smart City
All trams, buses and trains offer free public wi-fi on-board, providing a level of service that cars cannot compete with.
Vehicles, inside and outside, can also incorporate information to convey its position, occupancy levels, destination etc.
Page 29
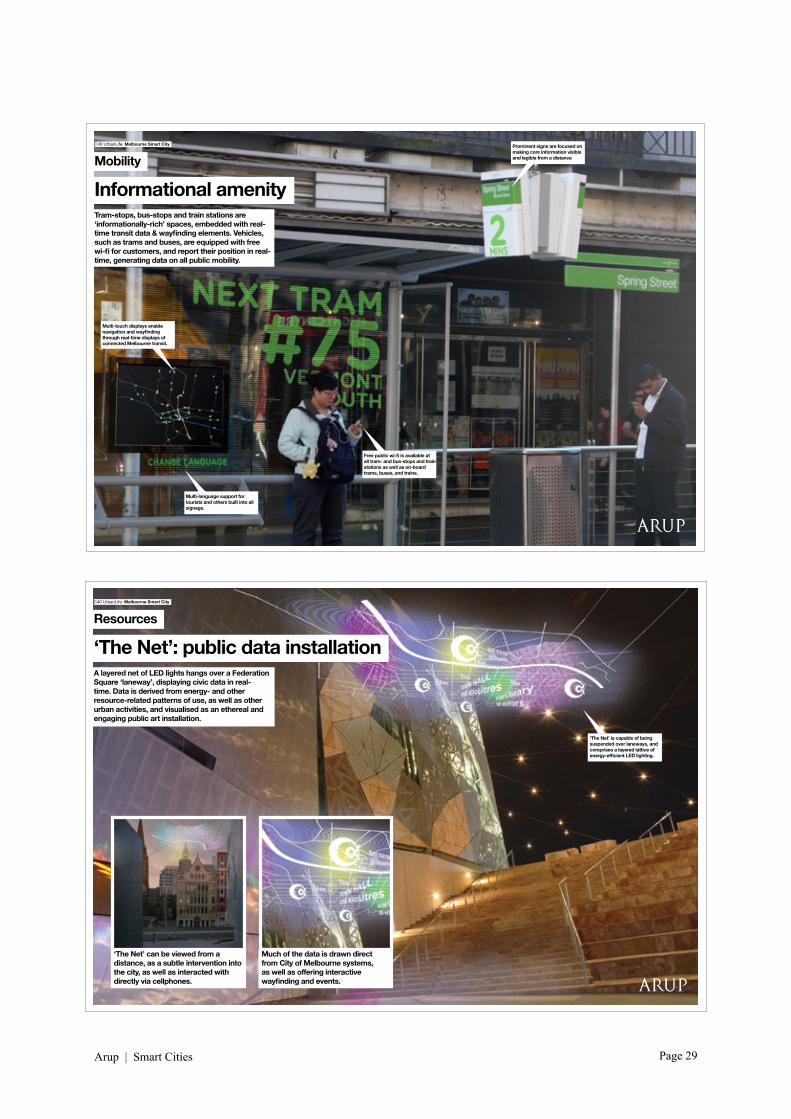
Informational amenityTram-stops, bus-stops and train stations are ‘informationally-rich’ spaces, embedded with real-time transit data & wayfinding elements. Vehicles, such as trams and buses, are equipped with free wi-fi for customers, and report their position in real-time, generating data on all public mobility.
Mobility
C40 UrbanLife: Melbourne Smart City Prominent signs are focused on making core information visible and legible from a distance
Free public wi-fi is available at all tram- and bus-stops and train stations as well as on-board trams, buses, and trains.
Multi-language support for tourists and others built into all signage.
Multi-touch displays enable navigation and wayfinding through real-time displays of connected Melbourne transit.
‘The Net’: public data installationA layered net of LED lights hangs over a Federation Square ‘laneway’, displaying civic data in real-time. Data is derived from energy- and other resource-related patterns of use, as well as other urban activities, and visualised as an ethereal and engaging public art installation.
Resources
‘The Net’ is capable of being suspended over laneways, and comprises a layered lattice of energy-efficient LED lighting.
Much of the data is drawn direct from City of Melbourne systems, as well as offering interactive wayfinding and events.
‘The Net’ can be viewed from a distance, as a subtle intervention into the city, as well as interacted with directly via cellphones.
C40 UrbanLife: Melbourne Smart City
Arup | Smart Cities
Page 30
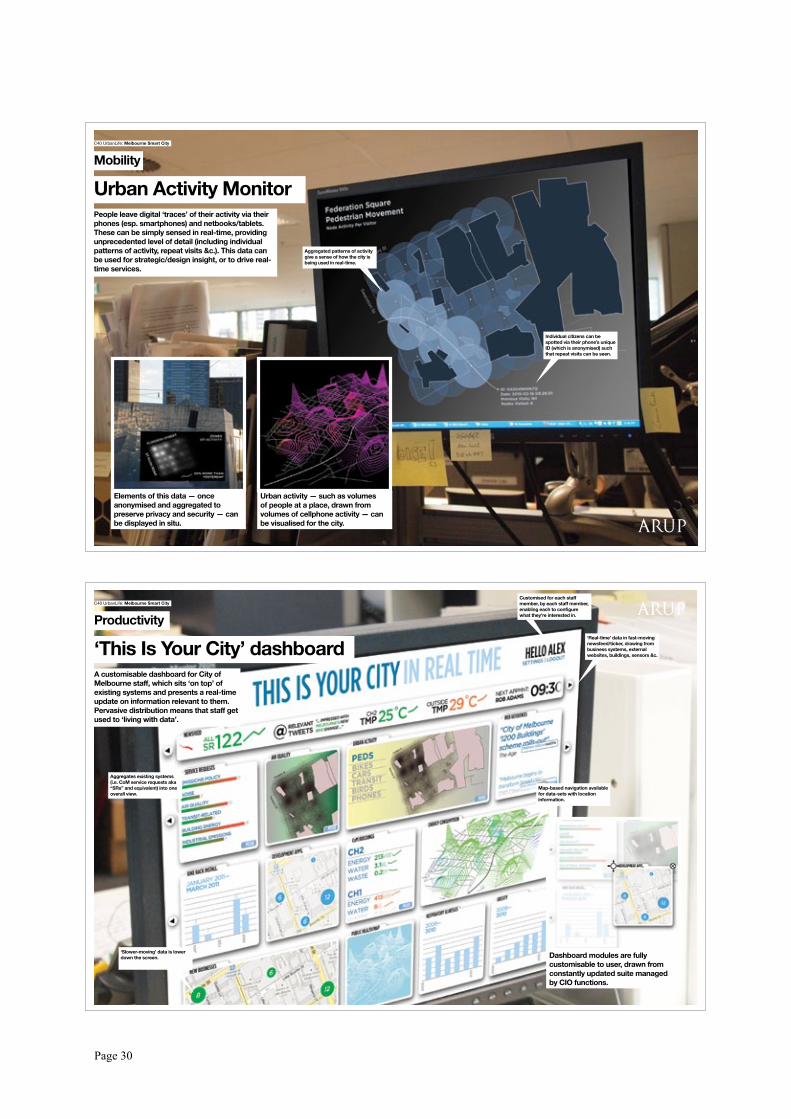
Urban Activity MonitorPeople leave digital ‘traces’ of their activity via their phones (esp. smartphones) and netbooks/tablets. These can be simply sensed in real-time, providing unprecedented level of detail (including individual patterns of activity, repeat visits &c.). This data can be used for strategic/design insight, or to drive real-time services.
Mobility
Individual citizens can be spotted via their phone’s unique ID (which is anonymised) such that repeat visits can be seen.
Aggregated patterns of activity give a sense of how the city is being used in real-time.
Elements of this data — once anonymised and aggregated to preserve privacy and security — can be displayed in situ.
Urban activity — such as volumes of people at a place, drawn from volumes of cellphone activity — can be visualised for the city.
C40 UrbanLife: Melbourne Smart City
‘This Is Your City’ dashboardA customisable dashboard for City of Melbourne staff, which sits ‘on top’ of existing systems and presents a real-time update on information relevant to them. Pervasive distribution means that staff get used to ‘living with data’.
Productivity
Customised for each staff member, by each staff member, enabling each to configure what they’re interested in.
‘Real-time’ data in fast-moving newsfeed/ticker, drawing from business systems, external websites, buildings, sensors &c.
Map-based navigation available for data-sets with location information.
Dashboard modules are fully customisable to user, drawn from constantly updated suite managed by CIO functions.
C40 UrbanLife: Melbourne Smart City
‘Slower-moving’ data is lower down the screen.
Aggregates existing systems (i.e. CoM service requests aka “SRs” and equivalent) into one overall view.
This report has been published by Arup’s IT & Communications Systems team.
©Arup 2010
About Arup Arup is the creative force at the heart of many of the world’s most prominent projects in the built environment and across industry. We offer a broad range of professional services that combine to make a real difference to our clients and the communities in which we work. We are truly global. From 90 offices in 35 countries our 10,000 planners, designers, engineers and consultants deliver innovative projects across the world with creativity and passion. Founded in 1946 with an enduring set of values, our unique trust ownership fosters a distinctive culture and an intellectual independence that encourages collaborative working. This is reflected in everything we do, allowing us to develop meaningful ideas, help shape agendas and deliver results that frequently surpass the expectations of our clients. The people at Arup are driven to find a better way and to deliver better solutions for our clients. We shape a better world.
ContactsVolker Buscher (London)[email protected]
Léan Doody (London)[email protected]
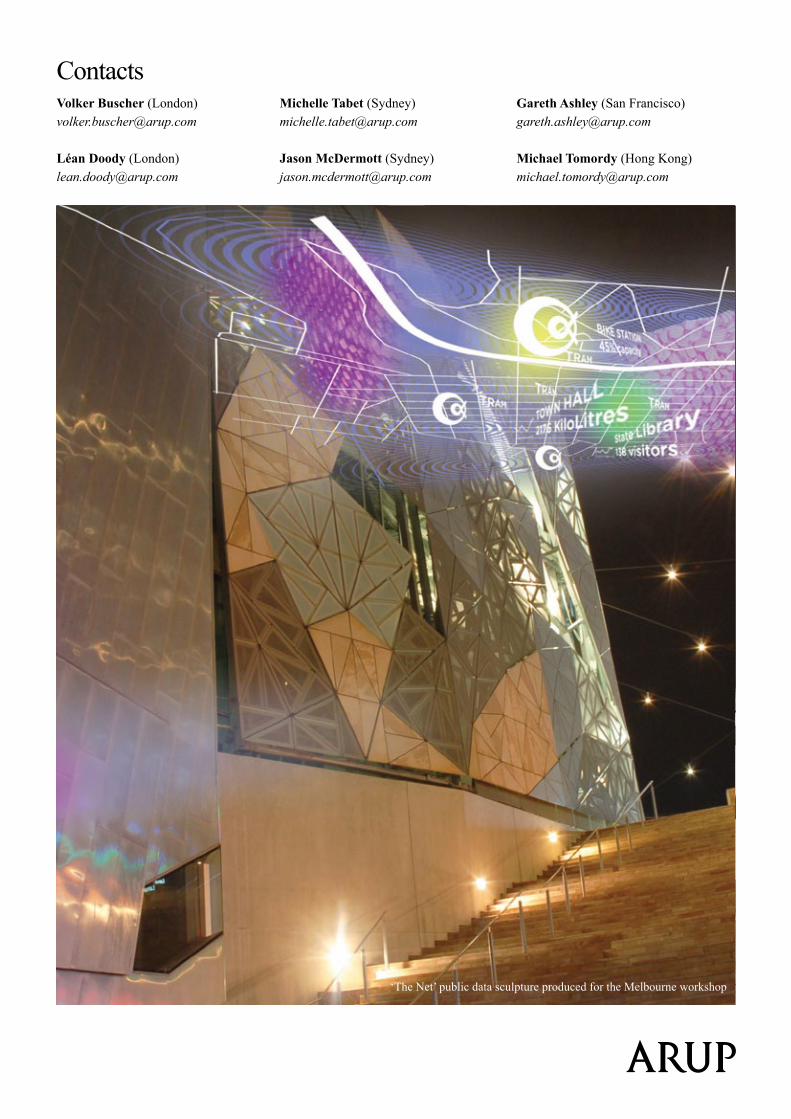
‘The Net’ public data sculpture produced for the Melbourne workshop
Gareth Ashley (San Francisco)[email protected]
Michael Tomordy (Hong Kong)[email protected]
Michelle Tabet (Sydney)[email protected]
Jason McDermott (Sydney)[email protected]