Small Hydropower Stations in Greece: The local...
63
This is a preprint of the paper submitted to Renewable and Sustainable Energy Reviews Small Hydropower Stations in Greece: The Local People’s Attitudes in a Mountainous Prefecture Chrisovalantis Malesios a,* and Garyfallos Arabatzis b a Department of Agricultural Development, Democritus University of Thrace, Pantazidou 193, Orestiada, e-mail: [email protected] b Department of Forestry and Management of the Environment and Natural Resources, Democritus University of Thrace, Pantazidou 193, Orestiada, e-mail: [email protected] ABSTRACT During the last years, it has become evident that operation of hydropower stations creates discussions and different views on the local communities. Especially, although the issue of operation of small hydropower (SHP) stations or plants is of considerable interest in Greece, almost no study has been conducted to investigate the current status of Greek citizens’ attitudes towards utilization of the available hydro power potential through SHP. The present study, therefore, aims to examine in the prefecture of Ioannina, Greece, the local peoples’ attitudes on operation of SHP stations in connection with the increased public interest for environmental and social dimensions of small hydropower stations, and to determine how these attitudes change with respect to various factors. Key words: SHP, attitudes, people, willingness to pay, Greece 1. Introduction Population growth combined with human effort to improve the standard of living has led to rapidly consumed enormous energy reserves for the creation of which was required to spend thousands of years. In particular fossil fuels are currently the main source of energy for both developed and developing countries, contributing thus decisively to their development, since that economic development of a country is in line
Transcript of Small Hydropower Stations in Greece: The local...

This is a preprint of the paper submitted to Renewable and Sustainable Energy Reviews
Small Hydropower Stations in Greece: The Local People’s Attitudes in
a Mountainous Prefecture
Chrisovalantis Malesios a,*
and Garyfallos Arabatzis b
aDepartment of Agricultural Development, Democritus University of Thrace, Pantazidou 193,
Orestiada, e-mail: [email protected]
bDepartment of Forestry and Management of the Environment and Natural Resources,
Democritus University of Thrace, Pantazidou 193, Orestiada, e-mail: [email protected]
ABSTRACT
During the last years, it has become evident that operation of hydropower stations
creates discussions and different views on the local communities. Especially, although
the issue of operation of small hydropower (SHP) stations or plants is of considerable
interest in Greece, almost no study has been conducted to investigate the current status
of Greek citizens’ attitudes towards utilization of the available hydro power potential
through SHP. The present study, therefore, aims to examine in the prefecture of
Ioannina, Greece, the local peoples’ attitudes on operation of SHP stations in connection
with the increased public interest for environmental and social dimensions of small
hydropower stations, and to determine how these attitudes change with respect to
various factors.
Key words: SHP, attitudes, people, willingness to pay, Greece
1. Introduction
Population growth combined with human effort to improve the standard of living
has led to rapidly consumed enormous energy reserves for the creation of which was
required to spend thousands of years. In particular fossil fuels are currently the main
source of energy for both developed and developing countries, contributing thus
decisively to their development, since that economic development of a country is in line

2
with energy consumption, due to the close association between GDP and in capita
energy consumption [1, 2].
The energy problem along with the problem of environmental pollution has become
particularly important and their resolution has become imperative globally. The interest
which has been created towards reducing consumption of fossil fuels, is supported by
parallel efforts to reduce pollutants emitted into the atmosphere as well as the so-called
greenhouse gases, which are considered as potential climate change factors [3 – 5].
In many technologically advanced countries, measures are taken for the sustainable
management of energy based on the substitution of fossil fuels with renewable energy
as well as energy conservation.
The renewable energy sources (RESs) (wind, solar, hydro, biomass) for many
countries (developed and developing) are an important source of energy with positive
prospects as concerns their contribution to energy mix, contributing significantly to
reducing energy dependency of mankind on finite energy sources (especially the
expensive imported oil) and strengthening the security of their energy supply. Also their
positive effects on emissions of CO2 and other pollutants, the creation of new
businesses and employment, rural development, namely strengthens the three pillars of
sustainable development [5 – 7]. At the same time the implementation of RES projects
(mainly wind farms) is accompanied several times by reactions of local communities,
people with conflicting interests and environmental organizations [8, 9].
The European Union has taken major initiatives to promote renewable energy
sources. The Directive 2001/77 prioritizes the increase of RES contribution, allocates
obligations under the Kyoto Protocol on member states - and sets the Community
framework. The target for the 2010 electricity production from RESs is around 12% of
gross energy consumption and 22.1% for the consumption of electricity, and the
national targets are distributed accordingly.
Member - States are asked to take measures to remove any legal-administrative
obstacles to fulfill their commitments. Each country is required in drafting national
reports on the evolution of the penetration of renewable energy every two years and the
Commission shall deliver every five years relevant reports to the Council, which
analyzes the progress, redefines goals and analyzes the perspectives and proposed
measures for the future.

3
Today the greater part of energy produced by renewable natural resources is related
to water. Hydropower is an important natural resource and the largest one used for
electricity [10]. A hydrodynamic facility has continuous operation, does not emit carbon
dioxide and other pollutants, and has longer life compared to plants based on coal or
nuclear energy.
Hydropower is a renewable energy source since it uses the energy from the naturally
replenished hydrological cycle. Currently, hydropower stands for more than 9/10 of all
renewable energy generated, and constitutes one of the most viable future energy
sources.
Some of the main beneficial characteristics of hydropower are the following [11]:
It uses resources that are widely available around the world
It has been proven a reliable and advanced technology, with more than a
century of experience
It has the lowest operating costs and the longest plant life, compared with
other large scale technologies for power generation
The fuel of hydropower energy (i.e. water) is a renewable source of energy,
not subjected to market fluctuations
2. Hydropower Generation in World - EU
According to available data the new hydroelectric facilities annually produce more
than 10.5 GW worldwide [11]. In 2008, the global hydropower production has increased
by 2.8%. The world’s total technical feasible hydro potential is estimated at 14,000
TW/year, which is slightly lower than the entire planet electricity production for the
year 2005 (approximately 15,000TW). According to various estimations about 8,000
TW/year is currently considered economically feasible for development. This advance
is mainly due to China where the increase was 20.3% [12].
As International Energy Agency (IEA) forecasts the hydropower production in the
world will increase by an average 2% per year. In developing countries is expected the
largest increase of this [13, 7].
The countries with the largest production of hydroelectric energy are China, Brazil,
Canada and the USA. In particular the contribution of hydropower in total electricity

4
production is very important since that in Brazil amounts to 85.56% and in Canada to
61.12% [12].
In Europe, the contribution of hydropower energy in total energy ranges from 0% to
99%. Countries that are the largest producers are Russia, Norway, Sweden and France.
Specifically, Norway is the first country not only in Europe but worldwide that is fed by
hydropower at 98.25%.
Most European hydropower projects are located in Western Europe and
Scandinavia. The installation of new hydroelectric power stations (2,210 MW) is in
progress in at least 23 countries with the most important plants being in Bosnia,
Bulgaria, Germany, Greece, Iceland, Ireland, Italy, Norway, Portugal, Romania,
Slovenia and Ukraine with a plan to erect plants of additional 8,000 MW capacity in the
near future [11].
Although large-scale hydroelectric plants produce the greatest amount of
hydroelectric power, there are situations which require the development of small
hydropower stations (SHP). The rated power of a SHP is usually less than 10MW, while
all stations with rated power less than 1MW are characterized as mini. For very small
applications (rated power less than 50 KW) one may also use the expression “micro
hydro power station”.
Taking into consideration that the most appropriate locations in Europe for the
installation of large hydro power (LHS) stations have already been exploited as well as
the strong opposition of local communities towards new hydro power stations claiming
important environmental impacts, small hydro power stations remain an attractive
opportunity for further utilization of the available hydro potential throughout Europe.
According to the report of ESHA (European Small Hydropower Association) for
2004 in the EU-15 14,000 small hydro power stations operated at an average size of 0.7
MW, in the new Member States E-10 about 2,800 SHPs (0.3 MW average size) and in
the candidate countries about 400 SHP stations (1.6 MW average size). It is estimated
that potentially in this sector the direct employment could rise to 15,000 and indirect
employment to 28,000 jobs (European Small Hydropower Association). In Norway in
2005, about 350 mini hydro power stations were operating (up to 1 MW) and about 300
small hydro power stations (1-10 MW) [14]. In Switzerland in 2008 operated more than

5
1,000 SHP stations with an installed capacity of 760 MW and annual production of
3,400 GW [15].
The vast majority of installed SHP capacity (81.5%) is concentrated in 6 Member
States. These largest EU producers of electricity from SHPs in recent years are Italy,
accounting for about 21% of the total SHP installed capacity, followed by France
(17.5%), Spain (15.5%), Germany (14%), Austria (9.4%) and Sweden (7.7%). The
largest capacities in the new Member States are in Romania (3%), Czech Republic
(2.4%) and Poland (2.3%). However, this does not always correspond to a large
percentage of the total energy from renewable energy sources or in total energy
consumption.
In particular, France although produces a large quantity (6,754 GW in 1997 and
5,823 GW in 2005) holding the second and third place in Europe in 1997 and 2005
respectively, the energy produced by SHP stations is only 10.15% (10.38% in 2005) of
the total energy from RESs and 1.53% (1.15% in 2005) from the total energy consumed
in the country.
Regarding the percentage of total energy production from RESs in the first places
are Belgium, Germany, Estonia, Czech Republic, Luxembourg and Poland in 1997 and
Bulgaria, Estonia, Luxembourg, the Czech Republic and Poland in 2005. In these
countries it appears that SHP have a prominent position among the RESs but this does
not mean that renewables have a good rate on their energy balance (Belgium - 1.1% and
2.3%, Estonia - 0.1% and 1.1% Luxembourg - 2.1% and 3.2% for 1997 and 2005
respectively).
On the other hand there are countries where energy consumption from renewable
energy sources is large enough (Latvia - 46.7% and 48.4%, Croatia - 38.3% and 36.3%
in 1997 and 2005) and simply exceed little SHP contribution (Latvia - 0.12% and 0.89,
Croatia - 0.71 and 0.62 in 1997 and 2005).
Austria, Spain, Italy and Sweden present also large percentages of energy produced
by SHP of total energy consumption which are respectively 7.63%, 2.5%, 2.81%, 2.99%
in 1997 and 5.46%, 1.38%, 2.21%, 2.31% in 2005. Note that the percentages of energy
from SHP stations in the total energy consumption are reduced by 2005 and there is
generally a negative average growth rate of energy production from SHP. Only the
newly EU countries are excluded [Bulgaria (24%), Estonia (28%), Latvia (31%) and

6
Turkey (62%)] [16]. In India, the SHP stations contributed in the total hydropower
generation 6% till December 2007 [7].
The SHP have significant advantages such as instant connectivity-decoupling to
network or autonomous operation, reliability, power of excellent quality without
variations, the optimal behavior over time, their long life, low maintenance and
operating costs, zero emissions, low environmental impact and at the same time satisfy
other needs and water use (irrigation, water, etc.) [17, 18, 6, 19, 20, 11, 21]. SHP
stations are also a powerful tool for local and sustainable development since that enable
local businesses to participate in the installation, renovation and maintenance of the
SHP, are a viable option for electrification of remote areas, due to their small size and
simplicity of technology, they have a teaching function because they allow the
monitoring of practical problems of energy production and stimulate development of
ecotourism [22]. In conclusion, small-scale hydropower is one of the most economic,
efficient and reliable energy technologies to provide electricity.
A SHP station is one of the softest environmental installations with significant
environmental benefits such as the potential reduction of Greenhouse gases, the
utilization of natural resources and the creation of new water biotopes. In addition to the
above, one could mention also several technical, economical and social benefits.
Unfortunately, despite the latter advantages offered by SHP stations, EU national
governments do not rank SHP stations’ installment as a first priority issue, mainly due
to the big RTD maturity, the risk analyses and their potential negative impacts on river
activities such as fishing. In fact, according to experts on the environment, most efforts
for more “environmental friendly” small hydropower stations should be concentrated in
reducing the problems associated with the reduction of aquatic species [23].
3. The Energy Sector in Greece, RESs and SHP stations
Greece is highly energy dependent, in particular on oil. The degree of energy
dependence is important because the cost of imported energy poses serious problems, in
domestic prices, employment, and causes uncertainty in the supply of energy resources
in times of crisis. The energy dependence can be reduced significantly with: a)
substitution of some energy resources (mainly oil) by finding and exploiting indigenous

7
sources of energy such as renewable energy, b) energy conservation and c) rational use
of energy [5].
The Greek energy system in the last decade is undergoing major changes and
challenges. The penetration of natural gas, the construction of trans-European networks,
the promotion of renewable energy, energy savings, liberalization of the electricity and
gas, security of supply, and environmental commitments of the country (fulfilling
obligations arising from the Kyoto Protocol) are the new data.
According to the “White paper for energy” [24] the contribution of RESs in
electricity consumption in Greece should be raised to 20.1%. By 2005 this figure was
11%, of which 8.5% is the generation of electricity from large hydropower stations
(LHPs) and only the 0.4% of SHP (Private 0.1% and Public Power Corporation (PPC)
0.3%) [25].
Hydropower plants cover most of the energy produced from RESs in Greece. In
2006, the contribution of hydropower reached 77% of energy produced from RESs [26].
Hydropower is a proven technology for electricity generation, contributing with almost
20% to the fulfillment of the planet electricity demand. Greece, and more precisely the
west and the north part of the mainland possess significant hydropower potential that is
up to now only partially exploited.
In Greece, up today, exist 15 large hydropower (LHP) stations of total capacity of
2,950 MW and almost 50 SHP stations, with total rated power 70 MW.
The first two large hydropower stations being in operation since 1954
are of Agras and Louros. Since then, several much larger hydropower stations have
been erected, like the ones of Kremasta (440MW), and Kastraki (320MW) in west
central Greece [11]. Four of the largest LHP stations in Greece are located in west
Greece and central Macedonia, including the power stations of Kremasta (440MW),
Polifito (375MW), Kastraki (320MW) and Pournari-I (300MW).
During the last years, no other new large hydro plant has started operation. The last
LHP station which entered the Greek electricity generation system is the one of
Platanovrisi in 1999. The hydropower station of Messochora in Thessaly - of a rated
power capability of 170MW - despite the fact that is ready for utilization, this could not
be possible up to now due to the significant reactions of local communities, which do

8
not accept to be removed in new locations in order to facilitate the operation of the new
hydropower station.
The development of hydropower stations is indispensable for achieving the
international commitments of the country. Directive 2001/77/EC of the European
Parliament and the Council of 27th September 2001 “For the promotion of electricity
produced from renewable sources in the internal electricity market” provides in its
annex for Greece an indicative target coverage from renewable energy sources
including major hydropower projects, of 20.1% as a percentage of gross domestic
energy1 consumption in 2010. This target is consistent with the country’s international
commitments under the Kyoto Protocol signed in December 1997 under the agreement
of the United Nations Framework on Climate Change [5].
The Kyoto Protocol predicts for Greece the retaining of the growth rate in 2008-
2012 of CO2 and other gases that exacerbate global warming by 25%, compared with
the base year - 1990. The installed capacity requirements of RESs (including large
hydropower projects) for 2010 to achieve the goal are shown in Table 1 [27].
(TABLE 1 APPROXIMATELY HERE)
As already mentioned, a hydropower plant is characterized as small if its rated
power is less than 10MW. Kaldellis (2007) [25] states that the first SHP plant which has
been operating in Greece since 1927 is the one of Glafkos (1.6MW) located in N.
Peloponnesus, while during almost at the same period of time (1929) the SHP station of
Vermio (1.8MW) has been also erected in central Macedonia. Up to 1994 only 8 small
hydropower stations belonging to the State-controlled Greek Public Power Corporation
(PPC) had been operating (total rated power: 42.8MW).
The country’s mainland (more precisely the west part) possesses a significant
hydropower potential which is up to now only merely exploited. This, when combined
with the significant opposition on behalf of local communities towards the installation
of new LHPs, highlights small hydro power stations as one of the most attractive
opportunities for further utilization of the available hydro potential.
1 Mean annual production of electricity, including domestic production plus imports minus exports.

9
The climatic and topographic conditions in Greece favor the development of SHP
stations. It is important to mention that the topography in combination with the relative
high precipitation facilitates the applications of similar power stations.
Let us further highlight the large number of rivers crossing mainland of Greece and
ending up in the Aegean Archipelago, with the most important among them being
Evros, Nestos, Strimon, Axios, Penios, Arachtos, Acheloos, Sperchios among many
others.
According to Kaldellis (2008) [11] the available local hydropower potential is
promising and can substantially contribute to the accomplishment of the national-EU
target to cover 21% of the corresponding electricity consumption from renewable
resources.
Following application of the law 2244/94 that permits private investors to
participate in the installation of SHP stations, a large number of private companies have
officially expressed their interest in creating small hydropower (SHP) stations
throughout Greece. Especially over the last decade there has been an increased interest
on the part of investors in this sector. In this context, a number of almost 40 new private
SHP stations have been installed between 2000 and 2005.
However, up to now - contrary to expectations - a relatively small number of
projects have been realized, mainly due to decision making problems, like the
administrative bureaucracy and the absence of a rational water resources management
plan. Moreover, cost of obtaining the required licensing (hydrological, approvals for
water, construction of plant and land rights) can be up to €30,000, an amount which
may be lost by the investor in case where the authorization is denied [25, 20].
Two are the main factors that slow down the installation of new small hydropower
stations. The first and most important is the administrative bureaucracy as a result of
which the process of obtaining the necessary license becomes very long (about three
years). Another important factor is the lack of a comprehensive national plan of water
management. Many suitable sites for the installation of SHP stations remain unexploited
due to the unclear situation of water potential since that municipalities and rural
cooperatives state exclusively or preferential rights to existing water resources.
Municipalities and rural cooperatives are putting pressure on plans for the use of the
available water resources through their political influence.

10
Given the relatively small size of these plants, the same limited budget and lack of
interest on the part of major energy companies, it is understandable the direction in this
area of small private companies with limited socio-economic impact at national level.
These small companies often lack the expertise and equipment to optimize their
factories. In terms of economies of scale, only the SHP stations, which are located along
a river, can benefit. As a result of all these, the construction time is long and the initial
budget is often exceeded. Moreover, in many cases the plants are exaggerating the size
required because the provided grants depend on the installed capacity, not energy
efficiency. In these cases, SHP does not operate for a considerable time because of the
low quantity of available water [25].
There are two categories of investors according to the Greek Regulatory Authority
for Energy [28]. The first is investors with an authorized installation license and the
second is investors who have filed an application and are awaiting for the evaluation
(positive or negative) from the RAE. The evaluation of any preliminary draft for SHP
installation is made by taking into account parameters such as environmental issues,
installation of plant and property rights to water resources, plant safety, and reliability
of the standard required documents. Then the technical-economic parameters for the
viability of the investment are examined [25].
Small hydropower stations in Greece have very good technical-economic
performance and thus have a promising future. They are characterized by high
economic efficiency and the slow pace of their construction is contradicted by the
considerable interest on the part of investors.
According to the latest figures of the Hellenic Transmission System Operator
(HTSO) (March 2009) [29] in Greece there are 80 SHP stations installed with a capacity
of 170.08 MW (Table 2). Most SHP stations are located in Central Macedonia, Central
Greece, Epirus and Thessaly (Table 2). There are also under licensing several other
projects with a total rated power of 450 MW [28].
(TABLE 2 APPROXIMATELY XERE)
Table 3 shows the chronological order of the installed power of SHP stations by
prefecture for the five-year period 2004-2009. Note that in this period the total capacity

11
has almost quadrupled. Also we observe a disproportionate increase in power by region.
In some regions, e.g. Eastern Macedonia & Thrace, installed power remains stable
while in others such as Western Greece is doubled, whereas the biggest growth is in
Epirus and central Macedonia where nearly quintupled their power.
The largest small hydropower stations belong to PPC, while the rated power of the
largest private station is 4.5MW.
(TABLE 3 APPROXIMATELY HERE)
The available small hydro potential in Greece is quite high, hence there are many
suitable locations in various prefectures for developing new stations. Thus, there is an
increased investors’ interest regarding the erection of small and mini hydro power
plants [30, 25].
The majority of new SHP stations planning to be constructed will be located in
Epirus, central Greece and Macedonia [25]. If all these stations are to be implemented,
the contribution of SHPs in the national electricity generation should attain the value of
5%, strongly improving the national efforts to meet the 2001/77 EU Directive target.
4. Research Methodology
4.1. Study Area
The study was conducted in the prefecture of Ioannina in Epirus region (Map 1)
during spring of 2010. According to the 2001 census, the population of the region
numbers 161,027 people and compared with the previous census of 1991 there is an
increase of 7.6%. The prefecture of Ioannina, mainly a mountainous region rich in water
resources, collects 1.5% of the population and produces 1.4% of the country’s GDP. In
2004 per capita GDP of Ioannina was about 91% of the country’s average, while in
2000 only 85%. In terms of per capita GDP of 2004 the prefecture ranked in 11th place
among the provinces in the country. The participation of the prefecture in the country’s
GDP increased marginally from 2000. In 2004 agriculture represented the 4.3% of GDP
produced in the prefecture, the industry the 24.7% and the 70.9% were services.
Ioannina is third in cheese production and first in meat production nation-wide [31].
12
(MAP 1 APPROXIMATELY HERE)
We have chosen this particular region due to the impressive development of
SHPs in recent years, leading to an impressive number of 36 in operation or license-
authorized SHPs in the region, of a total rated power of 94.6 MW.
4.2. Questionnaire
This survey was conducted using a structured questionnaire and the method of
personal interviews. The personal interview is one of the best ways of collecting
statistics and is used frequently in polls [32 – 35]. In designing the questionnaire we
have taken into account the relevant literature on the multiple effects of SHP stations
(social, economic, developmental, environmental) [17, 36 – 41].
In particular, the purpose of the study is to investigate the attitudes of citizens of the
prefecture of Ioannina on the impact of the establishment and operation of SHP stations
in the development of the prefecture and their quality of life, thus highlighting the
potential of cross-contribution of SHPs to the local production and social system and
environmental balance. Specifically, emphasis was laid on the following topics:
The degree of public knowledge regarding SHP energy applications
The public awareness about environmental, developmental and economic
impacts of small hydropower energy.
The questionnaire consisted of fix-response questions, covering various areas
relating to respondents’ attitudes towards SHP stations, perceptions of benefits and
losses brought by SHP stations, knowledge concerning SHP stations and general
environmental issues. Moreover, socio-demographic data of the respondents was
collected (gender, age, educational level, income, occupation). A detailed description of
the questionnaire’s variables can be found in Appendix B. For the main part of the
questionnaire, five-point or three-point scales were used for the evaluation of the given
statements. The answering possibilities for the 5-point scale were: “Absolutely
Disagree” (1), “Disagree” (2), “Neither Agree nor Disagree” (3), “Agree” (4),
“Absolutely Agree” (5). The answering possibilities for the 3-point scale were: “Low
Priority” (1), “Medium Priority” (2) and “High Priority” (3).

13
4.3. Sampling - Statistical Methodology
Simple random sampling was the sampling method selected, due to its simplicity
and the fact that it requires a minimal knowledge of the population compared to any
other method [42 – 45].
The “population” under study is the total number of households in the Ioannina
prefecture. The Simple Random Sampling presupposes the existence of a complete list
(sampling frame) with the information for the population without omissions or
repetitions [46]. The sampling framework used involved lists of consumers of
household electricity. These lists were considered the most appropriate choice, since
almost 100% of households in the prefecture under research use electricity.
Using households is a classic example of using groups of people as a sampling unit,
instead of individual persons. This is a preferred solution in certain cases, since it is the
most convenient and less costly method. The selection process for the respondents
(from a household chosen at random) was organized so that the same family member
would not always be chosen (i.e. always the head of the family, a spouse, etc.) [45].
In order to estimate the sample size, the following simple random sampling formula
is used:
2
2 )̂1(̂
e
pptn
where
n
p
p
n
i
i 1
)(
ˆ is the estimate of population proportion that share a certain
characteristic on one of the (categorical) variables in the survey, and e is the maximum
acceptable difference (proportion of error we are prepared to accept) between the
sampling proportion and the unknown proportion of the population. (We accept that
e=0.05, i.e. 5%).
Pre-sampling was conducted on a sample size of 50 persons to estimate the variable
with the greatest variance under the desired selected error, while the rest are estimated
with a greater accuracy than was initially defined.

14
According to the pre-sampling the higher proportion value is p=0.49≈0.50,
therefore 1-p= 0.5 and consequently the sample size selected was:
16.38405.0
)5.01(5.096.1)̂1(̂2
2
2
2
e
pptn
We therefore accepted a sample size of 385 individuals (persons). The households
in the sample were then precisely identified (full name and address) using tables of
random digits. To the chosen households, personal interviews with a member of the
family, which was randomly selected, were conducted. In cases occupants were not
found or refused to answer, two more attempts were made to obtain their opinion. When
this was not possible, we used the same procedure in order to select new sampling units.
Econometric analysis was carried out with the help of the statistical package SPSS
15.0 [47], including - besides the descriptive analysis of single items from the
questionnaire - the analysis of qualitative variables of the questionnaire by the use of
logistic regression analysis for attempting to identify possible socio-demographic
characteristics affecting respondents’ willingness to pay for small hydro power plant
energy.
5. Results-Discussion
5.1. Descriptive statistics
According to the entire sample analyzed (385 respondents), 258 were female (67%)
and 127 male (33%) (Table A1). Respondents’ ages were mainly between 30 and 50
years old (≈70%), while 67 respondents (17.4%) were under 30 years old and 49
(12.7%) between 50 and 60 years old (see Table A1 in Appendix A). As regards the
educational level of respondents, 41.3% (159 respondents) were educated to high or
senior high school, and 54% (208 respondents) are of upper educational level (Table
A1). Their family income varied mainly between €15,000 and €20,000 (34.8%), with a
large percentage of family incomes being between €10,000 and €15,000 (25.7%) and
over €20,000 (26.2%) (Table A1). The vast majority were employees (76.9%) –

15
occupied in the private and public sector, whereas the rest of respondents were farmers,
unemployed, freelancers and housewives (Table A1).
Interviewees were asked about their opinion relative to some characteristics of their
prefecture, ranging from their view on the quality of life to aspects concerning
renewable energy sources.
First of all, concerning the question of quality of life (Table A2), the respondents
are divided, with almost half of them (50.4%) stating their agreement (fully agree or
agree) that quality of life in prefecture of Ioannina is very good. On the other hand, a
significant percent (27.8%) were disagreeing with this statement (the 21.6% were
undecided).
Things are clearer when we come to the question concerning employment
opportunities in the prefecture (Table A2). People mentioned in their interviews at a
65.8% that agree or absolutely agree with the statement of no employment
opportunities, with only a 14.5% favoring for the opposite. Accordingly, the vast
majority (89.4%) of the people polled state that there is no industrial development in the
prefecture (the opposite was stated by just the 3.9% of interviewed citizens).
In terms of the role RESs play in their prefecture (Table A2), there is a clear
indication of the substantial lack of renewable energy recourses (RES) utilization, since
the 68.8% of respondents stated that little or no development towards this type of
energy source is present (only 5.2% stated otherwise).
On the contrary, the citizens’ support for a progressive turn towards RES is clearly
stated by the following question, concerning whether or not the future development of
the prefecture should be based on renewable energy. Nearly 74% of the people polled
expressed their general support for the future use of RESs, while only 3.1% stated that
future development should not be based on this type of energy (Table A2).
In the present paper, emphasis was primarily laid on the assessment of public
attitudes towards small hydropower stations. Even though general public surveys
worldwide show a support towards a progressive energy policy, many residents feel
severely limited in their quality of life by the actual or potential installation of
hydropower stations. Among many arguments in this decade concerning the utilization
of SHPs are on the one hand the changes of the landscape on local level, and on the
other hand local economical and social benefits.
16
It is generally accepted that SHP installation and operation can create economic
opportunities for local residents. Perceptions of local people in terms of potential
economical benefits from the construction and operation of SHP stations in the
prefecture of Ioannina showed that most respondents (71.5%) see economic gains for
the local population from the establishment of SHP stations whereas only the 9.6% of
respondents express the believe of no benefits (Table A3). 63.4%, 28.8% and 7.8% of
the respondents showed positive neutral and negative response to their agreement with
the statement that construction and operation of SHP stations in the prefecture will
ensure the availability of electricity in perpetuity (Table A3).
The limited knowledge of citizens as concerns the environmental impacts of SHP
stations in the prefecture they are established becomes evident from the fact that almost
half of the respondents (46.5%) provided a neutral answer as concerns their opinion on
whether or not SHP stations have a protective effect on preventing floods (Table A13).
Concerning the benefits of the prefecture of Ioannina by the enhancement of various
local bodies through the SHP stations’ social responsibility and sponsorship, 53.8%,
33.5% and 12.8% of respondents provided a positive, neutral and negative response
(Table A3).
Most respondents pointed out their skepticism associated with environmental
concerns from SHP installations, since that 46.2% (summation of the answers “agree”
and “absolutely agree”) of citizens believe that an SHP will lead to significant
environmental impacts, such as reduction in aesthetics of landscape and environment in
general (25.7% of respondents do not support this opinion) (Table A3).
This result is verified by the relative literature. It is generally acknowledged both by
the public and by experts [23] that SHP stations have (larger or smaller) impact on the
environment. It is also agreed among experts that one of the most critical impacts of
small hydropower is the one of distortion of fish fauna living in the river of the erected
station. There are even situations where species have disappeared due to problems with
the fish passes, especially for salmon [48], thermal pollution, and increased turbidity
among others.
The answers of respondents in the statement concerning the possibility of reduction
of fish fauna in the prefecture, due to the installation of a SHP station are more or less
uniformly distributed (36.6%, 23.9% and 39.5% were the positive, negative and neutral

17
answers, respectively) (Table A3). The respondents are more confident that the fish
fauna of the prefecture where an SHP is located is disturbed by the operation of the
hydro plant (see Table A18). Specifically, about half of them respond positively (45.4%
agree or absolutely agree with the statement) whereas only the 17.7% answer “disagree”
or “absolutely disagree”.
The belief that installation of SHP stations in a prefecture significantly affects
economical development (and development of the prefecture in general) is verified
since that more than 75% of respondents (75.6%) answered that agree or absolutely
agree with the statement that the construction and operation of a SHP could upgrade the
networks of the prefecture (e.g. roads, telecommunications) (Table A3).
Besides the already discussed benefits gained from a SHP stations’ construction and
operation, it is also supported by those in favor of RESs that SHP stations can also
promote new alternative (and also profitable) forms of tourism in the prefecture of
erection of the plants. This opinion seems to find supporters in our study, since 55.1%
of citizens responded positively on this issue (Table A3).
It has been claimed that one of the main reasons SHP stations have not grown as
expected especially in Greece, is the complex and bureaucratic administrative
procedures to obtain licenses for commissioning a plant [25]. According to the
information collected, this issue causes also diversity between respondents, as we look
at their answers in the question concerning the procedures under which installment and
deployment of an SHP station should be based. Specifically, 46.2% stated their
agreement (agree or absolutely agree) with reducing the presently existing bureaucracy
regarding the number of supporting documents one has to apply in order to obtain a
permit to erect an SHP station, however, a significant part of respondents (28.8%) are
against making quicker and simpler the licensing process. Also, 24.9% provided a
neutral answer (Table A3).
It is true today that in Greece there is a complex, bureaucratic and time-consuming
system for a generation license, deployment and utilization of a SHP station.
On the other hand, most citizens surveyed agree that legislation in relation to the
construction of SHP stations should be more strict (66%), and people are quite sensitive
to the environmental impacts of specific projects with only 10.9% disagreeing with the
latter statement (Table A3).

18
Keeping in mind that there is an almost constant minority (≈15%) of respondents
that are negatively expressing views against SHP stations, this group is also present in
the results of the statement concerning the development of ecotourism in the prefecture
after the erection of an SHP station (18.7% disagrees that SHP station operation could
be a pole of development). However, again, the majority favors the specific statement
(55.1%), while once again a significant part does not express positive or negative
opinion (26.2%) (Table A3).
The results are similar in the following question. 50.9%, 15.9% and 33.2% of
citizens respond positively, negatively and neutral respectively, to the agreement with
the statement that operation of SHP stations reduces emissions of carbon dioxide (Table
A3).
Finally, the lack of information on behalf of the public becomes apparent by the
clear absence of knowledge when asked to state their opinion concerning economical
benefits of the local community gained by the council of the city from potential
investors of SHP stations (67.5% answered “don’t know”) (Table A3).
In the sequel of the questionnaire, questions designed to evaluate and rank the
priorities local people believe that should be given in future potential benefits from
installment of SHP stations in their prefecture (Table A4). More analytically, in terms of
the preferences of respondents, there is a clear vote on priorities associated with
protection and preservation of the environment, stressing in this way the increased
public interest and awareness for environmental impacts of small hydropower energy.
Specifically, respondents state that it should be given high priority to the protection of
nature (92.2%), and to the protection of air, water and soil (89.6%). Economical and
social benefits are following, with people stating that high priority should be given in
the creation of employment opportunities (85.2%), in the production of electrical energy
(78.2%), and in the financial support of the local community (77.4%). The high priority
for creating an attractive and beautiful landscape was answered by the 70.9% of
respondents. The lower priority was given to recreation for the local population (high
priority: 39.5%, medium priority: 51.7%, low priority: 8.8%).
In the last part of the questionnaire, local peoples’ perceptions were investigated,
concerning their potential behavior in case of facing the event of higher local electricity

19
expenditures due to the contribution of SHP stations’ electrical power in the total
electricity costs.
Hydropower, in general, can be characterized as a capital-intensive investment since
it requires a heavy initial investment cost2. In other words, hydropower can appear
expensive in the early years even though it is cheap in the years to follow [49]. As a
consequence to this, high tariffs in the first 10 to 15 years of utilization of SHP stations
are usually observed. However, once investment costs are repaid, cost of hydropower
drops dramatically, and becomes stable over time and moreover is not subject to fuel
fluctuations. Additionally, lifetime of a SHP station can rise up to 100 years. In this
respect, public support and attitude play a key role towards the possible initially
augmented selling prices of SHP-produced electricity.
Under this perspective, in our questionnaire the respondents were asked to state
whether they would be WTP for obtaining electricity from SHP stations. Specifically,
two questions were asked to citizens, one investigating their willingness to pay higher
PPC prices, where the percentage of electricity from SHP stations is analyzed, and the
other investigating willingness to pay higher municipal taxes for the construction of
municipal SHP stations, with the benefit of lower electrical energy in the future. More
specific, during the survey, respondents were asked the following questions: “are you
willing to pay higher PPC prices, for increased SHP stations contribution in electricity
generation” and “are you willing to pay higher municipal taxes for the construction of
municipal SHP stations, with the benefit of lower electrical energy prices in the
future?”. The respondent had to pick from five possible answers, namely “Absolutely
Disagree”, “Disagree”, “Neither Agree nor Disagree”, “Agree” and “Absolutely Agree”.
We have chosen the specific items due to that PPC currently owns the 96% of
installed power capacity in Greece which comes from lignite, oil and hydroelectric
plants, gas plants, and wind and solar farms and therefore plays a key role in energy and
national economy. Also, in recent years many municipal enterprises have implemented
and operate small hydroelectric stations as well as other facilities for the generation of
electricity from renewable energy sources, contributing in this way to energy supply in
their area.
The results of the responses are shown in Table A5.
2 The EU average initial investment cost for SH stations ranges between 1,200 €/KW to 3,500 €/KW.

20
As we observe, the research results showed that a large percentage of respondents
were willing to pay higher municipal taxes for creating municipal SHP stations (agree
or absolutely agree: 40.5%). More than 46% of respondents however expressed a
negative reaction. By contrast, only 15.8% of the respondents were willing to pay
higher amount of money through extra charges in PPC bills (Notice also that none of the
respondents absolutely agrees with the question). The percentage of individuals who
refused the scenario was more than 60% (disagree or absolutely disagree).
These results show a clearly preference of respondents on financing construction
costs rather than paying higher electricity prices for a specific time period, during the
early years of SHP employment.
5.2. Tests of Independence
Besides the descriptive analysis of single items from the questionnaire, the
qualitative variables of willingness to spend an increased amount of money for
electricity obtained from SHP stations were related by means of a chi-square test [50]
with socio-demographic variables, and in addition, the contingency coefficient (CC) for
each statistically significant comparison was calculated in order to determine the
strength of the association.
As concerns the question investigating the citizens’ willingness to pay higher PPC
prices for increased SHP stations contribution in electricity generation, the distribution
of the willingness to pay higher PPC prices by gender (Table A6) reveals that male
citizens are more willing to pay (χ2=13.47, df=3, p-value=0.004<0.05, CC=0.184, p-
value=0.004). A statistically significant relationship was also observed between the
WTP of the citizens of prefecture of Ioannina and their age (χ2=80.377, df=9, p-
value<0.001, CC=0.416, p-value<0.001). Younger citizens are more willing to pay
higher PPC prices for increased SHP stations contribution than older citizens (Table
A7). Also, the educational level of citizens seems to be related to favorable or no
favorable attitude (χ2=50.592, df=6, p-value<0.001, CC=0.341, p-value<0.001). It is
obvious from the inspection of contingency Table A8, that citizens of middle and upper
educational level are more willing to pay in comparison to citizens of lower education,
showing that they have greater environmental awareness and understand better the
broader role of SHP stations, being rather better well-information.

21
There also seems to be an association between the family income and WTP higher
PPC prices (χ2=69.106, df=9, p-value<0.001, CC=0.39, p-value<0.001). In addition, it
also seems that higher incomes are more positive to the contribution of SHP stations to
the integrated development of their region. Citizens of higher incomes are more
agreeing in WTP than citizens of lower income (<€10,000). Finally, the acceptance of
WTP higher PPC prices is related statistically significantly to the citizens’ occupation
(χ2=96.702, df=12, p-value<0.001, CC=0.448, p-value<0.001) (Table A10).
When we come to the results obtained using the chi-square test to compare
proportions of answers on the question of willingness to pay higher municipal taxes for
the construction of municipal SHP stations between the various demographic groups,
we see that the acceptance of higher municipal taxes is also related statistically
significantly to gender (χ2=15.187, df=4, p-value=0.004<0.05, CC=0.195, p-
value=0.004), age (χ2=64.171, df=12, p-value<0.001, CC=0.378, p-value<0.001),
education (χ2=67.307, df=8, p-value<0.001, CC=0.386, p-value<0.001), family income
(χ2=88.637, df=12, p-value<0.001, CC=0.433, p-value<0.001) and occupation
(χ2=103.585, df=16, p-value<0.001, CC=0.46, p-value<0.001).
Again, citizens of lower education, and low income are the less reluctant to pay
increased taxes.
A favorable attitude towards WTP is also more common among male citizens.
Disaggregated by age, we also observe significant differences in WTP behavior,
however things are not so clear as is the case with the question of increased PPC prices.
From the contingency table (Table A16) between the proportions of answers of the
two WTP questions, we see first of all that there is a significant part of respondents (68
out of 385, or 17.7%) that absolutely disagrees on paying in any of the two proposed
scenarios for obtaining electricity from SHP stations. Respondents who generally
disagree (disagree or absolutely disagree) are up to 137 (or 35.6% of total sample
surveyed), whereas those who generally agree (agree or absolutely agree) in both
scenarios are only 56 (or 14.5% of total sample surveyed). A statistically significant
relationship is also observed for the association between the two WTP variables
(χ2=233.804, df=12, p-value<0.001, CC=0.615, p-value<0.001).
Finally, the association between the local residents’ acceptance for paying higher
PPC prices and their expectations as concerns the elevation of income of local

22
population through the creation of new job positions is also statistically significant
(χ2=65.067, df=12, p-value<0.001, CC=0.38, p-value<0.001) (Table A17). The same
results hold for the association between the publics’ acceptance for paying higher
municipal taxes and the latter issue (χ2=136.221, df=16, p-value<0.001, CC=0.511, p-
value<0.001) (Table A18).
5.3. Willingness to Pay for Small Hydro Power Plant Energy
In the sequel, logistic regression analysis [51] was conducted in order to examine
which of the scales (exploratory variables) has the greatest power in predicting
respondents’ potential willingness to pay for small hydro power plant energy, as was
measured through the two questions included in our study.
Thus, two separate logistic regression models were fitted to the data, with
dependent variables being the “willingness to pay higher PPC prices, for increased SHP
stations contribution in electricity generation” and “willingness to pay higher municipal
taxes for the construction of municipal SHP stations, with the benefit of lower electrical
energy prices in the future” variables, respectively.
For convenience of interpretation and presentation of the results of the analysis,
categories “agree” and “absolutely agree” were suppressed to one category of positive
answer (agreement) whereas the same was done for the negative categories
(disagreement). The “neutral” category (neither agree nor disagree) was also included in
the analysis.
To identify those factors that influence statistically significantly the two dependent
variables, we have chosen to use socio-demographic characteristics of the respondents
as the predictor variables. More specifically, we have chosen for the initial fit of the
logistic regression model as predictors, socio-economic variables: gender, age,
educational level, income and occupation.
For modeling the two multinomial categorical responses each one consisting of
three categories (1: WTP, 2: not WTP, 3: neither agree nor disagree) we assume
dependent variables tiiiij yyyy 321 ,, (i=1,2,…,385; j=1,2,3) following a multinomial
distribution with probabilities tiiii 321 ,, and a set of k predictor variables
1, 2,..., kxx x . In other words, ij denotes the probability that respondent i chooses the

23
alternative category answer j. Then, by taking category “WTP” (say denoted by*j ) as
the baseline category, each one of the two multinomial logistic regression models can
be expressed as:
)(log *
*
jjxj
t
i
ij
ij
where
*
1
)exp(
jk
k
t
i
j
t
i
ijx
x
denotes the j-th category probability,
*
*
1
1
jk
k
t
i
ij x
the
baseline-category probability, the x vectors (x1, x2,…, xk,…, xm) are the categorical
explanatory variables (covariates), and the β’s are the corresponding vectors of
coefficients (β1, β2,…, βk,…., βm). By setting the last set of coefficients to null, that is
βm=0, the coefficients βk (k=1,…,m-1) represent the effects of the x variables on the
probability of choosing the kth alternative over the last alternative.
In the above expressions of the models, the logit was used as the model’s link function.
The k-th element of parameter j can be interpreted as the increase in log-odds of
falling into category j versus category j* resulting from a one-unit increase in the k-th
covariate, holding the other covariates constant.
In the previously described multinomial logit regression models we have designated
as predictor groups the levels “Disagree in WTP” and “Neither Agree nor Disagree in
WTP”, while as reference (baseline) category in both models we have chosen the
positive answers of respondents (“Agree in WTP”). For the adaptation of the final
model and estimation of the beta coefficients, Maximum Likelihood method was
utilized.
Tables 4 and 5 show the results of the analysis. Specifically, Table 4 shows for the
first logistic model the values of the coefficients of independent variables in the logistic
model accompanied by the statistical significance of coefficients, derived by the Wald
type test. In the last column, the odds ratios of the model are presented for each one of
the predictor variables separately. In the case of the categorical explanatory variables,
the above ratio is the ratio of probabilities of the [Disagree in WTP] and [neither Agree
nor Disagree in WTP], using as reference group the [Agree in WTP] category.

24
The final logistic regression model, for the [WTP higher PPC prices] is the
following:
Disagree in paying higher PPC priceslog 1.787*[ " "]
(Agree in paying higher PPC prices)
2.525*[ ""]3.623*[ "30"]2.897*[ "3140"]
4.099*[ "10,001€
oddsEducationmiddle
odds
Gendermale Age Age
Income
15,000€"]1.928*[ "15,001€20,000€"]Income
for the contrast between reference group and the “Disagree” group, and
Neither Agree nor Disagree in paying higher PPC priceslog
(Agree in paying higher PPC prices)
2.198*[ " "]3.099*[ " "]
4.629*[ "10,001€15,000€"]3.301*[
odds
odds
Educationmiddle Gendermale
Income Inc
"15,001€20,000€"]ome
for the contrast between reference group and the “Neither Agree nor Disagree” group.
(TABLE 4 APPROXIMATELY HERE)
As it follows from Table 4, the age of the respondent is a significant factor for the
willingness to pay higher PPC prices for increased SHP stations contribution in
electricity generation produced by SHP stations, at a 1% level of significance. Indeed, if
we look at the Table, we see that younger citizens (<30 y.o.) are more willing to pay
compared to older citizens. The odds of disagreeing to WTP rather than agreeing is
decreased at about 97.3% and 94.5% being up to 30 years old and between 3 and 40
years old, respectively.
Accordingly, males are more willing to pay, when compared to females (beta=-
2.525, p-value<0.05) as the “Agree” and “Disagree” comparison reveals.
These categories of respondents (i.e. younger respondents, males) are more
sensitive to environmental protection, as they believe that SHP stations contribute to its
protection by reducing considerably the emissions of harmful to health pollutants
caused by burning fossil fuels (coal, oil, gas) and for this are more willing to pay higher
prices for increased electricity produced from SHP stations and distributed by the PPC.
The less willing to pay, as concerns the respondents’ income are those of higher
incomes. Indeed, the odds of being in the group of those disagreeing in WTP, rather

25
than in the agreement group is increased by a factor of 60.26 by being in the “€10,001-
€15,000” income category, rather than being in the “€20,000+” income category.
Educational level is also included in the final model, indicating that between those
of middle and upper education there is a significant negative shift of willingness to pay
higher PPC prices (beta=-1.787, p-value=0.001<0.05). Occupation was not found to be
a significant factor for the dependent variable.
Respondents of higher income groups and middle/high educational levels seem to
be less environmentally sensitive than other categories of respondents, maybe due to the
fact that those groups do not often come into contact with the environment because of
their lifestyle.
Similar results were found when we come to the comparison between the “neutral”
category and the reference category (positive).
As concerns the model’s adequacy, the chi-square value of the model (300.232, p-
value<0.001) indicates that logistic regression is very meaningful at the 5% level of
significance. The Negelkerke’s pseudo R square was 0.639, and the Cox and Snell R-
square 0.542. The model proved to exhibit (moderately) good predicting power, since
the prediction accuracy derived by the classification table was 68.6%.
When we come to the second logistic regression model, things are different as
regards the interpretation of the model (Table 5).
(TABLE 5 APPOXIMATELY HERE)
While gender does not seem to differentiate between those who agree to pay higher
municipal taxes and those against, on the other hand the odds of being in the neutral
category rather than agreeing to pay is increased by a factor of 5.72 by being male
rather than female (beta=1.744, p-value=0.001<0.05). Also, the income and educational
level are both statistically significant predictors of the response variable. Respondents
of lower incomes (<€10,000) are less willing to pay higher municipal taxes (beta=1.927,
p-value=0.019<0.05) in comparison to respondents of higher incomes.
Generally, citizens of higher incomes are much less affected by increases in
municipal taxes and generally from indirect taxes and therefore can more easily

26
contribute to the increase in municipal taxes for the construction of municipal SHP
stations.
Accordingly, the odds of disagreeing in paying rather than agreeing are increased
by a factor of 6.871 by belonging to the lowest income category. The model also
indicates that those of lower education are less willing to pay than those of higher
education (beta=3.255, p-value=0.015<0.05) at a 5% level of significance. Odds of not
WTP vs WTP are increased by a factor of 26 by belonging to low educational level.
Statistically significant association between WTP and middle/higher educational
level was also found, but to a 10% level of significance (beta=0.451, p-
value=0.087<0.1). Odds of not WTP vs WTP are increased now by only 1.57 by
belonging to middle educational level, rather than to higher educational level.
In contrast to the first logistic model, we have an indication that younger citizens
are less willing to pay for construction of SHP stations through municipal taxes
(beta=0.941, p-value=0.082<0.1) at a 10% level of significance. Indeed, the odds for
respondents below 30 y.o. to older respondents (>30 years old) are 2.56, which
corresponds to a 156% increase of willingness to pay higher municipal taxes for
younger citizens.
In many cases, the involvement of municipalities in the business sector in Greece in
the last decades has proven to be non productive and effective and is usually
characterized by mismanagement. Younger citizens have found that generally municipal
businesses are not productive and effective and believe that the same will happen with
the municipal SHP stations, thus refusing to pay higher municipal taxes for their
construction.
Although occupation of the local citizens was not found to affect statistically
significantly the willingness to pay higher PPC prices, here we find that WTP higher
municipal taxes is partly affected by occupation. Indeed, being an employee is a
significant factor for willingness to pay (beta=2.131, p-value=0.006<0.05) at the 5%
level of significance, and as suggested by the model, the probabilities (odds) of not
WTP is increased by a factor of 8.427 in case of employees when compared to all other
professions. The model’s equations are given by:

27
Disagree in paying higher municipal taxeslog 2.733.255*[ " "]
(Agree in paying higher municipal taxes)
0.451*[ " "]0.941*[ "30"]1.927*[ "10,000€"
oddsEducationlower
odds
Educationmiddle Age Income
]
2.131*[ " "]Occupationemployee
and
Neither Agree nor Disagree in paying higher municipal taxeslog
(Agree in paying higher municipal taxes)
91.4141.744*[ ""]
odds
odds
Gendermale
for the contrast between the reference group and the “Disagree” group, and for the
contrast between the reference and the “Neither Agree nor Disagree” group,
respectively.
Employees seem more willing to pay higher municipal taxes to build municipal
SHP stations, presumably due to that for each month they have a fixed salary, hence
they can do better planning.
The chi-square value of the model (183.35, p-value<0.001) indicates that logistic
regression is very meaningful at the 5% level of significance. The Negelkerke’s pseudo
R square was 0.44, and the Cox and Snell R-square 0.379. The model proved to exhibit
reduced predicting power in comparison to the previous logistic model, since the
prediction accuracy derived by the classification table was only 56.4%.
6. Conclusions
It is generally acknowledged that the development of small hydropower around the
world is on the increase. Governments, and wider political unions such as the EU are
seeking to find new ways in promoting renewable energy sources, among them and the
small hydropower development.
The current article has attempted to assess the public attitude towards SHP energy
and to evaluate SHP development in Greece, based on the results of a questionnaire
survey conducted in the prefecture of Ioannina, Greece.
The findings of the current study revealed that - although attitude of the public
varied - citizens generally have a favorable attitude and interest towards renewable

28
energy sources such as energy from small hydropower stations. However, the most
troublesome outcome of this study is the existence of a specific minority that is strongly
against SHP utilization, disregarding any potential benefits of these projects.
Environmental impacts, as normally expected, were the most profound reasons for
protest and negative attitudes against the utilization of electricity from small
hydropower stations. To this end, benefits of small hydropower energy should be more
effectively communicated to the public, in order to gain a wider support including those
claiming that small hydropower stations will have a negative effect in their prefecture
after installation of SHP stations (e.g. environmental effects, cost effects).
Especially, attractive features of SHP energy such as reduction of Greenhouse
gases, creation of new biotopes and new opportunities for developing ecotourism should
become more familiar to the public, currently found to be confusing the limited negative
impacts of SHP stations with major negative environmental impacts of large
hydropower stations.
Another finding was that there is a substantial lack of knowledge in terms of some
characteristics of hydropower energy. For instance, 46.5% of people surveyed answered
“Do not know” to the question on whether or not SHP stations have a protective effect
on preventing floods. Thus, among the primary conclusions drawn by the specific
survey, is the necessity of additional public information regarding SHP energy.
A strong connection between the public acceptance and the economical gains of
SHP stations utilization became also evident from this study. The local residents want to
participate in terms of economic benefits instead of just bear costs like changes of the
landscape. Therefore, in order to limit potential conflicts and negative opinion of local
citizens it is of significant importance to establish a reasonable price of small
hydropower electricity for the consumer. The cost of electricity should be limited within
local peoples’ bearing capacities.
Publicizing the fact that SHP energy can be the most cost-effective renewable
energy source over time, while at the same time is an environmental friendly solution,
able to contribute significantly to the solution of the energy demand problem of Greece
is expected to encourage the public to enhance their participation in the purchase of
SHP electricity.

29
Employment opportunities are also a key factor, as suggested by the results of the
survey. To this end, various measures should be taken to ensure that local employment
created directly or indirectly by SHP stations would be highest possible.
Finally, socio-economic characteristics, such as gender, age, income and education,
are shown to have close connections with local people’s attitudes towards SHP stations.
More specifically, the young (<30 years) and men are more willing to pay higher PPC
prices for increased SHP energy contribution in electricity generation compared with
elderly citizens, suggesting that the younger generation and men are more
environmentally sensitive and probably better informed. The people of lower incomes
and less education are less willing to pay higher dues to create municipal SHP stations.
In conclusion, the smooth operation of SHP stations depends to a large extent on the
attitude of local communities towards them. The operation of a SHP station in everyday
and practical level will prove the theoretical design in practice, thus contributing to the
overall development of the region.
The establishment and operation of a SHP station requires adjusting of conflicts
between different beliefs or opinions and interests of social groups (farmers, fishermen,
domestic consumers of water, environmental organizations, private investors).
Generally, legislation alone will not bring the desired result as consumers-citizens
hardly change well established habits, while the lack of information up to now
contributed to the indifference of consumers-citizens for any systematic effort in the
sector of RES.

30
References
[1] Vlachou A. Environment and Natural Resources. Economic Theory and Policy. Vol
A’. Athens; 2001 (in Greek).
[2] CRES. Renewable Energy Statistics. National Report for EUROSTAT; 2006.
[3] Katinas V, Markevicius A. Promotional policy and perspectives of usage renewable
energy in Lithuania. Energy Policy 2006; 34(7):771–780.
[4] Hillring B. World trade in forest products and wood fuel. Biomass and Bioenergy
2006; 30(10):815–825.
[5] Manolas N. The Energy Sector in Greece: Trends and Perspectives. CPER. Athens
2007 (in Greek).
[6] Yuksek O, Komurcu MI, Yuksel I, Kaygusuz K. The role of hydropower in
meeting Turkey's electric energy demand. Energy Policy 2006; 34(17):3093–3103.
[7] Purohit P. Small hydro power projects under clean development mechanism in
India: A preliminary assessment. Energy Policy 2008; 36(6):2000–2015.
[8] Wolsink M. Wind power implementation: The nature of public attitudes: Equity
and fairness instead of ‘backyard motives’. Renewable and Sustainable Energy
Reviews 2007; 11 (6): 1188–1207.
[9] Wüstenhagen R, Wolsink M, Bürer MJ. Social acceptance of renewable energy
innovation: An introduction to the concept. Energy Policy 2007; 35(5):2683–2691.
[10] Frey G, Linke D. Hydropower as a renewable and sustainable energy resources
meting global energy challenges in a reasonable way. Energy Policy 2002; 30
(14):1261–1265.
[11] Kaldellis J. Critical Evaluation of the Hydropower Applications in Greece.
Renewable and Sustainable Energy Reviews; 2008 12(1):18–234.
[12] BP. Statistical Review of World Energy, June 2009; 2009.
[13] IEA. World Energy Outlook 2007. China and India insights. International Energy
Agency. Paris; 2007.
[14] Juliussen E. Strategy for harnessing small hydro potential in Norway. In:
Hidroenergia 2006 - International Conference and Exhibition on Small
Hydropower and its role in the future of renewable energy, ESHA & BHA, 7–9
June Crieff, Scotland, UK; 2006.
[15] Swiss Federal Office of Energy. Department of the Environment, Transport,
Energy and Communications, Small-scale hydropower, (www.bfe.admin.ch); 2008.
[16] Ecofys, Fraunhofer, EEG, LEI and Seven. Renewable Energy Country Profiles.
Final version February 2008. Utrecht, The Netherlands; 2008.
[17] Kaldellis J, Vlachou, D, Korbakis G. Techno-economic evaluation of small hydro
power plants in Greece: A complete sensitivity analysis. Energy Policy 2005;
33(5):1969–1985.
[18] Nouni M.R, Mullick S.C, Kandpal TC. Techno-economics of micro-hydro projects
for decentralized power supply in India. Energy Policy 2006; 34(10): 1161–1174.
[19] Balat H. A renewable perspective for sustainable energy development in Turkey:
The case of small hydropower plants. Renewable and Sustainable Energy Reviews
2007; 11(9):2152–2165.
[20] Tsoutsos T, Maria E, Mathioudakis V. Sustainable sting procedure of small
hydroelectric pants: The Greek experience. Energy Policy 2007; 35:2946–2959.
[21] Myronidis D, Emmanoloudis D, Arabatzis G. Research on the contribution of small
hydro – electric plants (SHP) to the energy balance of Greece. Journal of

31
Environmental Protection and Ecology 2008; 9(3):616–627.
[22] Géorgakèllos D. Les éléments nécessaires pour la gestion d’un projet de
microcentrale hydroélectrique. Etude de cas d’une PCH en Grèce, Rev Energ Ren
2005; 9:53–62.
[23] ESHA. Environmental Barometer on Small Hydro Power. Brussels, Belgium; 2009.
[24] European Commission. The White Paper for a Community strategy and action plan.
COM (97)559 final. European Commission, Brussels; 1997.
[25] Kaldellis J. The contribution of small hydropower stations to the electricity
generation in Greece: Technical and economic considerations. Energy Policy 2007;
35:2187–2196.
[26] Eurostat. Eurostat Manual of Supply, Use and Input-Output Tables, Luxembourg;
2008.
[27] Ministry of Development. 4th National Report Regarding the Penetration Level of
Renewable Energy Sources up to Year 2010. Athens; 2007.
[28] Regulatory Authority of Energy, (RAE). Available in <http//www.rae.gr>, 2009;
RAE, Athens, Greece.
[29] Hellenic Transmission System Operator. Briefly Report Information. Available in
<http//www.desmie.gr>, 2009; HTSO, Athens, Greece.
[30] Regulatory Authority of Energy, (RAE). Available in <http//www.rae.gr>, 2006;
RAE, Athens, Greece.
[31] All Media. The Economic and Social Profile of the prefectures and regions of
Greece. Αthens; 2008 (in Greek).
[32] Kiochos P. Statistics. Interbooks Publications. Athens; 1993 (in Greek).
[33] Siardos G. Methodology of Rural Sociological Research. Ziti, Thessaloniki; 1997
(in Greek).
[34] Kuriazi N. Sociological Research and Structure of Social Reality, the Qualitative
Approach. In: G. Papageorgiou (ed.) Methods of Sociological Research. Tupothito
– Georgios Dardanos, Athens; 1998, 293–313 (in Greek).
[35] Daoutopoulos G. Social Research Methodology. 3rd
edition. Zygos Publications.
Thessaloniki; 2002 (in Greek).
[36] Greenberg M. Energy sources, public policy, and public preferences: Analysis of
US national and site–specific data. Energy Policy 2009; 37(8):3242–3249.
[37] Sardianou E. Estimating energy conservation patterns of Greek households.
Energy Policy 2007; 35(7):3778–3791.
[38] Del Río P, Burguillo M. An empirical analysis of the impact of renewable energy
deployment on local sustainability. Renewable and Sustainable Energy Reviews
2009; 13(6-7):1314–1325.
[39] Cai J, Jiang Z. Energy consumption patterns by local residents in four nature
reserves in the subtropical broadleaved forest zone of China. Renewable and
Sustainable Energy Reviews 2010; 14(2):828–834.
[40] Sastresa EL, Usón AA, Bribián IZ, Scarpellini S. Local impact of renewables on
employment: Assessment methodology and case study. Renewable and Sustainable
Energy Reviews 2010; 14(2):679–690.
[41] Sternberg R. Hydropower's future, the environment, and global electricity systems.
Renewable and Sustainable Energy Reviews 2010; 14(2):713–723.
[42] Kalamatianou Α. Social Statistics, Unidimensional Analysis Methods. The
Economic, Athens; 1997 (in Greek).
[43] Damianou, Ch. Sampling Methodology: Techniques and Applications. 3rd
edition.

32
Aithra Publications 1999 (in Greek).
[44] Matis Κ. Forest Sampling. Assets Exploitation and Management Society,
Democritus University of Thrace. Xanthi; 2001 (in Greek).
[45] Arabatzis G, Tsantopoulos G, Tampakis S, Soutsas K. Integrated rural development
and the multifunctional role of forests: A theoretical and empirical study. Review
of Economic Sciences 2006; 10:19–38.
[46] Kish, L. Survey Sampling. Wiley; 1995.
[47] Norusis M. SPSS 14. 0. Guide to Data Analysis. Prentice Hall, Upper Saddle River,
NJ; 2006.
[48] Håkansson C, Kriström B, Johansson PO, Leonardsson K. Lundqvist H. Salmon
and Hydropower: Dynamic Cost-Benefit Analysis. Fifth International Symposium
on Ecohydraulics. Congress Proceedings 2004.
[49] San Bruno G, Fried L, Hopwood D. Focus on Small Hydro. Renewable Energy
Focus 2008; 9(6):54–57.
[50] Mendenhall W. Introduction to Probability and Statistics. Fifth Edition. Duxbury
Press; 1979.
[51] Agresti A. Categorical Data Analysis. New York: Wiley–Interscience; 2002.

33
Table 1
Requirements for the installation of RES to achieve the targets for year 2010
Requirements on installed
capacity in 2010 (MW)
Percentage contribution per
type of RES in 2010
Wind Farms 3,648 10.67%
Small Hydropower
Plants 364 1.52%
Large Hydropower Plants 3,325 6.37%
Biomass 103 1.13%
Geothermal 12 0.14%
Photovoltaic 200 0.28%
Total 7,652 20.11%
Source: Ministry of Development. 4th National Report Regarding the Penetration Level of Renewable Energy Sources up to Year 2010. Athens; 2007.

34
Table 2
Number and rated power of SHP stations in operation by prefecture (up to March, 2009)
Regions Number of SHP stations Power (MW)
Eastern Mac. & Thrace 1 0.94
Attica 1 0.63
Western Greece 7 18.75
Western Macedonia 3 4.47
Epirus 14 44.99
Thessaly 9 20.39
Central Macedonia 27 45.21
Peloponnese 3 3.99
Central Greece 15 30.71
Total 80 170.08
Source: Hellenic Transmission System Operator (HTSO) (2009)

35
Map 1
Prefecture of Ioannina

36
Table 3
Installed power (MW) by region of SHP stations in operation in the grid for the years 2004-2009
Dec. 2004 Dec. 2005 Dec. 2006 Dec. 2007 Dec. 2008 March
2009
Eastern Mac. & Thrace 1 1 1 1 1 1
Attica - - - - 1 1
Western Greece 8 8 9 9 19 19
Western Macedonia - - 1 1 4 4
Epirus 9 11 24 34 45 45
Thessaly 5 5 5 6 10 20
Central Macedonia 10 10 16 24 45 45
Peloponnese 1 1 2 4 4 4
Central Greece 9 12 16 17 29 31
Total 43 48 74 96 158 170
Source: H.T.S.O.
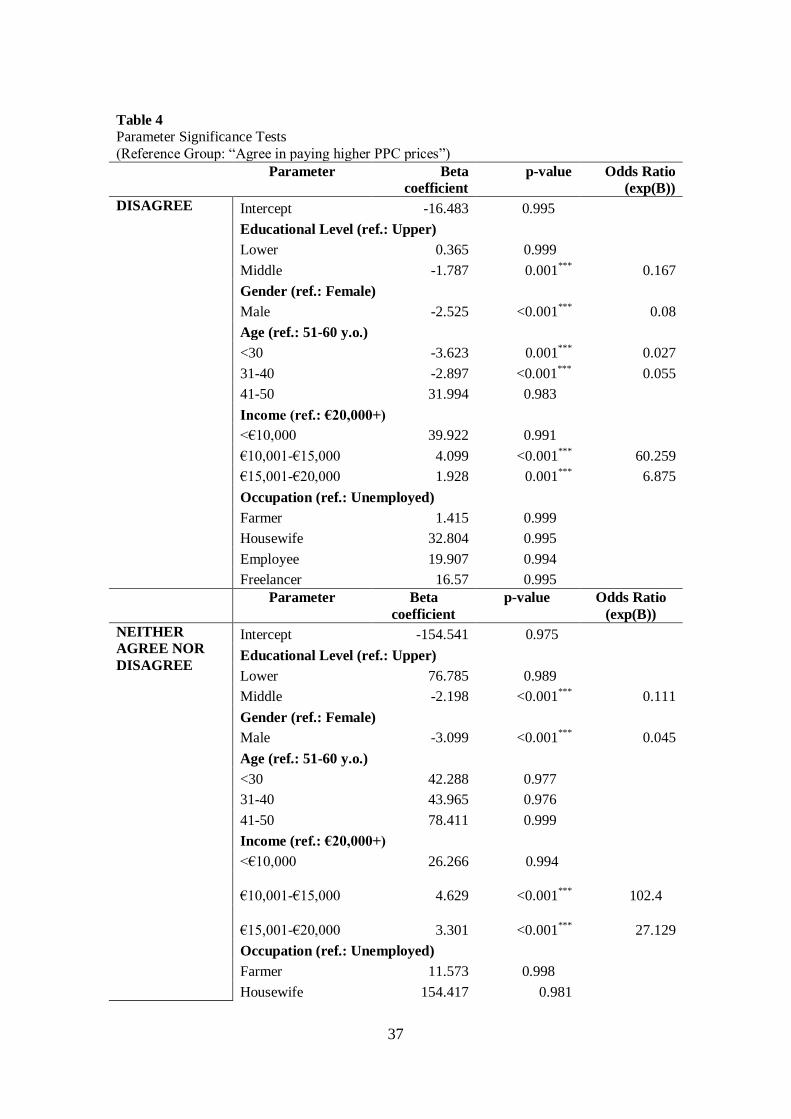
37
Table 4
Parameter Significance Tests
(Reference Group: “Agree in paying higher PPC prices”)
Parameter Beta
coefficient
p-value Odds Ratio
(exp(B))
DISAGREE Intercept -16.483 0.995
Educational Level (ref.: Upper)
Lower 0.365 0.999
Middle -1.787 0.001***
0.167
Gender (ref.: Female)
Male -2.525 <0.001***
0.08
Age (ref.: 51-60 y.o.)
<30 -3.623 0.001***
0.027
31-40 -2.897 <0.001***
0.055
41-50 31.994 0.983
Income (ref.: €20,000+)
<€10,000 39.922 0.991
€10,001-€15,000 4.099 <0.001***
60.259
€15,001-€20,000 1.928 0.001***
6.875
Occupation (ref.: Unemployed)
Farmer 1.415 0.999
Housewife 32.804 0.995
Employee 19.907 0.994
Freelancer 16.57 0.995
Parameter Beta
coefficient
p-value Odds Ratio
(exp(B))
NEITHER
AGREE NOR
DISAGREE
Intercept -154.541 0.975
Educational Level (ref.: Upper)
Lower 76.785 0.989
Middle -2.198 <0.001***
0.111
Gender (ref.: Female)
Male -3.099 <0.001***
0.045
Age (ref.: 51-60 y.o.)
<30 42.288 0.977
31-40 43.965 0.976
41-50 78.411 0.999
Income (ref.: €20,000+)
<€10,000 26.266 0.994
€10,001-€15,000 4.629
<0.001***
102.4
€15,001-€20,000 3.301
<0.001***
27.129
Occupation (ref.: Unemployed)
Farmer 11.573 0.998
Housewife 154.417 0.981

38
Employee 110.436 0.979
Freelancer 106.212 0.98
-2 Log likelihood 182.635
Chi-square test 300.232 <0.001
Nagelkerke’s R Square 0.639
Cox & Snell R Square 0.542
*Coefficient is significant at a 10%significance level; **Coefficient is significant at a 5%significance level; ***Coefficient is significant at a 1% significance level.

39
Table 5
Parameter Significance Tests
(Reference Group: “Agree in paying higher municipal taxes”)
Parameter Beta coefficient p-value Odds Ratio
(exp(B))
DISAGREE Intercept -2.73 0.004***
Educational Level (ref.: Upper)
Lower 3.255 0.015**
25.926
Middle 0.451 0.087* 1.57
Gender (ref.: Female)
Male -0.404 0.173
Age (ref.: 51-60 y.o.)
<30 0.941 0.082*
2.563
31-40 0.27 0.521
41-50 0.567 0.2
Income (ref.: €20,000+)
<€10,000 1.927 0.019**
6.871
€10,001-€15,000 0.335 0.413
€15,001-€20,000 0.445 0.167
Occupation (ref.: Unemployed)
Farmer 0.817 0.439
Housewife 20.887 0.997
Employee 2.131 0.006***
8.427
Freelancer 0.45 0.588
Parameter Beta coefficient p-value Odds Ratio
(exp(B))
NEITHER
AGREE NOR
DISAGREE
Intercept -91.414 <0.001***
Educational Level (ref.: Upper)
Lower -12.98 0.998
Middle 0.677 0.127
Gender (ref.: Female)
Male 1.744 <0.001***
5.721
Age (ref.: 51-60 y.o.)
<30 18.582 0.987
31-40 17.324 0.988
41-50 35.261 0.999
Income (ref.: €20,000+)
<€10,000 36.986 0.986
€10,001-€15,000 18.052 0.987
€15,001-€20,000 -0.519 0.35
Occupation (ref.: Unemployed)
Farmer 21.854 0.996
Housewife 20.75 0.998
Employee 55.081 0.999

40
Freelancer 18.531 0.996
-2 Log likelihood 322.451
Chi-square test 183.350 <0.001
Nagelkerke’s R Square 0.440
Cox & Snell R Square 0.379
*Coefficient is significant at a 10%significance level; **Coefficient is significant at a
5%significance level; ***Coefficient is significant at a 1% significance level.

41
APPENDIX A
Table A1
Socio-Demographic Characteristics of respondents
Frequency Percent
Gender Male 127 33,0
Female 258 67,0
Total 385 100,0
Frequency Percent
Age of member of household 30- 67 17,4
31-40 150 39,0
41-50 119 30,9
51-60 49 12,7
Total 385 100,0
Frequency Percent
Level of education
Lower 18 4,7
Middle 159 41,3
Upper 208 54,0
Total 385 100,0
Frequency Percent
Family income €10,000 - 51 13,2
€10,001-
€15,000 99 25,7
€15,001-€20,000
134 34,8
€20,000+ 101 26,2
Total 385 100,0
Frequency Percent
Occupation of member of household Farmer 23 6,0
Housewife 10 2,6
Employee 296 76,9
Freelancer 24 6,2
Unemployed 32 8,3
Total 385 100,0

Table A2
Opinion relative to characteristics of the prefecture
Frequency Percent
Quality of life is very good Absolutely
disagree 4 1,0
Disagree 103 26,8
Neither agree nor disagree
83 21,6
Agree 138 35,8
Absolutely agree
57 14,8
Total 385 100,0
Frequency Percent
There are no employment
opportunities
Absolutely
disagree 4 1,0
Disagree 52 13,5
Neither agree
nor disagree 76 19,7
Agree 165 42,9
Absolutely
agree 88 22,9
Total 385 100,0
Frequency Percent
Great industrial development Absolutely
disagree 122 31,7
Disagree 222 57,7
Neither agree
nor disagree 26 6,8
Agree 15 3,9
Absolutely
agree 122 31,7
Total 385 100,0
Frequency Percent
The development of the prefecture
relies on renewable energy
There is no development
168 43,6
Little
development 97 25,2
Large development
20 5,2
DK/DA 100 26,0
Total 385 100,0
Frequency Percent
The future development of the
prefecture should be based on
renewable energy
There is no development
12 3,1
Little
development 39 10,1
Large development
284 73,8

DK/DA 50 13,0
Total 385 100,0

Table A3
Public attitudes towards small hydropower stations (%)
Absolutely
agree Agree
Neither agree
nor disagree Disagree
Absolutely
disagree
The construction and operation of
SHP in the prefecture increases
income of the local population
(employees in SH stations)
24,7 46,8 19,0 8,8 0,8
The construction and operation of
SHP in the prefecture ensures the
availability of electricity in
perpetuity
26,8 36,6 28,8 6,5 1,3
The construction and operation of
SHP in the prefecture has little
protective effect on preventing
floods
6,2 32,7 46,5 14,3 0,3
The construction and operation of
SHP in the prefecture improves the
accommodation of residents
through the State fees (2%)
6,8 40,0 44,2 8,3 0,8
The construction and operation of
SHP in the prefecture enhances
various bodies through its
corporate social responsibility and
sponsorship
7,0 46,8 33,5 12,5 0,3
The construction and operation of
SHP in the prefecture reduces the
aesthetics of landscape and
environment in general
13,5 32,7 28,1 22,6 3,1
The construction and operation of
SHP in the prefecture reduces the
fish fauna
11,7 24,9 39,5 23,4 0,5
The construction and operation of
SHP in the prefecture disturbs the
fauna of the prefecture because of
noise from the operation of the
plant
19,2 26,2 36,9 16,1 1,6
The construction and operation of
SHP in the prefecture upgrades
networks (roads,
telecommunications)
16,9 58,7 19,7 4,7 0,0
The construction and operation of
SHP in the prefecture is a pole of
development of ecotourism
8,6 46,5 26,2 16,1 2,6
The construction and operation of
SHP in the prefecture reduces
emissions of carbon dioxide
14,3 36,6 33,2 12,5 3,4
Legislation in relation to the
construction of SHP stations
should be more strict
22,1 43,9 23,1 9,1 1,8
The licensing process for the
construction of SHP stations 10,9 35,3 24,9 22,3 6,5

should be quick and simple
Yes No
Don’t
know
Believe that the council gained the
maximum economic benefits of the
local community by investors of
SHP stations
8,1 24,4 67,5

Table A4
Priorities in Future Potential Benefits from Installation of SHP stations in the Prefecture
Frequency Percent
Priority should be given in future
potential benefit from SHP stations:
Recreation for the local population
Low priority 34 8,8
Medium priority 199 51,7
High priority 152 39,5
Total 385 100,0
Frequency Percent
Priority should be given in future
potential benefit from SHP stations:
Creating employment opportunities
Low priority 2 0,5
Medium priority 55 14,3
High priority 328 85,2
Total 385 100,0
Frequency Percent
Priority should be given in future
potential benefit from SHP stations:
Protection of the nature
Low priority 1 0,3
Medium priority 29 7,5
High priority 355 92,2
Total 385 100,0
Frequency Percent
Priority should be given in future
potential benefit from SHP stations:
Creating an attractive and beautiful
landscape
Low priority 12 3,1
Medium priority 100 26,0
High priority 273 70,9
Total 385 100,0
Frequency Percent
Priority should be given in future
potential benefit from SHP stations:
Protect air, water and soil
Low priority 1 0,3
Medium priority 39 10,1
High priority 345 89,6
Total 385 100,0
Frequency Percent
Priority should be given in future
potential benefit from SHP stations:
Production of electrical energy
Low priority 0 0,0
Medium priority 84 21,8
High priority 301 78,2
Total 385 100,0
Frequency Percent
Priority should be given in future
potential benefit from SHP stations:
Financial support of the local
community
Low priority 3 0,8
Medium priority 84 21,8
High priority 298 77,4
Total 385 100,0

Table A5
Willingness-to-pay (WTP) for Obtaining Electricity from SHP stations
Frequency Percent
Willing to pay higher PPC prices for
increased SHP stations contribution
in electricity generation
Absolutely disagree 98 25,5
Disagree 134 34,8
Neither agree
nor disagree
92 23,9
Agree 61 15,8
Absolutely agree 0 0,0
Total 385 100,0
Frequency Percent
Willing to pay higher municipal taxes
for the construction of municipal
SHP stations, with the benefit of
lower electrical energy in the future
Absolutely disagree 93 24,2
Disagree 86 22,3
Neither agree
nor disagree
50 13,0
Agree 137 35,6
Absolutely agree 19 4,9
Total 385 100,0

Table A6 Willing to pay higher PPC prices for increased SHP stations contribution in electricity
generation
Absolutely
disagree
Disagree
Neither agree
nor disagree
Agree Total
Gender Male 36 41 20 30 127
28,3% 32,3% 15,7% 23,6% 100,0%
Female 62 93 72 31 258
24,0% 36,0% 27,9% 12,0% 100,0%
Total 98 134 92 61 385
25,5% 34,8% 23,9% 15,8% 100,0%
Pearson Chi-square: 13.47, df=3, p-value=0.004
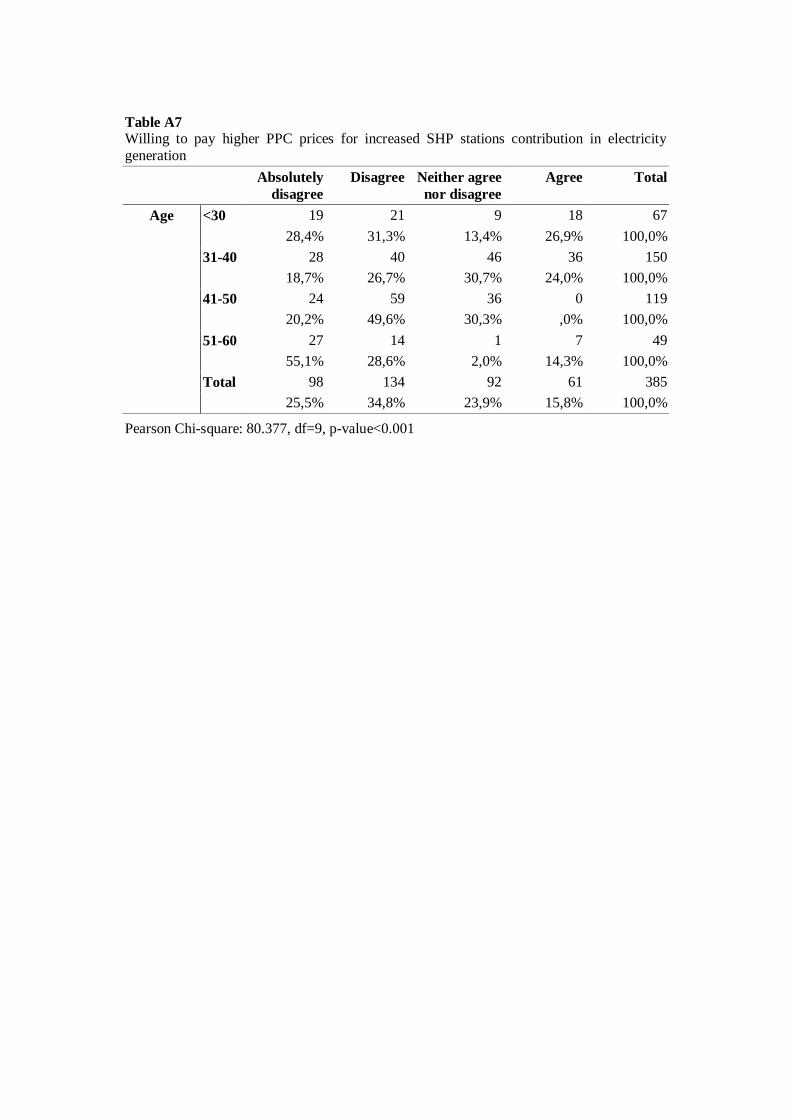
Table A7 Willing to pay higher PPC prices for increased SHP stations contribution in electricity
generation
Absolutely
disagree
Disagree Neither agree
nor disagree
Agree Total
Age <30 19 21 9 18 67
28,4% 31,3% 13,4% 26,9% 100,0%
31-40 28 40 46 36 150
18,7% 26,7% 30,7% 24,0% 100,0%
41-50 24 59 36 0 119
20,2% 49,6% 30,3% ,0% 100,0%
51-60 27 14 1 7 49
55,1% 28,6% 2,0% 14,3% 100,0%
Total 98 134 92 61 385
25,5% 34,8% 23,9% 15,8% 100,0%
Pearson Chi-square: 80.377, df=9, p-value<0.001

Table A8 Willing to pay higher PPC prices for increased SHP stations contribution in electricity
generation
Absolutely
disagree
Disagree Neither agree
nor disagree
Agree Total
Education Lower 16 1 1 0 18
88,9% 5,6% 5,6% 0,0% 100,0%
Middle 45 57 28 29 159
28,3% 35,8% 17,6% 18,2% 100,0%
Upper 37 76 63 32 208
17,8% 36,5% 30,3% 15,4% 100,0%
Total 98 134 92 61 385
25,5% 34,8% 23,9% 15,8% 100,0%
Pearson Chi-square: 50.592, df=6, p-value<0.001
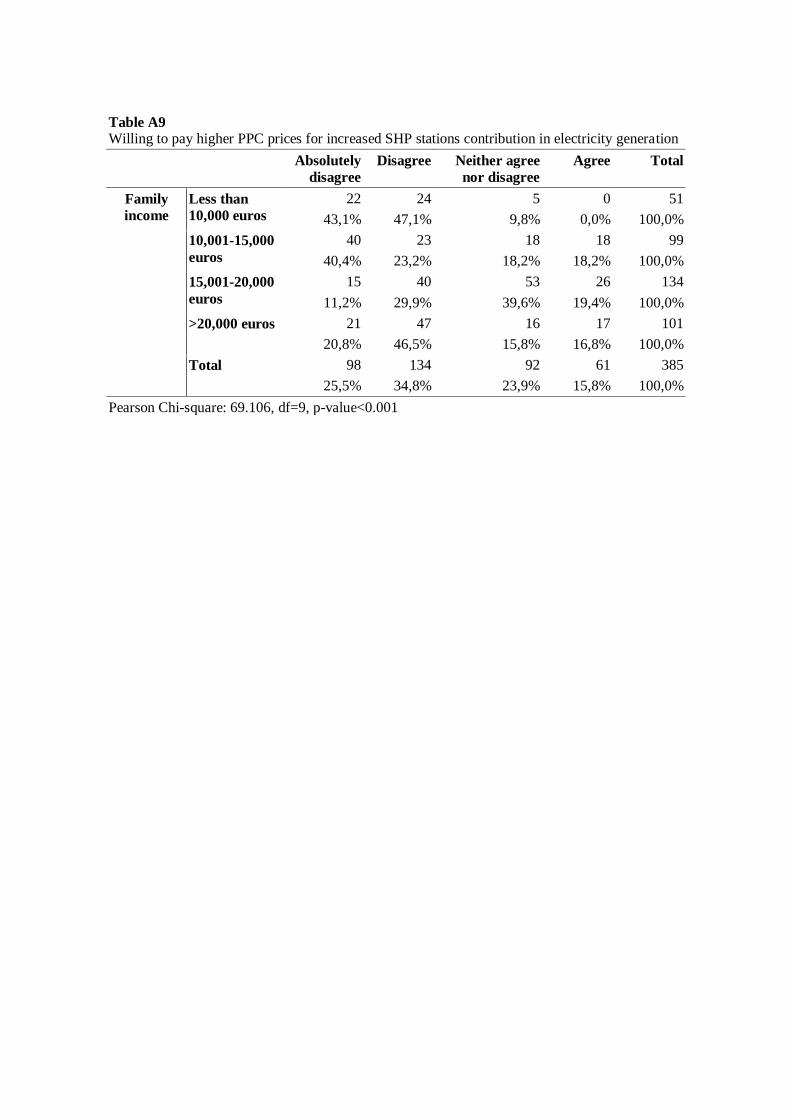
Table A9 Willing to pay higher PPC prices for increased SHP stations contribution in electricity generation
Absolutely
disagree
Disagree Neither agree
nor disagree
Agree Total
Family
income
Less than
10,000 euros
22 24 5 0 51
43,1% 47,1% 9,8% 0,0% 100,0%
10,001-15,000
euros
40 23 18 18 99
40,4% 23,2% 18,2% 18,2% 100,0%
15,001-20,000
euros
15 40 53 26 134
11,2% 29,9% 39,6% 19,4% 100,0%
>20,000 euros 21 47 16 17 101
20,8% 46,5% 15,8% 16,8% 100,0%
Total 98 134 92 61 385
25,5% 34,8% 23,9% 15,8% 100,0%
Pearson Chi-square: 69.106, df=9, p-value<0.001

Table A10 Willing to pay higher PPC prices for increased SHP stations contribution in electricity generation
Absolutely
disagree
Disagree Neither agree
nor disagree
Agree Total
Occupation Farmer 17 1 0 5 23
73,9% 4,3% 0,0% 21,7% 100,0%
Housewife 6 0 4 0 10
60,0% 0,0% 40,0% 0,0% 100,0%
Employee 67 105 87 37 296
22,6% 35,5% 29,4% 12,5% 100,0%
Freelancer 3 7 1 13 24
12,5% 29,2% 4,2% 54,2% 100,0%
Unemployed 5 21 0 6 32
15,6% 65,6% 0,0% 18,8% 100,0%
Total 98 134 92 61 385
25,5% 34,8% 23,9% 15,8% 100,0%
Pearson Chi-square: 96.702, df=12, p-value<0.001

Table A11 Willing to pay higher municipal taxes for the construction of municipal SHP stations, with the benefit
of lower electrical energy in the future
Absolutel
y
disagree
Disagree Neither agree
nor disagree
Agree Absolutely
agree
Total
Gender Male 33 16 24 45 9 127
26,0% 12,6% 18,9% 35,4% 7,1% 100,0%
Female 60 70 26 92 10 258
23,3% 27,1% 10,1% 35,7% 3,9% 100,0%
Total 93 86 50 137 19 385
24,2% 22,3% 13,0% 35,6% 4,9% 100,0%
Pearson Chi-square: 15.187, df=4, p-value=0.004

Table A12 Willing to pay higher municipal taxes for the construction of municipal SHP stations, with the
benefit of lower electrical energy in the future
Absolutel
y disagree
Disagree Neither agree
nor disagree
Agree Absolutely
agree
Total
Age <30 17 11 15 24 0 67
25,4% 16,4% 22,4% 35,8% 0,0% 100,0%
31-40 27 47 7 59 10 150
18,0% 31,3% 4,7% 39,3% 6,7% 100,0%
41-50 26 23 28 33 9 119
21,8% 19,3% 23,5% 27,7% 7,6% 100,0%
51-60 23 5 0 21 0 49
46,9% 10,2% 0,0% 42,9% 0,0% 100,0%
Total 93 86 50 137 19 385
24,2% 22,3% 13,0% 35,6% 4,9% 100,0%
Pearson Chi-square: 64.171, df=12, p-value<0.001

Table A13 Willing to pay higher municipal taxes for the construction of municipal SHP stations, with the
benefit of lower electrical energy in the future
Absolutely
disagree
Disagree Neither agree
nor disagree
Agree Absolutely
agree
Total
Education Lower 17 0 0 1 0 18
94,4% 0,0% 0,0% 5,6% 0,0% 100,0%
Middle 46 34 23 45 11 159
28,9% 21,4% 14,5% 28,3% 6,9% 100,0%
Upper 30 52 27 91 8 208
14,4% 25,0% 13,0% 43,8% 3,8% 100,0%
Total 93 86 50 137 19 385
24,2% 22,3% 13,0% 35,6% 4,9% 100,0%
Pearson Chi-square: 67.307, df=8, p-value<0.001

Table A14 Willing to pay higher municipal taxes for the construction of municipal SHP stations, with the
benefit of lower electrical energy prices in the future
Absolutely
disagree
Disagree Neither agree
nor disagree
Agree Absolutely
agree
Total
Family
income
Less than
10.000 euros
24 10 3 14 0 51
47,1% 19,6% 5,9% 27,5% 0,0% 100,0%
10,001-15,000
euros
39 3 19 38 0 99
39,4% 3,0% 19,2% 38,4% 0,0% 100,0%
15,001-20,000
euros
15 50 9 49 11 134
11,2% 37,3% 6,7% 36,6% 8,2% 100,0%
>20,000 euros 15 23 19 36 8 101
14,9% 22,8% 18,8% 35,6% 7,9% 100,0%
Total 93 86 50 137 19 385
24,2% 22,3% 13,0% 35,6% 4,9% 100,0%
Pearson Chi-square: 88.637, df=12, p-value<0.001

Table A15 Willing to pay higher municipal taxes for the construction of municipal SHP stations, with the benefit of
lower electrical energy prices in the future
Absolutely
disagree
Disagree Neither agree
nor disagree
Agree Absolutely
agree
Total
Occupation Farmer 17 0 0 5 1 23
73,9% 0,0% 0,0% 21,7% 4,3% 100,0%
Housewife 10 0 0 0 0 10
100,0% 0,0% 0,0% 0,0% 0,0% 100,0%
Employee 59 73 50 96 18 296
19,9% 24,7% 16,9% 32,4% 6,1% 100,0%
Freelancer 2 3 0 19 0 24
8,3% 12,5% 0,0% 79,2% 0,0% 100,0%
Unemployed 5 10 0 17 0 32
15,6% 31,3% 0,0% 53,1% 0,0% 100,0%
Total 93 86 50 137 19 385
24,2% 22,3% 13,0% 35,6% 4,9% 100,0%
Pearson Chi-square: 103.585, df=16, p-value<0.001

Table A16 Willing to pay higher municipal taxes for the construction of municipal SHP stations, with the benefit of lower
electrical energy prices in the future
Absolutely
disagree
Disagree Neither agree
nor disagree
Agree Absolutely
agree
Total
Willing to pay
higher PPC
prices for
increased SHP
stations
contribution
in electricity
generation
Absolutely
disagree
68 20 5 5 0 98
69,4% 20,4% 5,1% 5,1% 0,0% 100,0%
Disagree 20 29 26 50 9 134
14,9% 21,6% 19,4% 37,3% 6,7% 100,0%
Neither agree
nor disagree
4 37 15 36 0 92
4,3% 40,2% 16,3% 39,1% 0,0% 100,0%
Agree 1 0 4 46 10 61
1,6% ,0% 6,6% 75,4% 16,4% 100,0%
Total 93 86 50 137 19 385
24,2% 22,3% 13,0% 35,6% 4,9% 100,0%
Pearson Chi-square: 233.804, df=12, p-value<0.001

Table A17
Willing to pay higher PPC prices for increased SHP stations contribution in electricity generation
Absolutely
disagree
Disagree Neither agree
nor disagree
Agree Absolutely
agree
Total
The
construction
and
operation of
SHP stations
in the
prefecture
increases
income of the
local
population
(employees in
SHP stations)
Absolutely
disagree
1 1 0 1 0 3
33,3% 33,3% 0,0% 33,3% 0,0 100,0%
Disagree 2 15 10 7 0 34
5,9% 44,1% 29,4% 20,6% 0,0 100,0%
Neither agree
nor disagree
35 20 10 8 0 73
47,9% 27,4% 13,7% 11,0% 0,0 100,0%
Agree 57 59 33 31 0 180
31,7% 32,8% 18,3% 17,2% 0,0 100,0%
Absolutely
agree
3 39 39 14 0 95
3,2% 41,1% 41,1% 14,7% 0,0 100,0%
Total 98 134 92 61 0 385
25,5% 34,8% 23,9% 15,8% 0,0 100,0%
Pearson Chi-square: 65.067, df=12, p-value<0.001

Table A18
Willing to pay higher municipal taxes for the construction of municipal SHP stations, with the benefit of lower electrical energy prices in the future
Absolutely
disagree
Disagree Neither agree
nor disagree
Agree Absolutely
agree
Total
The construction
and operation of
SHP stations in
the prefecture
increases income
of the local
population
(employees in
SHP stations)
Absolutely
disagree
2 0 0 0 1 3
66,7% 0,0% ,0% 0,0% 33,3% 100,0%
Disagree 5 1 15 12 1 34
14,7% 2,9% 44,1% 35,3% 2,9% 100,0%
Neither
agree nor
disagree
25 20 16 12 0 73
34,2% 27,4% 21,9% 16,4% 0,0% 100,0%
Agree 58 46 0 59 17 180
32,2% 25,6% 0,0% 32,8% 9,4% 100,0%
Absolutely
agree 3 19 19 54 0 95
3,2% 20,0% 20,0% 56,8% 0,0% 100,0%
Total
93 86 50 137 19 385
24,2% 22,3% 13,0% 35,6% 4,9% 100,0%
Pearson Chi-square: 136.221, df=16, p-value<0.001
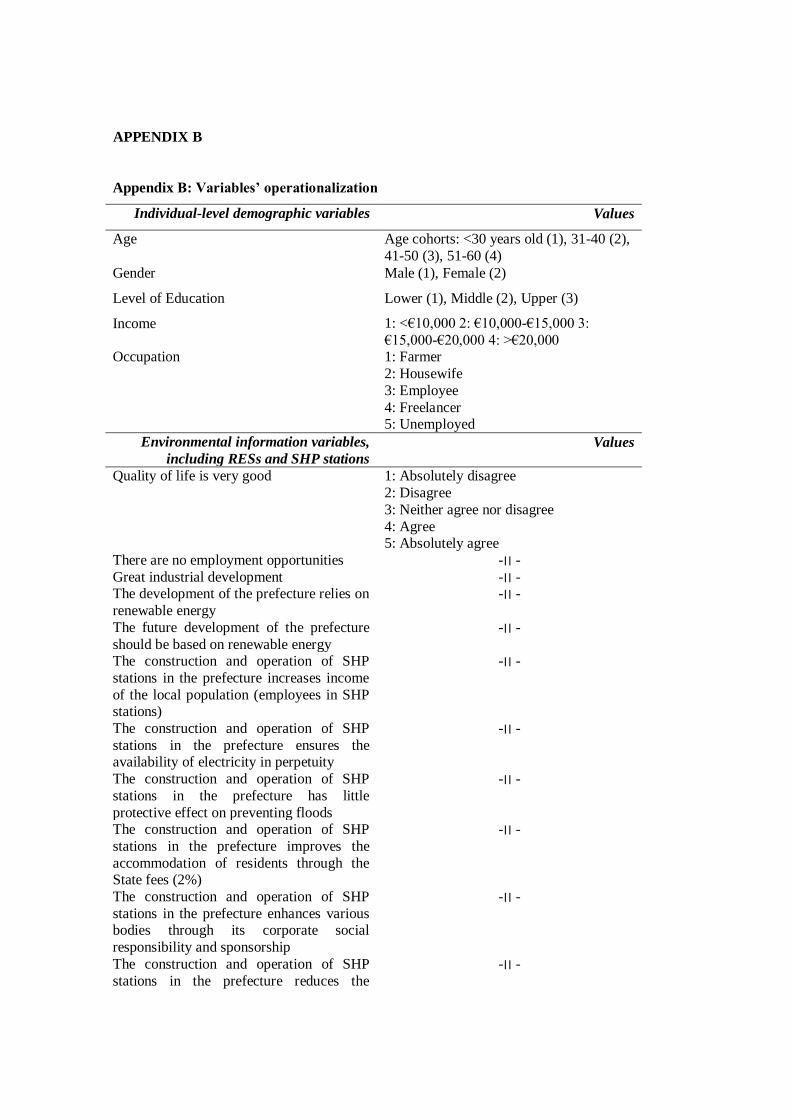
APPENDIX B
Appendix B: Variables’ operationalization
Individual-level demographic variables Values
Age Age cohorts: <30 years old (1), 31-40 (2),
41-50 (3), 51-60 (4)
Gender Male (1), Female (2)
Level of Education Lower (1), Middle (2), Upper (3)
Income 1: <€10,000 2: €10,000-€15,000 3:
€15,000-€20,000 4: >€20,000 Occupation 1: Farmer
2: Housewife
3: Employee
4: Freelancer 5: Unemployed
Environmental information variables,
including RESs and SHP stations
Values
Quality of life is very good 1: Absolutely disagree
2: Disagree
3: Neither agree nor disagree
4: Agree 5: Absolutely agree
There are no employment opportunities -׀׀ -
Great industrial development -׀׀ - The development of the prefecture relies on
renewable energy
- ׀׀-
The future development of the prefecture
should be based on renewable energy
- ׀׀-
The construction and operation of SHP
stations in the prefecture increases income
of the local population (employees in SHP stations)
- ׀׀-
The construction and operation of SHP
stations in the prefecture ensures the availability of electricity in perpetuity
- ׀׀-
The construction and operation of SHP
stations in the prefecture has little
protective effect on preventing floods
- ׀׀-
The construction and operation of SHP
stations in the prefecture improves the
accommodation of residents through the State fees (2%)
- ׀׀-
The construction and operation of SHP
stations in the prefecture enhances various bodies through its corporate social
responsibility and sponsorship
- ׀׀-
The construction and operation of SHP
stations in the prefecture reduces the
- ׀׀-

aesthetics of landscape and environment in
general
The construction and operation of SHP in the prefecture reduces the fish fauna
- ׀׀-
The construction and operation of SHP
stations in the prefecture disturbs the fauna
of the prefecture because of noise from the operation of the plant
- ׀׀-
The construction and operation of SHP
stations in the prefecture upgrades networks (roads, telecommunications)
- ׀׀-
The construction and operation of SHP
stations in the prefecture is a pole of
development of ecotourism
- ׀׀-
The construction and operation of SHP
stations in the prefecture reduces emissions
of carbon dioxide
- ׀׀-
Believe that the council gained the
maximum economic benefits of the local
community by investors of SHP stations
- ׀׀-
Legislation in relation to the construction
of SHP stations should be more strict
- ׀׀-
The licensing process for the construction
of SHP stations should be quick and simple
- ׀׀-
Priority should be given in future potential
benefit from SHP stations: Recreation for
the local population
1: Low priority
2: Medium priority
3: High priority Priority should be given in future potential
benefit from SHP stations: Creating
employment opportunities
- ׀׀-
Priority should be given in future potential
benefit from SHP stations: Protection of the
nature
- ׀׀-
Priority should be given in future potential benefit from SHP stations: Creating an
attractive and beautiful landscape
- ׀׀-
Priority should be given in future potential benefit from SHP stations: Protect air,
water and soil
- ׀׀-
Priority should be given in future potential
benefit from SHP stations: Production of electrical energy
- ׀׀-
Priority should be given in future potential
benefit from SHP stations: Financial support of the local community
- ׀׀-
Dependent variables Values
Willing to pay higher PPC prices
for increased SHP stations
contribution in electricity generation
1: Absolutely disagree
2: Disagree
3: Neither agree nor disagree 4: Agree
5: Absolutely agree
Willing to pay higher municipal 1: Absolutely disagree

taxes for the construction of
municipal SHP stations, with the
benefit of lower electrical energy prices in the future
2: Disagree
3: Neither agree nor disagree
4: Agree 5: Absolutely agree