Small & Medium Healthcare Market Sector Profile Final Report
21
Market Sector Profile: Small and Medium Healthcare - Final Massachusetts Program Administrators and EEAC Consultants Prepared by DNV GL 9/26/14
Transcript of Small & Medium Healthcare Market Sector Profile Final Report
Market Sector Profile: Small and Medium Healthcare - Final Massachusetts Program Administrators and EEAC Consultants
Prepared by DNV GL 9/26/14

Project name: DNV GL [Business Area] [Unit/Division/Descriptor] [Office Post 1] [Office Post 2] [Office Post 3] [Office Post 4] Tel: [+00 000 000 000] [Enterprise No]
Report title: Customer: , [Address] C person: [Contact person] Date of issue: Project No.: [Project No.] Organization unit: [Name of unit] Report No.: , Rev. Document No.:
Task and objective:

KEMA, Inc. Page i
Table of Contents
1. INTRODUCTION ............................................................................................................ 1
2. INDUSTRY OVERVIEW ................................................................................................... 2
3. HEALTHCARE FACILITY CHARACTERISTICS ...................................................................... 4 3.1 Building Characteristics 4 3.2 Customer Characteristics 6 3.3 Equipment Characteristics 11
4. KEY FINDINGS ........................................................................................................... 16
KEMA, Inc. Page 1
1. INTRODUCTION
This market sector profile is provided as part of the Massachusetts Existing Buildings Market Characterization study. It provides an overview of the small and medium healthcare industry12 (not including large hospitals) using industry information and the Massachusetts Commercial and Industrial (C&I) Telephone Survey data collected between September and December 2013.
The purpose of the market sector profile is to:
1. Provide the Massachusetts Program Administrators (PAs) and Energy Efficiency Advisory Council (EEAC) Consultants with a more detailed understanding of the small/medium healthcare industry excluding large hospitals.
2. Identify key customer data and show the distribution of building, decision making and equipment characteristics across customer size segments and building uses.
3. Identify key potential energy efficiency opportunities or areas that warrant further investigation using primary and secondary data.
Methodology / Data Sources
The market sector profiles were developed by:
1. Analyzing the buildings, operations and maintenance practice, and equipment information collected from healthcare facilities during the Massachusetts C&I Customer Telephone Survey conducted on behalf of the PAs and EEAC in the fall of 2013.
2. Collecting and reviewing information on the healthcare industry from secondary data sources including: the California Energy Use Survey (CEUS) but not limited to; Commercial Buildings Energy Consumption Survey (CBECS); Energy Information Administration (EIA), and the Department of Energy.
3. Comparing the data from the Massachusetts C&I Telephone Survey with the secondary sources and reporting the results.
Sixty-six of the respondents to the Massachusetts C&I Telephone Survey were considered small or medium size healthcare customers. Fourteen of those customers were medium sized healthcare facilities and 52 were small healthcare facilities. Eighteen surveyed were larger healthcare facilities although they are not included within this profile.
1 Small and medium sized healthcare facilities were defined in this research according to their level of electricity demand (kW). Small healthcare facilities have less than 300 kW demand while medium size healthcare facilities have an annual demand of 300 to 750 kW. 2 Healthcare Industry is defined based on CBECS definition of buildings that are used as diagnostic and treatment facilities for inpatient/outpatient
care. Note: Unless otherwise stated, all results presented within the document are weighted by the kWh usage of the respondent so results presented are proportional to the usage of the facility.

KEMA, Inc. Page 2
Due to the number of respondents in each of the sub-categories (i.e. small and medium healthcare) the findings may not be representative of all small and medium healthcare buildings in Massachusetts. Survey findings are reported accordingly.
This profile contains:
- A general industry overview - A synopsis of healthcare customer characteristics according to industry data and the telephone
survey (building, customer, and equipment characteristics) - Key findings
2. INDUSTRY OVERVIEW The healthcare sector primarily consists of businesses engaged in medical, dental and veterinary services. For the purposes of this report, it includes small to medium hospitals as well as in-patient and out-patient services. According to the Commercial Building Energy Consumption Survey (CBECS)3, healthcare can generally be divided into nine sub-sectors according to business functions:
Hospital-Small-Medium Alcohol/Drug Treatment/Rehabilitation
Extended Care (including Assisted Living/Nursing Homes)
Doctor's Office
Medical/Dental Office Dentist's Office
Clinic/Outpatient Care Veterinary Hospital/Clinic
Medical/Dental Lab
Where most large healthcare customers in the MA C&I Telephone Survey were hospitals (72%), small and medium-sized healthcare customers were primarily assisted living/nursing home facilities, alcohol/drug treatment/rehabilitation facilities and medical/dental offices. A small percentage are considered small hospitals.
The energy intensity for small and medium-sized healthcare facilities’ ranges from very high to low, depending on the type of care and inpatient/outpatient setting. Hospitals are one of the most energy intensive building types, second only to restaurants, due to round-the-clock operations and air quality needs.4 Nursing homes and outpatient facilities use about half as much energy per square foot annually as hospitals (143,000 Btu/ft2 vs. 259,000 Btu/ft2).5 Medical offices are the least energy intensive among healthcare facilities, using 78,000 Btu/ft2 annually, and have energy needs similar to office buildings.6
According to EIA data, cooling, lighting, and ventilation account for up to 73% of electricity use in healthcare facilities (inpatient and outpatient), and space heating accounts for up to 56% of natural gas use.7 Inpatient facilities have larger energy loads for water heating and ventilation due to occupancy hours and the need for continuous air exchange to prevent airborne disease transmission.
3 The Commercial Buildings Energy Consumption Survey (CBECS) is a national sample survey administered by the U.S. Energy Information
Administration that collects information on the stock of U.S. commercial buildings, including their energy-related building characteristics and energy usage data (consumption and expenditures)
4 NREL, Advanced Energy Retrofit Guide — Healthcare Facilities, Prepared for: U.S. DOE, Energy Efficiency & Renewable Energy. http://www.nrel.gov/docs/fy13osti/57864.pdf
5 DOE, Commercial Buildings Energy Consumption Survey (CBECS), 2003. Washington, DC: U.S. Department of Energy. http://www.eia.gov/emeu/cbecs
6 Ibid. 7 NREL, Advanced Energy Retrofit Guide — Healthcare Facilities, Prepared for: U.S. DOE, Energy Efficiency & Renewable Energy.
http://www.nrel.gov/docs/fy13osti/57864.pdf

KEMA, Inc. Page 3
Small/Medium extended care buildings tend to be similar to large multi-family buildings rather than to large hospitals in their energy profiles. These facilities are typically more concerned with residents’ comfort and safety which has implications for the types of energy-using equipment they have.
The reasons energy demands are higher at hospitals, clinics, and extended care operations are:
High Efficiency Particulate Air (HEPA) filtration is required to prevent the spread of disease (also known as nosocomial infection) in the ventilation system. HEPA filters that achieve 99.7% efficiency3 place greater electric demand on fans for proper air circulation
Stringent indoor air quality (IAQ) levels must be maintained, especially in operating rooms (OR), emergency rooms (ER), intensive care units (ICU), and laboratories. These rooms require 20 to 30 air changes per hour.
Certain types of rooms have special HVAC pressurization requirements. ORs, ERs, and ICUs generally run over-pressure for protective isolation from airborne infection. Quarantine rooms require negative pressure (and UV lights) for infectious isolation and the control of diseases.
IAQ must be strictly regulated for temperature, humidity, and quality. This increases the need for proper heating, cooling, and fresh air intake.
Domestic hot water must be heated to 130°F to kill Legionella bacteria. But then the water temperature has to be lowered to 105°F before use.
Some rooms require climate control set at 60°F to accommodate the adhesive cement used for orthopedics, which tend to set too quickly in warmer temperatures.
Laundry facilities and kitchens can consume 10-15% of the building’s energy, increasing the need to more closely monitor hours of peak demand from these sources.
Hospitals require that power be provided at 100% uptime for patient care and liability concerns. Backup generators contribute to increased operating costs, or cogeneration (also known as combined heat and power, or CHP) investment may be necessary. 8
The economic outlook is positive for all healthcare sectors (i.e. inpatient, outpatient, medical / dental office, etc.) due to shifting demographics and expanded health insurance coverage under the Patient Protection and Affordable Care Act (PPACA). Forecasted sector growth is roughly 4 to 5 percent annually during the period 2013-2018. 9 The aging U.S. population will boost growth for many healthcare facilities and assisted living in particular - the fastest growing long-term care option for seniors.10 According to IBISWorld research, baby boomers expectations will shape these facilities into more “home-like” designs with improved amenities and better lighting.11 Advanced lighting technology, such as LEDs, photosensors and occupancy sensors, can mitigate facility residents’ safety concerns and decrease falls, a major concern among elderly patients.12 Substance abuse/mental health facilities are benefiting from better insurance coverage and the rise in patients seeking treatment,13 but some downward pressure on sector revenues is expected due to the rise in Medicaid coverage and decreasing Medicare reimbursement rates.14 8 TAC by Schneider Electric, Leading Techniques for Energy Savings in Healthcare Facilities, 2006. 9 Forecasted growth varies by subsector, from approximately 4 to 5.4 percent, according to IBISWorld research reports, Hospitals in the U.S.
(February 2014); Retirement Communities in the U.S. (February 2014); Mental Health and Substance Abuse Clinics (March 2014). 10 Gerace, Alyssa. “Retirement Community Industry Revenues to Hit $70 Billion by 2018,” Senior Housing News, April 16, 2013. Accessed April 21,
2014 at: http://seniorhousingnews.com/2013/04/16/retirement-community-industry-revenues-to-hit-70-billion-by-2018 11 Gerace, Alyssa. “Retirement Community Industry Revenues to Hit $70 Billion by 2018,” Senior Housing News, April 16, 2013. Accessed April 21,
2014 at: http://seniorhousingnews.com/2013/04/16/retirement-community-industry-revenues-to-hit-70-billion-by-2018/ 12Reitter Elia, Carol, “LED Lighting in Senior Living: Friend or Foe?” Long-Term Living. February 26, 2013. http://www.ltlmagazine.com/article/led-
lighting-senior-living-friend-or-foe-1 13 IBISWorld, Mental Health and Substance Abuse Clinics Market Research Report, February 2014.
http://www.ibisworld.com/industry/default.aspx?indid=1568 14 IBISWorld, Hospitals Market Research Report, February 2014. http://www.ibisworld.com/industry/default.aspx?indid=1587

KEMA, Inc. Page 4
3. HEALTHCARE FACILITY CHARACTERISTICS
3.1 Building Characteristics Of those who responded to the telephone survey, small healthcare facilities primarily consisted of clinics / outpatient care facilities and doctor’s offices, while medium size healthcare facilities consisted of assisted living, medical or dental offices, and drug and alcohol treatment facilities. Ownership of buildings: Nearly 54% (by kWh)15 of all the small and 63% of the medium healthcare facilities interviewed in the C&I Telephone Survey owned their facilities. Approximately 12.5%rented their business premises (Figure 3-1).
Types of buildings occupied: Of the customers surveyed, nearly 60% operated out of single, unattached buildings while 2.4% indicated they operated from a space that is part of a low-rise complex. Approximately 13% of the small and medium healthcare facilities operating in single, unattached buildings were below 5000 square feet in size.
Duration of the establishment/ length of occupancy: Less than 17% of small and medium healthcare customer indicated they operated in buildings that were built after 1990; however, 16% did not know when the building was constructed. Nearly 54% of all customers indicated the company had done business out of the same building more the 25 years. Nearly 16% indicated they had conducted business out of the building less than 10 years.
15 All C&I Telephone Survey Data weighted by kWh unless otherwise noted
Figure 3-1. Respondent Status

KEMA, Inc. Page 5
Figure 3-2. Leasing Arrangements (by kWh) 16
One of the main deterrents to energy efficient improvements can be commercial real estate leasing structures and the issue of “split incentives.” There are two types of lease arrangements: a gross lease and a net lease. A Gross lease is where the landlord of the building pays the property taxes, operating costs and building insurance. A Net lease is where the tenants of the building pay either property taxes, building insurance and/or operating costs in addition to paying the rent for the building. A Triple Net Lease is one such type of net lease in which the customer pays property tax, building insurance and utility costs.
Approximately three quarters of the healthcare facilities who reported their lease structure were under a gross lease. Net and modified gross leases, where the owner bears the costs of capital improvements and the tenants pay operating expenses, are common in the commercial real estate industry. Under these types of agreements, the building owners have to make the investment while the tenant becomes the beneficiary of the reduced operating expenses. The result is the building owners have little direct financial incentive to invest in more efficiency equipment.17
Of the customers who reported their lease structure about a quarter of the small and medium size facilities had triple-net leases wherein they were responsible for their own utility costs. Based upon the survey results, 4% of small healthcare facilities paid the owner a varying fee based upon the utility bill for the entire building. Typically the fee was correlated to share of floor space leased by the tenant.
For facilities that may be owner occupied, there is more incentive to invest in energy efficiency measures and avail of incentives since they would be able to directly benefit from the lower energy costs. However, apart from the issue of split incentive, there are other barriers to energy efficiency. Despite being cost effective investments, often energy efficiency equipment is not necessarily pursued due to a variety of reasons. Some of the key barriers to energy efficiency cited by respondents included lack of capital and
16 This data is based on those that reported their lease structure. 17 Rocky Mountain Institute / Building Owners and Managers Association, “Working Together for Sustainability: The RMI – BOMA Guide for Landlords
and Tenants,” June 2012 Other options in Table 3-1 include facilities that offer counselling services, massage and acupuncture, drug testing etc.

KEMA, Inc. Page 6
resources to install measures and administrative requirements, uncertainty in future energy savings and payback period, lack of information regarding technology integration.
3.2 Customer Characteristics More than half of the healthcare customers surveyed in the Massachusetts C&I Customer Telephone Survey were medical or dental offices, outpatient care centers, and doctors’ offices. Others who were surveyed included assisted living facilities, hospitals, and drug and alcohol treatment facilities. These customers were generally concentrated in urban and metropolitan areas in eastern and central Massachusetts.
Table 3-1. Healthcare Customer Telephone Survey Distribution
Type of Healthcare Small Healthcare
Medium Healthcare
Hospital 6.1% 21.6%
Extended Care 25.8% 27%
Medical / Dental Office 9.9% 15.3%
Clinic / Outpatient 29.8% 0%
Alcohol / Drug Treatment 3.6% 24.5%
Doctor’s Office 7.4% 0%
Dentist’s Office 2.5% 0.0%
Veterinary Hospital/Clinic .7%
Other 1.8% 6.7%
KEMA, Inc. Page 7
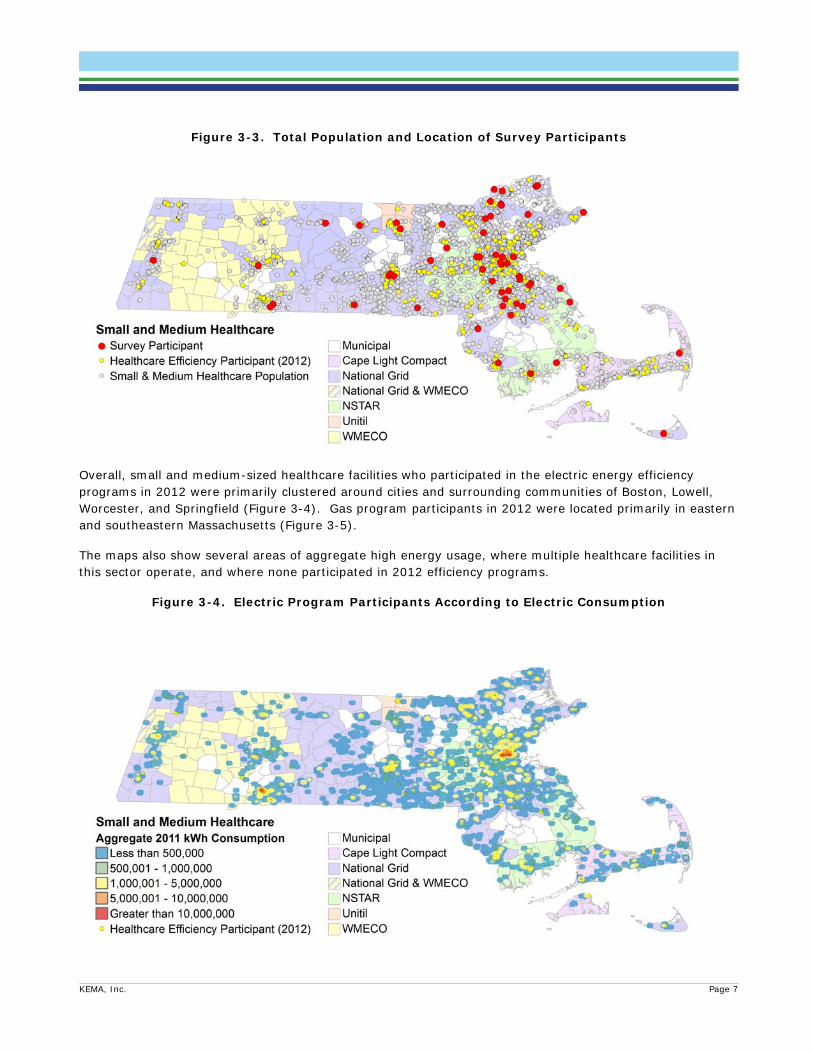
Figure 3-3. Total Population and Location of Survey Participants
Overall, small and medium-sized healthcare facilities who participated in the electric energy efficiency programs in 2012 were primarily clustered around cities and surrounding communities of Boston, Lowell, Worcester, and Springfield (Figure 3-4). Gas program participants in 2012 were located primarily in eastern and southeastern Massachusetts (Figure 3-5).
The maps also show several areas of aggregate high energy usage, where multiple healthcare facilities in this sector operate, and where none participated in 2012 efficiency programs.
Figure 3-4. Electric Program Participants According to Electric Consumption

KEMA, Inc. Page 8
Figure 3-5. Gas Program Participants and Gas Consumption
Only about 20.8% of small healthcare facilities surveyed reported that they had undergone major renovations in the last 5-years; however, 42.7% of medium size healthcare facilities reported that they have made major renovations in the last 5-years. Of those that underwent renovations, 31% of the medium size healthcare facilities and 32% of the smaller healthcare facilities state the major drivers to be energy efficiency.
Among the healthcare facilities that did make recent improvements to their facilities, most focused on indoor lighting measures (29%) and air conditioning (27%). Less than 1% claimed to have made changes to the heating system. This result differed from other responses concerning heat pumps. Since heat pumps serve both heating and cooling loads, it appears that respondents may not have the technical understanding of systems and loads served. As has been stated in other Market Profile Reports and the C&I Customer Survey Report, DNV GL will verify and validate the self reported data during the on-site visits.
Sixty five percent of all respondents reported that they were considering additional energy efficiency improvements in the future For customers who responded that they are considering additional improvements, t, lighting, space heating and air conditioning were their primary focus. For those that are considering energy efficiency improvements in the future, Figure 3-6 shows a breakout of the energy the equipment that was being considered. Forty one percent of respondents indicated they had not made energy efficiency improvements within the last two years.

KEMA, Inc. Page 9
Respondents cited that the reason they did not proceed with the implementation of the additional measures included:
Funding constraints such as: o Lack of or no funds available for investments o Inability to obtain funding o Other priorities for capital spending
Lack of technical expertise to implement
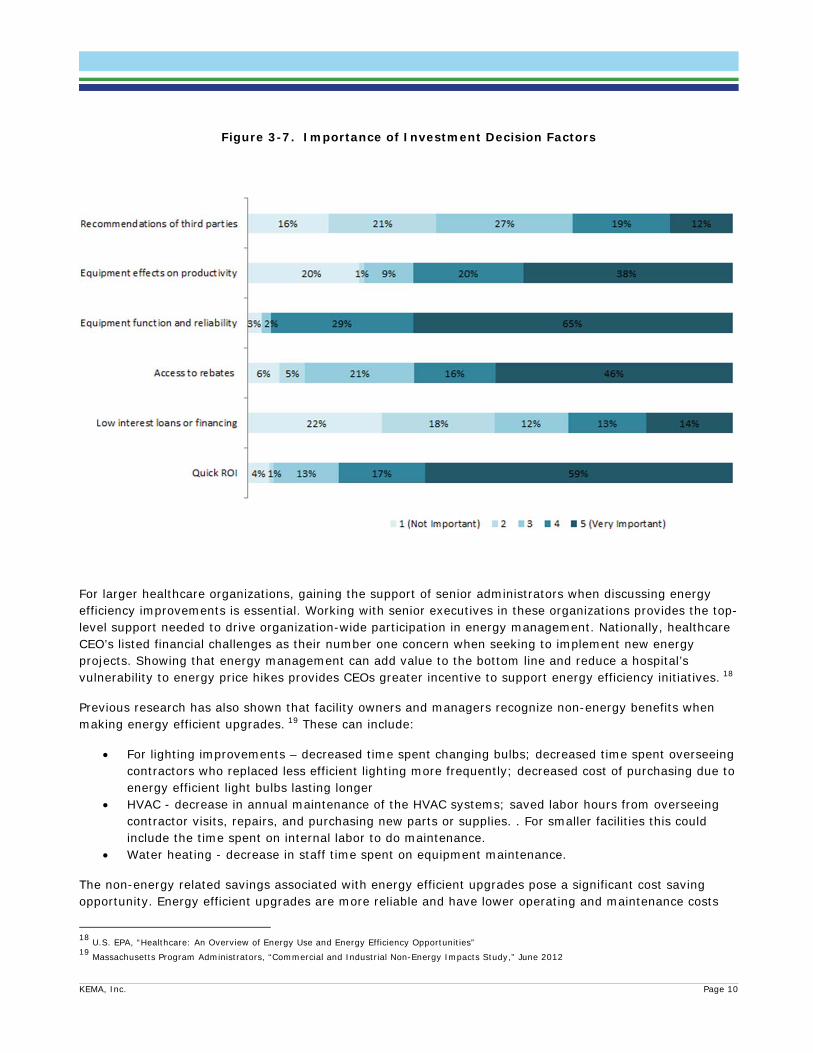
3.2.1 Investment Decision Factors Healthcare facility managers and owners consider a variety of factors when assessing whether or not to undertake an equipment upgrade. According to the MA C&I telephone survey results, equipment reliability was the most important factor when deciding on whether or not to invest in new equipment. Sixty five percent of survey respondents answered that this was ‘very important’ when making these types of decisions. This was followed by the quick return on investments. Figty nine percent rated this factor as ‘very important when making investment decisions.’
Figure 3-6. Equipment Improvements Being Considered
KEMA, Inc. Page 10
Figure 3-7. Importance of Investment Decision Factors
For larger healthcare organizations, gaining the support of senior administrators when discussing energy efficiency improvements is essential. Working with senior executives in these organizations provides the top-level support needed to drive organization-wide participation in energy management. Nationally, healthcare CEO’s listed financial challenges as their number one concern when seeking to implement new energy projects. Showing that energy management can add value to the bottom line and reduce a hospital’s vulnerability to energy price hikes provides CEOs greater incentive to support energy efficiency initiatives. 18
Previous research has also shown that facility owners and managers recognize non-energy benefits when making energy efficient upgrades. 19 These can include:
For lighting improvements – decreased time spent changing bulbs; decreased time spent overseeing contractors who replaced less efficient lighting more frequently; decreased cost of purchasing due to energy efficient light bulbs lasting longer
HVAC - decrease in annual maintenance of the HVAC systems; saved labor hours from overseeing contractor visits, repairs, and purchasing new parts or supplies. . For smaller facilities this could include the time spent on internal labor to do maintenance.
Water heating - decrease in staff time spent on equipment maintenance.
The non-energy related savings associated with energy efficient upgrades pose a significant cost saving opportunity. Energy efficient upgrades are more reliable and have lower operating and maintenance costs
18 U.S. EPA, “Healthcare: An Overview of Energy Use and Energy Efficiency Opportunities” 19 Massachusetts Program Administrators, “Commercial and Industrial Non-Energy Impacts Study,” June 2012

KEMA, Inc. Page 11
that may be overlooked when assessing the return on investment and payback for these opportunities. Since reliability of equipment is critical to healthcare facilities the upgrade with lower risk of failure at a lower cost provides a significant benefit. The promise of savings from parts and labor alone are often difficult to parlay into effective selling points for energy efficient upgrades. Electricity and gas savings are concrete whereas savings derived from avoided labor, longer lasting parts, fewer maintenance calls are harder to quantify and are often driven by customer specific management decisions. Emphasizing non-energy benefits, particularly reliability, with direct energy and cost benefits in promotional and project specific materials may increase the effectiveness of moving health care decisions makers to adopt efficient equipment upgrades.
3.3 Equipment Characteristics
Overall, medium size healthcare customers have a more complex mix of systems than the small healthcare organizations. Medium sized healthcare organizations have similar lighting mixes, but are more likely to have control systems, central plant cooling and packaged air conditioning20, -. This suggests that while opportunities for improvements exist for small and medium healthcare, medium sized healthcare facilities require more comprehensive solutions21.
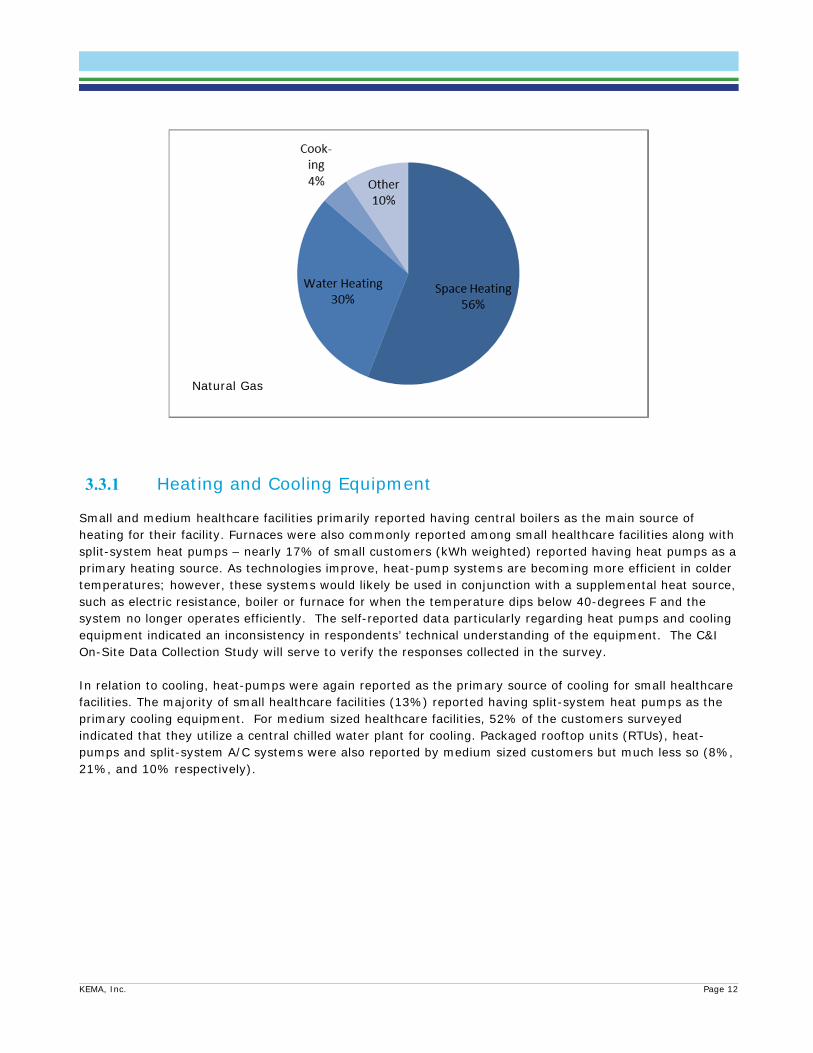
According to U.S. DOE CBECS data, the major end-uses of electricity are for lighting, office or “other” equipment, ventilation and cooling. For natural gas, they are space heating and water heating.
Figure 3-8. Average End-use Profiles Healthcare22
20 Data summarized within this table has been self-reported and may not be representative of the broader industry. 21 Massachusetts Program Administrators, “Commercial and Industrial Mid-size Customer Needs Assessment,” January 2014 22 US Energy Information Administration, Commercial Building Energy Consumption Data 2003
Electricity
KEMA, Inc. Page 12
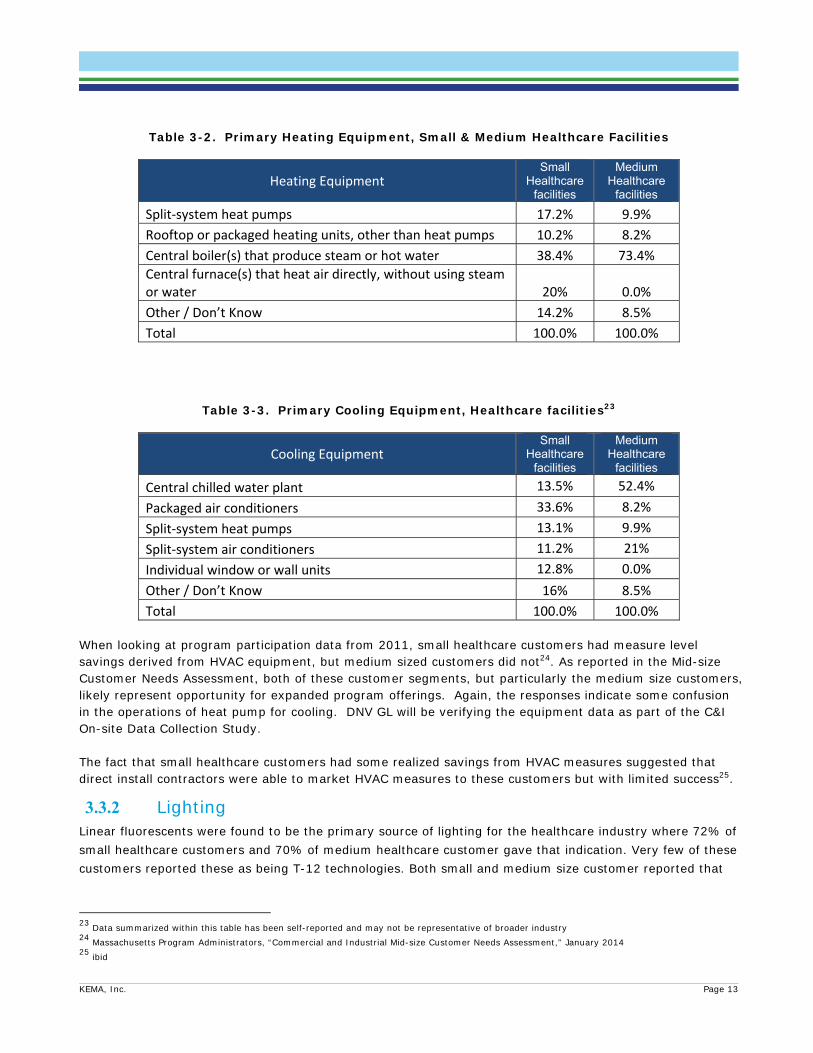
3.3.1 Heating and Cooling Equipment Small and medium healthcare facilities primarily reported having central boilers as the main source of heating for their facility. Furnaces were also commonly reported among small healthcare facilities along with split-system heat pumps – nearly 17% of small customers (kWh weighted) reported having heat pumps as a primary heating source. As technologies improve, heat-pump systems are becoming more efficient in colder temperatures; however, these systems would likely be used in conjunction with a supplemental heat source, such as electric resistance, boiler or furnace for when the temperature dips below 40-degrees F and the system no longer operates efficiently. The self-reported data particularly regarding heat pumps and cooling equipment indicated an inconsistency in respondents’ technical understanding of the equipment. The C&I On-Site Data Collection Study will serve to verify the responses collected in the survey. In relation to cooling, heat-pumps were again reported as the primary source of cooling for small healthcare facilities. The majority of small healthcare facilities (13%) reported having split-system heat pumps as the primary cooling equipment. For medium sized healthcare facilities, 52% of the customers surveyed indicated that they utilize a central chilled water plant for cooling. Packaged rooftop units (RTUs), heat-pumps and split-system A/C systems were also reported by medium sized customers but much less so (8%, 21%, and 10% respectively).
Natural Gas
KEMA, Inc. Page 13
Table 3-2. Primary Heating Equipment, Small & Medium Healthcare Facilities
Heating Equipment Small
Healthcare facilities
Medium Healthcare
facilities
Split‐system heat pumps 17.2% 9.9%
Rooftop or packaged heating units, other than heat pumps 10.2% 8.2%
Central boiler(s) that produce steam or hot water 38.4% 73.4%
Central furnace(s) that heat air directly, without using steam or water 20% 0.0%
Other / Don’t Know 14.2% 8.5%
Total 100.0% 100.0%
Table 3-3. Primary Cooling Equipment, Healthcare facilities23
Cooling Equipment Small
Healthcare facilities
Medium Healthcare
facilities
Central chilled water plant 13.5% 52.4%
Packaged air conditioners 33.6% 8.2%
Split‐system heat pumps 13.1% 9.9%
Split‐system air conditioners 11.2% 21%
Individual window or wall units 12.8% 0.0%
Other / Don’t Know 16% 8.5%
Total 100.0% 100.0% When looking at program participation data from 2011, small healthcare customers had measure level savings derived from HVAC equipment, but medium sized customers did not24. As reported in the Mid-size Customer Needs Assessment, both of these customer segments, but particularly the medium size customers, likely represent opportunity for expanded program offerings. Again, the responses indicate some confusion in the operations of heat pump for cooling. DNV GL will be verifying the equipment data as part of the C&I On-site Data Collection Study. The fact that small healthcare customers had some realized savings from HVAC measures suggested that direct install contractors were able to market HVAC measures to these customers but with limited success25.
3.3.2 Lighting Linear fluorescents were found to be the primary source of lighting for the healthcare industry where 72% of small healthcare customers and 70% of medium healthcare customer gave that indication. Very few of these customers reported these as being T-12 technologies. Both small and medium size customer reported that
23 Data summarized within this table has been self-reported and may not be representative of broader industry 24 Massachusetts Program Administrators, “Commercial and Industrial Mid-size Customer Needs Assessment,” January 2014 25 ibid

KEMA, Inc. Page 14
T-8’s were the predominant lighting type in their facilities (54% and 66% respectively); 15% of the small and medium sized customers were unable to specify the type of fluorescent tubes that were installed.
Figure 3-9. Type of Linear Fluorescent Lights Installed
Based on kWh estimates, approximately 53% of small healthcare facilities claimed to have some type of LED lighting technology in their facility while over 62% of medium size customer reported having LEDs in their facilities. Of those customers who do have LED lights installed, 72% of the customers use them as spot lights, 70% used them to replace screw-in light bulbs, and 55% reported installing them to replace linear fluorescents.
The higher rate of reported penetration of LEDs in the medium healthcare customer may be related to:
1. Customer familiarity with the technology - 40% of small customers claim to be somewhat familiar with LEDs while almost 82% of medium sized customers claim to be at least somewhat familiar with LEDs. These estimates are business level estimates.
2. Presence of a facilities manager on-site – Over 70% of the respondents from medium size healthcare facilities were either a facilities manager or operations manager while only 20% of small customers claimed to be either a facilities, operations or energy manager. These are business level estimates.

KEMA, Inc. Page 15
Over 50% of the small customers (based on business level estimates) who responded to the survey were an owner, CEO or manager. Marketing LED technologies to these customers, who are generally less technical in nature, may present an opportunity for capturing additional savings. What is important to these customers when making these types of investments is:
Quick payback on investment Equipment reliability
3.3.3 Energy Management Systems, Controls and Sensors In relation to energy management systems and controls, the use of a building energy management system (EMS) was not common among smaller customers. Based on kWh weighted responses, 77% of small customers did not have EMS type control in their facilities. At the medium size customer facilities, EMS controls were more common with approximately 62% of customers had EMS. These were primarily direct digital control (DDC) systems and used to control heating, cooling and ventilation systems. About 20% of customers used their EMS to control lighting as well. EMS related information will be verified and validated as part of the C&I On-site Data Collection Study.
Small and medium sized healthcare customers often do employ occupancy sensors at some level in their facilities – 61% and 42% respectively. Most often sensors were located in offices, lavatories, conference rooms, and kitchens. Daylight sensors were found less frequently in the facilities. Only 38% of small healthcare customers reported having daylight sensors in their facilities.

KEMA, Inc. Page 16
4. KEY FINDINGS The main electricity uses in the small and medium healthcare facilities are lighting, cooling, ventilation and energy used by office-type equipment. Small and medium healthcare facilities mainly use natural gas for heating and hot water production. Among the MA C&I customer telephone survey respondents, the most common measure completed since 2011 was lighting upgrades. This is also the most common measure under consideration, although customers also reported that heating and air conditioning improvements were being considered. For medium size facilities, ventilation was also an area of consideration for improvements.
The aging U.S. population will boost growth for many healthcare facilities and assisted living in particular, the fastest growing long-term care option for seniors.26 According to IBISWorld research, baby boomers expectations will shape these facilities into more “home-like” designs with improved amenities and better lighting.27 Advanced lighting technology, such as LEDs, photosensors and occupancy sensors, can mitigate facility residents’ safety concerns and decrease falls, a major concern among elderly patients.28
PAs may consider the following to increase savings from energy efficiency programs in the small to medium-sized healthcare customers: These will provide both energy related savings as well as non-energy related benefits through lower maintenance costs which will provide a quicker return on investment when accounting for only electricity and gas related savings. Additional benefits will include a higher equipment reliability which would lead to better services in the form of comfort and productivity of the building occupants.
Advanced Lighting for Assisted Living Facilities. Residential assisted living is the fastest growing long-term care option for seniors as an alternative to nursing home care. Massachusetts had 163 assisted living facilities with an average facility size of 70 residential units in 2007. This figure is expected to increase substantially as the over 65 population will double from 2010 to 2025.29
Link energy cost savings to revenue generation. According to the U.S. Environmental Protection Agency (EPA) each dollar saved by a non-profit healthcare organization through better energy performance is equivalent to generating up to $20 in new revenues for hospitals (with a 5 percent profit margin) or $10 for medical offices (with a 10 percent profit margin).”30
Targeted outreach to - customers on HVAC improvements.
Medium Size customers: When looking at program participation data from 2011, we see that small healthcare customers had measure level savings derived from HVAC equipment, but medium sized
26 Gerace, Alyssa. “Retirement Community Industry Revenues to Hit $70 Billion by 2018,” Senior Housing News, April 16, 2013. Accessed April 21,
2014 at: http://seniorhousingnews.com/2013/04/16/retirement-community-industry-revenues-to-hit-70-billion-by-2018 27 ibid 28Reitter Elia, Carol, “LED Lighting in Senior Living: Friend or Foe?” Long-Term Living. February 26, 2013. http://www.ltlmagazine.com/article/led-
lighting-senior-living-friend-or-foe-1 29 http://content.healthaffairs.org/content/29/1/35/T1.expansion.html 30 ENERGY STAR, Energy Solutions for Healthcare, http://www.energystar.gov/ia/partners/spp_res/Custom_Healthcare.pdf

KEMA, Inc. Page 17
customers did not. As reported in the Mid-size Customer Needs Assessment31, both of these areas, but particularly the medium size customers, represent opportunities for expanded program offerings.
All customers: Nearly 17% of small customers reported having heat pumps as a primary heating source. Heat-pumps were also reported as the primary source of cooling for small healthcare facilities. Heat-pumps, particularly those with electric-only backup, may provide opportunity for additional savings. . For those that have hydronic systems, opportunities to optimize the performance of the system may exist as opposed to replacing the units
Targeted outreach of occupancy sensors to medium sized customers. Small and medium sized healthcare customers are found to employ occupancy sensors within their facilities at 61% and 42% of customers respectively. This leaves a significant opportunity for medium sized healthcare facilities to incorporate a higher number of occupancy sensors within their facilities.
Promote new lighting technologies to Executive and Senior Level Administration. A relatively few number of small healthcare facilities had LED’s and over 50% of the small customers (based on business level estimates) who responded to the survey were owners, CEOs, company managers, or store managers. The PAs may consider broadening their marketing efforts of LEDs and focus on specific potential LED applications commonly found in healthcare facilities such as down lighting in waiting areas. Additionally, depending on the specific applications, a more holistic look at lighting systems including advanced lighting controls for higher management should be considered in situations where LEDs are not applicable.
31 Massachusetts Program Administrators, “Mid-sized Customer Needs Assessment,” December, 2013
KEMA, Inc. Page 18
ABOUT DNV GL Driven by our purpose of safeguarding life, property and the environment, DNV GL enables organizations to advance the safety and sustainability of their business. We provide classification and technical assurance along with software and independent expert advisory services to the maritime, oil and gas, and energy industries. We also provide certification services to customers across a wide range of industries. Operating in more than 100 countries, our 16,000 professionals are dedicated to helping our customers make the world safer, smarter and greener.