Slug Test Results · SLUG TEST ANALYSIS Rising Head Test #1 Monitor Well LD-1 Well Specifications...
188
APPENDIX G Slug Test Results AR303323
Transcript of Slug Test Results · SLUG TEST ANALYSIS Rising Head Test #1 Monitor Well LD-1 Well Specifications...

APPENDIX G
Slug Test Results
AR303323
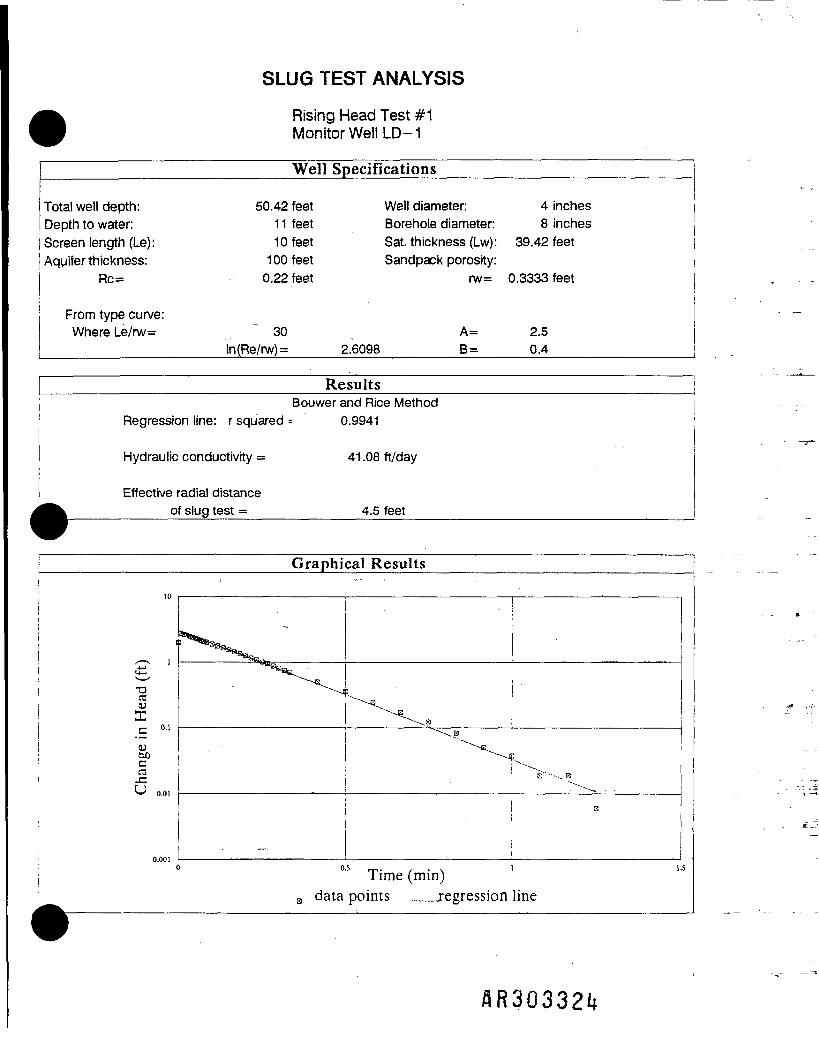
SLUG TEST ANALYSIS
Rising Head Test #1Monitor Well LD-1
Well Specifications
Total well depth:Depth to water:Screen length (Le):Aquifer thickness:
Rc=
From type curve:Where Le/rw=
50.4211101000.22
30ln(Re/rw) =
feet Well diameter: 4 inchesfeet Borehole diameter: 8 inchesfeet Sat. thickness (Lw): 39.42 feetfeet Sandpack porosity:feet rw= 0.3333 feet
L
A= 2.52.6098 B= 0.4
Results
Regression line: r squared
Hydraulic conductivity =
Bouwer and Rice Method0.9941
41 .08 ft/day
Effective radial distancek ofslug test = 4.5 feet
Graphical Results
10
I
^^ 1
•a03
X
toa{-) o.oi
0.001
^
i . • > . • •
^ ^°iB ,
^ 1
r-.
0
B data
' ."B\«
"
'
^Time (min)
points regression
'
t
E
1.5
line

T3 0CO >0) >
crc c . i i i i
]i
• •• • •<
cs
(133d) QV3H NI 3ONVHD
AR303325
oo
C/tusi i- i I • ' ^* T i i•*-• -L • «
Q i ' Svo v—'ttis.
OQcoeu
tu

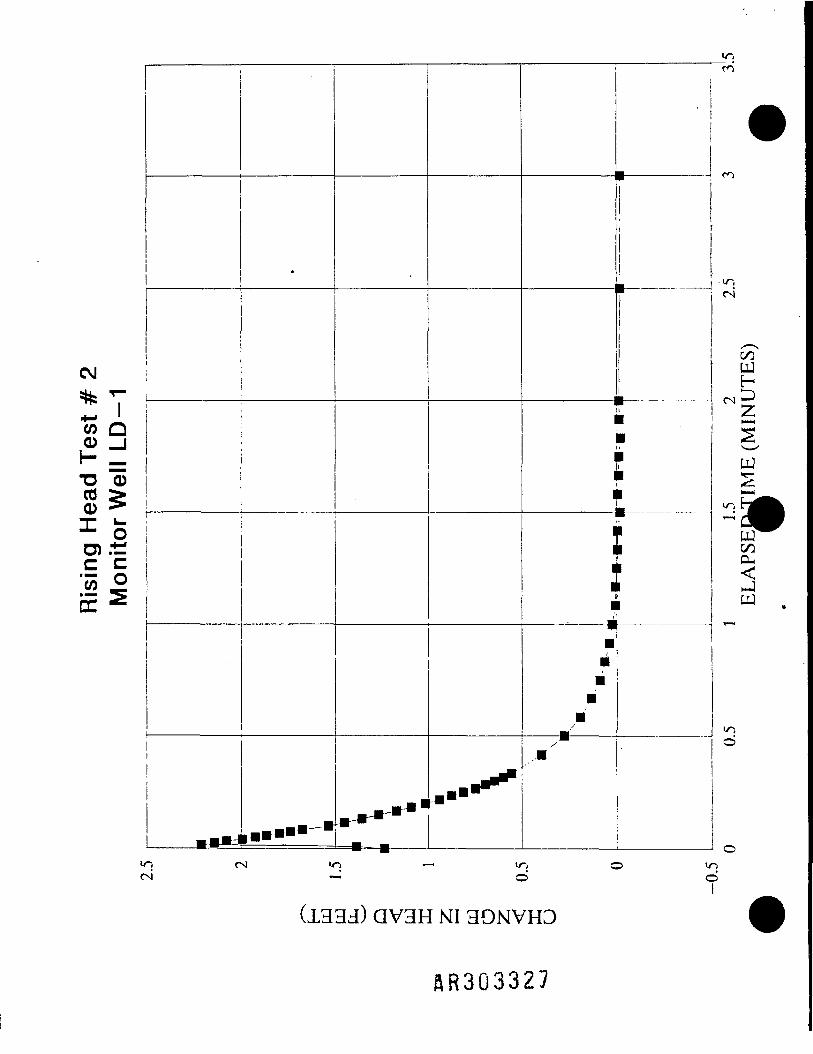
SLUG TEST ANALYSISRising Head Test #2Monitor Well LD-1
Total well depth:Depth to water:Screen length (Le):Aquifer thickness:
Rc=
From type curve:Where Le/rw=
Well
50.42 feet11 feet10 feet100 feet0.22 feet
30ln(Re/rw) =
Specifications
Well diameter:Borehole diameter:Sat. thickness (Lw):Sandpack porosity:
rw=
A=2.6098 B=
4 inches8 inches
39.42 feet
0.3333 feet
2.50.4
ResultsBouwer and Rice Method
Regression line: r squared = 0.9991
Hydraulic conductivity = 40.54 ft/day
Effective radial distance^ of slug test = __ 4.5 feet
Graphical Results
T303<UX
QOCra5 0.0,
0.0010.2 0.4 —,0.6 , . . 0.8 1Time (mm)
B data points _ regression line
CM
05 Q
r- i!•O 0CC >0
C C'05 °E s
•O O4 V~) ^ ly o 1O<N i-J O C3
I
(1333) QV3H MI 3OMVHD
AR3Q3327
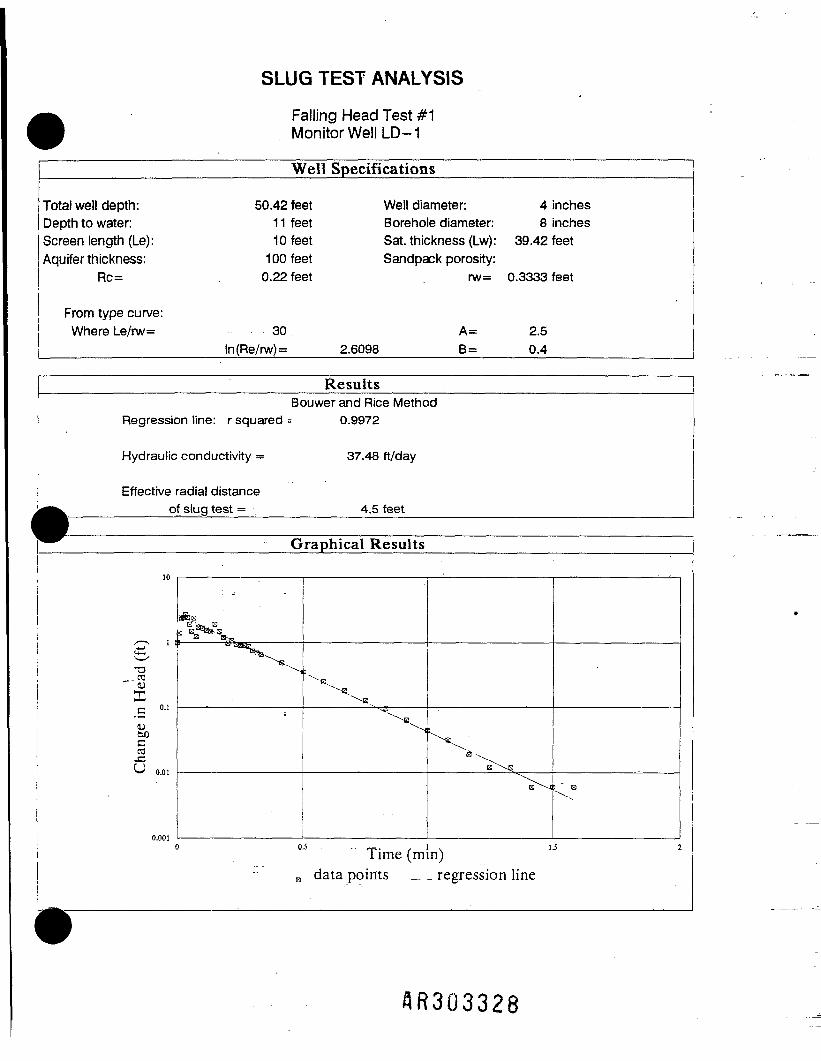
SLUG TEST ANALYSIS
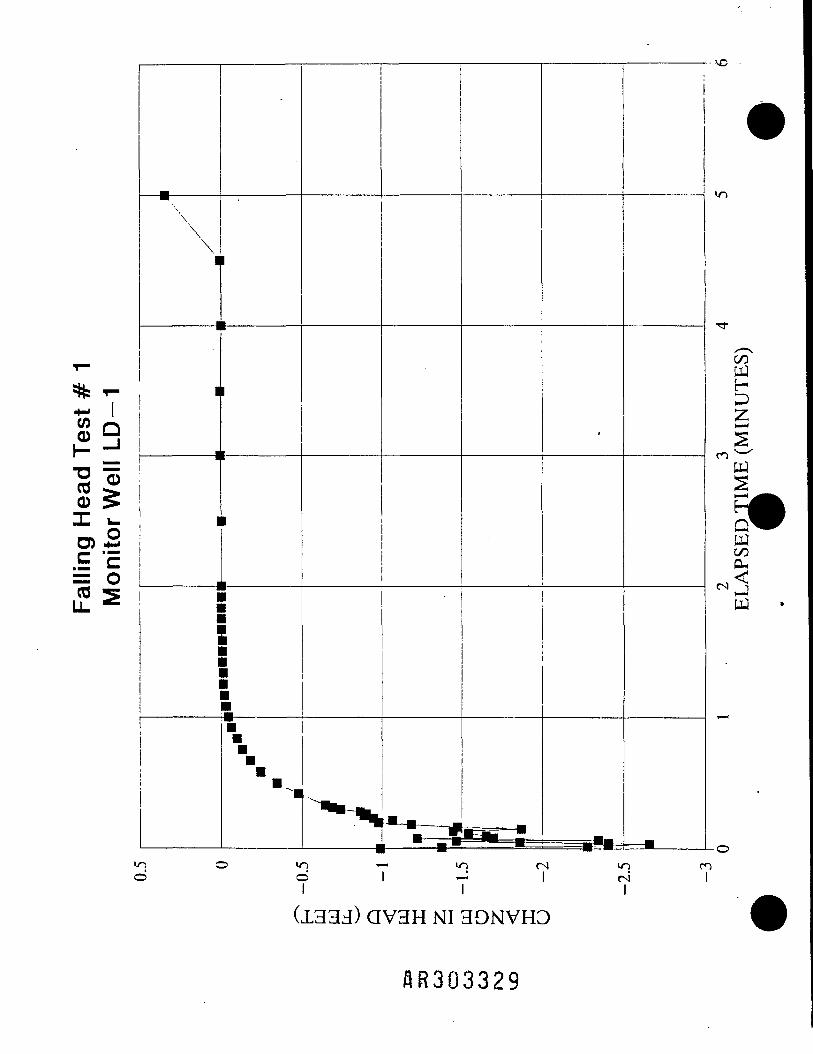
Falling Head Test #1Monitor Well LD-1
Total well depth:Depth to water:Screen length (Le):Aquifer thickness:
Rc=
From type curve:Where Le/rw=
Well
50.42 feet11 feet10 feet100 feet0.22 feet
30!n(Re/rw) =
Specifications
Well diameter:Borehole diameter:Sat. thickness (Lw):Sandpack porosity:
rw=
A=2.6098 B =
i
4 inches8 inches
39.42 feet
0.3333 feet
2.50.4
Results
Regression line: r squared
Hydraulic conductivity =
Effective radial distance^ of slug test =
Bouwer and Rice Method0.9972
37.48 ft/day
4.5 feet
" ^ Graphical Results
10
cr ' '-a,03<UXc ®'^
c03
U 0.0,'
0.001 c
1 — ————————————————
-
,
.
-<=.
^
0.5 .'.- „.Time (mB data ooints
"gr^
^ B
x 1.5 2n)regression line
AR303328
-"fli T—
"05£3"O ~CO -0 >zn k.CO 4-*
.E c= oCO LL
L/
C
— m- ———
\\i
————— i
i
————— i
i
~! CD
-
1
1 —————————
1
| —————————
1
\
5 •/C
1 ————————— I~> -31
1 ——— ••"- i/
-
•-ffc * __
•) r—4
'
•»s) U1 r
1 0s)
<
/—rjjHDZ,2
1H|Q00OH
-0T
(1333) QV3H NI 3OMVHD
flR303329

SLUG TEST ANALYSIS
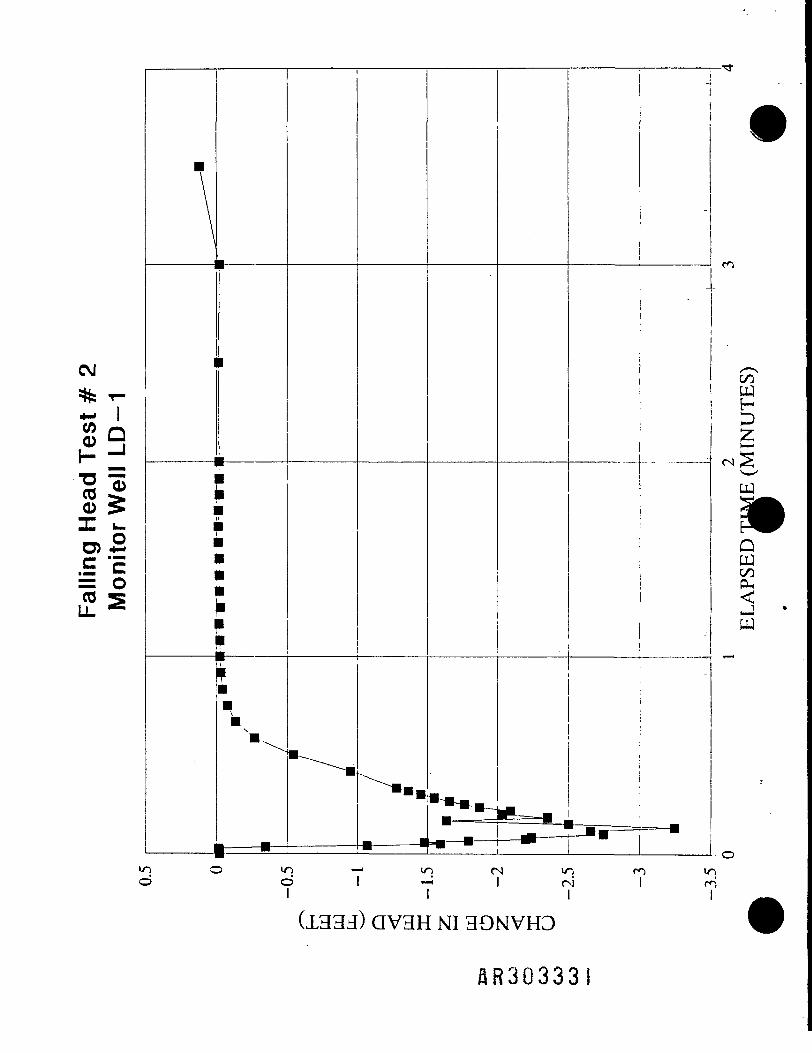
Falling Head Test #2Monitor Well LD-1
Well Specifications
Total well depth:Depth to water:Screen length (Le):Aquifer thickness:
Rc=
From type curve:Where Le/rw=
50.4211101000.22
30ln(Re/rw)=
feet Well diameter:feet Borehole diameter:feet Sat. thickness (Lw):feet Sandpack porosity:feet rw=
A=2.6098 B =
4 inches8 inches
39.42 feet
0.3333 feet
2.50.4
Results
Regression line: r squared
Hydraulic conductivity =
Effective radial distance^^ of slug test =
Bouwer and Rice Method0.9832
52.71 ft/day
4.5 feet
Graphical Results
10
t?•a '03DXc<uGO03 0.1
6,
0.01c
«•• v%s . ' •B
ffi
&
rs_>B
^\ ^ E
^ "S.•x.\
B^\
B^--,
B "\. ""fe-^
\l
0.2 0.4 . ,_. , 0.6. . 0.8 1 1.2Time (mm)B data points _ regression line
VAJSi*ffl T~
W Q|2 —iIMM
«i0 >i i-o2.E c= 0CO LL •*
uC
\——————— 1
1
———————
——————— 1- c3
, ———
1
\•\
5 >/c
•-J3
^ "»»
^ —————— •
-> V-
•*•-•-•
1 r•4
^ wr
•IMT
1 r^
-
-
=•=— •
0 ur
— vj
1
oo"UJHDfe— •
csSV N ^_|
aSQCO<jW
o-,01
(1333) QV3H MI 3ONVH3
SR30333I

SLUG TEST ANALYSIS
Rising Head Test #1Monitor Well LS-8
Well Specifications
Total well depth:Depth to water:Screen length (Le):Aquifer thickness:
Rc=
From type curve:Where Le/rw=
59.86 feet8.88 feet10 feet100 feet0.1 4 feet
40ln(Re/rw)=
Well diameter:Borehole diameter:Sat. thickness (Lw):Sandpack porosity:
rw=
A=2.9964 B =
2 inches6 inches
50.98 feet
0.2500 feet
2.70.45
ResultsBouwer and Rice Method
Regression line: r squared = 0.8923
Hydraulic conductivity = 241.05 ft/day
Effective radial distanceof slug test =__________5.0 feetw
Graphical Results:
10
I
+—><4—
T303<UX
.E "-1uMna5 0.0,
0.00 1
\ - -H, "
\ •'• 'B
<\\'\ B\ B E
A i\
' \\
- .
-
>E3E B i :
0.2 OA „. . 0.6. . 0 . 8 1 1Time (mm)B data points _ _ regression line
t
SR303332

=& °o+- I% toO -J
•o "0CO0
c c't/3£w £
(1333) QV3H NI 3ONVHD
ftR303333
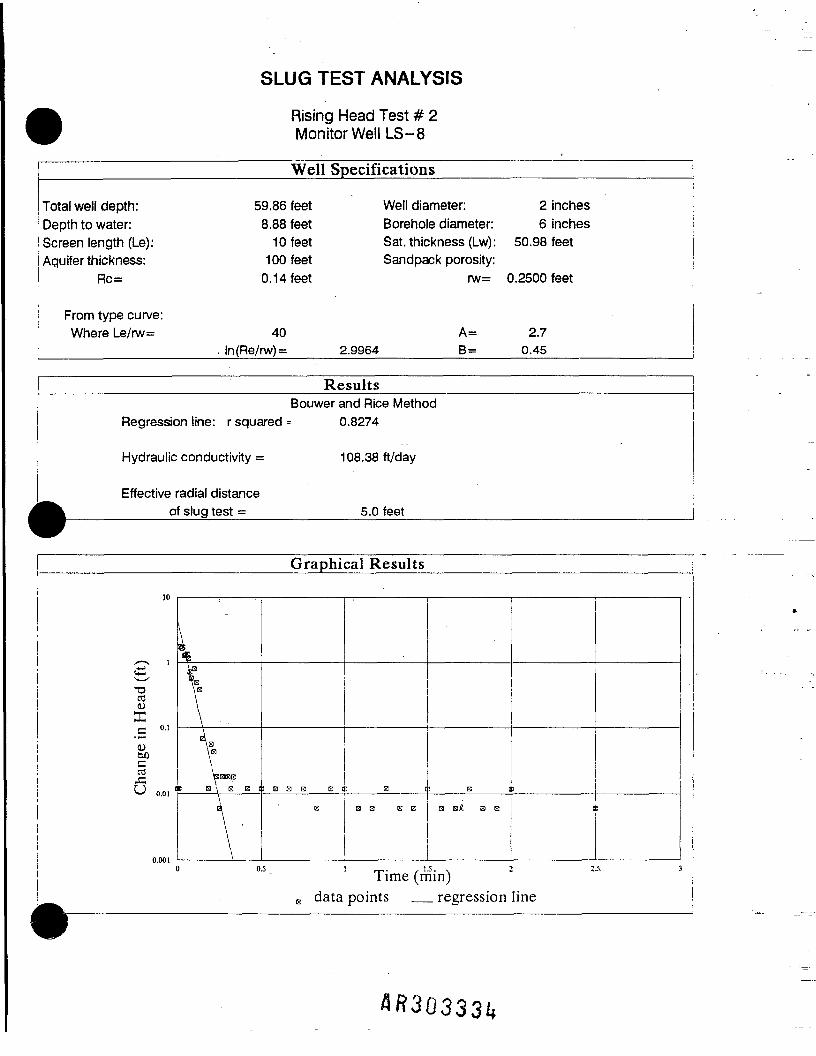
SLUG TEST ANALYSIS
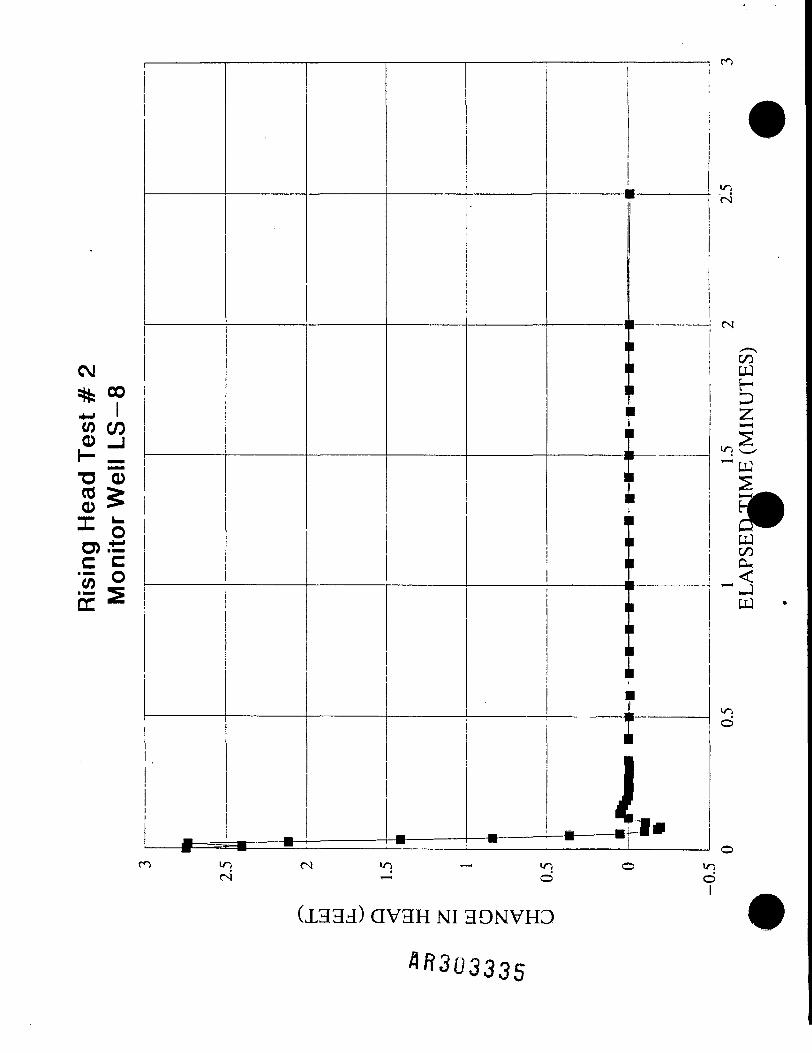
Rising Head Test # 2Monitor Well LS-8
Total well depth:Depth to water:Screen length (Le):Aquifer thickness:
Rc=
From type curve:Where Le/rw=
Well
59.86 feet8.88 feet10 feet
100 feet0.1 4 feet
40: ln(Re/rw) =
Specifications
Well diameter:Borehole diameter:Sat. thickness (Lw):Sandpack porosity:
rw=
A=2.9964 B =
12 inches6 inches
50.98 feet
0.2500 feet
2.70.45
Results '
Regression line: r squared
Hydraulic conductivity =
Effective radial distancefl^ of slug test =
Bouwer and Rice Method0.8274
108.38 ft/day
5.0 feet
Graphical Results
10
•o03OJX.E °''0)
c03J5U 0.0, '
0.001(
\a*
\B\ E3
\ .\B
\teHEE
D S \ B E !
\; B E E E ;
'
) OJ
B data
: E t
S B B B•
: B t
E E*'. B B
r^. f 1.5. N. :Time (mm)points regression
1
I E
2.5-
line
•; CO
in CN in T-i inr4 ^ o
(1333) QV3H NI 3ONVHD
CN
————.———.- i (VJ
c/TCM UJ
HDZ(/) C/D
h- dT3 0S5o| gC C || Q*

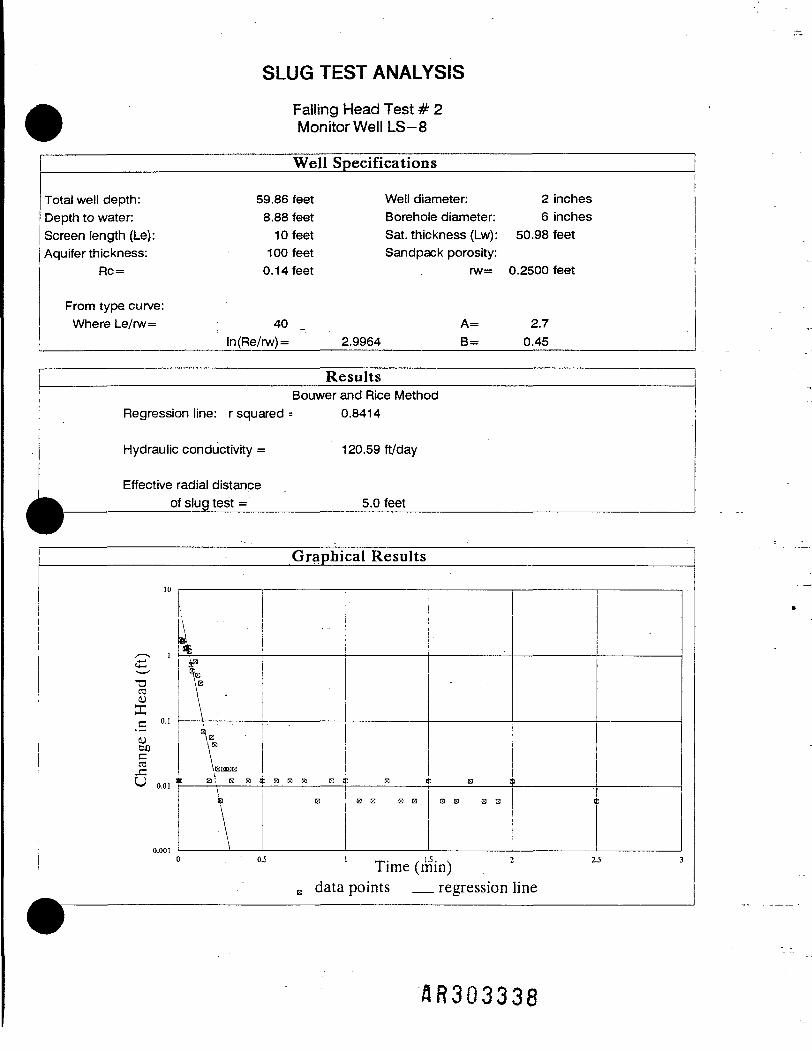
SLUG TEST ANALYSIS
Falling Head Test # 1Monitor Well LS-8
Total well depth:Depth to water:Screen length (Le):Aquifer thickness:
Rc=
From type curve:Where Le/rw=
59.868.88101000.14
40ln(Re/rw) =
Well Specifications
feet Well diameter: 2 inchesfeet Borehole diameter: 6 inchesfeet Sat. thickness (Lw): 50.98 feetfeet Sandpack porosity:feet rw= 0.2500 feet
A= 2.72.9964 B= 0.45
Results
Regression line: r squared1
Hydraulic conductivity =
Effective radial distance^ of slug test =
Bouwer and Rice Method0.9179
120.90 ft/day
5.0 feet
Graphical Results
10
s~*** \<£\ / 1
•a03<uXC O'1
<uBOC03
U 0.0,
0.001(
•
[<$i '3 I
\
TE
\ B\3Enc E\\ i\\
E :
E a BEE
9 E B
BS B !
E E E S E (
!
; t]
'i
) 0.5 1 _1.5 . . 2 2.5 3 3,5Time (mm)B data points _ regression line
303336

in
4— 'W C7D0 -JI- =T3 0CO g0 *= oen
COLL
*
(1333) QV3H NI 3ONVHD
AR303337
inCN
00UJH2i—istQ
oo(X
ino
in o >n - in (N ino o I —3 I (N
SLUG TEST ANALYSIS
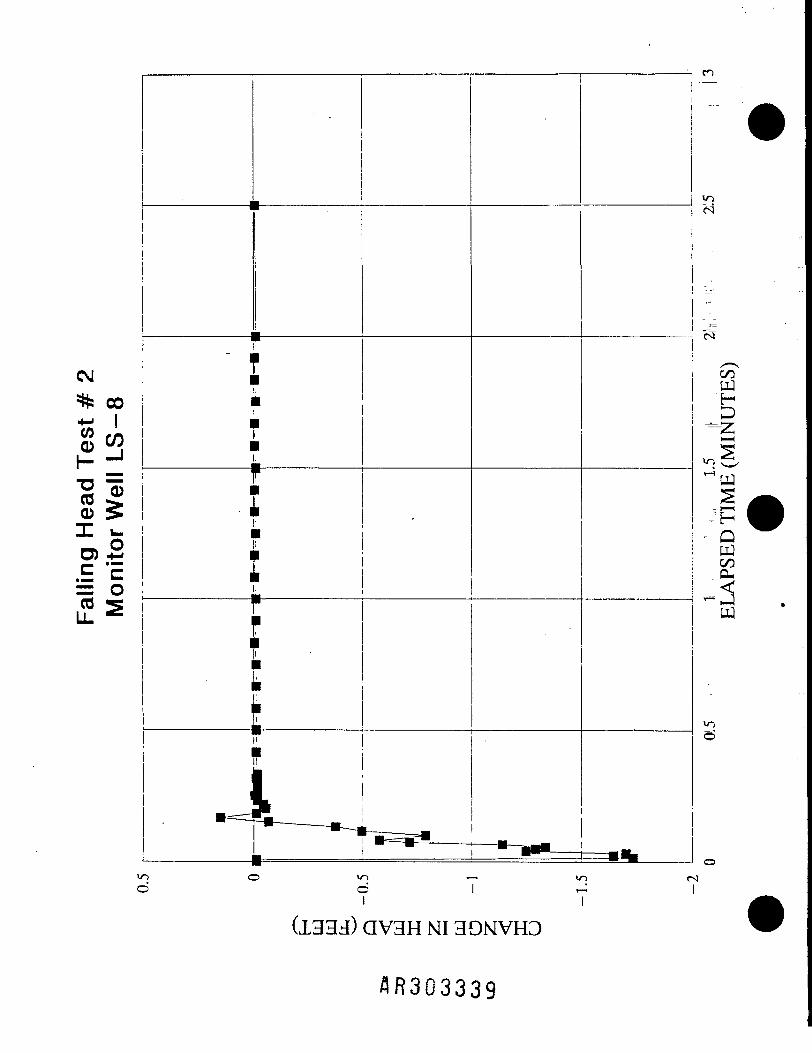
Falling Head Test # 2Monitor Well LS-8
Total well depth:Depth to water:Screen length (Le):Aquifer thickness:
Rc=
From type curve:Where Le/rw=
Well
59.86 feet8.88 feet10 feet
100 feet0.1 4 feet
40ln(Re/rw) =
Specifications
Well diameter:Borehole diameter:Sat. thickness (Lw):Sandpack porosity:
rw=
A=2.9964 B =
2 inches6 inches
50.98 feet
0.2500 feet
2.70.45
Results
Regression line: r squared
Hydraulic conductivity =
Effective radial distance| of slug test =
Bouwer and Rice Method0.8414
120.59 ft/day
5.0 feet
Graphical Results
10
T3CO
Xc "•'(Uc03
U „.„,'
0.001
i
V-\BB\EHBE
E B ' B H 1
,\\
: B B B B {
E
i B 1
B E B E
: " E i
E E HE
3
[
) . " <U 1 _. , 1JS. . 2 2JTime (mm)E data
^pointsi regression line
SR303338
(1333) QV3H NI 3ONVH3
0R303339

SLUG TEST ANALYSIS
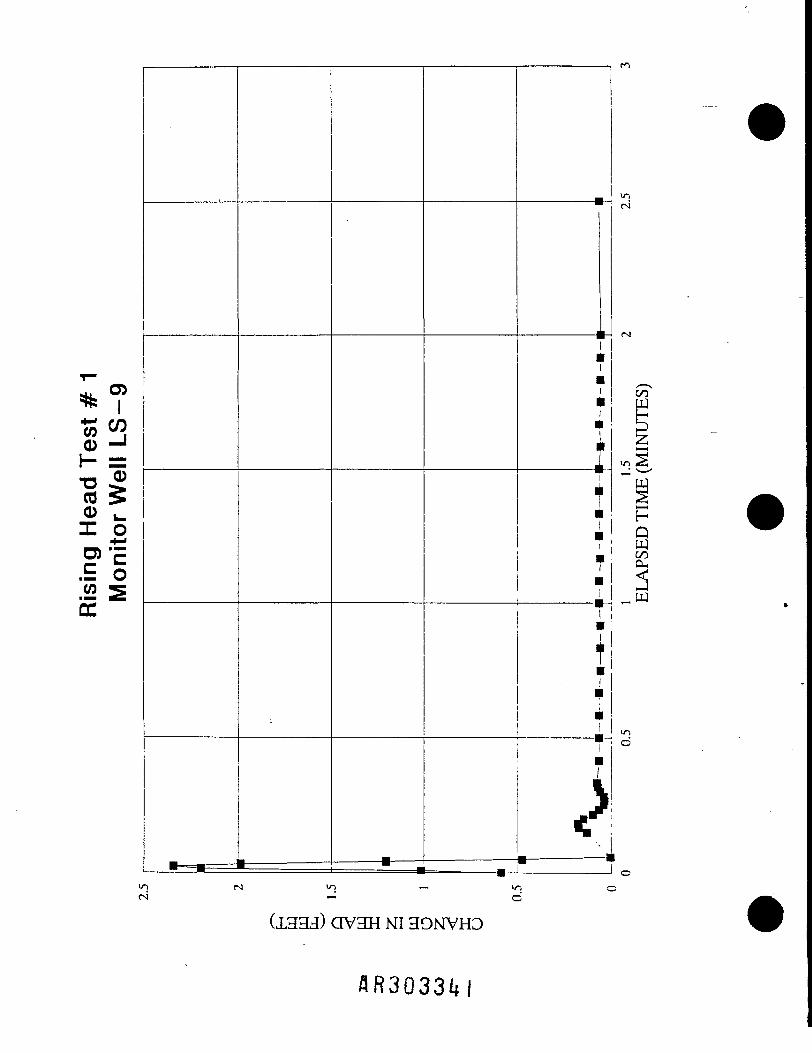
Rising Head Test #1Monitor Well LS-9
Well Specifications
Total well depth:Depth to water:Screen length (Le):Aquifer thickness:
Rc=
From type curve:Where Le/rw=
83.02 feet10.83 feet
10 feet100 feet0.1 3 feet
40ln(Re/rw)=
Well diameter:Borehole diameter:Sat. thickness (Lw):Sandpack porosity:
rw=
A=3.1780 B=
2 inches6 inches
72. 19 feet
0.2500 feet
2.70.45
ResultsBouwer and Rice Method
Ronroccinn lino- rcnnarori - (~l QRRA
Hydraulic conductivity = 195.12 ft/day
Effective radial distance____of slug test =__________6.0 feet
Graphical Results
10
s-~ 1sT3034JX
.B "•'uM
1 'U 0.0,
0.001(
-
^ . _ .
\B
B
\
\
\N
EE B
\
\
Q
—————————
> 0,1 , « . . . . 0.3 0.4 OJ: Time (mm)H data points __ regression line
«eg0 -1h" zz-n ^*$
.E o
_ COI
OLHHJ) OVHH NI HONVHO
MINUTE
t. hQW£
,Ji
SLUG TEST ANALYSIS
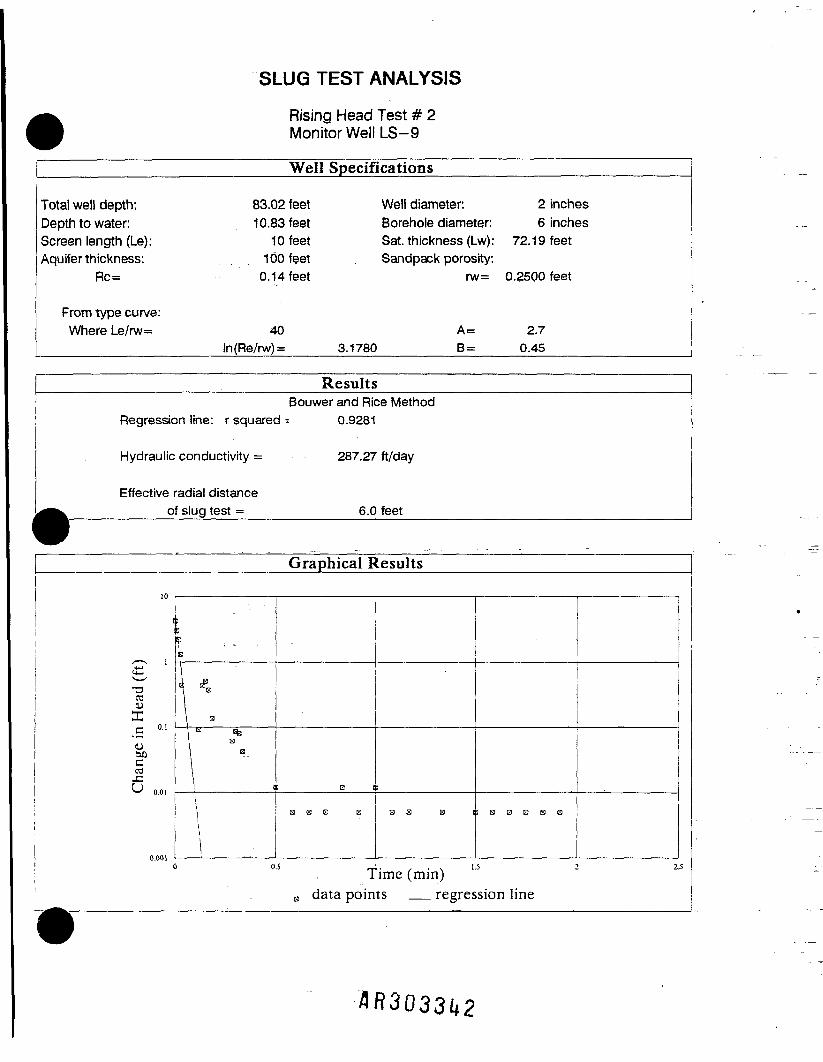
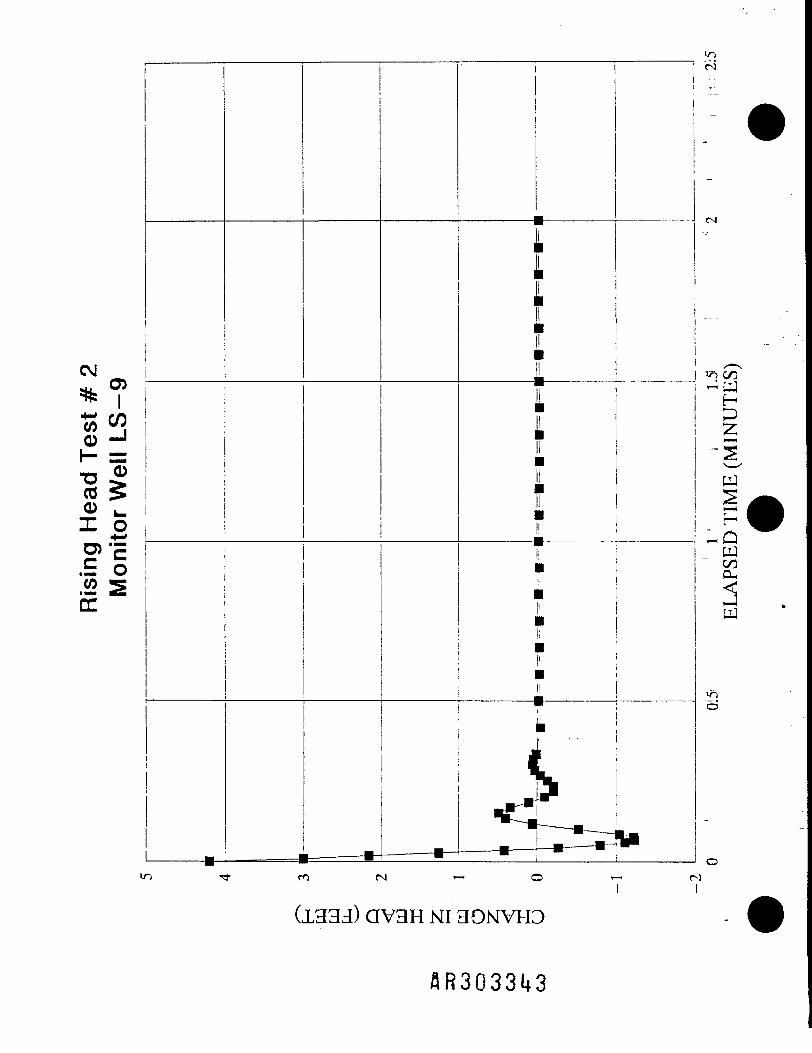
Rising Head Test # 2Monitor Well LS-9
Total well depth:Depth to water:Screen length (Le):Aquifer thickness:
Rc=
From type curve:Where Le/rw=
Well
83.02 feet10.83 feet
10 feet100 feet0.14 feet
40ln(Re/rw) =
Specifications
Well diameter:Borehole diameter:Sat. thickness (Lw):Sandpack porosity:
rw=
A=3.1780 B =
2 inches6 inches
72. 19 feet
0.2500 feet
2.70.45
Results
Regression line: r squared
Hydraulic conductivity =
Effective radial distance^^^ of slug test =
Bouwer and Rice Method0.9281
287.27 ft/day
6.0 feet
Graphical Results
10
c
•aCO
X
VbOCO.C^ 0.01
0.001
ie
1-E
P E%1 • ,i1i
: E I
B B E B
,
BE 13 I
.
B B E E B
) - 0 . 5 „ ! . . . . 1.5 2 2.5Time (mm)B data points _ regression line
CM
0
"O0 __X O
.E 5to 2£
(1333) QV3H MI 3ONVHD

o>
0 w<H -J•o —,CO0I wD) S.E c= oCO LL
I
(1333) QV3H NI 3ONVH3
RR3Q33U14

SLUG TEST ANALYSIS
' Falling Head Test # 2Monitor Well LS-9
Well Specifications j
Total well depth:Depth to water:Screen length (Le):Aquifer thickness:
Rc=
From type curve:Where Le/rw=
83.0210.83
101000.14
40ln(Re/rw) =
feet Well diameter: 2 inchesfeet Borehole diameter: 6 inchesfeet Sat. thickness (Lw): 72. 19 feetfeet Sandpack porosity: ifeet rw= 0.2500 feet
A= 2.73.1780 B= 0.45
Results
Regression line: r squared
Hydraulic conductivity =
Bouwer and Rice Method0.7062
793.91 ft/day
Effective radial distanceof slug test = 6.0 feet _,
Graphical Results j
10
s•oCOUXn 0.1"~DtocCO
5 0.0,
0.001
11
1,E
"\1
5
)
Aa f ta if
i
i
" E B B & B '
0.5
B data
c E B E s B (3 El B E E E !
T-- / 1J' NTime (mm)points regression
, Ic
iS
line
J

in o ino - d I ~
I I
(1333) QV3H NI 3ONVH3
flR3033l*6

SLUG TEST ANALYSIS
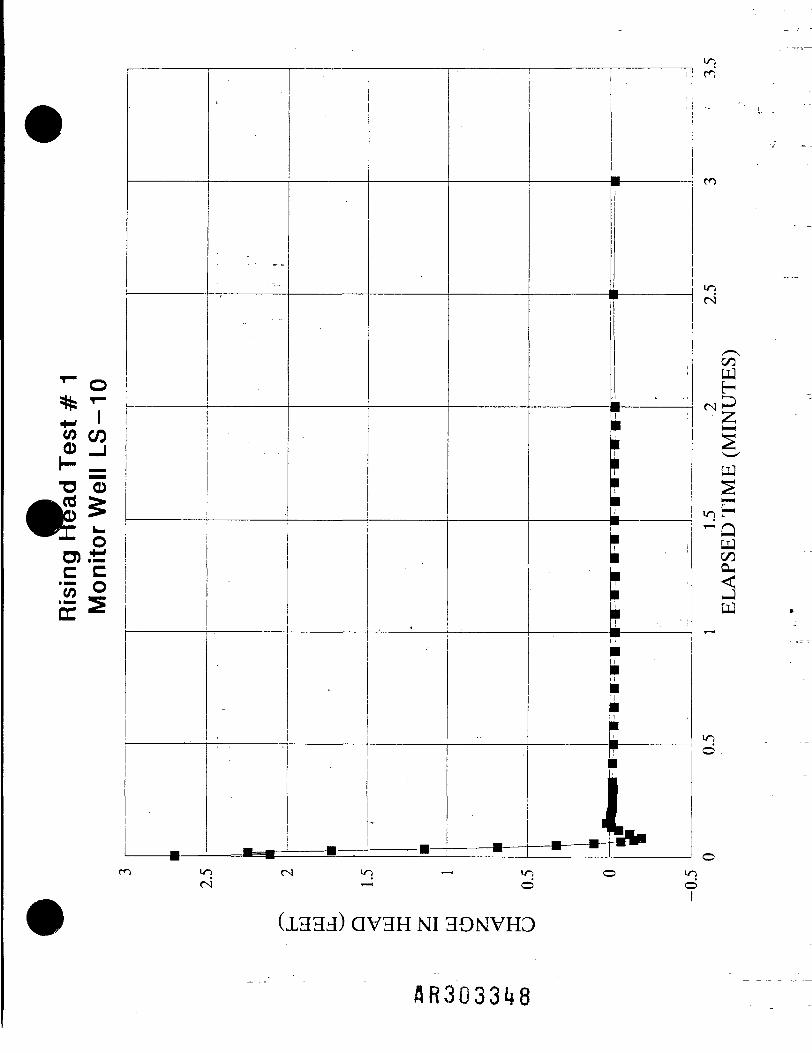
Rising Head Test # 1Monitor Well LS-10
ResultsBouwer and Rice Method
Regression line: r squared = 0.9697
Hydraulic conductivity = 231.97 ft/day
Effective radial distance____of slug test =__________5.0 feet
Total well depth:Depth to water:Screen length (Le):Aquifer thickness:
Rc=
From type curve:Where Le/rw=
Well
59.79 feet8.52 feet10 feet100 feet0.1 4 feet
40ln(Re/rw) =
Specifications
Well diameter:Borehole diameter:Sat. thickness (Lw):Sandpack porosity:
rw=
A=2.9989 B=
2 inches6 inches
51 .27 feet
0.2500 feet
2.70.45
Graphical Results
10 ——
1
-oCO
X
OJto! C
CO
^ 0.01
%ii11
'
E
CEH 1
———— B ———— 1
1 S C
11
: E 3
1
,
i
0.5 1 1.5 . 2 2.5 3 3.5Time (mm)B data points _ regression line
W CO
* d
o>±r.E c I£ 5
*ID
0
(1333) QV3H NI 3ONVHD
AR3033i*8
I
h-r fl
CM
GO
H
WCOCL,
in
m i n c N i n ^ ^ i o o > nCN T-I o O
I

SLUG TEST ANALYSIS
Rising Head Test # 2Monitor Well LS-10
Total well depth:Depth to water:Screen length (Le):Aquifer thickness:
Rc=
From type curve:Where Le/rw=
Well
59.79 feet8.52 feet10 feet
100 feet0.1 4 feet
40ln(Re/rw)=
Specifications
Well diameter:Borehole diameter:Sat. thickness (Lw):Sandpack porosity:
rw=
A=2.9989 B=
2 inches6 inches
51 .27 feet
0.2500 feet
2.70.45
Results
Regression line: r squared
Hydraulic conductivity =
Effective radial distanceof slug test =
Bouwer and Rice Method0.8366
186.30 ft/day
5.0 feet
Graphical Results
,0
•(-*_ (
•oC3<UX.E "•'<ubOcd
U 0.0,
0.001
1
\\r1 BE
1 BS
1
&
B 11 B B B B B E 1
) 0.5 , _U ... 2 2.5 3 3.5Time (mm)0 data points _ regression line

<n CO* =•o 0CO >0 >oo)±;c c
CN —• O
(1333) QV3H MI 3ONVH3
3R3D335Q
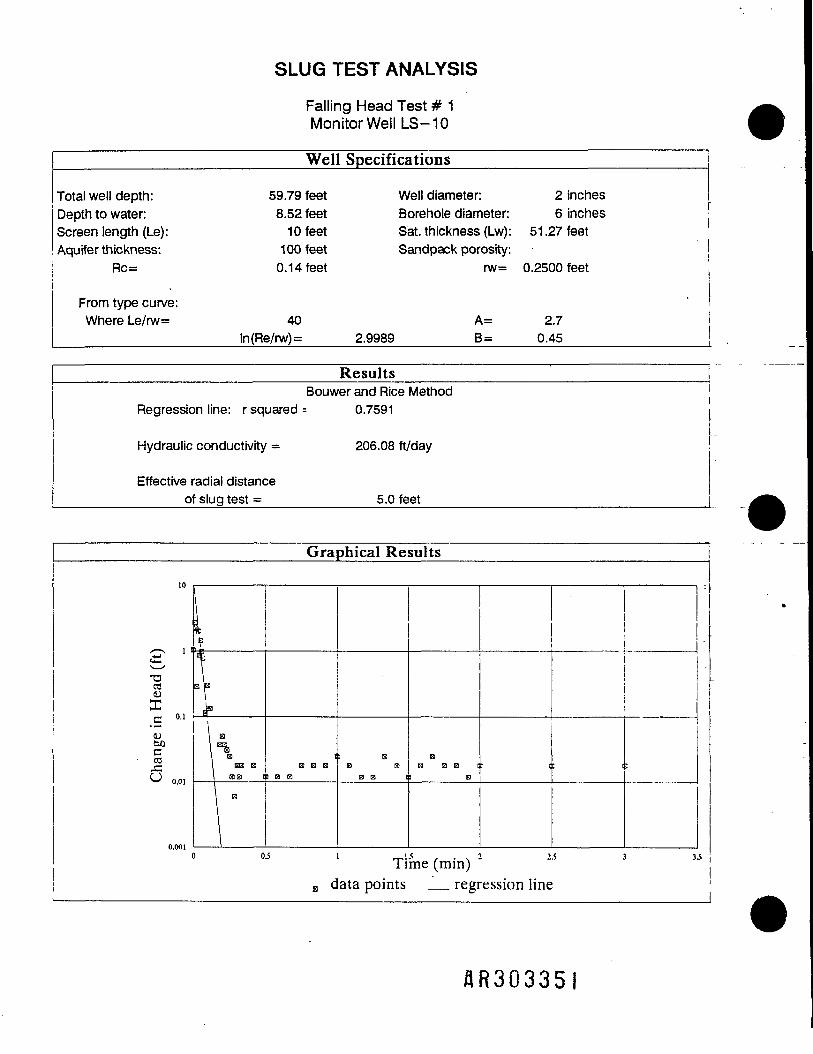
SLUG TEST ANALYSIS
Falling Head Test # 1Monitor Well LS-10
Total well depth:Depth to water:Screen length (Le):Aquifer thickness:
Rc=
From type curve:Where Le/rw=
Well
59.79 feet8.52 feet10 feet100 feet0.1 4 feet
40ln(Re/rw) =
Specifications
Well diameter:Borehole diameter:Sat. thickness (Lw):Sandpack porosity:
rw=
A=2.9989 B=
2 inches6 inches •
5 1.27 feet
0.2500 feet
2.70.45
Results
Regression line: r squared
Hydraulic conductivity =
Effective radial distanceof slug test =
Bouwer and Rice Method0.7591
206.08 ft/day
5.0 feet
Graphical Results
10
g "•aCO<uX.E "IDU)CCO
5 0.0,
0.001(
i?1 —•r*\-K1 SB B\ BB I
\ '
iB H S
i m a
: EB a
m E i
BtS E B I
9 B: t: i
) 0.5 1 1.1 ... 2 2S 3 3JTime (mm)B data points _ regression line
AR30335I

QV3H NI HONVHD
1R303352

(1333) QV3H NI 3ONVHD
AR3Q3353
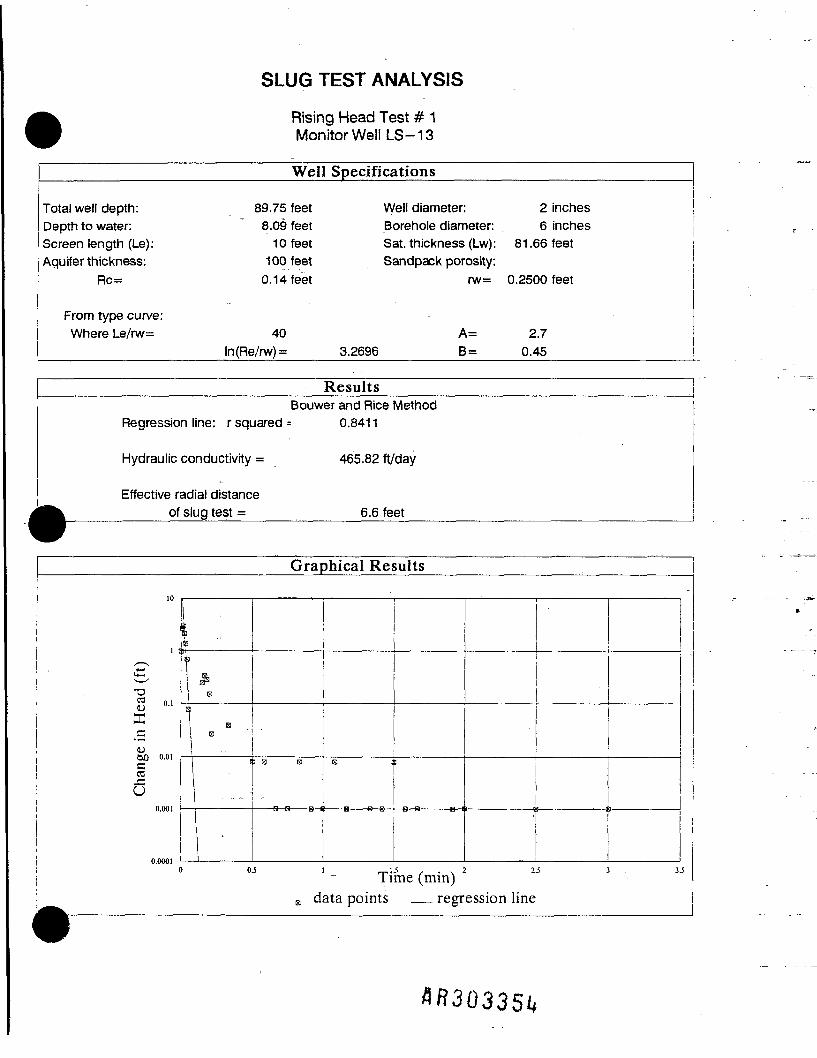
SLUG TEST ANALYSIS
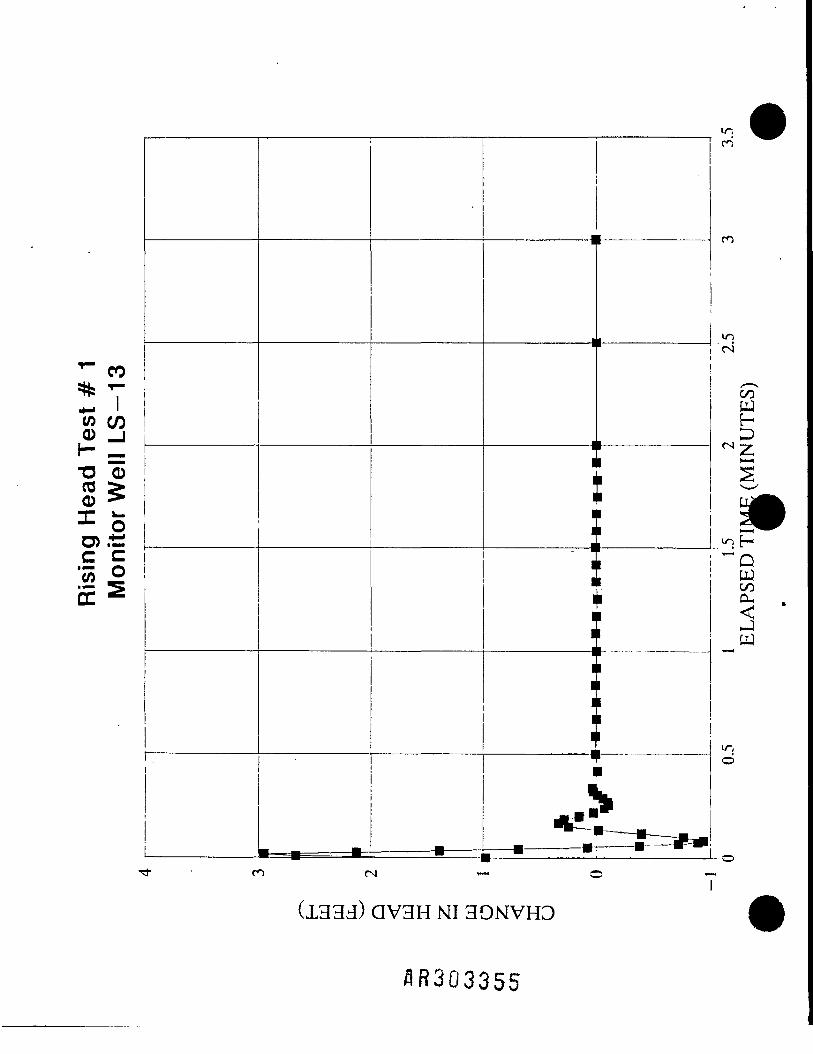
Rising Head Test # 1Monitor Well LS-13
Total well depth:Depth to water:Screen length (Le):Aquifer thickness:
Rc=
From type curve:Where Le/rw=
Well
89.75 feet8.09 feet10 feet100 feet0.1 4 feet
40ln(Re/rw) =
Specifications
Well diameter:Borehole diameter:Sat. thickness (Lw):Sandpack porosity:
rw=
A=3.2696 B =
2 inches6 inches
8 1.66 feet
0.2500 feet
2.70.45
Resultsi Bouwer and Rice Method
Regression line: r squared = 0.8411
Hydraulic conductivity = 465.82 ft/day
Effective radial distance| of slug test = 6.6 feet
Graphical Results
10
1 1
£T•a8 OJXc<uGO 0.01CCOJZU
0.001
0.00010
;3
!1
» •B
EB
!: E E S 1
TiB data points
:
i , . . !me (mm)regro
P ————— 1
2.5 . 3 Jj.
ession line
in
*" CO• "*~H— ' 'C/5 C/3
H d•O 0CO >
T -0) -c E'eo °£ 5
—————
•— — — •-—— =1 —
————— i
————— i
—————i
4
i— • ——— •'
1... __...
i ——————
i\
i
L-_
mCN
ootuHD2s•> — 'a —
10 £—<"Qw
COCu<i_tQ
ino
04 —
(1333) QV3H NI 3OMVHD

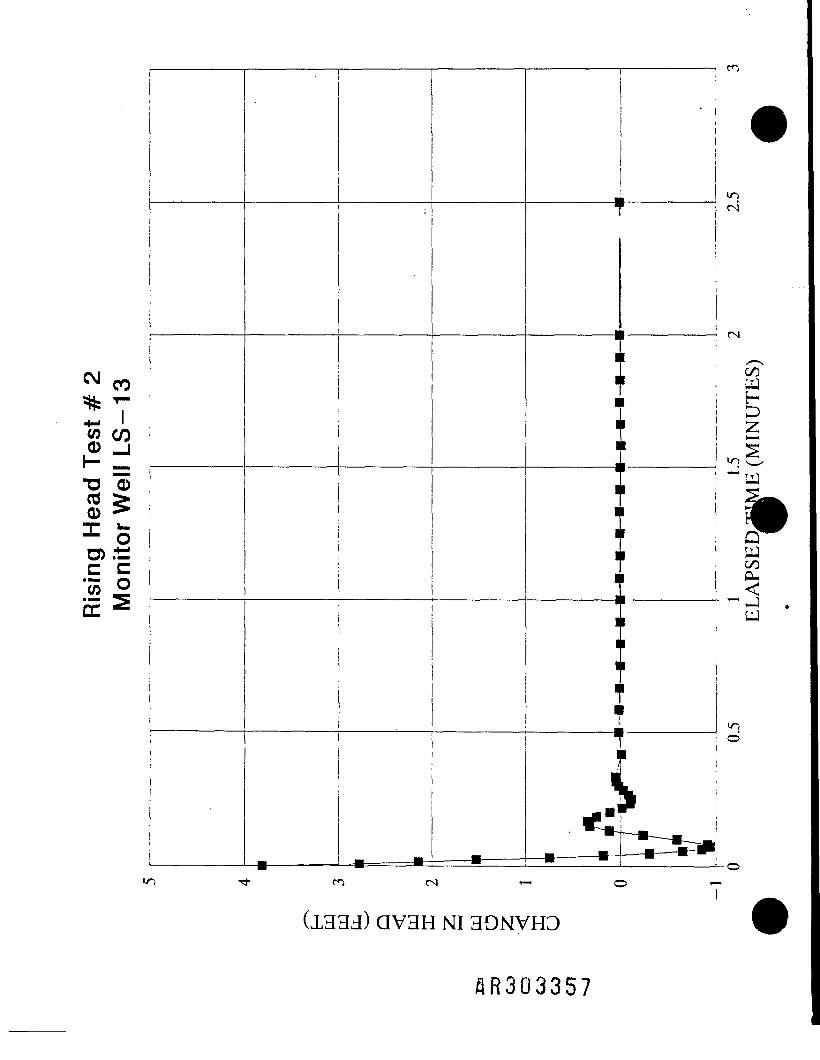
SLUG TEST ANALYSIS
Rising Head Test # 2Monitor Well LS-13
Total well depth:Depth to water:Screen length (Le):Aquifer thickness:
Rc=
From type curve:Where Le/rw=
Well
89.75 feet8.09 feet10 feet100 feet0.1 4 feet
40ln(Re/rw)=
Specifications
Well diameter:Borehole diameter:Sat. thickness (Lw):Sandpack porosity:
rw=
A=3.2696 B =
2 inches6 inches
81.66 feet
0.2500 feet
2.70.45
ResultsBouwer and Rice Method
Regression line: r squared = 0.8766
Hydraulic conductivity = 308.76 ft/day
Effective radial distance____of slug test =__________6.6 feet
Graphical Results
10
:
l
sTDS o-1X
<uGO 0.01C
JS •u0.001
0.0001(
^
\ _VE E
1 *1 B t
i
r1
: EH
B E B I
B E
5 K B E l
R r1 B E E
,
) OJS 1 1.5. . 2 2J 3Time (mm)B data points _ regression line
AR3G3356
CM w
"5 C/D0 JT3 "0CO >0 >T" *—-1- oC CW 0E s
_• ——— ==
———— •
i
———— ii
———— i
———— ii^*r
t
1 CN
W' : W
1 2' m^
: >' : CO
• — i »UJ
1)— •— - •-*,
m
(1333) QV3H NI 3ONVH3
SR303357

SLUG TEST ANALYSIS
Falling Head Test # 1Monitor Well LS-13
Total well depth:Depth to water:Screen length (Le):Aquifer thickness:
Rc=
From type curve:Where Le/rw=
Well
89.75 feet8.09 feet10 feet100 feet0.1 4 feet
40ln(Re/rw) =
Specifications
Well diameter:Borehole diameter:Sat. thickness (Lw):Sandpack porosity:
rw=
A=3.2696 B=
2 inches6 inches
8 1.66 feet
0.2500 feet
2.70.45
Results
Regression line: r squared
Hydraulic conductivity =
Effective radial distancettk of slug test =
Bouwer and Rice Method0.9090
342.85 ft/day
6.6 feet
Graphical Results
10
1
sT3S »•>X_C
t>e>o o.oi
1U
0.00,
0.0001(
m.
!*afe -r] ———* i
E
a
eac E BEE ;
B
B
I E E E E
1
Time (mm)data points regression line
e3
4
4*303358

T—
^ T—
CO ff\0 1r—•Q -£CO •>0 >in u.O> 4->
.E cn: OCO 5LL
uC
———————— 1
1
————————
j0 C3
1
1 —————————
1
11 —————————
1
— ™
3 uC'•j '•D1
^— u1
———————— 1n r"•
1
idfc»=l- ly1 r
l-= — 1
1 r^1
x-
PJHD2^v .d3HQPJCOPuJud
oo
(1333) QV3H MI 3ONVHD
AR303359

SLUG TEST ANALYSIS
Failing Head Test # 2Monitor Well LS-13
Well Specifications
Total well depth: 89.75 feet Well diameter: 2 inchesDepth to water: 8.09 feet Borehole diameter: 6 inchesScreen length (Le): 10 feet Sat. thickness (Lw): 81.66 feetAquifer thickness: 100 feet Sandpack porosity:
Rc= 0.14 feet rw= 0.2500 feet
From type curve:Where Le/rw= 40 A= 2.7
ln(Re/rw)= 3.2696 ___ B= 0.45
ResultsBouwer and Rice Method
Regression line: r squared = 0.9037
Hydraulic conductivity = 421.75 ft/day
Effective radial distance____of slug test =__________6.6 feet
Graphical Results
10
1
1
s"Og °-'X_c<uso o.oieCO
U0.001
0.0001c
*-
r~i&
E
& E E
ta i E E E E E 1S B E l 1;
1
'
0.5 1 _1.S , . . 2 2.5 3 1.5-- Time (mm)B data points _ regression line

CO
<fl ,n£ 33^0X w-O) -t—.E c= o
(1333) QV3H MI 39NVH3
flR30336.l
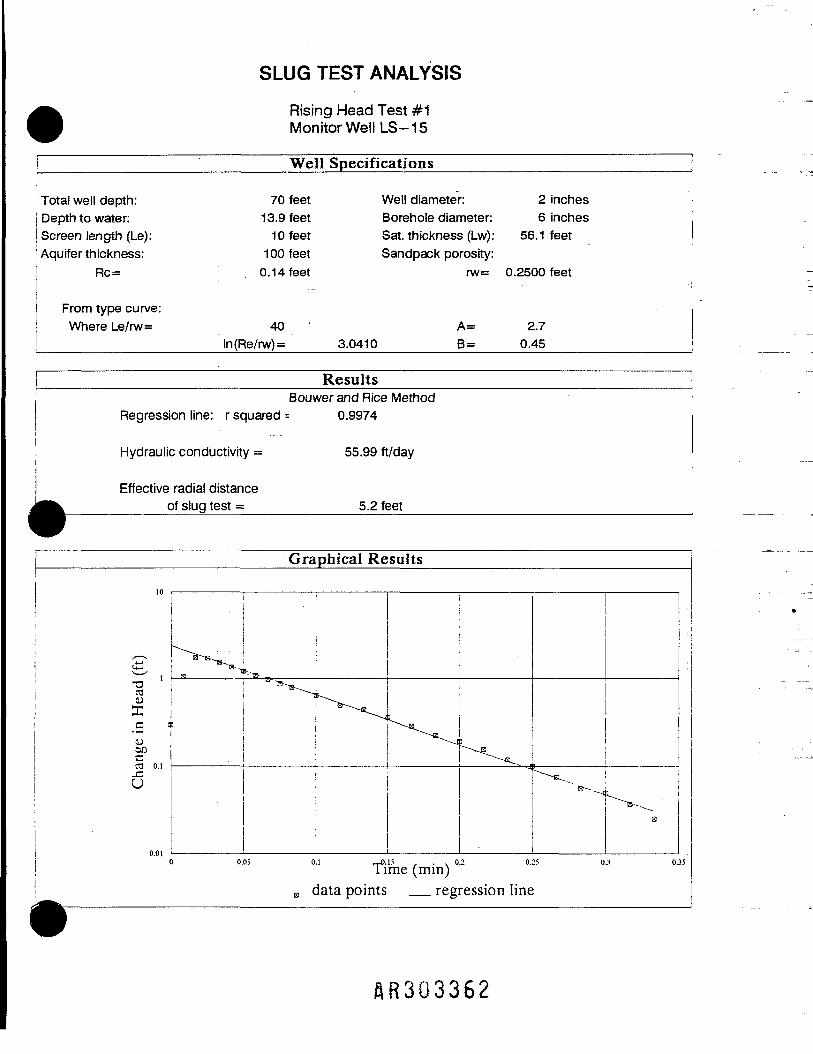
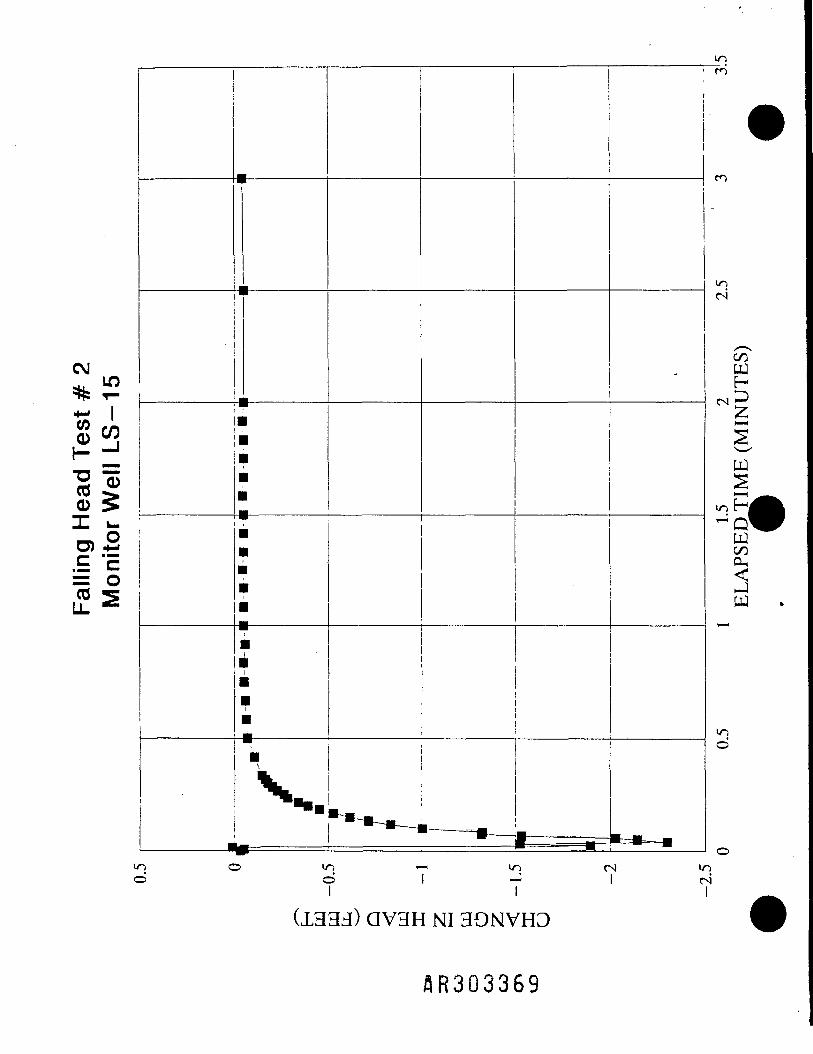
SLUG TEST ANALYSIS
Rising Head Test #1Monitor Well LS-15
Well Specifications
Total well depth:Depth to water:Screen length (Le):Aquifer thickness:
Rc=
From type curve:Where Le/rw=
70 feet13.9 feet10 feet
100 feet0.14 feet
40ln(Re/rw) =
Well diameter:Borehole diameter:Sat. thickness (Lw):Sandpack porosity:
rw=
A=3.0410 B=
————————————————
2 inches6 inches
56.1 feet -
0.2500 feet
2.70.45
ResultsBouwer and Rice Method
Regression line: r squared = 0.9974
Hydraulic conductivity = 55.99 ft/day
Effective radial distancefl of slug test = 5.2 feet
Graphical Results
10
r+->
T3aajXc t'Z25
•0.01
-,!
————— —
^^ -~ ~-jj j
E
,
) 0.05 0.1 _0.15 ... 0.2 - 0.25 0.3 0,35Time (mm)a data points _ regression line
QR303362

(1333) QV3H KI 3ONVH3
flR303363

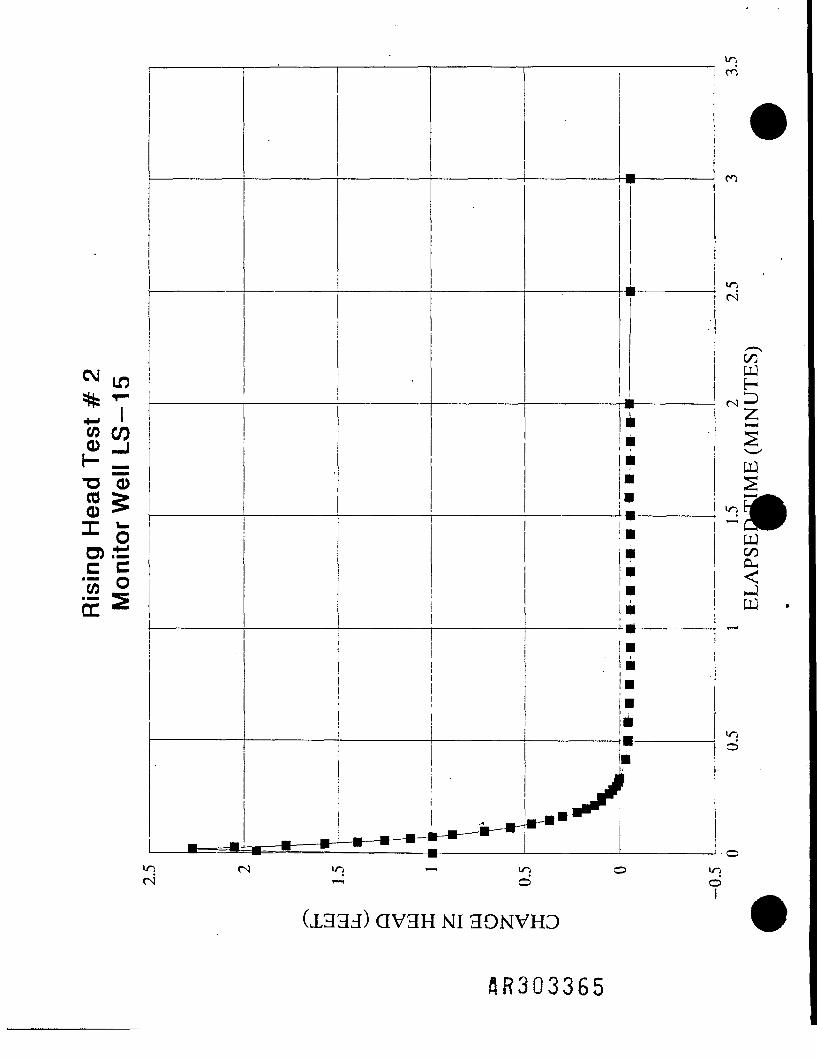
SLUG TEST ANALYSIS
Rising Head Test #2Monitor Well LS-15
Well Specifications
Total well depth:Depth to water:Screen length (Le):Aquifer thickness:
Rc=
From type curve:Where Le/rw=
70 feet13.9 feet10 feet100 feet0.1 4 feet
40ln(Re/rw)=
Well diameter:Borehole diameter:Sat. thickness (Lw):Sandpack porosity:
rw=
A=3.0410 B=
2 inches6 inches
56.1 feet
0.2500 feet
2.70.45
ResultsBouwer and Rice Method
Regression line: r squared = 0.9941
Hydraulic conductivity = 62.65 ft/day
Effective radial distance____of slug test = ________5.2 feet
Graphical Results
10
1
, — v 1 r
;
*-
' ubO
10.01
0.0010.1 n-CLlS , . . 0.2 0.25 OJ OJSTime (mm)data points _ regression line
flR30336tf
in
£ w* =•D 0CO01 O0)±ic c
|O i i i i i : i i PJ
«-»
-»•-
(1333) QV3H NI 3ONVHD
SR303365
i ^
zH-<
S
PJ
CO
m o m

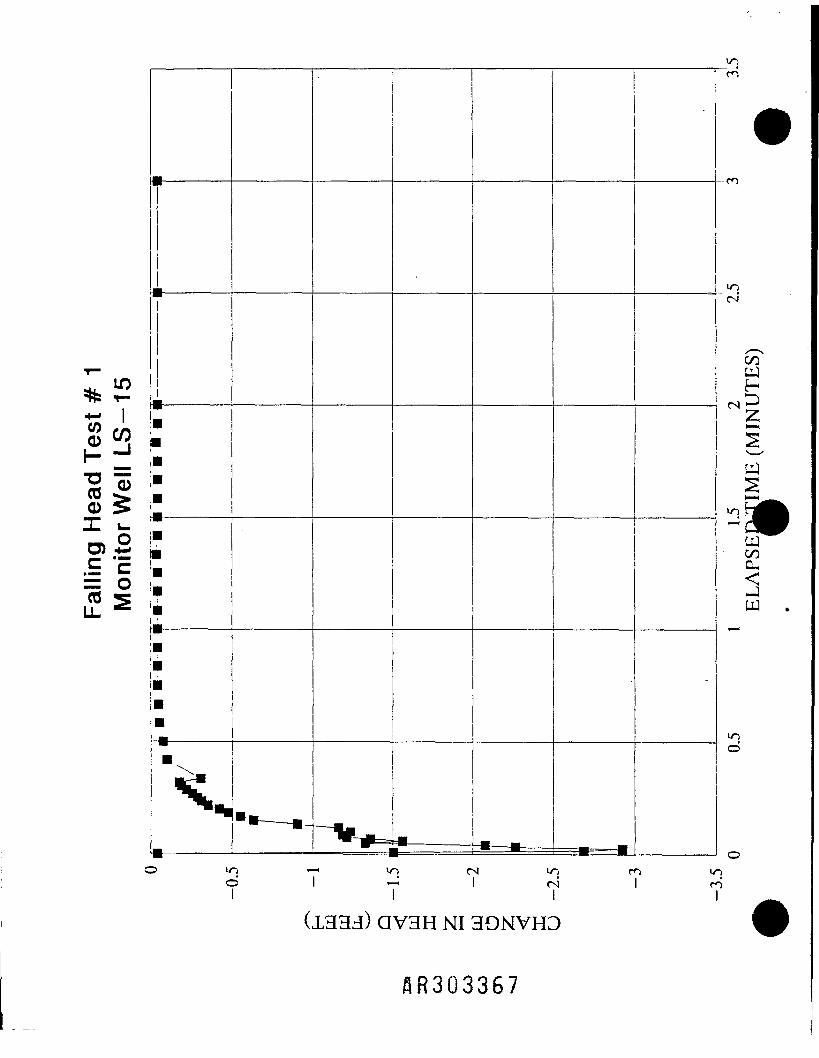
SLUG TEST ANALYSISFalling Head Test #1Monitor Well LS-15
Well Specifications
Total well depth:Depth to water:Screen length (Le):Aquifer thickness:
Rc=
From type curve:Where Le/rw=
70 feet13.9 feet10 feet
100 feet0.1 4 feet
40ln(Re/rw) =
Well diameter:Borehole diameter:Sat. thickness (Lw):Sandpack porosity:
rw=
A=3.0410 B=
2 inches6 inches
56.1 feet
0.2500 feet
2.70.45
ResultsBouwer and Rice Method
Regression line: r squared = 0.9535
Hydraulic conductivity = 34.17 ft/day
Effective radial distance____of slug test =__________5.2 feet___
Graphical Results
10
gT3 '03
=cUtooC03 O.I
u1
0.01(
9$
\•?
1B B
B E E I
\
i B B B E tE
: E H E E 1E
: E i;
) ,. OJ 1 _1J , . . 2 2.5 3 3JTime (mm)5, data points _ regression line
AR303366
in i—i in CN in m ino I — I CN I rn
I I I I
(1333) QV3H NI 3ONVHD
flR303367

SLUG TEST ANALYSIS
Falling Head Test #2Monitor Well LS-15
Well Specifications
Total well depth:Depth to water:Screen length (Le):Aquifer thickness:
Rc=
From type curve:Where Le/rw= '
70 feet13.9 feet10 feet100 feet0.1 4 feet
40ln(Re/rw) =
Well diameter:Borehole diameter:Sat. thickness (Lw):Sandpack porosity:
rw=
A=3.0410 B=
2 inches6 inches
56.1 feet
0.2500 feet
2.70.45
ResultsBouwer and Rice Method
Regression line: r squared = 0.9561
Hydraulic conductivity = 34.86 ft/day
Effective radial distance___of slug test = 5.2 feet
Graphical Results
10
X N 1•*_>U—
•o031)X.E '-1«j£P 'oa^ 0.01
0.001(
»=%£
\R
\! B « E E E B\\\
\\\
\\
: B B E S B !' B E E E B '
———————
1 fa ,3
OJ ' . 1 -,1.5 ... 2 2J J - 3JTime (mm)B data points _ regression line
flR303368
in
CMs, LO>R i~
0 h- -1~° "00 §I i-o S.E c= oCO LL
•
HI
i
y
i ————
i ————
\V^
• - ="*"-*——!
• • —m=m=-m
1
CO
inCs]
r~~PJHD
is — -
PJ%p— (
in H|
PJCOcu"Sw
>no
(—1in - in
(1333) QV3H NI 3ONVHD
SR303369

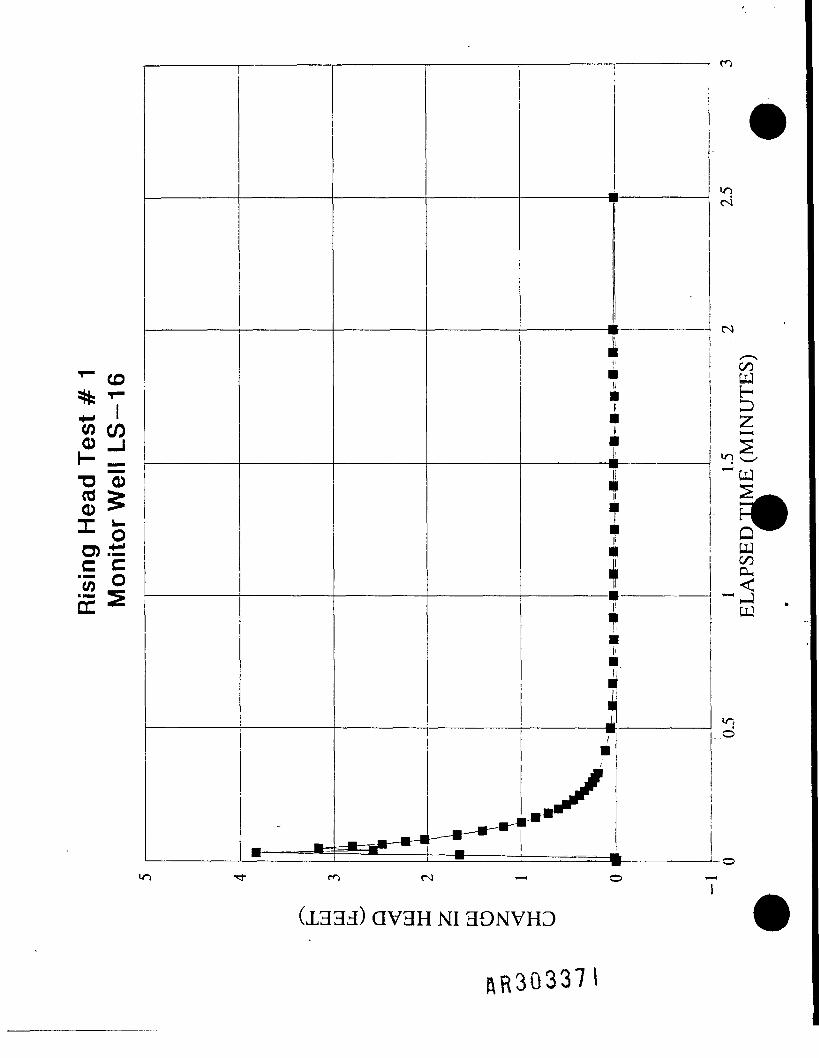
SLUG TEST ANALYSIS
Rising Head Test #1MonitorWellLS-16
Total well depth:Depth to water:Screen length (Le):Aquifer thickness:
Rc=
From type curve:Where Le/rw=
Well
40 feet11. 13 feet
10 feet100 feet0.1 4 feet
40ln(Re/rw)=
Specifications
Well diameter:Borehole diameter:Sat. thickness (Lw):Sandpack porosity:
rw=
A=2.7571 B=
•
2 inches6 inches
28.87 feet
0.2500 feet'•
2.70.45
Results
Regression line: r squared
Hydraulic conductivity =
Effective radial distance^^ of slug test =
Bouwer and Rice Method0.9920
36.34 ft/day
3.9 feet
Graphical Results
T303
bO
0.001
0.0,
E i:
1 „. , 1.5. . 2- 2.5Time (mm)data points _ regression line
SR303370
•»- co
"w c/)
•D "0CO >0 >
C Cw 5
(1333) QV3H NI 3ONVHD
ftR30337l
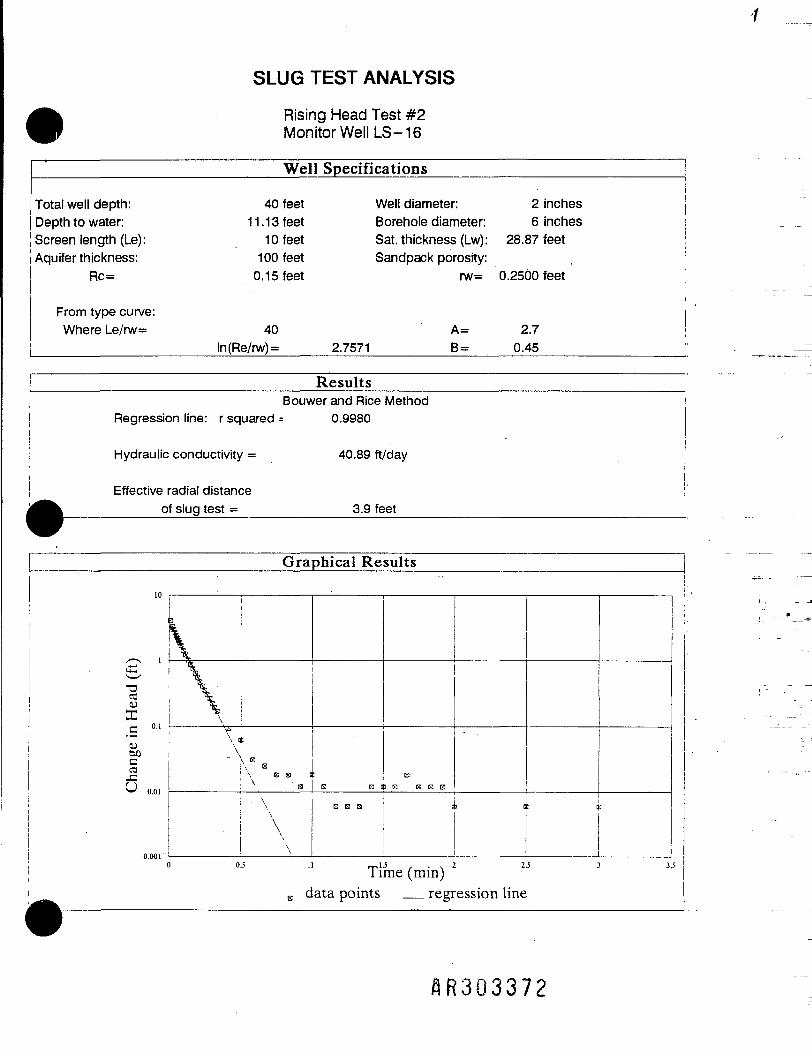
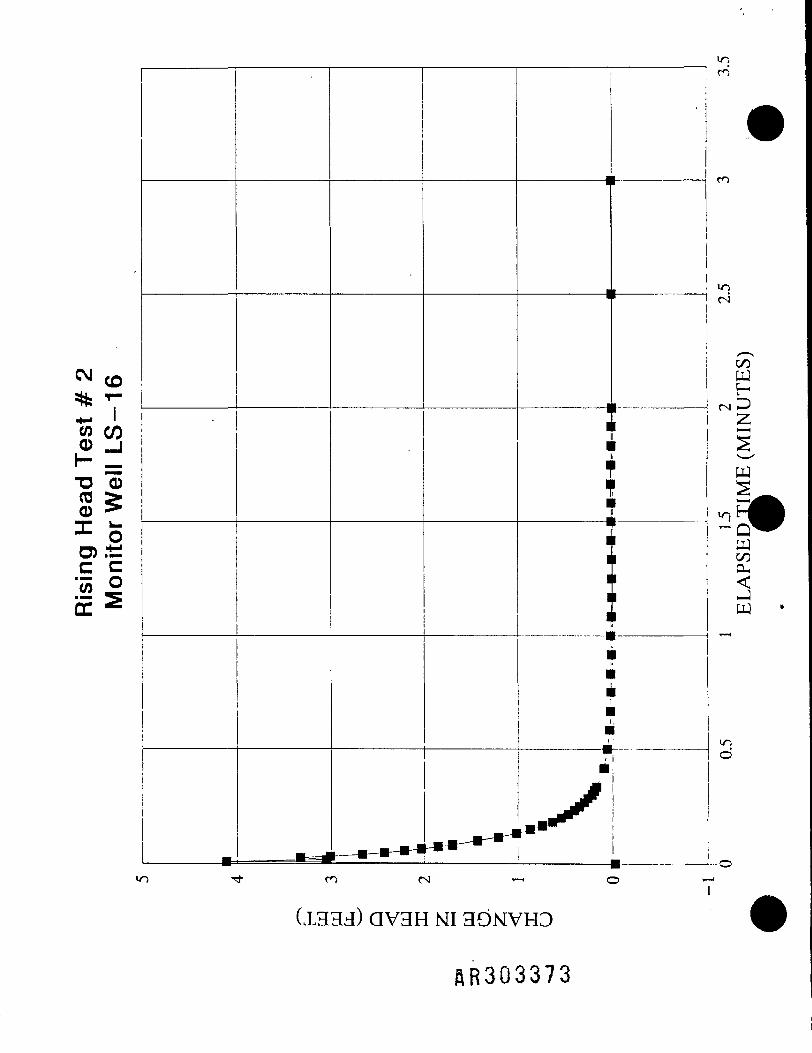
SLUG TEST ANALYSIS
Rising Head Test #2Monitor Well LS-16
Well Specifications
Total well depth:Depth to water:Screen length (Le):Aquifer thickness:
Rc=
From type curve:Where Le/rw=
4011.13
101000.15
40ln(Re/rw) =
feet Well diameter: 2 inchesfeet Borehole diameter: 6 inchesfeet Sat. thickness (Lw): 28.87 feetfeet Sandpack porosity:feet rw= 0.2500 feet
A= 2.72.7571 B= 0.45
Results
Regression line: r squared
Hydraulic conductivity =
Effective radial^ ^ of slug
distancetest =
Bouwer and Rice Method0.9980
40.89 ft/day
3.9 feet
Graphical Results
10
CT1 '<4
¥*.O60c£"-
0.001c
y\'£;\ It
- \* E\ E S I
\ ' B
'.
• \\\\\
.E E a
B B S
TlE data points
E
I B B E E
,
me (min)regr
3 t: i:
25 3 35
ession line
flR303372
CM CO
TD 0CO >0 >"T- k_oc "E
(1333) QV3H NI 3ONVHD
SR303373
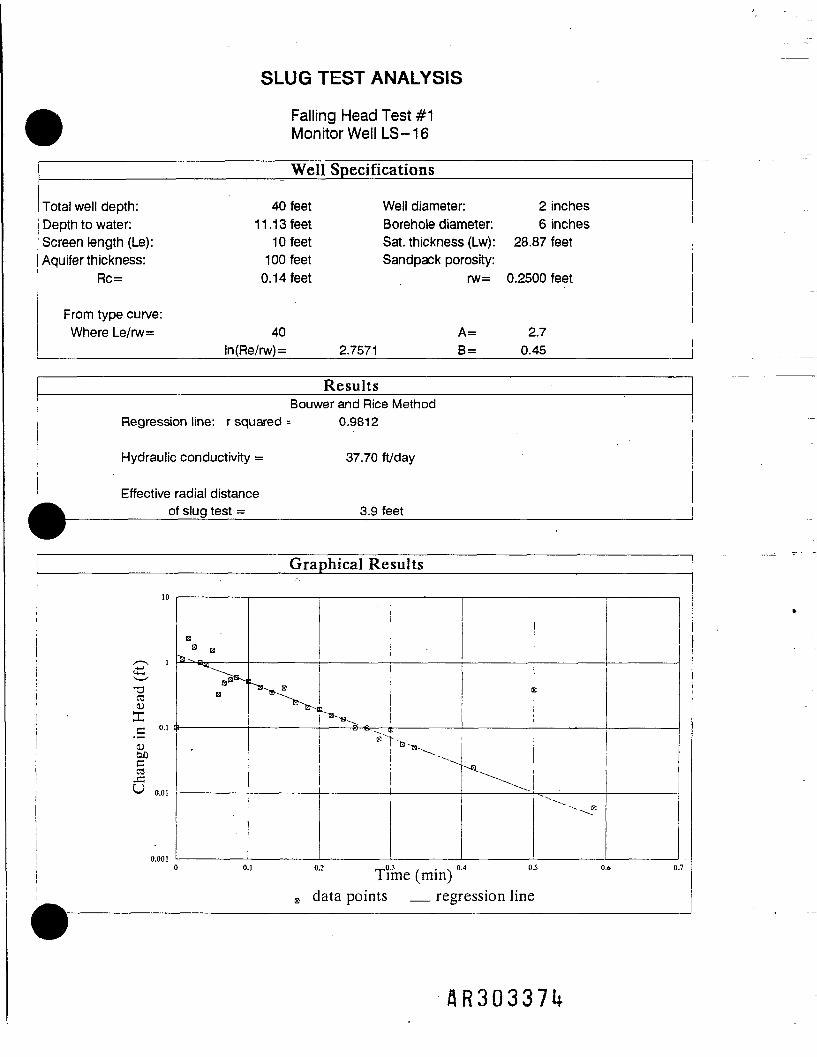
SLUG TEST ANALYSIS
Falling Head Test #1Monitor Well LS-16
Total well depth:Depth to water:Screen length (Le):Aquifer thickness:
Rc=
From type curve:Where Le/rw=
Well
40 feet11. 13 feet
10 feet100 feet0.1 4 feet
40ln(Re/rw) =
Specifications
Well diameter:Borehole diameter:Sat. thickness (Lw):Sandpack porosity:
rw=
A=2.7571 B =
2 inches6 inches
28.87 feet
0.2500 feet
2.70.45
ResultsBouwer and Rice Method
Regression line: r squared = 0.9812
Hydraulic conductivity = 37.70 ft/day
Effective radial distance_____of slug test =__________3.9 feet___
Graphical Results
10
£•oa<uXc °-' !OJMC03
5 0.0,
0.001 (
^
BB B
•fr j.
N3
«*-_ E~~~-WB
S~vj
"S ^————— B-S.. ;: ————— --
<S~" -B-T3- ^
!
^
:
" """- P1
0.1 0.2 _,OJ , . . 0.4 OJ O.o 0.7Time (mm)B data points _ regression line
AR3Q337U

"SCO0X i-O) *-.E c= oCO
in O in >—> in csj ino o I "• I rj
I I I
(1333) QV3H NI 3ONVHD
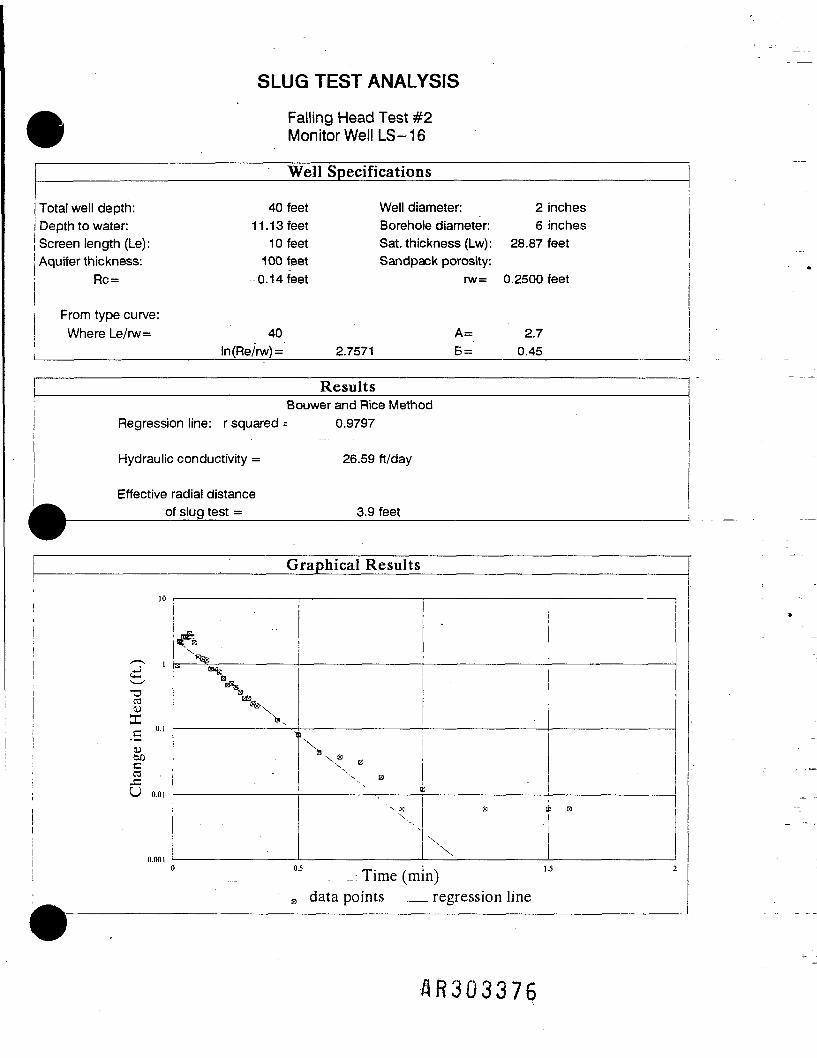
SLUG TEST ANALYSIS
Falling Head Test #2Monitor Well LS-16
Total well depth:Depth to water:Screen length (Le):Aquifer thickness:
Rc=
From type curve:Where Le/rw=
Well
40 feet11. 13 feet
10 feet100 feet0.1 4 feet
40ln(Re/rw) =
Specifications
Well diameter:Borehole diameter:Sat. thickness (Lw):Sandpack porosity:
rw=
A=2.7571 B=
2 inches6 inches
28.87 feet
0.2500 feet
2.70.45
ResultsBouwer and Rice Method
Regression line: r squared = 0.9797
Hydraulic conductivity = 26.59 ft/day
Effective radial distance____of slug test =__________3.9 feet___
Graphical Results
10
•T" 14_J
03
XcQJC03
O 0.01
0.001(
^
i* ast
X
"'x B1
s. EX
f
t3 C
'\
E
OJ „. . 1 , U 2Time (mm)B data Doints regression line
8R303376

in
C\J ooco i———ii————————————————————___. r m -4- I i ^w ,« I Z0H"o — wCO0
x o ——•—————————————————————-i « a-*-1 I ! PJ
C 'F t/D= o ^
JPJ
(1333) QV3H NI 3ONVHD
SR303377
U-l*
in o in •—' m CN in ro inO O I — I rN I ro
I I I I

SLUG TEST ANALYSIS
Rising Head Test #1Monitor Well LS-17
Total well depth:Depth to water:Screen length (Le):Aquifer thickness:
Rc=
From type curve:Where Le/rw=
Well
90 feet12.2 feet10 feet
100 feet0.1 4 feet
40ln(Re/rw) =
Specifications
Well diameter:Borehole diameter:Sat. thickness (Lw):Sandpack porosity:
rw=
A=3.2300 B =
2 inches6 inches
77.8 feet
0.2500 feet
2.70.45
Results
Regression line: r squared
Hydraulic conductivity =
Effective radial distance^^ of slug test =
Bouwer and Rice Method0.9259
273.37 ft/day
6.3 feet
Graphical Results
10
•areX
<uc03
*-' 0.01
0.001(
itBj.
11
1 *
"t\ -
EJ S
E E E BEE 1
E
: E 0 E :
c
:
!
) OJ 1 . .. _1.S ... 2 2.5 3 35Time (mm)B data points _ regression line
ftR303378

in
in(N
CO
H
to \ f SH- i! • s• 0 0 I Sco >0 > _____________________m__________i o PJ£ c i • w
E
vo in •<* co
(1333) QV3H NI 3ONVHD
flR303379
ind
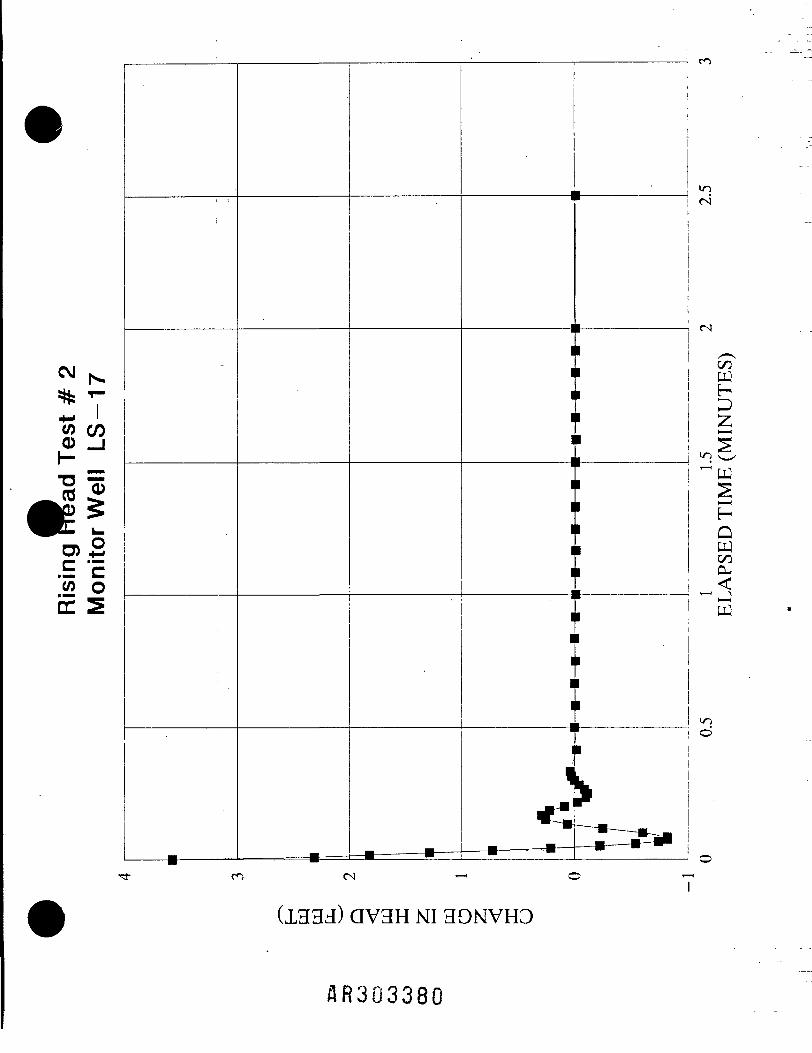
(1333) QV3H NI 3OMVH3
flR303380
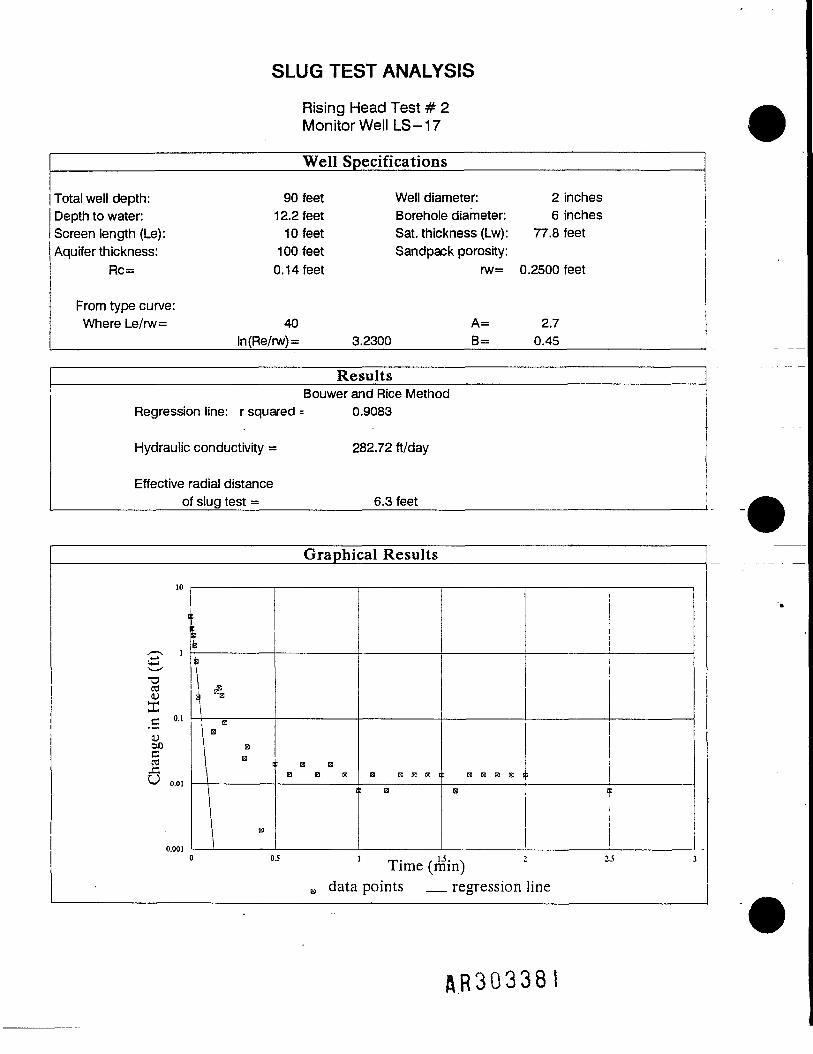
SLUG TEST ANALYSIS
Rising Head Test # 2Monitor Well LS-17
Total well depth:Depth to water:Screen length (Le):Aquifer thickness:
Rc=
From type curve:Where Le/rw=
Well
90 feet12.2 feet10 feet100 feet0.1 4 feet
40ln(Re/rw)=
Specifications
Well diameter:Borehole diameter:Sat. thickness (Lw):Sandpack porosity:
rw=
A=3.2300 B=
2 inches6 inches
77.8 feet
0.2500 feet
2.70.45
Results
Regression line: r squared
Hydraulic conductivity =
Effective radial distanceof slug test =
Bouwer and Rice Method0.9083
282.72 ft/day
6.3 feet
Graphical Results
10
1
s~OreVXc 0.1CJ00cJU 0.0,
0.001(
;eE
V-p ——e
m
E! E BE B B
i
E B E E !
) B
i B e E E !
& 1
0.5 1 _,. , U. . 2 15Time (mm)B data points _ regression line
AR30338!

w co i • • PJ0 -J ' • HH : Dz
oc •= ! H
Q.^ u^ s^
UJ
I ' I(1333) QV3H MI 3OMVH3
AR303382

(1333) QV3H MI 3OMVHD
&R303383
CM ^ i——————————————————ii—————————————————I———•——i~^J"~ p„- - z
•O 15 1 - WCO 0 50)2C "F i ii I co— « I i ^«I n \ 5LL S i i ! W
ind
*
in —. in o in — in rs)—' d d I « I
I I
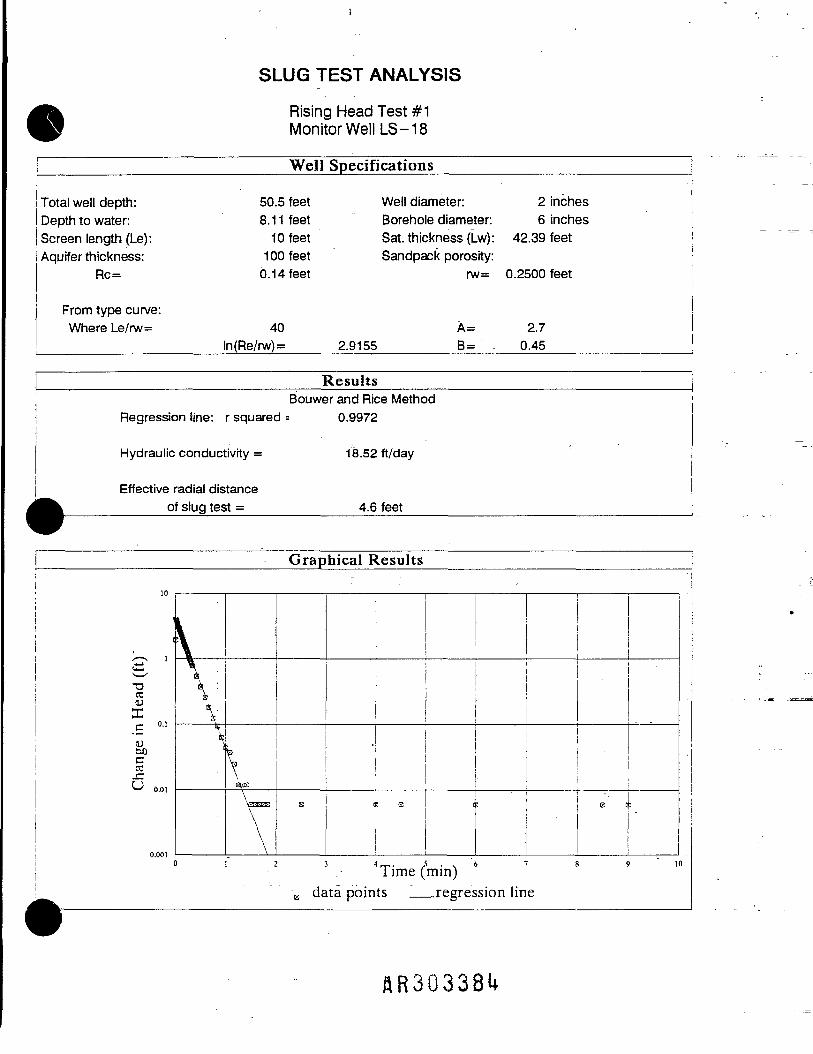
SLUG TEST ANALYSIS
Rising Head Test #1Monitor Well LS-18
Total well depth: 50.5Depth to water: 8.11Screen length (Le): 10Aquifer thickness: 1 00
Rc= 0.14
From type curve:Where Le/rw= 40
ln(Re/rw) =
Well
feetfeetfeetfeetfeet
Specifications.
Well diameter: 2 inchesBorehole diameter: 6 inchesSat. thickness (Lw): 42.39 feetSandpack porosity:
rw= 0.2500 feet
A= 2.72.9155 B= 0.45
Results
Regression line: r squared
Hydraulic conductivity =
Effective radial distance^ of slug test =
Bouwer and Rice Method0.9972
f8.52 ft/day
4.6 feet
Graphical Results
10 ——————————————————————————————————————————————————————————————————————————————————————— •
1c
.
aX.S<unocCOJ£!J0 0.0,
VYY
t>ECE
\
\
j j
E
'0 1 2 3
B data poin'Time (ts
i1
-
t
"0 B i:
"
~ . . 6 7 8 9 10mm)regression line
&R3Q3381*

00
•o 0CO >0 >"T" k.oc 'E
(1333) QV3H MI 3OMVHD
AR303385
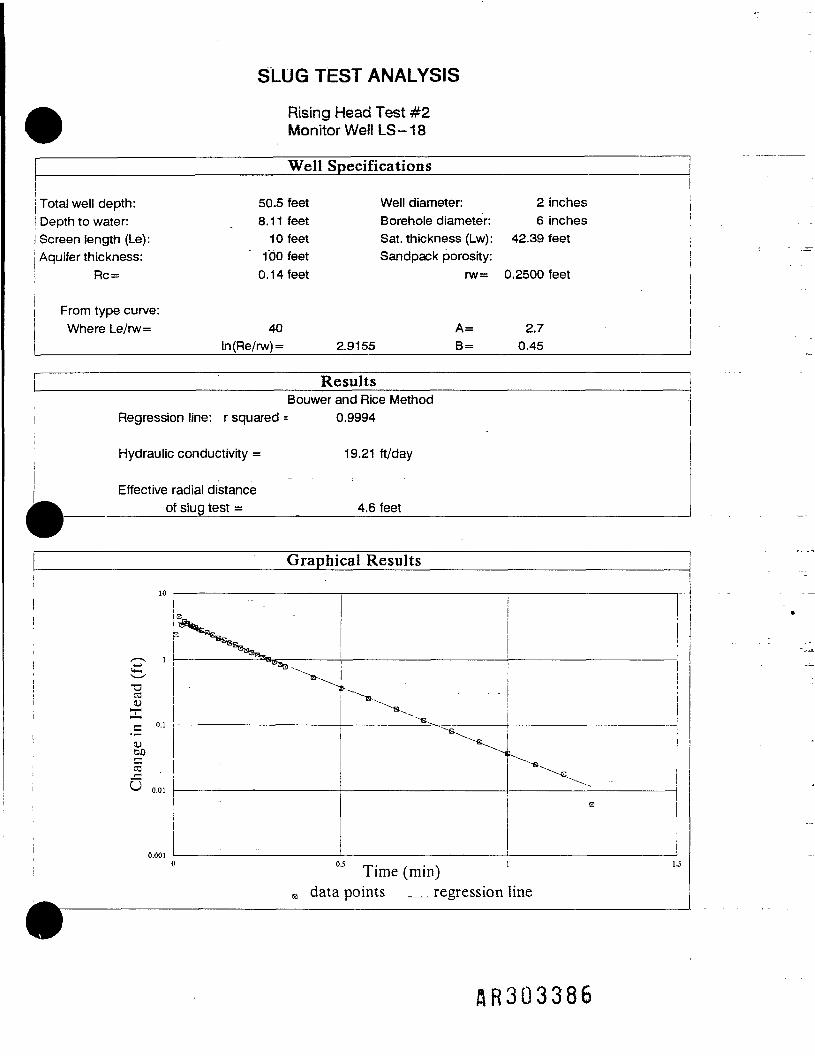
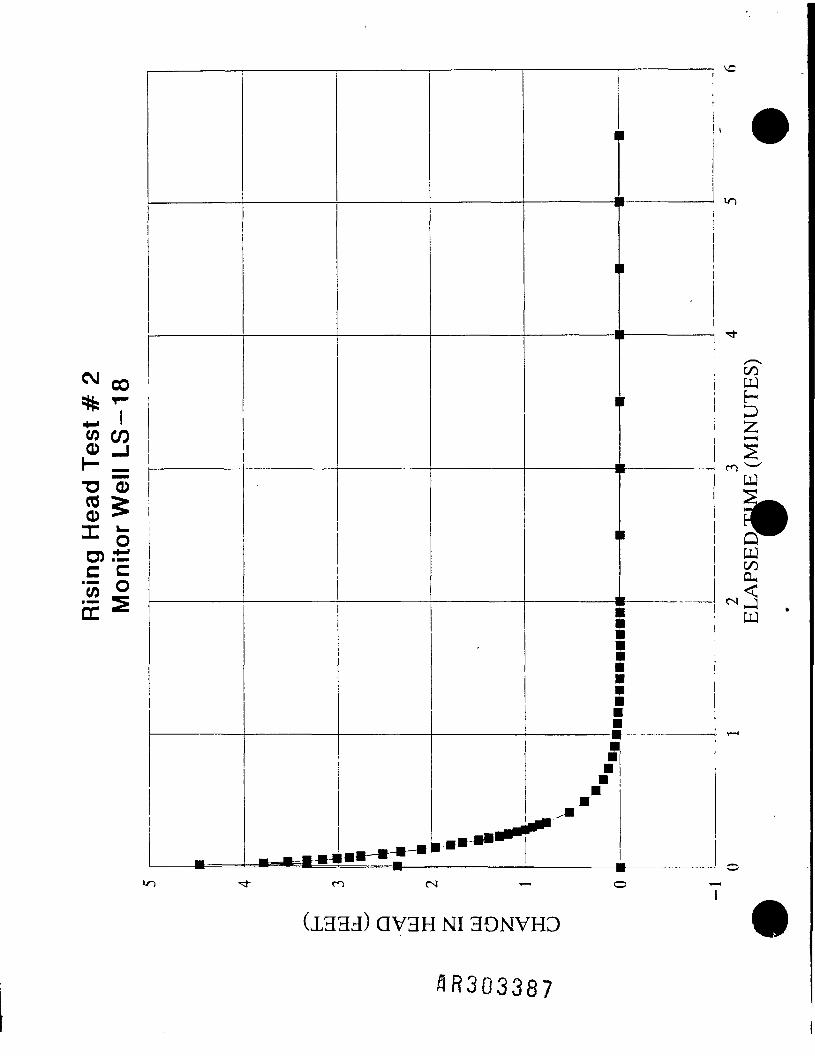
SLUG TEST ANALYSIS
Rising Head Test #2Monitor Well LS-18
Well Specifications
Total well depth:Depth to water:Screen length (Le):Aquifer thickness:
Rc=
From type curve:Where Le/rw=
50.5 feet8. 11 feet10 feet
100 feet0.14 feet
40ln(Re/rw) =
Well diameter:Borehole diameter:Sat. thickness (Lw):Sandpack porosity:
rw=
A=2.9155 B =
2 inches6 inches
42.39 feet
0.2500 feet
2.70.45
ResultsBouwer and Rice Method
Regression line: r squared = 0.9994
Hydraulic conductivity = 19.21 ft/day
Effective radial distance____of slug test =__________4,6 feet
Graphical Results
•o03<UX
SJtoc
OJ „. . . . 1Time (mm)data points _ regression line
SR3Q3386
«M (.5,
*T•M '
82"O "0CO >0 >-1- k.-*- oo) ±;c c• MOT ^^w °£ 2
——— • — —__B_B=|HH••
1
———————— 1
1
———————— 1
1
———————— 1
1
———————— 1
•
1
t
1
•
m
n-
cTTwH
SPJ^PsM«4
ta '
- r^
en
(1333) QV3H MI 3OMVH3
flR303387

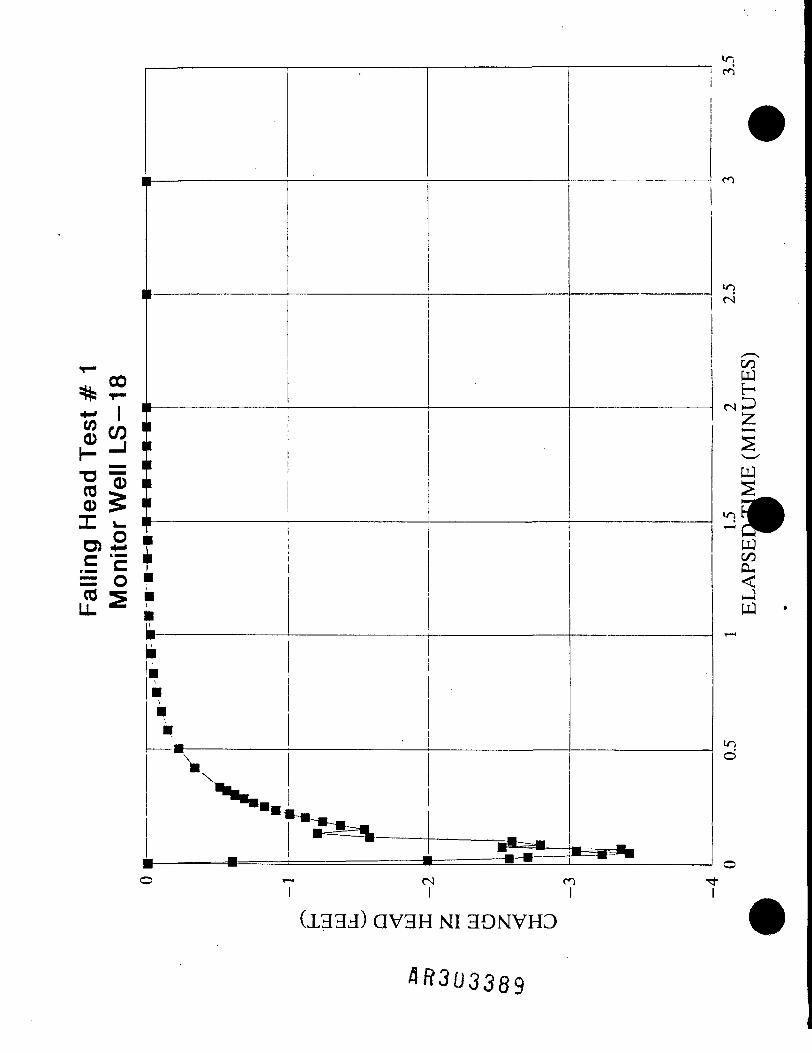
SLUG TEST ANALYSIS
Falling Head Test #1Monitor Well LS-18
Total well depth:Depth to water:Screen length (Le):Aquifer thickness:
Rc=
From type curve:Where Le/rw=
Well
50.5 feet8.11 feet10 feet
100 feet0.1 4 feet
40ln(Re/rw) =
Specifications
Well diameter:Borehole diameter:Sat. thickness (Lw):Sandpack porosity:
rw=
A=2.9155 B =
ii|
2 inches6 inches
42.39 feet
0.2500 feet
2.70.45
Results
Regression line: r squared
Hydraulic conductivity =
Effective radial distanceB^. of slug test =
Bouwer and Rice Method0.9843
21 .00 ft/day
4.6 feet
Graphical Results
10
-4—1
^
•uaDXc o-1<utocca6 0.0, °
0.001
&3 •-
'ik. '
V; - > ...'».. """^
'ee
- -B.i•• E Q
E E
x B !
\
C B B B B B I: i: . i
) 05 . . 1 ,-,1.5 ... 2 2J. 3 ._ 3.5.Time (mm)m data points
-• --regression line
QR303388
(1333) QV3H MI 3OMVHD
^^303389

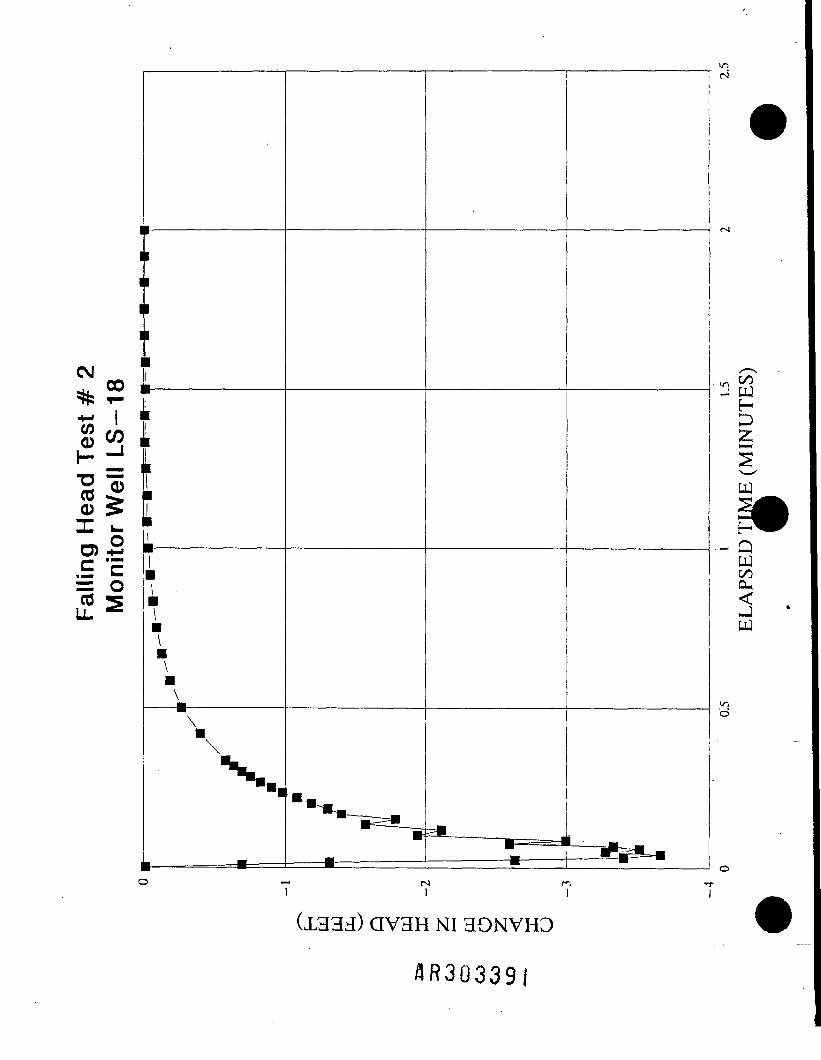
SLUG TEST ANALYSIS
Falling Head Test #2Monitor Well LS-18
Total well depth:Depth to water:Screen length (Le):Aquifer thickness:
Rc=
From type curve:Where Le/rw=
Well
50.5 feet8.11 feet10 feet100 feet0.1 4 feet
40ln(Re/rw) =
Specifications
Well diameter:Borehole diameter:Sat. thickness (Lw):Sandpack porosity:
rw=
A=2.9155 B=
————————————————2 inches6 inches
42.39 feet
0.2500 feet
2.70.45
ResultsBouwer and Rice Method
Regression line: r squared = 0.9948
Hydraulic conductivity = 18.35 ft/day
Effective radial distancefl of slug test = 4.6 feet
Graphical Results
10
1
•oS »•'X
u&0 °-oiCreU
0.001
0.0001(
•
x
—
^
- B B :: E
•
>N"\ H 0 E e 8;
1 1! IN--^ '
. - 0.5 „!. . . 15 2 25Time (mm)B data points __ regression line
AR303390
*. °° •-SRS T- I,*- I «
CD H-*.E c= o
\
7(1333) QV3H MI 3OMVH3
4R30339I
HD
ULJmHQWCOcu
iqO

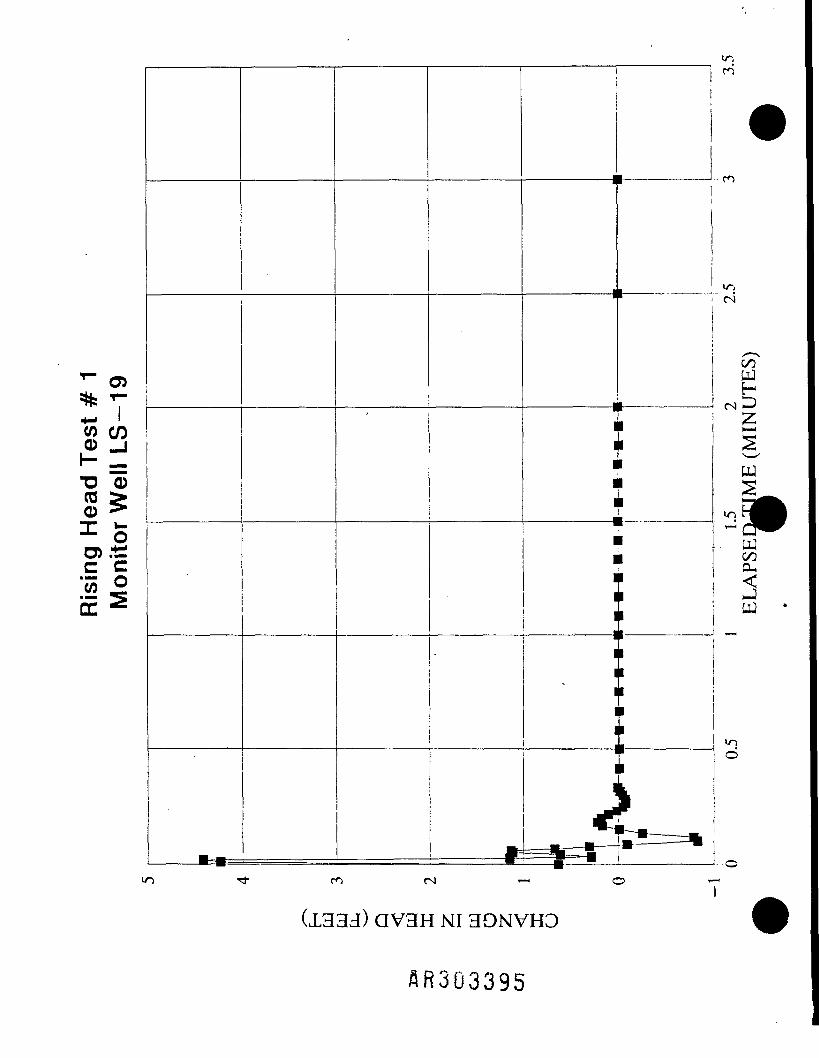
SLUG TEST ANALYSIS
Rising Head Test #1Monitor Well LS-19
Well Specifications
Total well depth: 90 feet Well diameter: 2 inchesDepth to water: 8.53 feet Borehole diameter: 6 inchesScreen length (Le): 10 feet Sat. thickness (Lw): 81.47 feetAquifer thickness: 100 feet Sandpack porosity:
Rc= 0.13 feet rw= 0.2500 feet
From type curve:Where Le/rw= 40 A= 2.7__ _________ln(Re/rw)=_____3.2676________B=____0.45______
ResultsBouwer and Rice Method
Regression line: r squared = 0.9999
Hydraulic conductivity = 649.39 ft/day
Effective radial distanceof slug test = _______6.6 feet___
Graphical Results
10
S '•areuX.£ 0-1ubOCa5 „.„,
0.001'
*
\ •B\ .
fc: \ B
\*!
\\
a
E
\
Y
BE
f ,
E
B
5 0.05 0.1 rrA15 , . x 0.2 0.25 OJ 0.35Time (mm)B data points __ regression line

SLUG TEST ANALYSIS
Falling Head Test # 1Monitor Well LS-19
AR30339.3
Well Specifications
Total well depth:Depth to water:Screen length (Le):Aquifer thickness:
Rc==
From type curve:Where Le/rw=
908.53101000.14
40ln(Re/rw)=
feet Well diameter: 2 inchesfeet Borehole diameter: 6 inchesfeet Sat. thickness (Lw): 81. 47 feetfeet Sandpack porosity:feet rw= 0.2500 feet
A= 2.73.2676 B= 0.45
Results
Regression line: r squared
Hydraulic conductivity =
Effective radialof slug
distancetest =
Bouwer and Rice Method0.7591
'209.02 ft/day
6.6 feet
Graphical Results
10
^ 're
to
U o.01
0.001
\
'l B
S E
\ <?
\\(i E E
1 E B e
\E B B B B E B E 1: i B
13 1 „,. 2 . 3 tTime (mm)
8 data points __ regression line

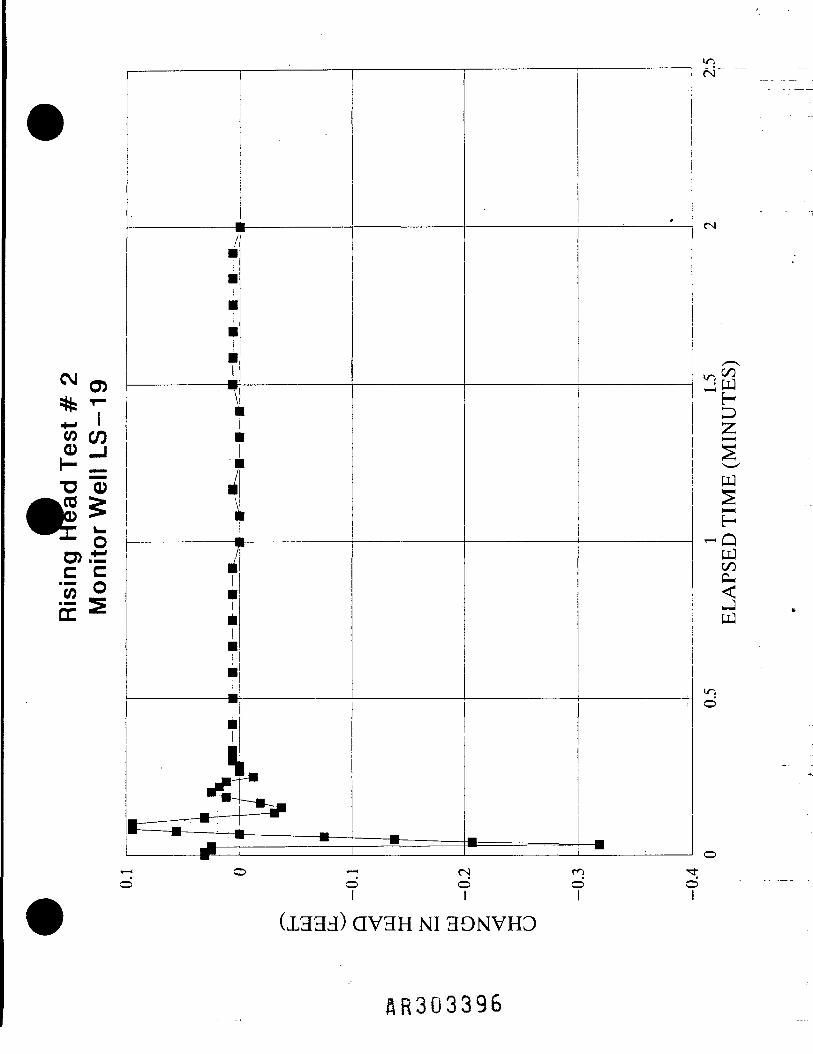
SLUG TEST ANALYSIS
Falling Head Test # 2Monitor Well LS-19
Well Specifications
Total well depth:Depth to water:Screen length (Le):Aquifer thickness:
Rc=
From type curve:Where Le/rw=
90 feet8.53 feet10 feet
100 feet0.1 4 feet
40ln(Re/rw) =
Well diameter:Borehole diameter:Sat. thickness (Lw):Sandpack porosity:
rw=
.A=3.2676 B =
2 inches6 inches
81 .47 feet
0.2500 feet
2.70.45
ResultsBouwer and Rice Method
Regression line: r squared = 0.8778
Hydraulic conductivity = 383.30 ft/day
Effective radial distanceof slug test = 6.6 feetp
Graphical Results
10
&^ 'reUJXC «.l
0)bfiCre5 0.01
n wii
1"tE E
tffi
1 B
B B
\ B 1i B E (: B B B .
.
3
0.5 1 ' „. , 1.5. s 2Time (mm)data points _ regression line
SR30339U
T3 0CO >0 >1 O0.1=:c c
COPJHD2
C/D
inen
in ^ en
(1333) QV3H MI 3OMVHO
WS
in
COCL,
UJ
in
(1333) QV3H MI 3OMVHD
flR303396

C/5
X -D) •*-*.E 'E— oCO LL
(1333) QV3H MI 3OMVHD
6R303397

(1333) QV3H MI 3OMVHD
AR303398
APPENDIX H
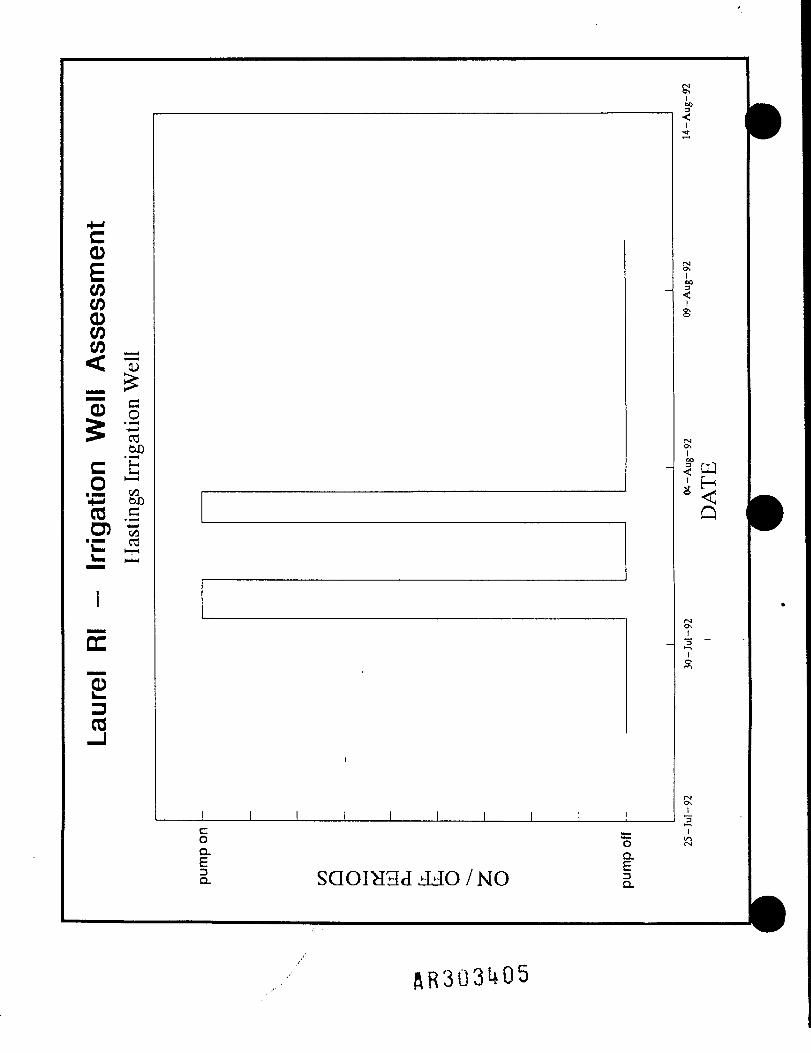
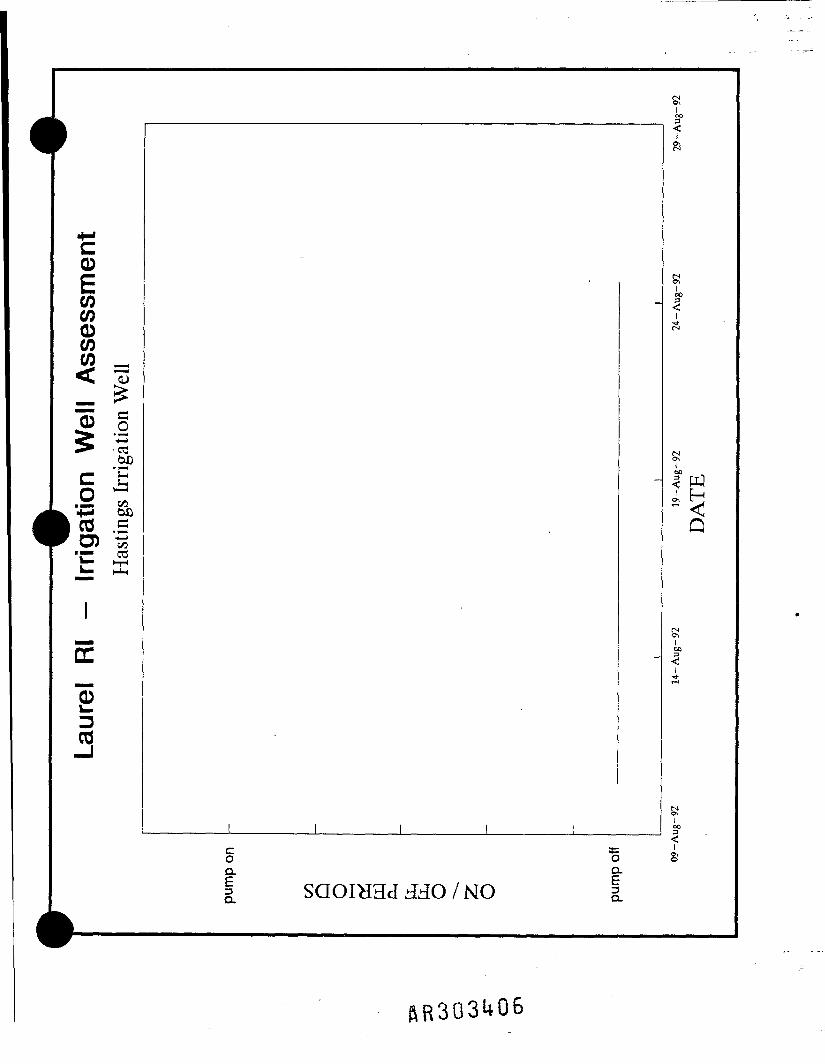
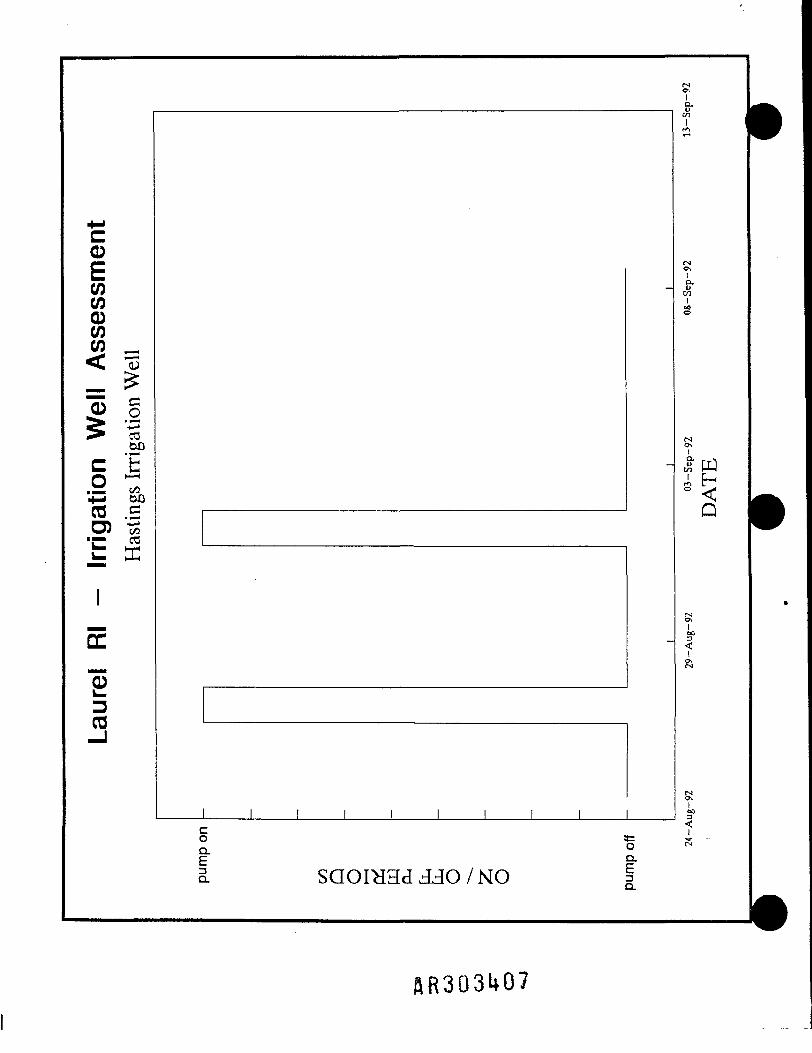
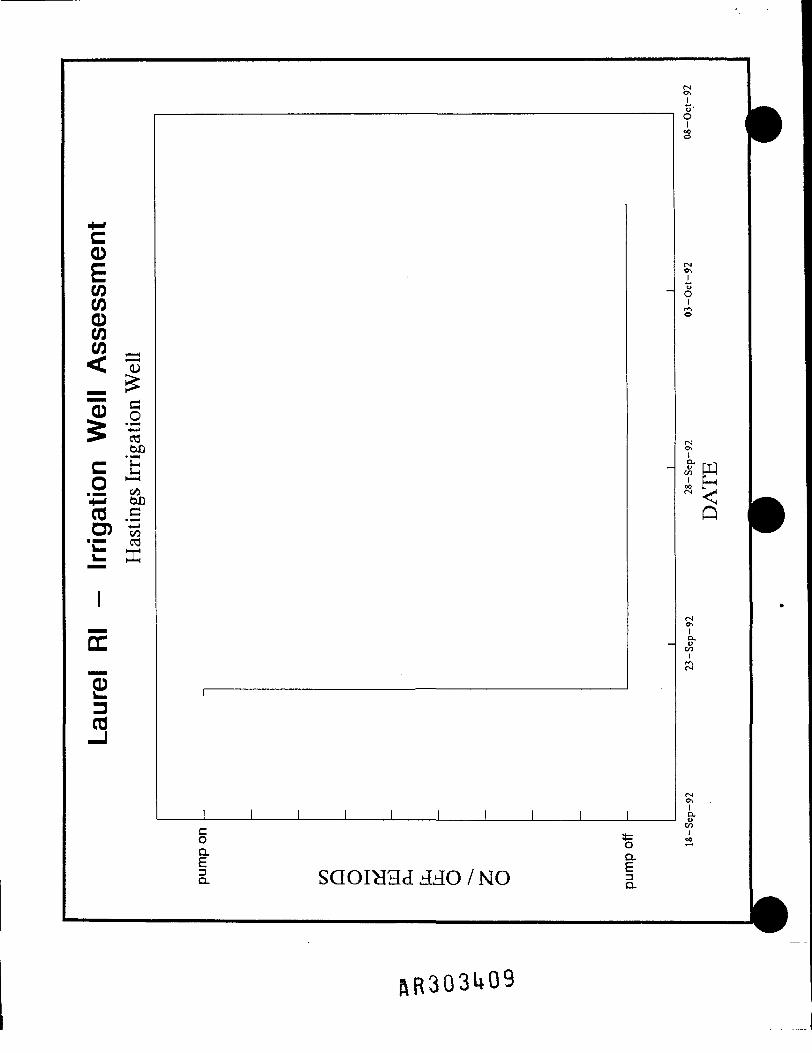
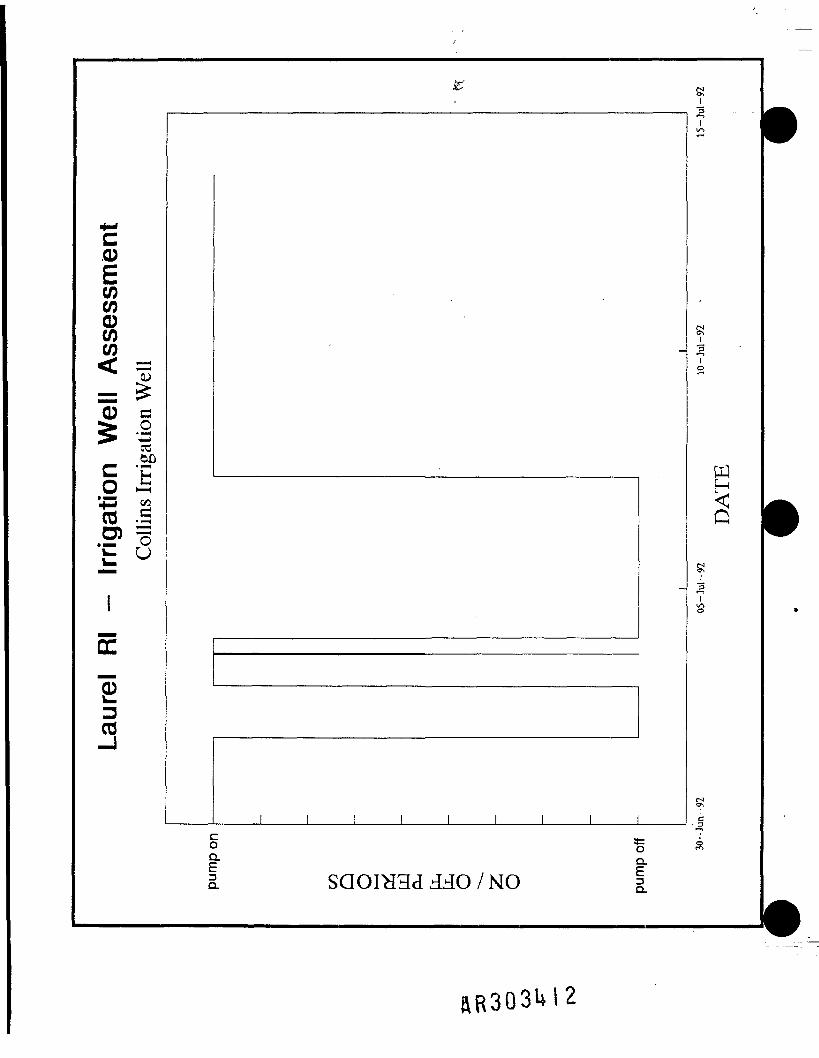
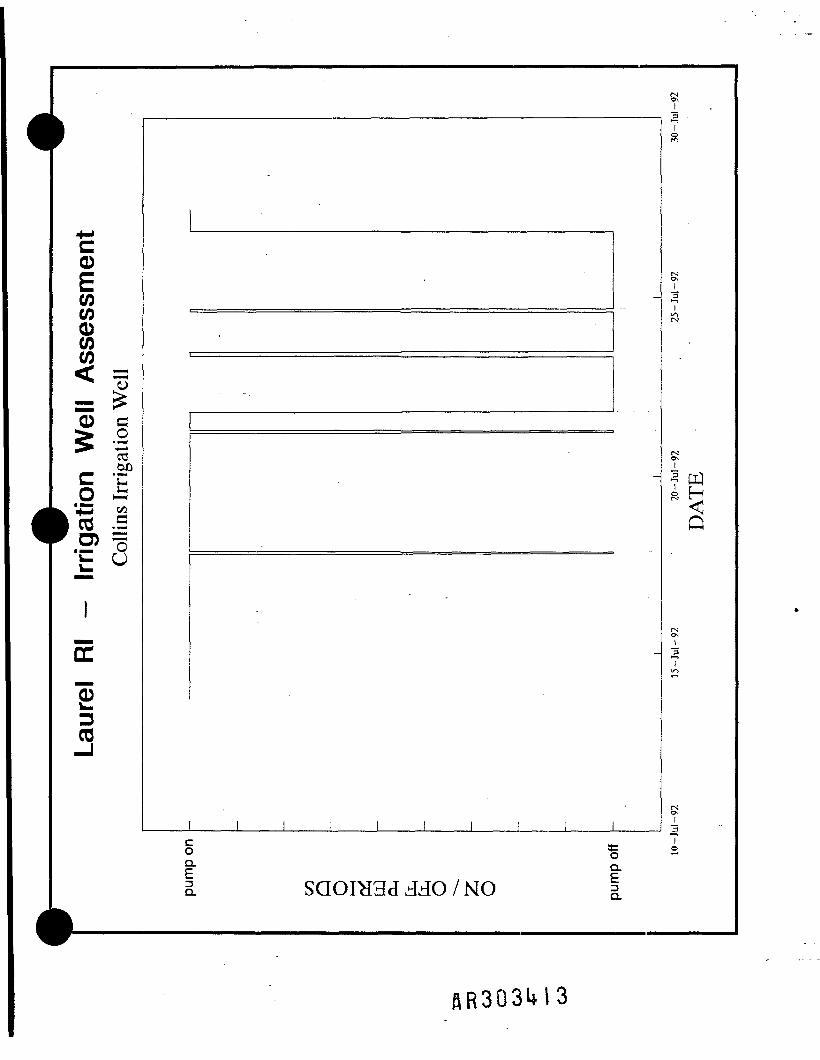
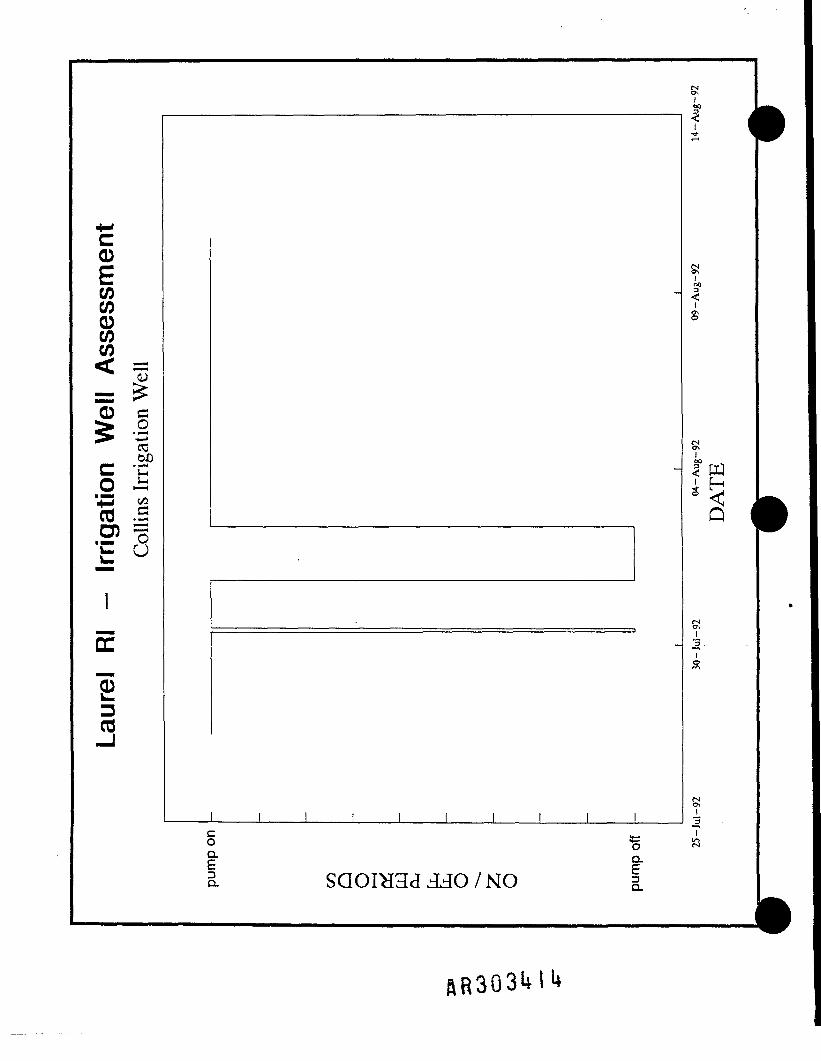
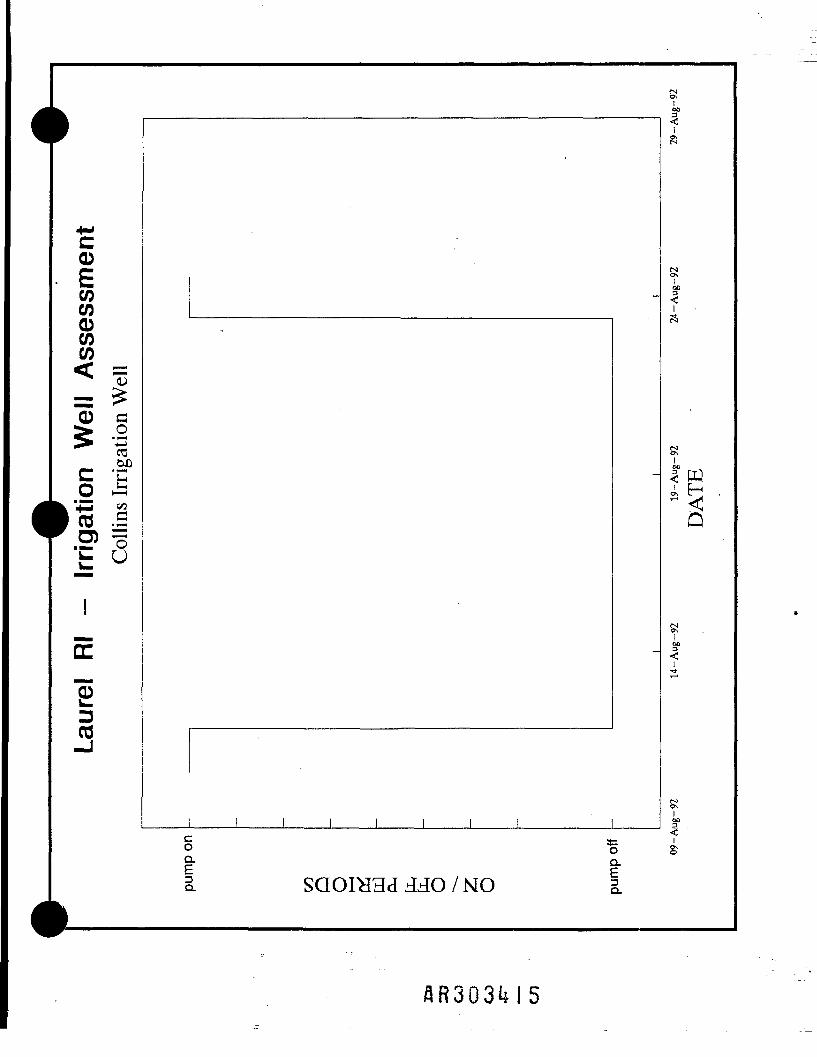
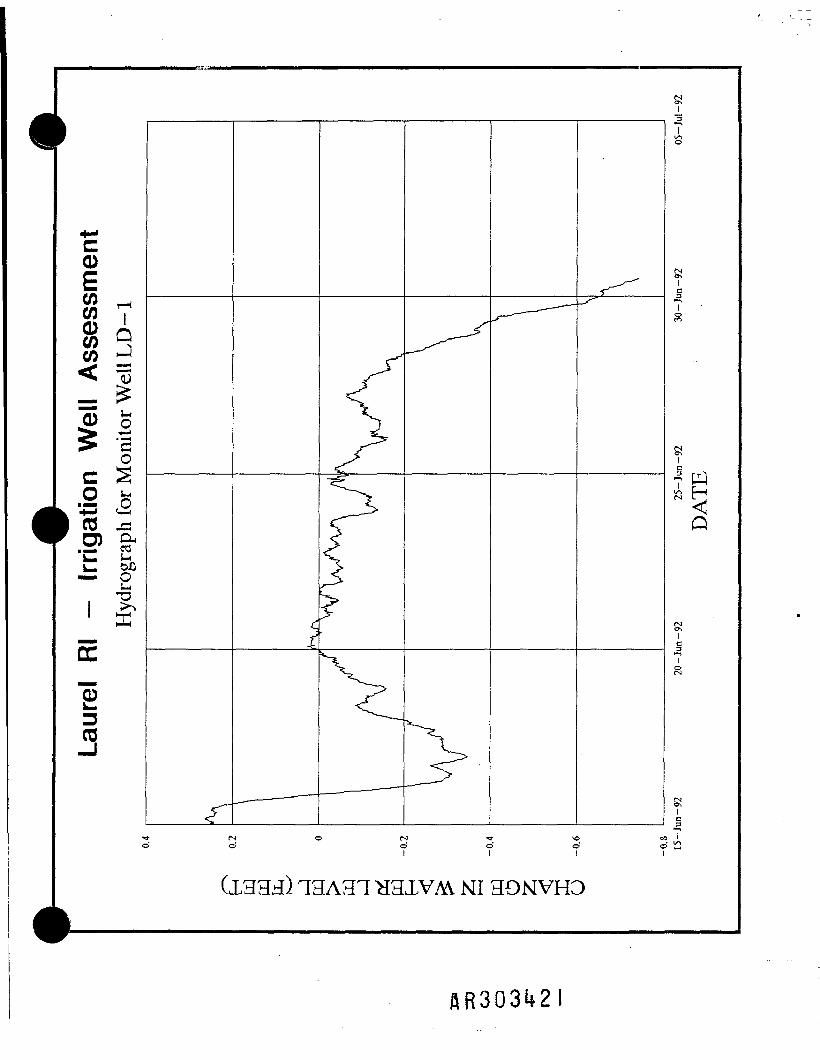
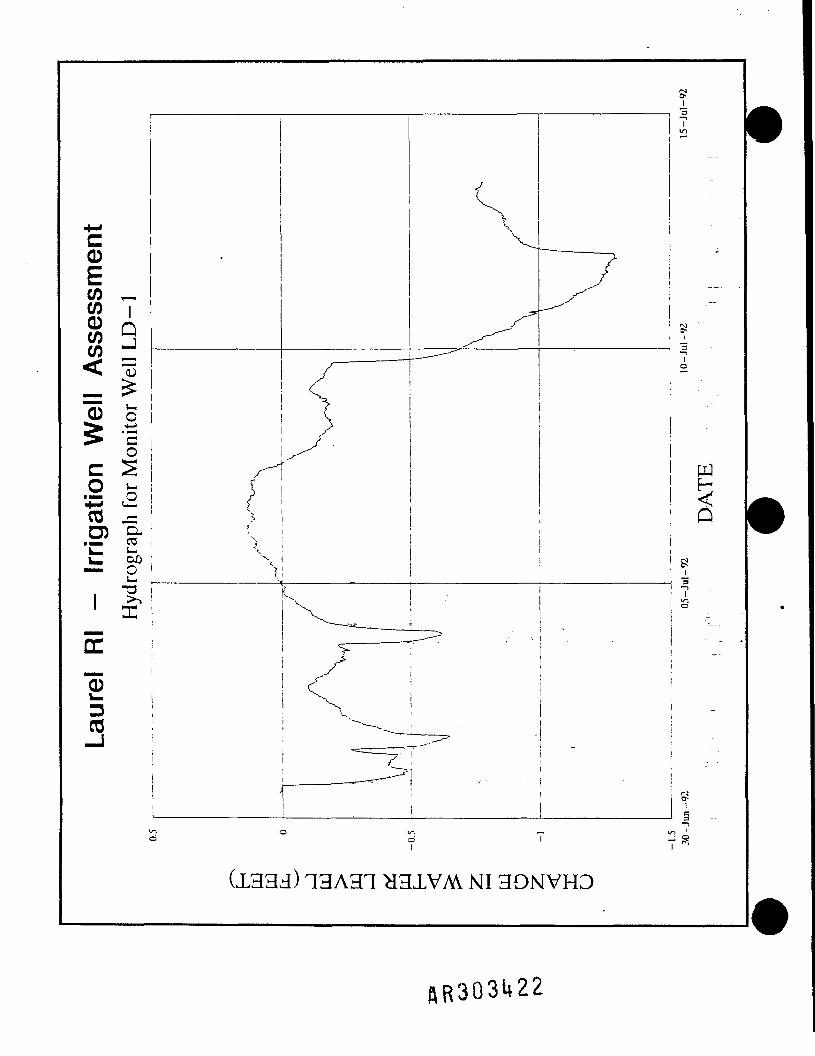
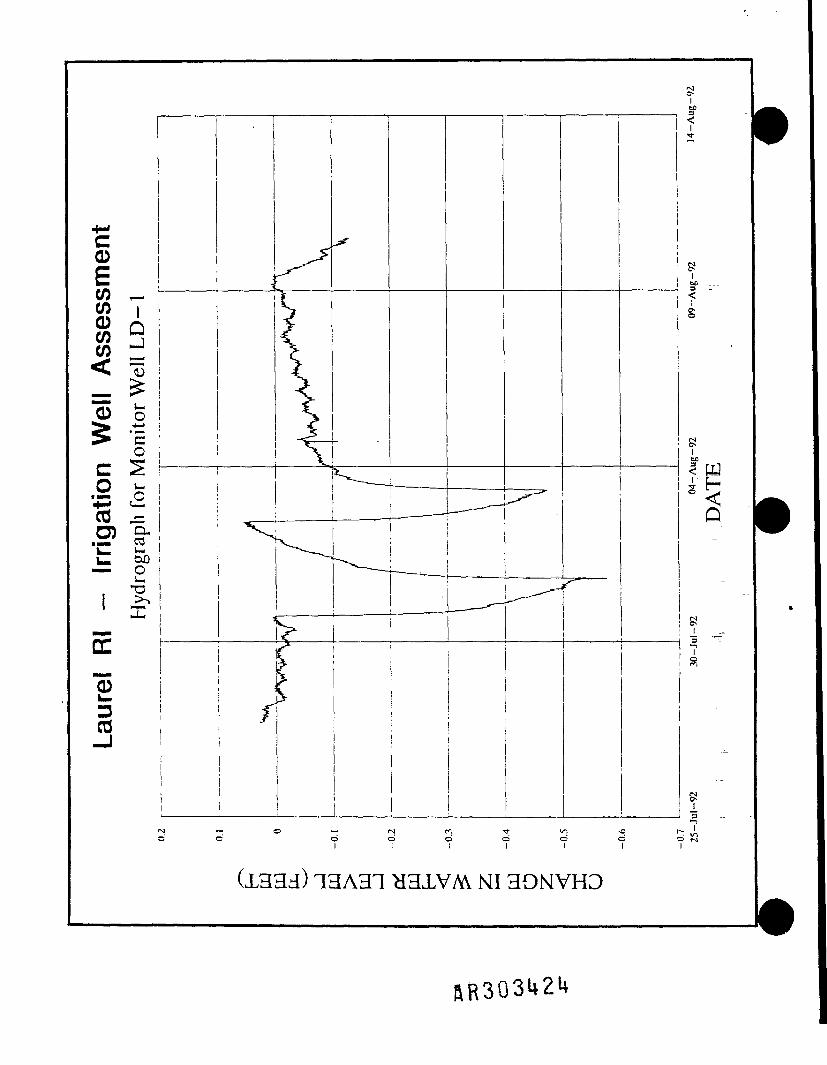
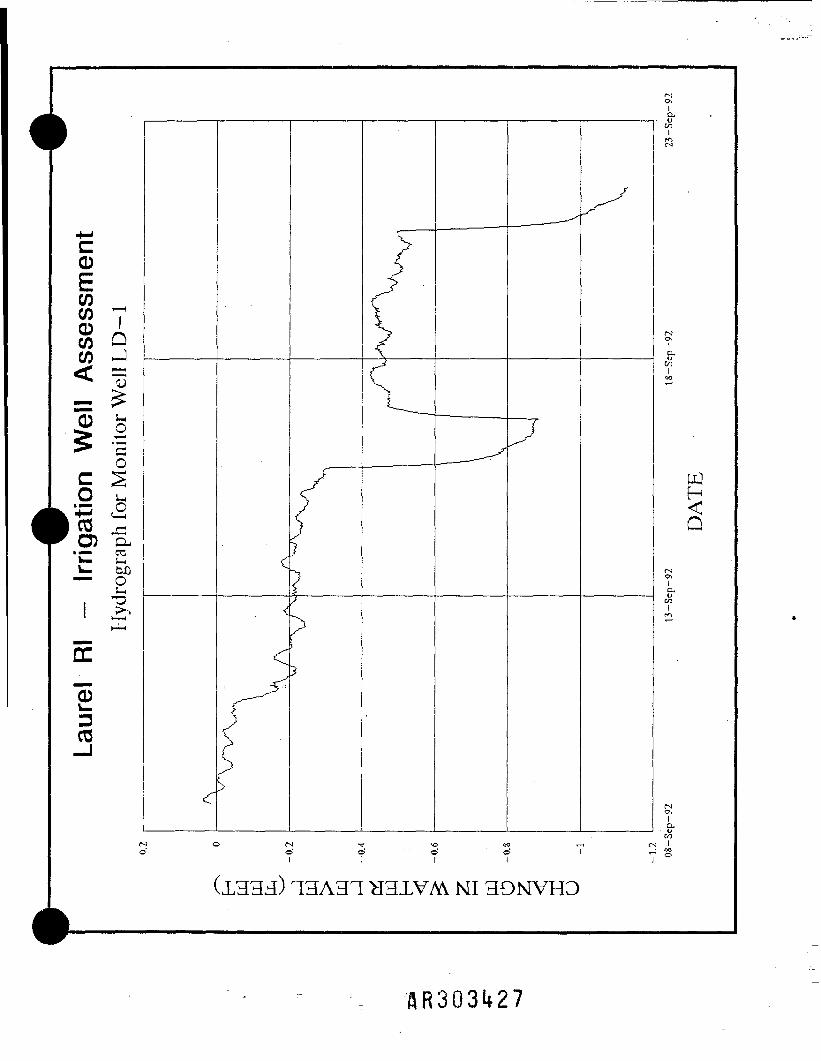
Irrigation Well Assessment
4R303399
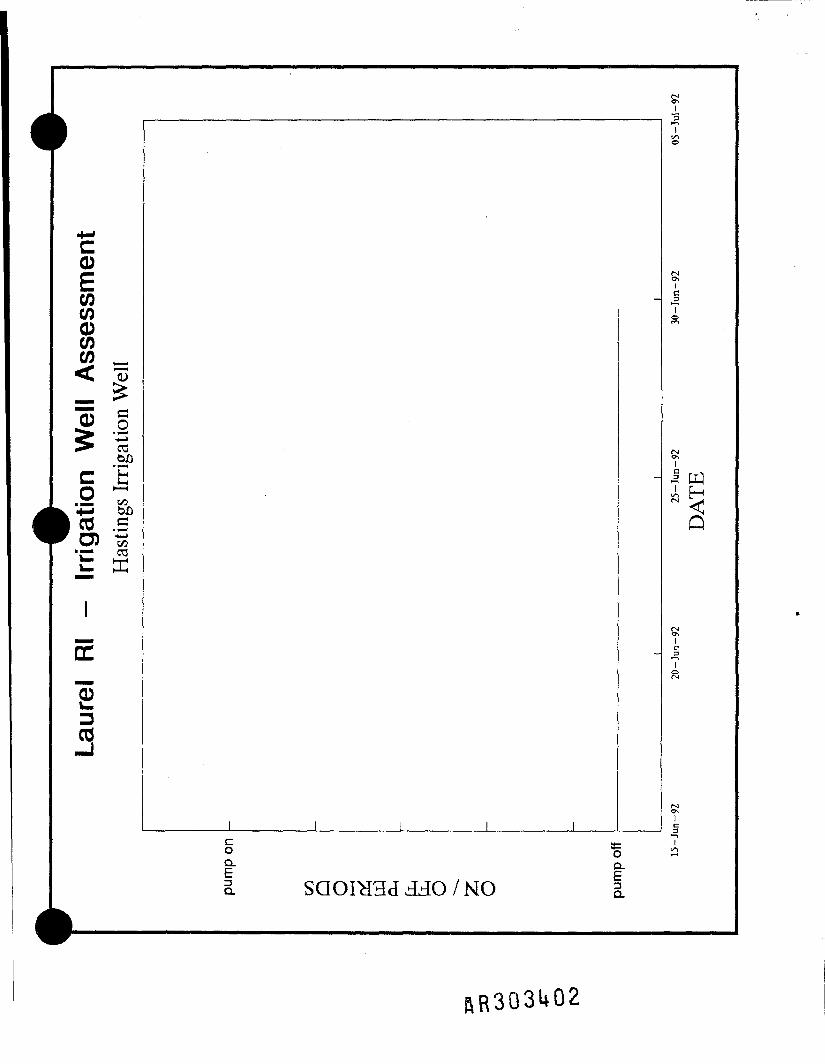
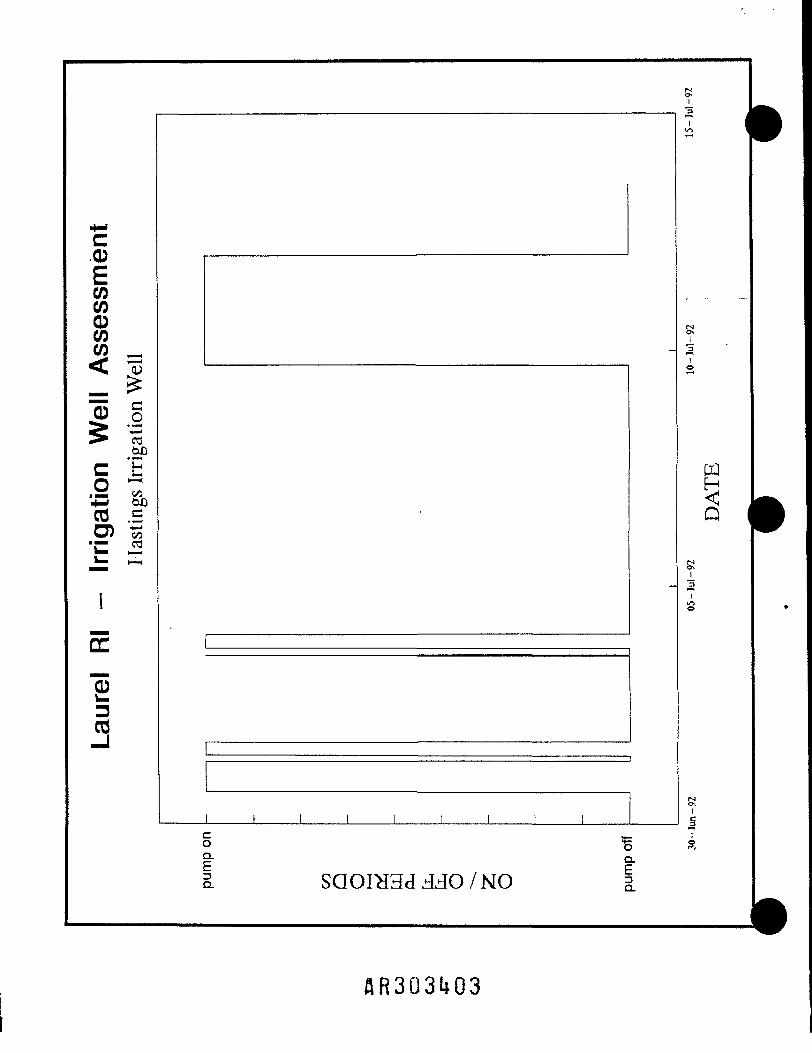
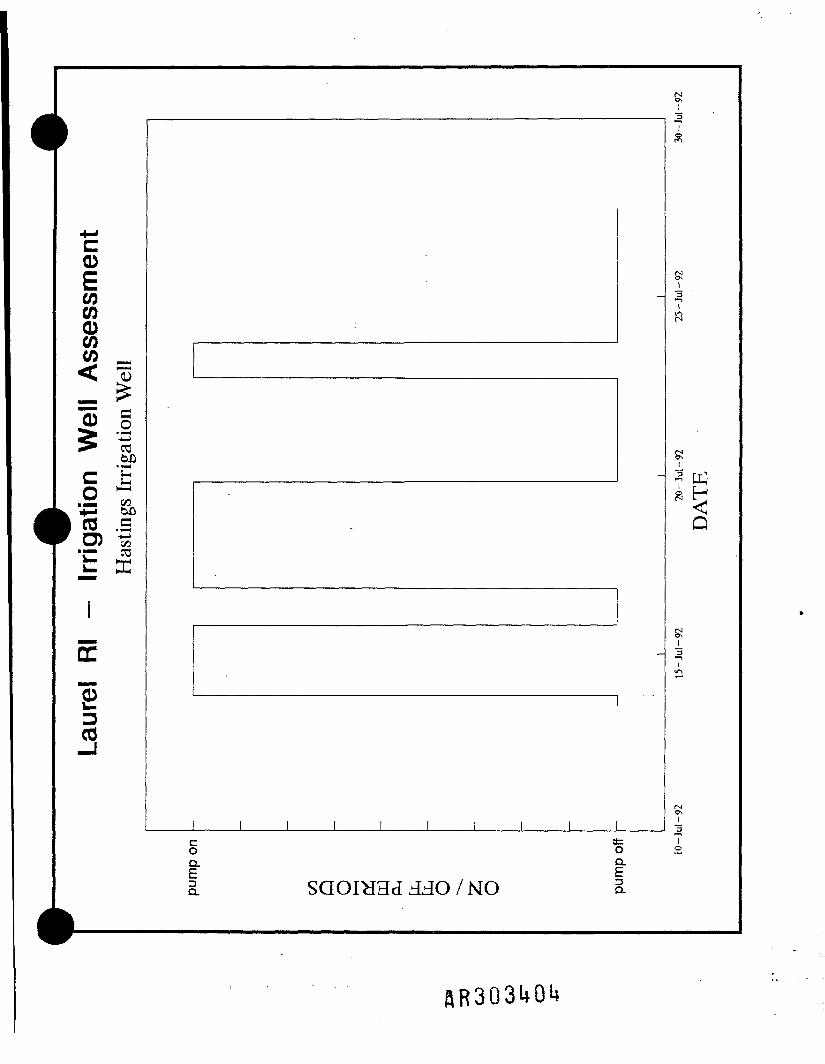
H.I Operational Periods of Irrigation Wells

Hastings Irrigation Well
HR303UOI
0COCO '0COCO _
0 ggcoc *
cd
Ec/s
03 .S
0303
s
Q
O 3=O
E |a SaOIH3d330/KO §.
.0COCO0COCO
0) §
Ui
W5
03 .SO) tS•r" 03
03
PJ
Q
C -_o *§E °-g. SaOIH3d330/NO I
AR303U03
iE
103
tsl
I
_-I
Q
J_____I___I___I___I___I___I___I___I '"3C 3= IO O S
I" EE. SdOIH3d 33O / NO S.
0
COCO0COCO rt
0 g
03 .£O) to
I
E"003
(SftICOaI
I00
§ 1E °-i. saoi>iad33o/NO I
0COCO0COCO
0D03
< q
i00
s
§ 'ga p"I SQOIHHd 33O / MO a
4-1c0ECOCO0COCO _< 13
"0 J.SPC'Cuo ~
"03 .<=?0) 3•j; 03^ DC
1E10L.D03_l
-
I i i i i i i i
-
enI
Q ko.00
8i00
O *= •*o (
AR3Q3U07

0 .
COCO0COCO _
= i11> 03t>JDc 'E.9 ~+* &JD03 .5O) £•r- 03t E
DC
"0
03
tnI
cn
*/ NO |
6R303U08
0COCO0COCO _< 13
50 g
M)
c 'E•B a"S .sO) £•r" 03
I
E
103
I I_____________i i
oI
8- w<5
0-.Ia.
Q.
Eg. SQOIHHd 330 / NO |
&R303U09

CoIIins Irrigation Well

1"
__
r
c0ECOCO0COCO^ ?
"55 g^ '•3
bfic -cO A
: '4= g1 ^ -5"C Ok_
1E
1D03—I
—
1 1 1 1
-
»-n1
i jO
1C3
1
•
fS
1
1 H
D
1c
1
fsl1C
o % Ic1- Q.: P1 SQOIH3J33O/NO 1.
d
- r r-——————————————————————
4-"
.0
ECOCO0COCO< s
"0 C> .2> •*->03— .2P.2 ~CO |"C (j)U.
1E"0D03-J
K
—
1 1 1 1 1 1 1 1
c ^o 1Q. ,E3 O /T /"~"\ T \T ' — T _T T T/* / IvT/' X •
i"3
1o
tlJH
.
< ^^
r8i
i8
r-i1c7
5 SX
5
•
*
ftR303UI2
0COCO0COCO= 10 c_o
03GJDc -c
O £'£5 </503 .S
O
DC
"003
PJ
j_____i
E
c0ECOCO0COCO
"33 c> '-~>
bDc -co ~eo .1.£? ?
1
DC"0303
-
-
-
i i i i i i i
i
i003
1
S
<NO
Itq•ii3 -
I
I3
§. §.
0COCO0COCO^ ==
o
D03
0 e
C 'C2 ~3 5/203 .S
I
Q
<I
S!J____I____\_____I____I_____I____I____I I____I

0
COCO0COCO< |g"0
ODc -coO J - <
DC
"0D03
<03 .5O5 E
J_________I I I_________L
I8-toIm
Io<uenI
H
8
a
°s.

I T
[4-1
. 0
ECOCO0COCOf ^ 4
s"0 c^ 2
OJOC H1 0 ^
I'ro Ir o^ *o"E u™
iE
1
-
_
i i i i i
C/l1
^11"1«
PJ
f— 1.^
Q
i8-C/31
1Q-C/]
C ftz 10 0 §Q. Q.
1 SQOIH3d330/NO 1
ftR303M7

0COCO0COCO
c -cO A• 3 5203 ^
DC
"5303
Q
ia
Eg.

H.2 Monitor Well Hydrographs
ftR303M9

Monitor Well LD-1
8
DC
103
a
Q
(1333) 13A31HHXVAV NI HONVH3
0ECOCO0COw ^
0
c,gO)
D03
(X33d) 1HAH1 ilHXVM NI 3ONVHD
flR303U22

0
I T« S(/) J_
0
03
0 g^ •-> coC S.2 &4-4 <4-l
03 J2
OUi
I10(S
H<Q
IO
NI 39NVHD
AR303U23
0COCO0COCO<0
co'•§o>
0D03
(1333) 13A31 H31VAY NI 3ONVHD
&R3Q3U21*

I00
DC
"33
03
IXJ-tsl
I00iS!i
1 2(1333) 13AH1H31VAY NI 3ONVHO

0
I 78 SCO J
0 o§ 5
Oc 2
8-2
DC
D03
2.
(SI&IO.
(X333) 1HA31H3XVM NI H9NVHO
AR303i*26
0D03
HQ
on(N I
1HAH1 tfHXVM NI H9NVH3
AR303i*27

—i —
0coCO V0 Ico QCO J
o§ *I-O) Cu•r- 03
oc0303
rs»>IoO
I
Q
IQ.£i
1HA31H3XVM NI 39NVH3

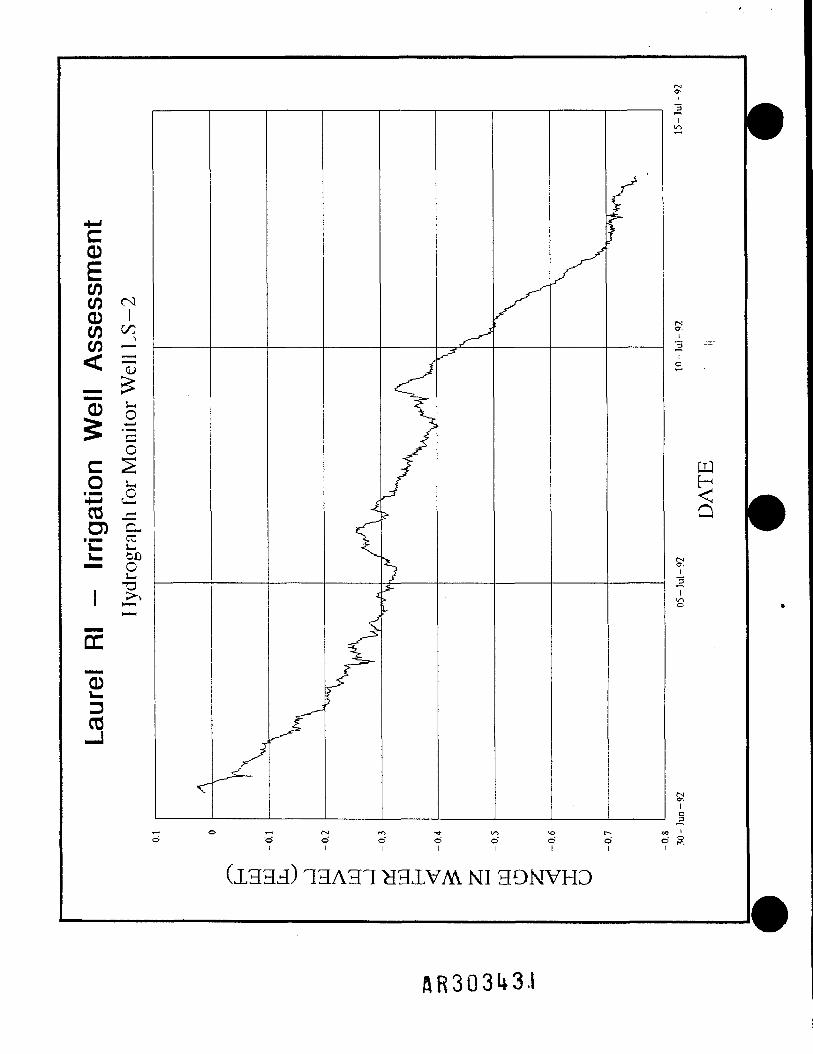
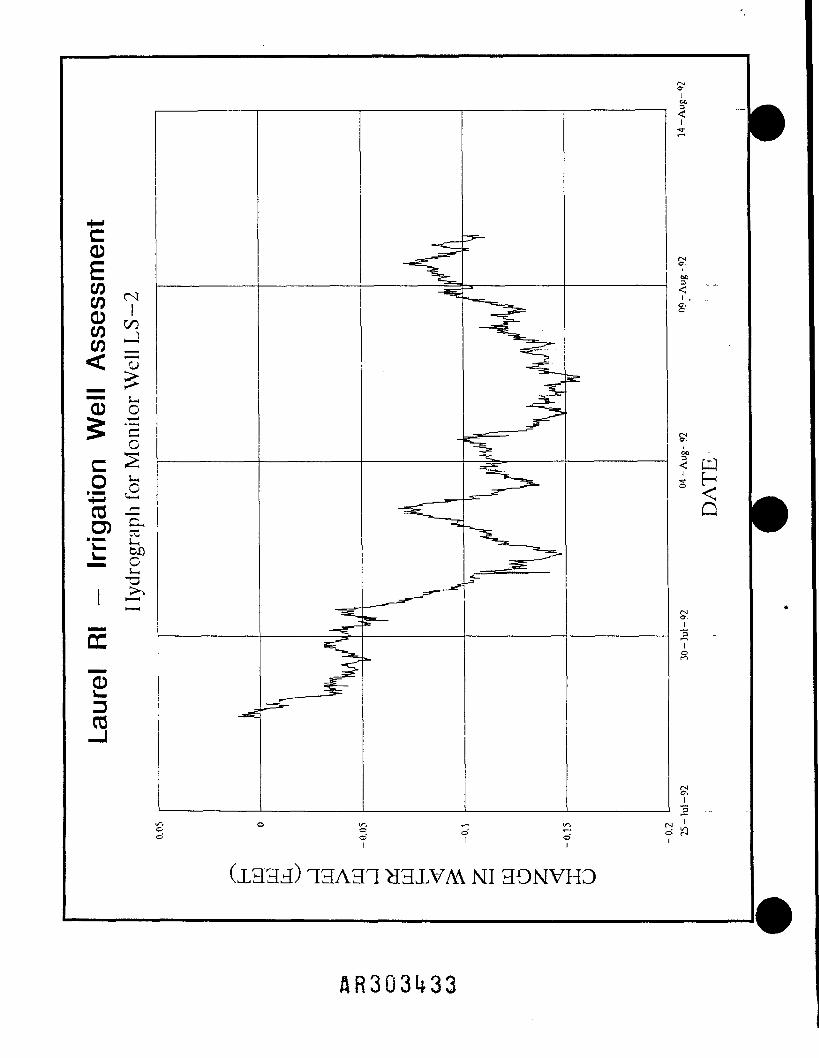
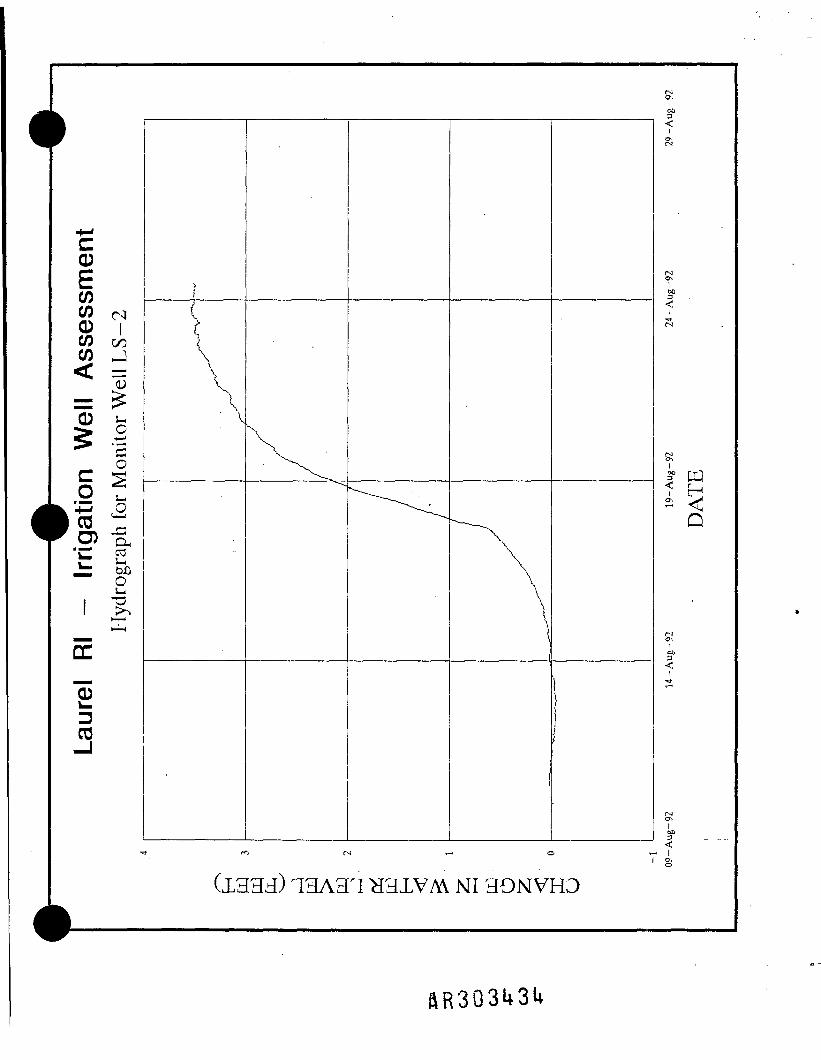
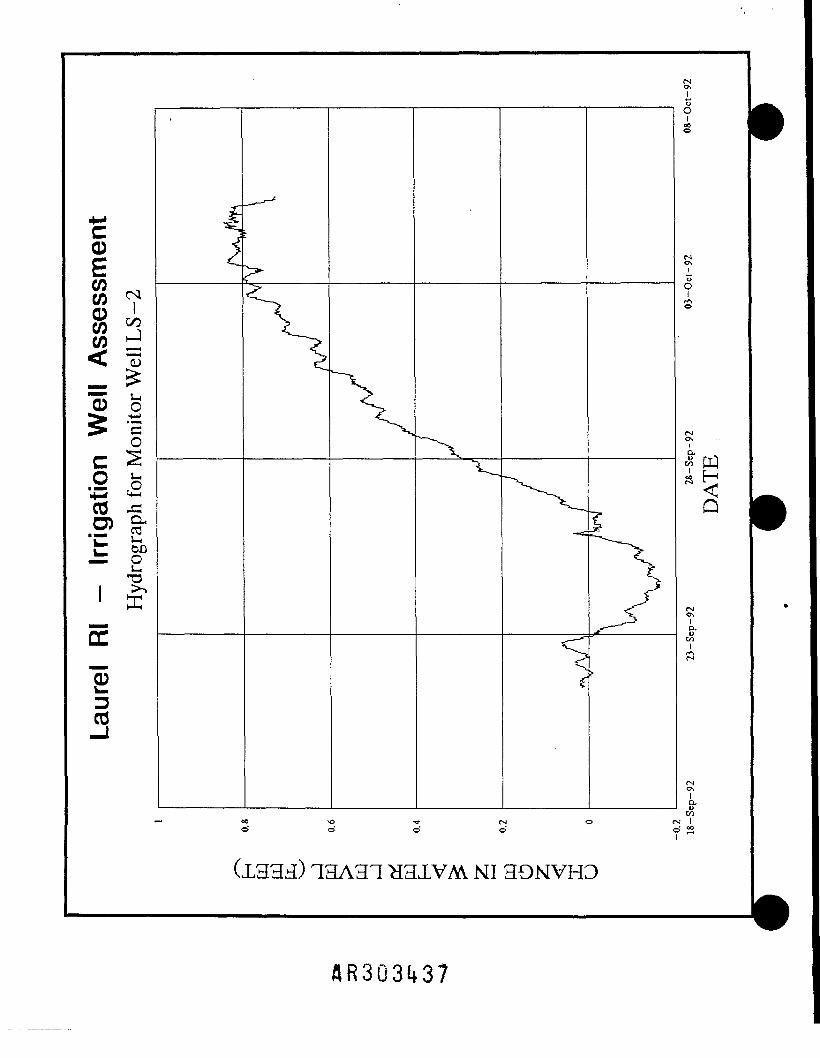
Monitor Well LS-2

D03
sIn
r-J rl -rj- to Io o o o" 2I I I I
13AH1H3XVM NI 39NVH3
flR303lf30
Q
(X333) 1HAH1 EHJLVAV NI H9NVHO
flR303U3,i

c0
COCO0COCO
iicC SO u
03 ^
•s? IJ— too— O
S-4
DC
|03
Q
i3
Io
13A31H3XVM NI 39NVH3
Q
(XHH3) 13A31H3XVM NI H9NVH3
AR3Q3l*33
DC
"0
03
3
1
t%Q
(XH33) 13A31H3XVM NI H9NVHD

c0COCO0COCO
5 1o
.2 b03 S
tooO
£•503
J:^<^
1a,
Q
••* l/"> \Oo o oI I I
(X333) 1HAHT HHXVM NI 39NVHO

0COCO <xi0 ICO &co J< =5
Ioc-03UttoCOU"O
DC
"0
03
Q
o oI I
13AHT H3XVM NI H9NVH3
—i —
0
i
03 o5 -s
DC
£D03
O
o £
Ift feb±= o
<
0>£ooI
o>IIX
Q
enI
ia.
(X3H3) 13A31HHXVM NI 39NVHO
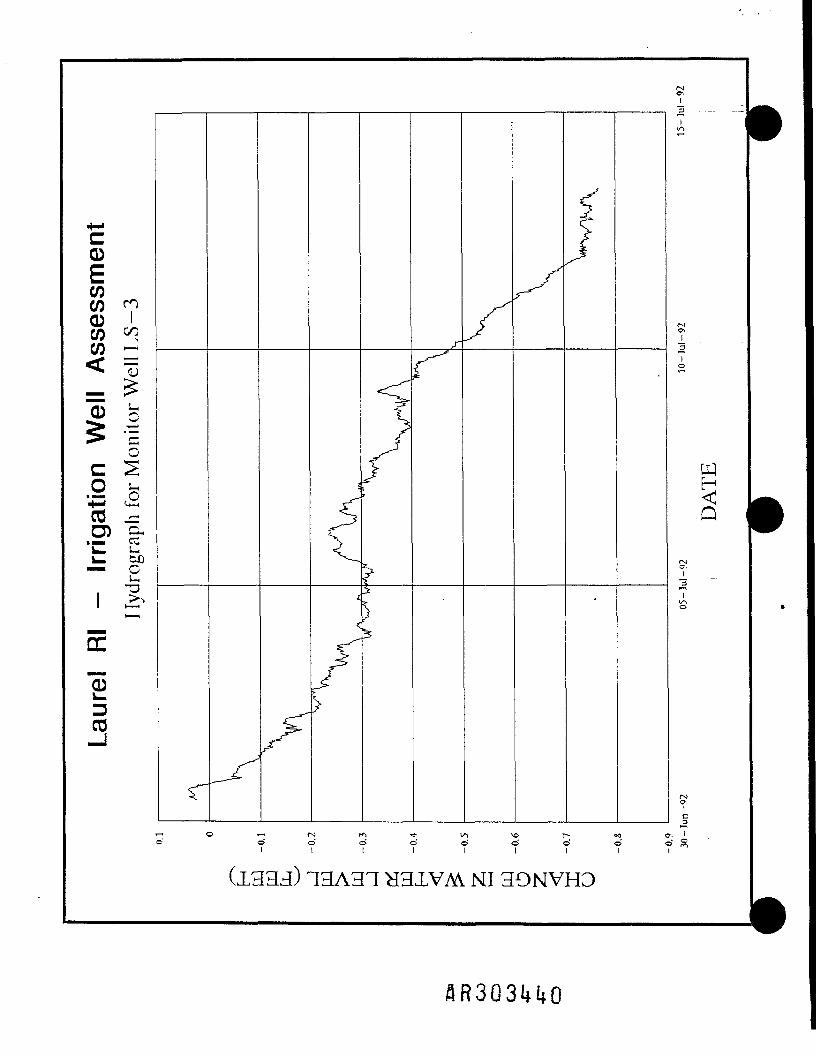
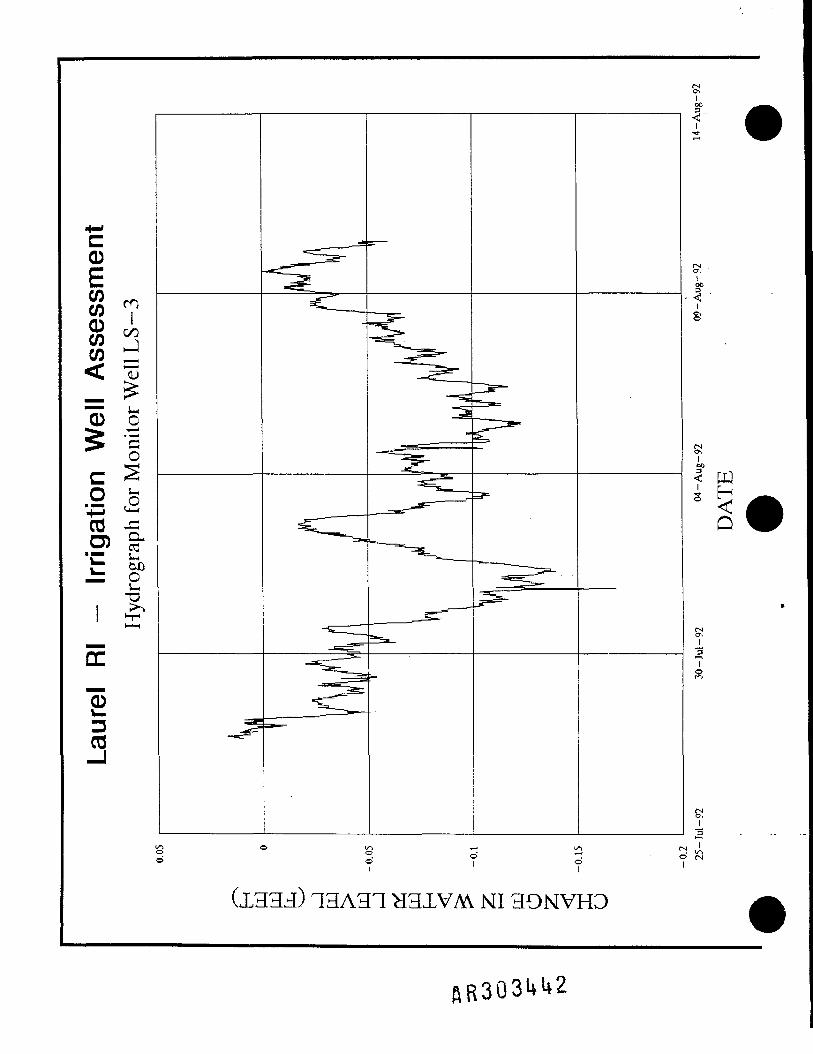
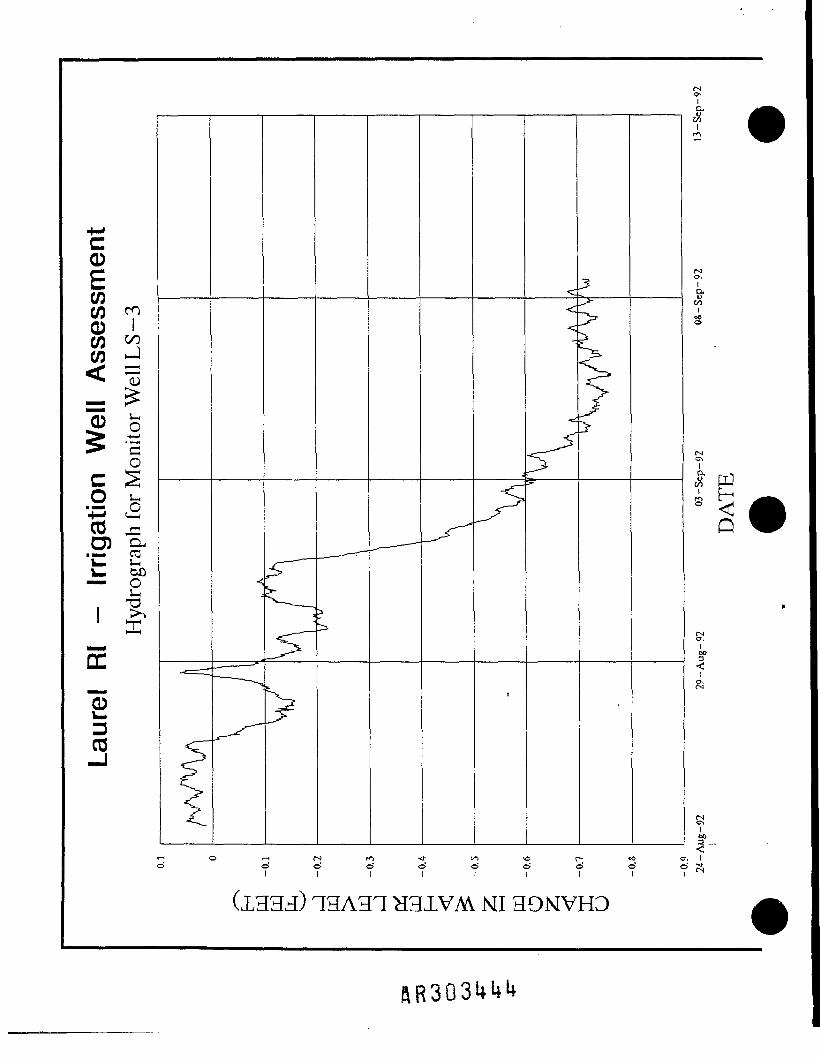
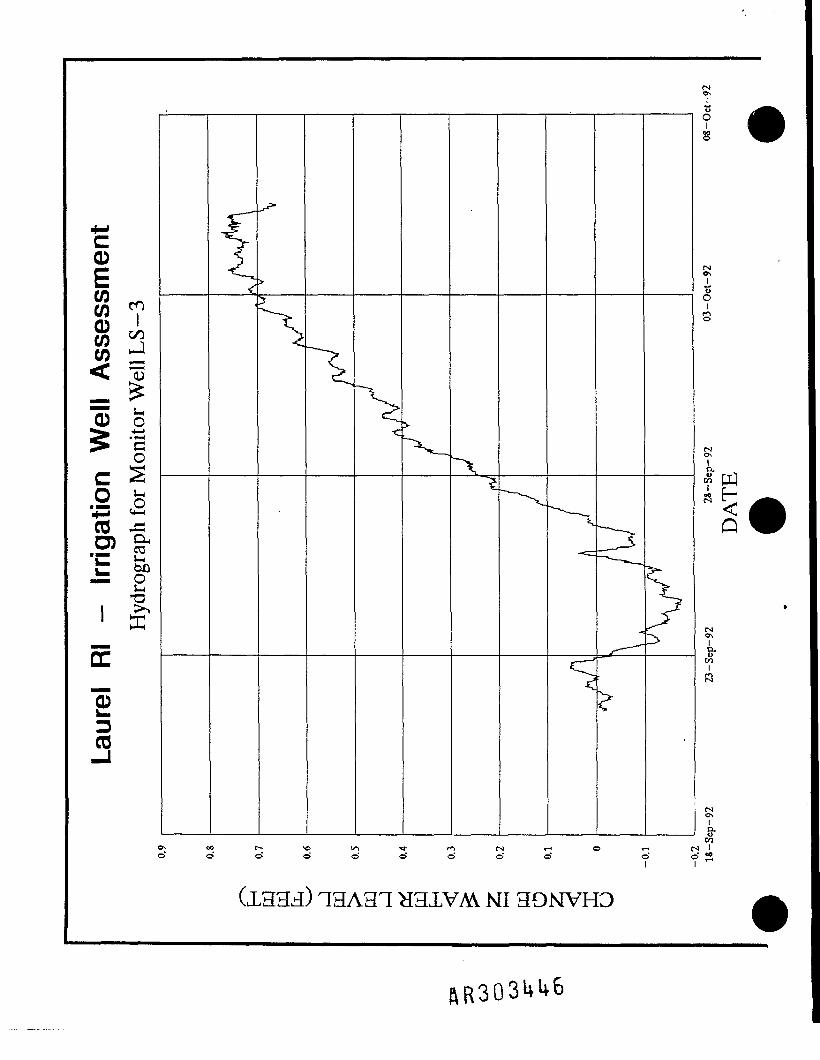
Monitor Well LS-3
ftR303U38

0
COCO0COCO
i I^ E
OZtooOu
£D03
13AHT HHXVM NI 39NVHD
0
COco0COCO
oC S.2 s4-* '—03 .=O) o-• ••• ck_ Ui_ too— O
DC
"0
03
b
S!i
H<Q
o o o o o oI I I I I I
13A31H3XVM NI 39NVH3

Q
(X333) 33A31H3XVAV NI 39NVHO
0
i 78 2co d
0 o
C •£-2 £4-« ^03 ^
•= Ii ou"OI >-.
DC
"0
03
(X333) 13A31H3XVM NI 39NVH3

0£)
c0COCO coCD ICO co
coi-Ho
.0) UE 2.= too
Oi-lI "°i >->_ ffiDC
"0D03
i00
(X333) 13A3T H3XVAV NI 39NVH3
o-Ia.
0
COCO rn0 ICO coCO J
0cO
C SO u4= £03 43O) o-••» 03L. Uu. too
DC
"0D03
<£.Os
ir
(NON
I
3°
00
"0 0 0 0 * 0 0 o 'I I I I I I I
(X333) 13A31H3XVAV NI 39NVH3

k0coCO *?0 ICO coCO J
• coC S
UiO
g-utooO
TH-i
DC
"0
03
0•s s 'JD ~ -
PJ
Q
o o o o o oI I I . I I I
(X333) 33A31 H3XVAV NI 39NVH3
0
„
D03
rtS IW 3co d
0 o
c O g'% i.CL,
03
:\
(X333) 33A31H3XVM NI 39NVHD
II
frCOI
tnf-j r-^ O T-J CS Io o d c> JJ
I I
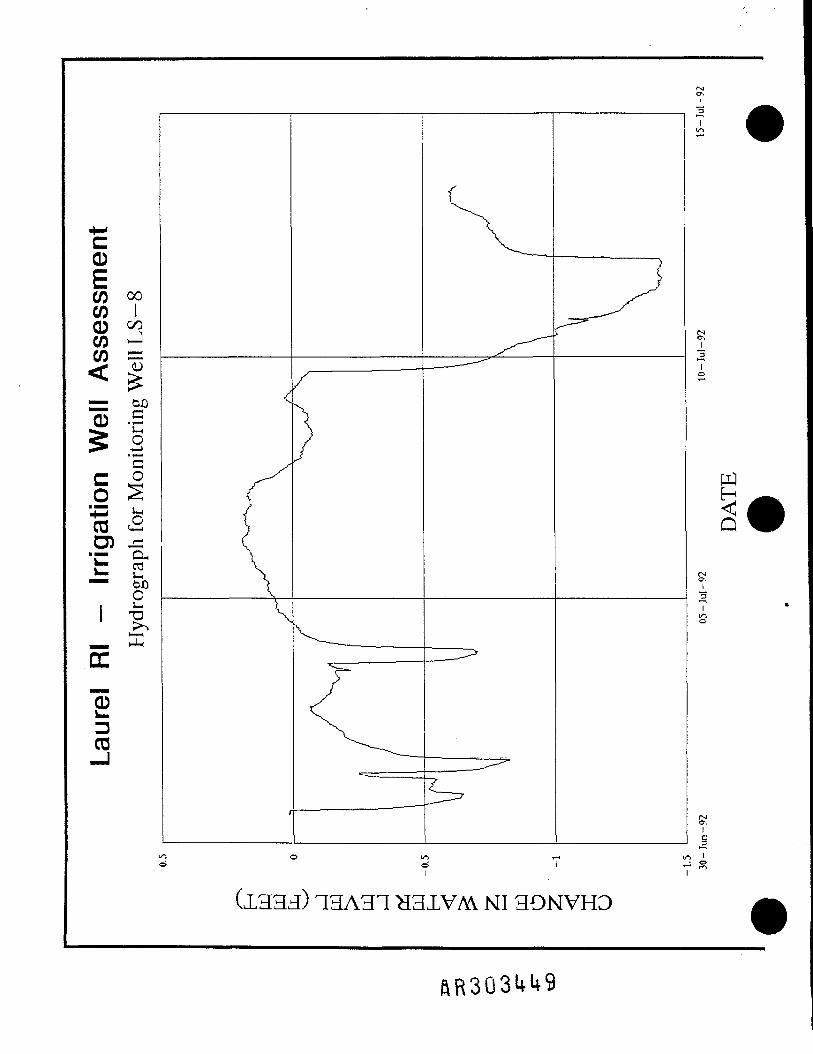
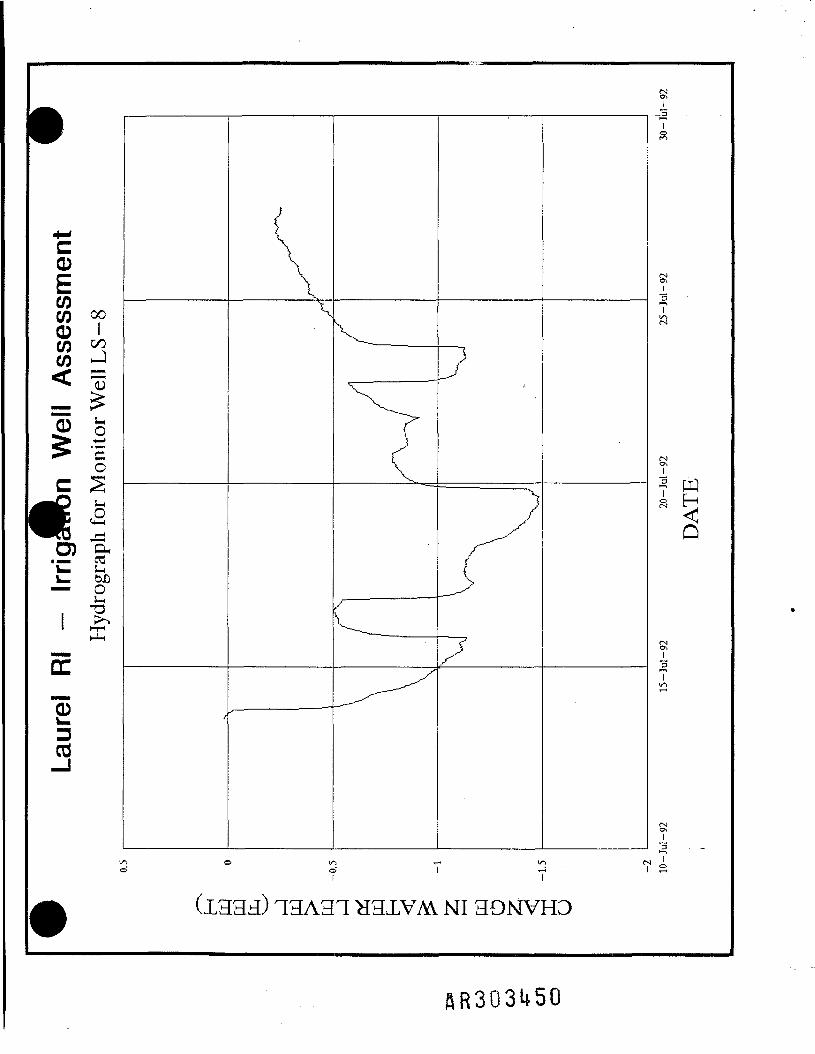
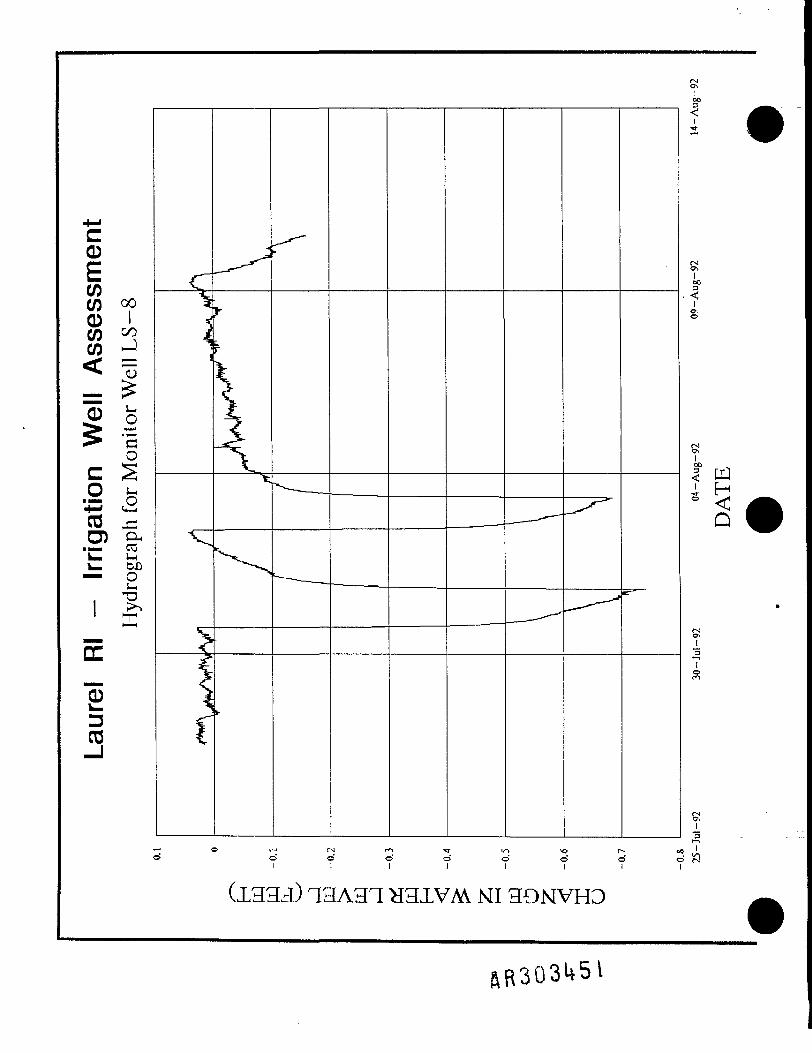
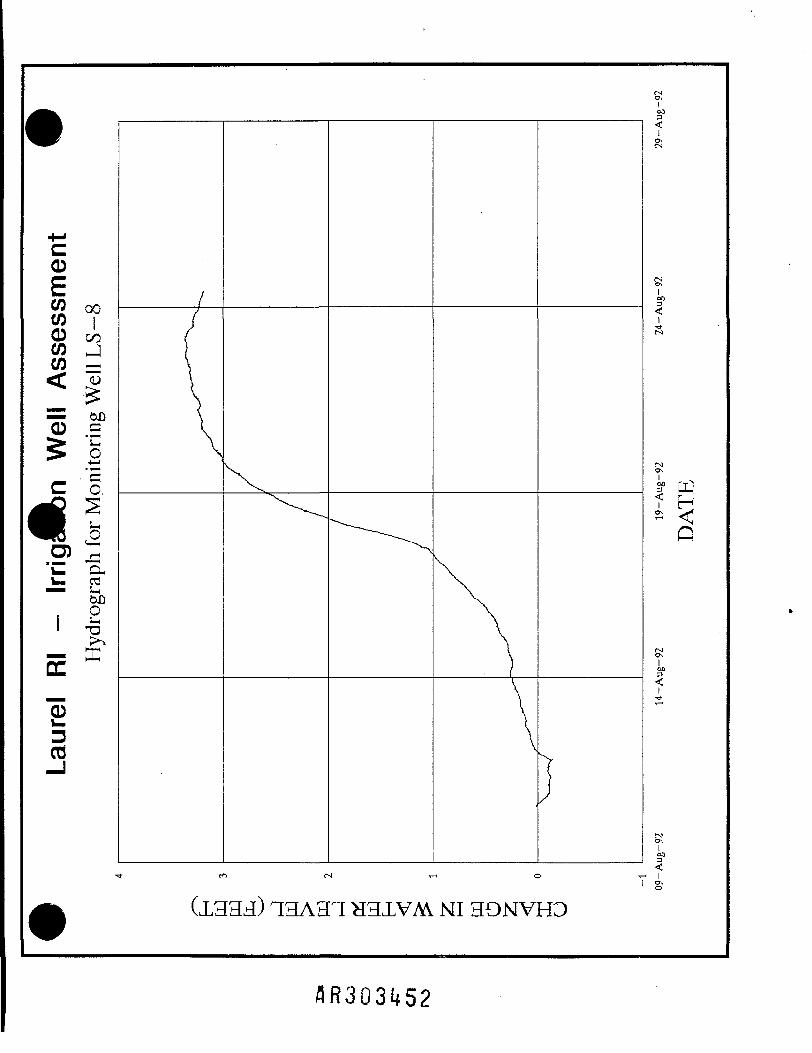
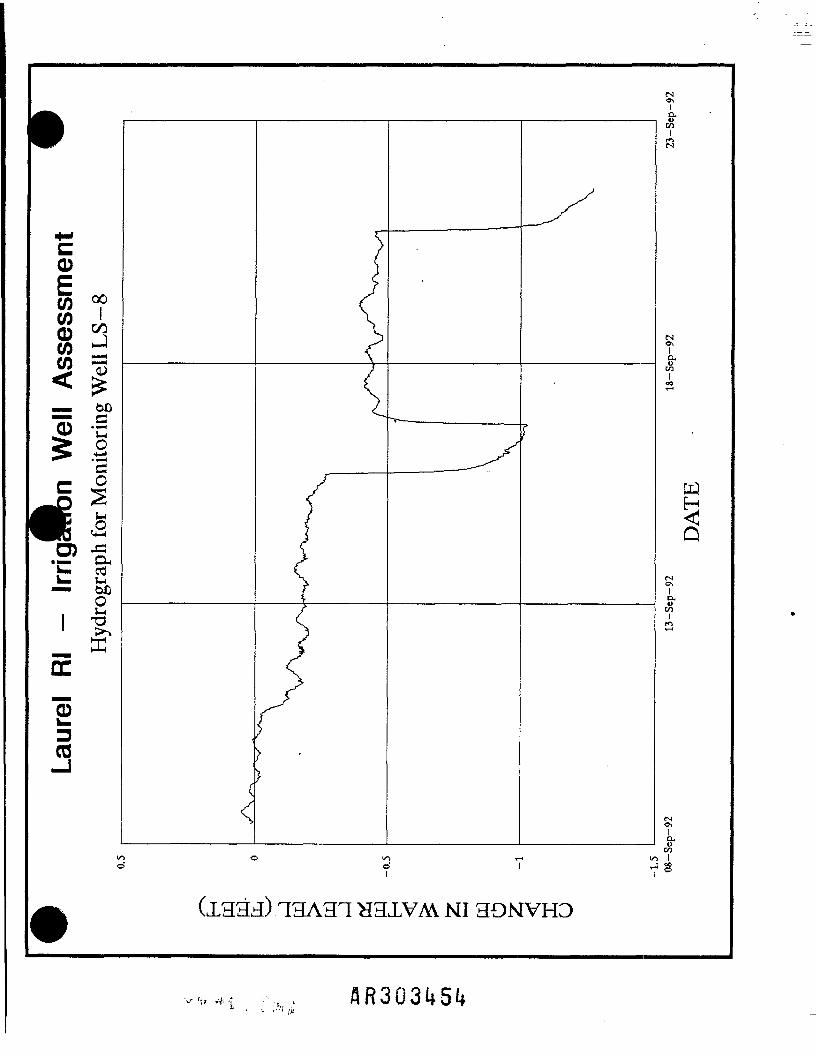
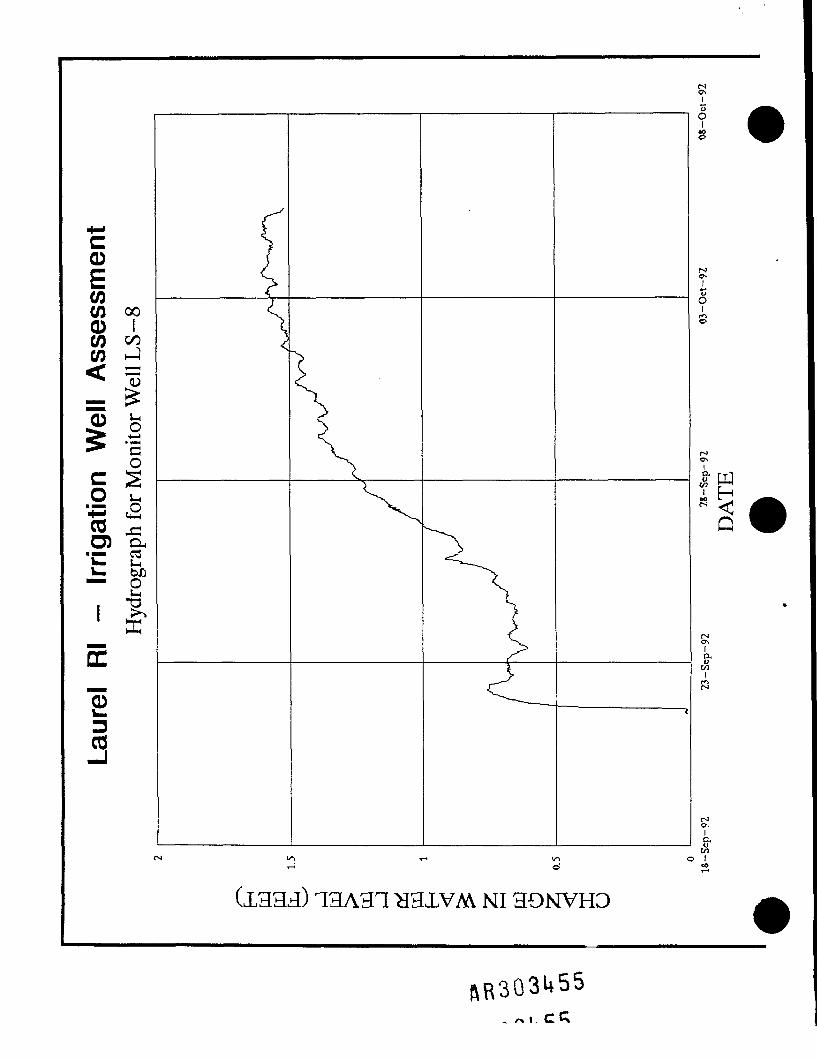
Monitor Well LS-8
AR303H7

£D03
f PJ
ID
(X33d) 13A31H3XVM NI 39NVH3
0CO ooCO I0 coCO ^a I-— toO0 .S5 5 — 1
2
O) -=•r- o-r- 03• IM~™ toO
O
DC
"53D03
(X333) 13A31H3XVM NI 39NVHO
k0
COCO op0 ICO coCO ^< =5
003
tooO
3ItA
S_3
Q
_ _ar—VIIO
(X333) 33A31H3XVAV NI 39NVHO
c0COCO op0 ICO coCO J
0
CGO
03 4=D) o-•c 2V. toO•— O
DC
"5303
1S
PJn
8i3
OiJl_3
r i - 10 vo r ooO O O O O OI I I I I I
13A31H3IVM NI 3ONVHO
I00
0CO ooCO i0 coCO JCO —
— toO0 .S
o,
0)u. c-V- 03
febo
£D03
i003 PJ
s <Q
SP
i00
A1 s
(X333) 13A3T H3XVM NI 39NVH3

0ECO ooCO I0 coCO »-}
toOeCD .£o• ?—4
C
03 £O) ,c•J3 CX
"™ toOOi >-i
£D03
I-
\ften
t PJ
Q
sii00
<ri
(X333) 13A31H3XVAV NI 39NVH3
flR303if53
k01 °pco 'CO ^7* ""I< "—i too3 r5 2
03toilo
0D03
tsON1
enI
PJ
IIa.ocoI
tsONICL,
IO 1-1 lo IO I r-5 %.
(X333) 33A31 3XVAV NI 39NVH3
V '>,» »J: •?t
C0COCO co0 ICO coCO •-}<
• Coc 2O U,
SCHH
03
ONI
I
ONI
II
r-JI
Q
ON
frcnI
ONI8-CO
o I
(X333) 13A31 H31VM. NI 3ONVHO
SR303U55
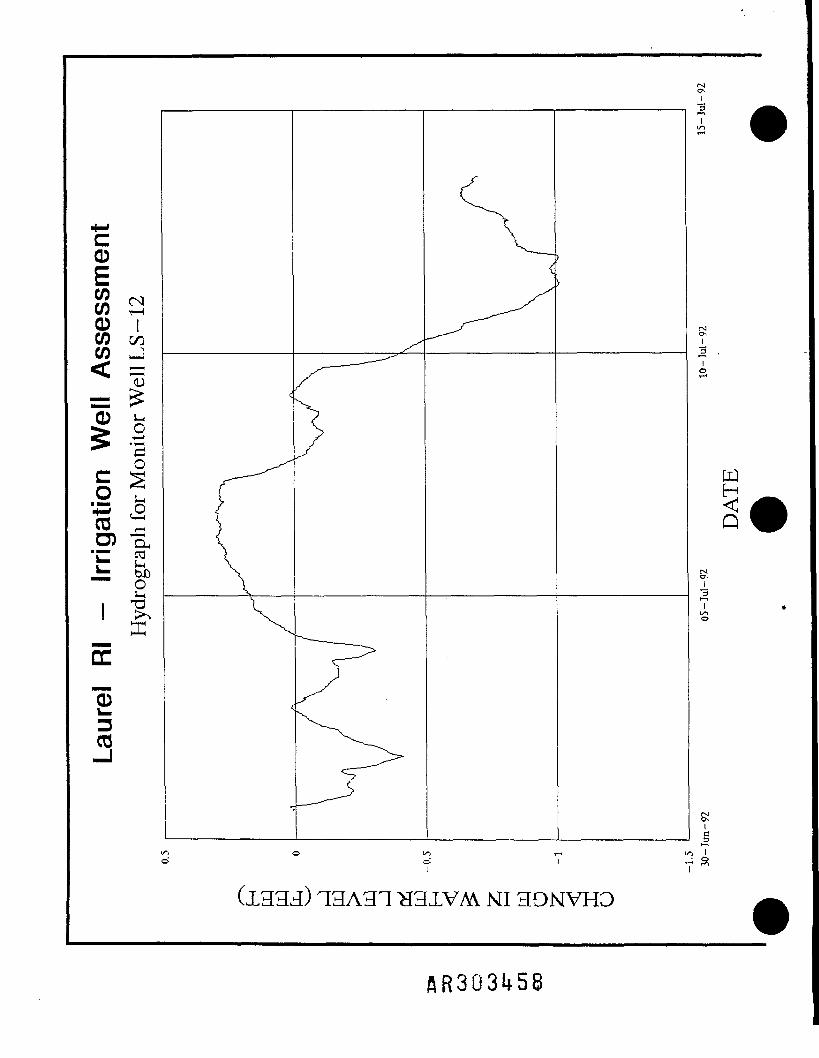
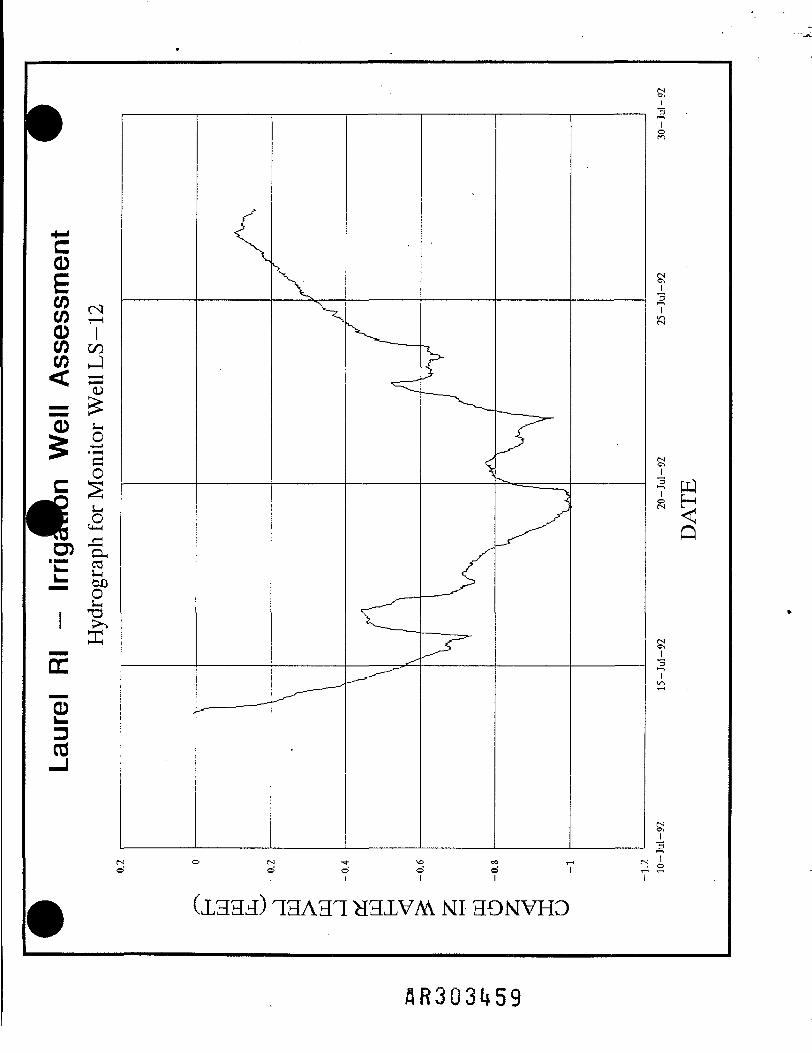
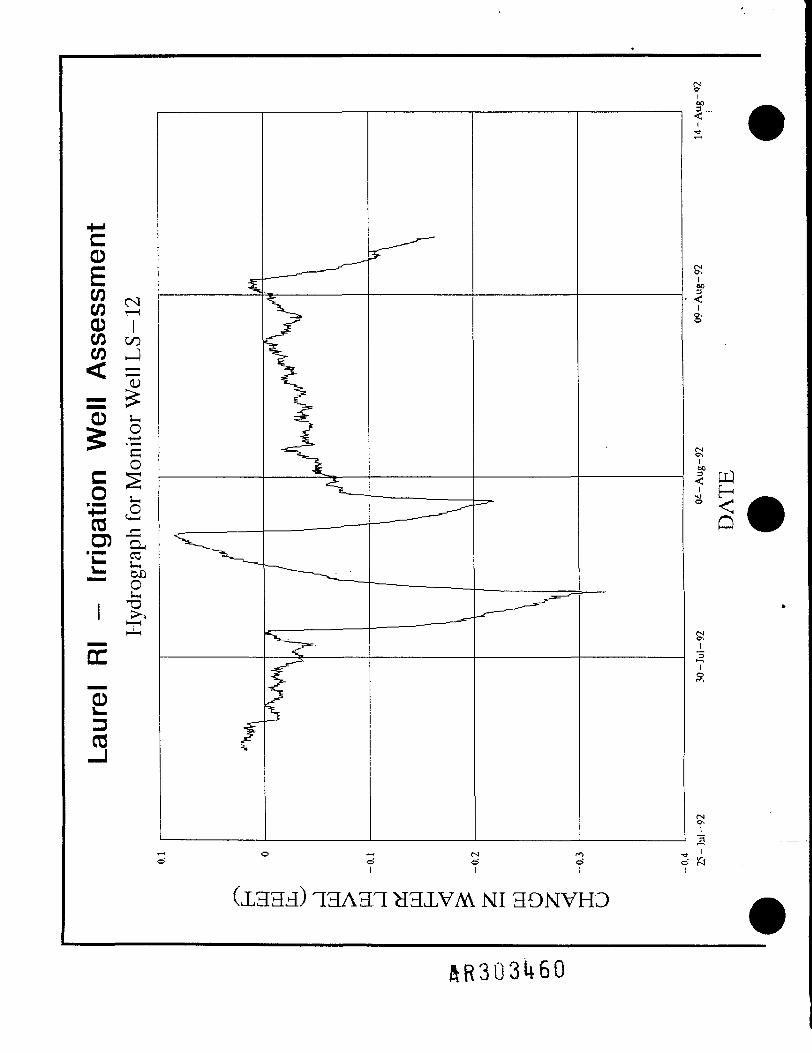
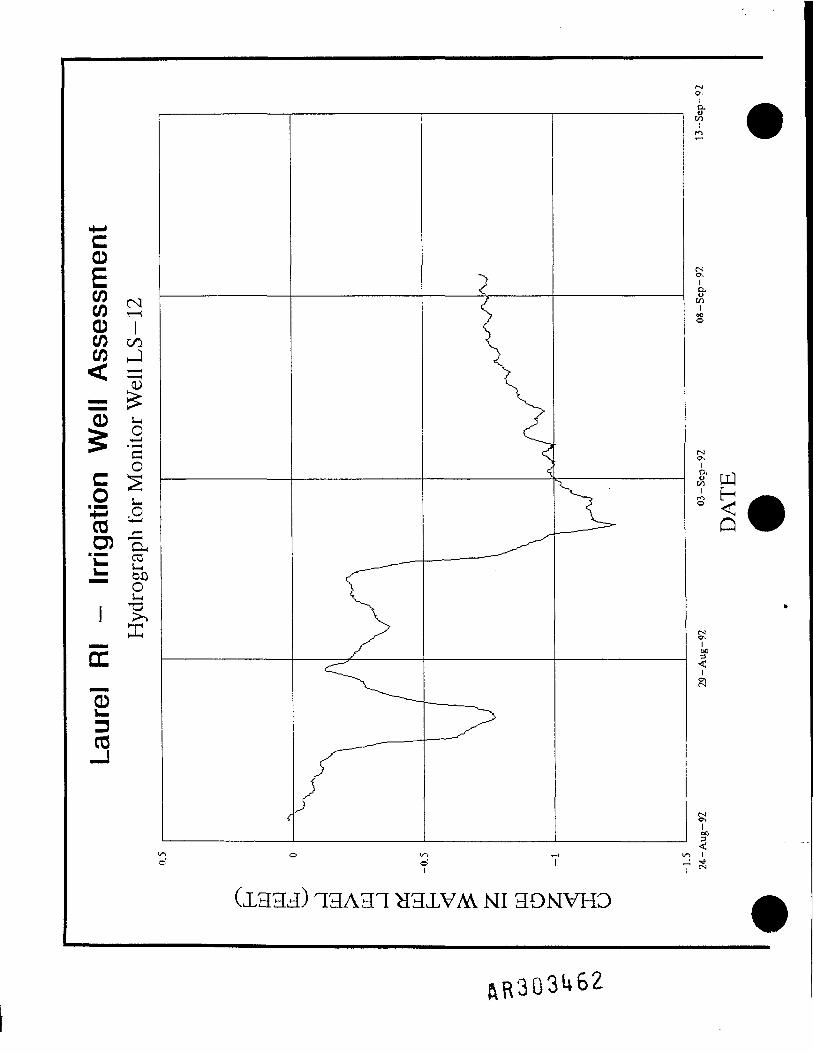
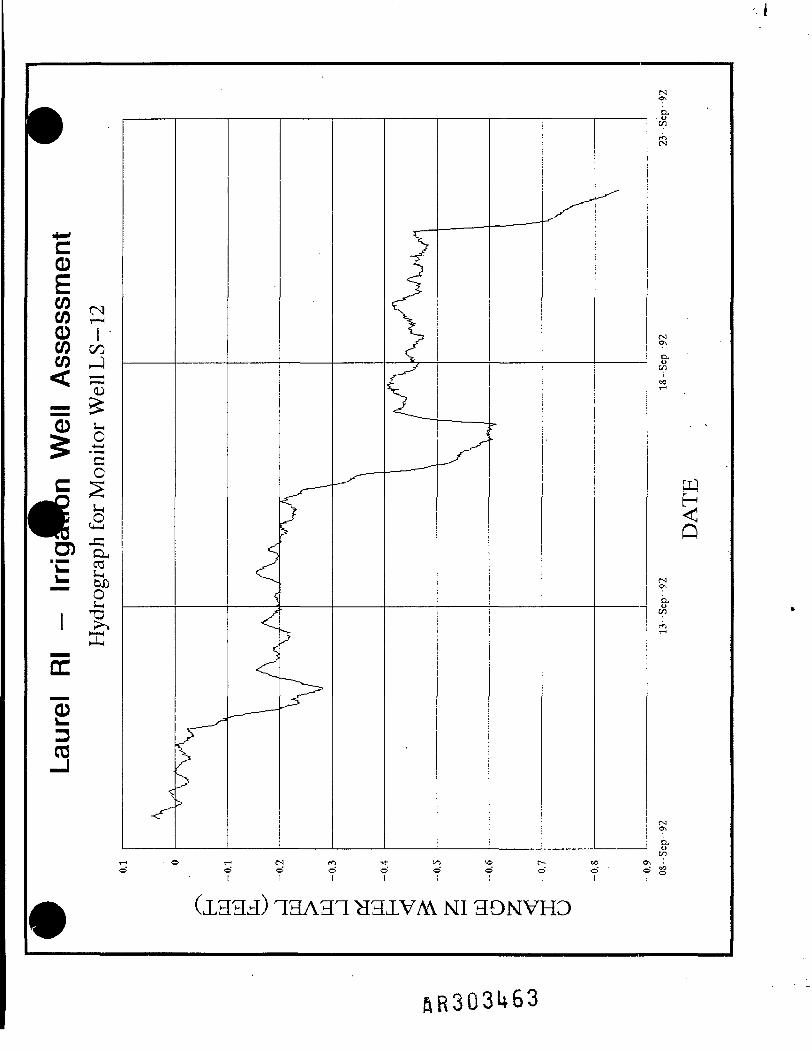
Monitor Well LS-12

—I——
0CO cS(CO TH0 ICO coCO ^<
coJ-i.O
,_ 03^ *-"»- toO"" O
03
a 5Q
<
IS
ic3
SiIc
(S •**• *& oo I-Hd o d o' I 12
I I I I
(X333) 33A31 H3XVM NI 39NVH3
AR303U57
0
I s0 ICO coCO J
03O5
.o
4= ,P
*wtooO
I r- •
—— ^
DC
"5303
_3IO
PJ
Q
S!i3
8!ic
1O I
(X333) 13A3T H3XVM NI 39NVH3
k0
i0COCO
JUoS-iO
'E 2— tooO
£D03
(NON
I
_i_3*I
S
I
o'I
(X333) 33A31 H3XVM NI 39NVH3
(X333) 13A31H3XVM NI 39NVH3
&R3Q3U60

k0COCO CO0 7co 2< —
0
c
€1
£D03
coUi
O) UM03UtoDO
!nHM
PJ
5Q
I00
00I(X333) 13A31H3XVM NI 39NVH3
0w r<iCO S0 ICO coCO J
03
DC
"003
co£
.0
Mo
COI
tsON
IG.OCOI
ft mco I-Mj. H* <Q
00
(/"> -r-< 1/1 I
f ' 7s
(X333) 13A31 >I3XVM NI 39NVH3
&R303U62
k0
i 0 iCO co
DC
£D03
S-4O
toOO
r--d
I
(X333) 13A31H3XVAV NI 39NVH3

0to ^8 7CO C/D3^0 IM
O
<= IO t4= £03 \"O) •§,'E 2JZ toO
OV-i
I ^I * ""l
*T|MH
£D03
d
<NONI
Q
ON
8-COI
8-CO
O
(X333) 13A31H3XVM NI 39NVH3

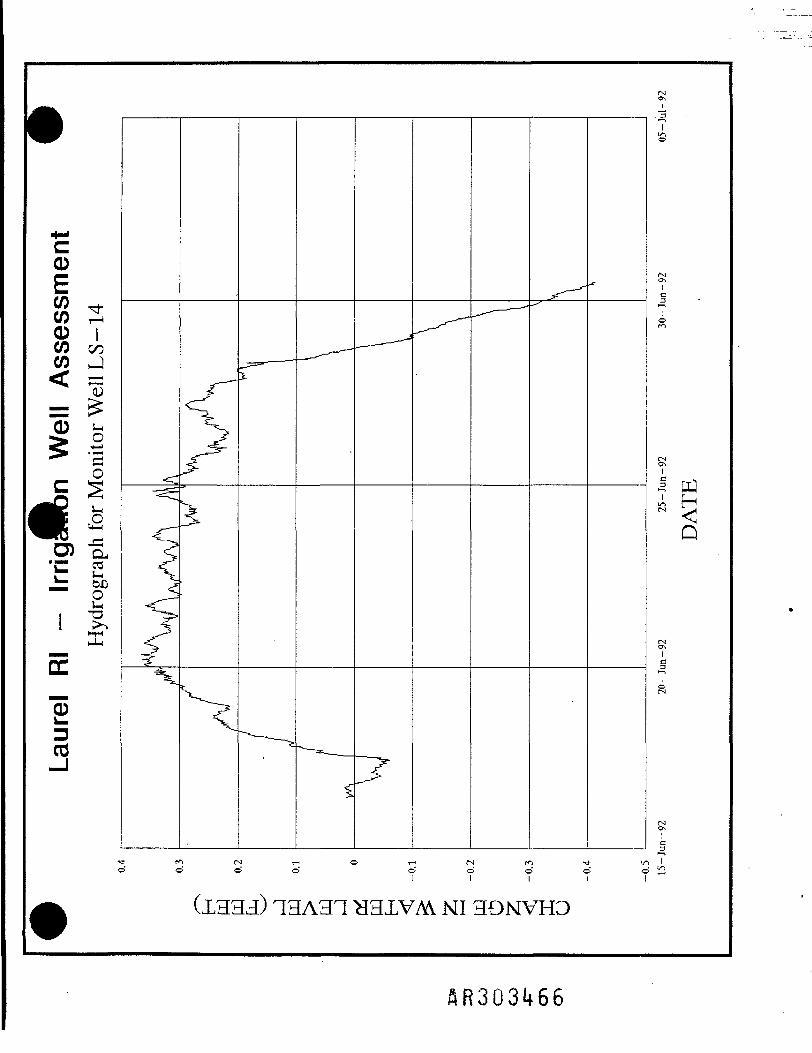
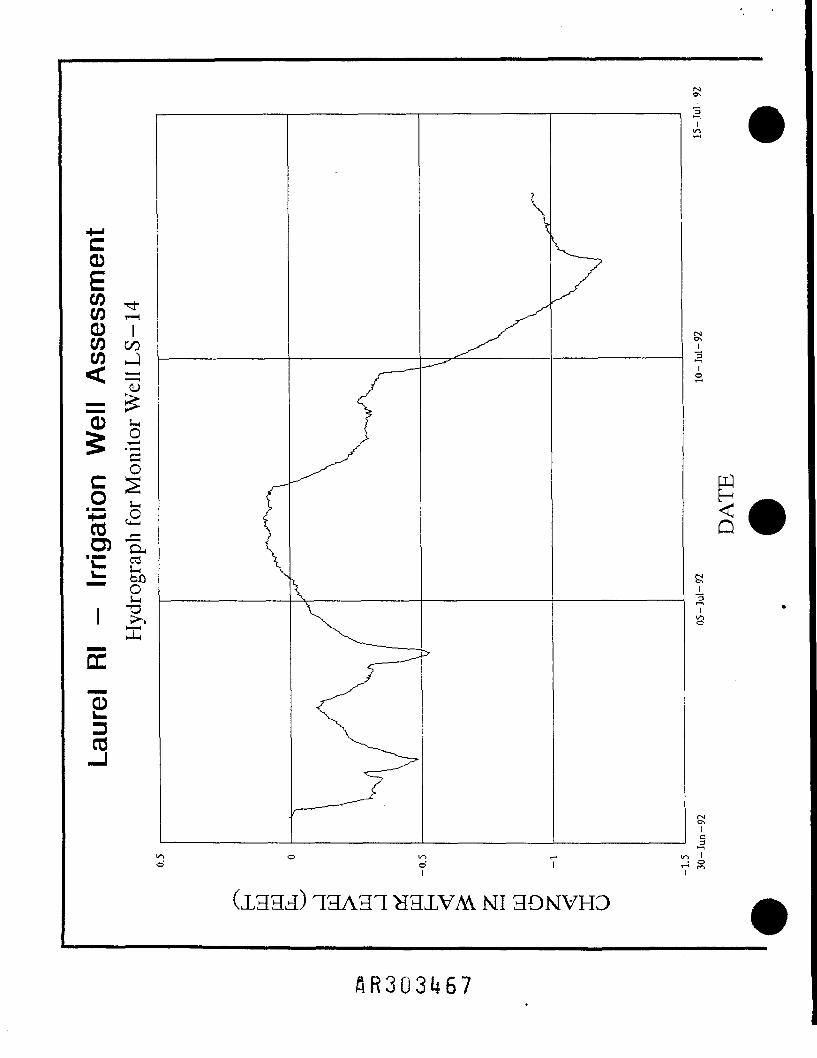
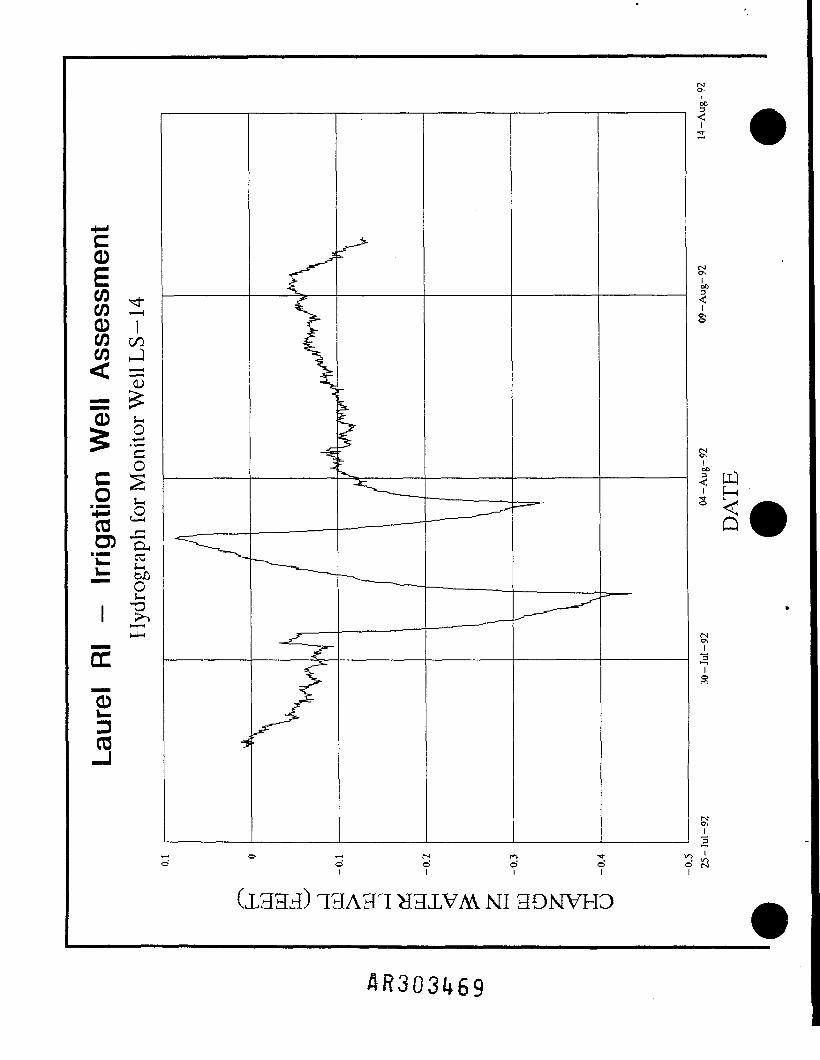
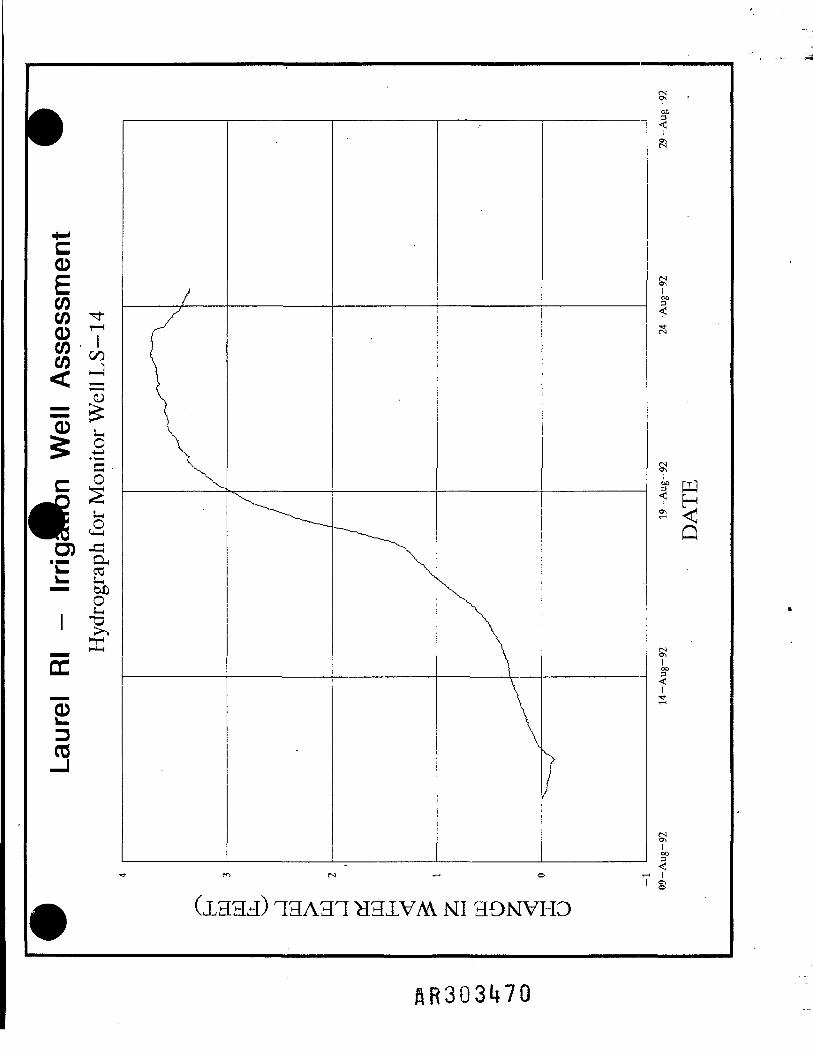
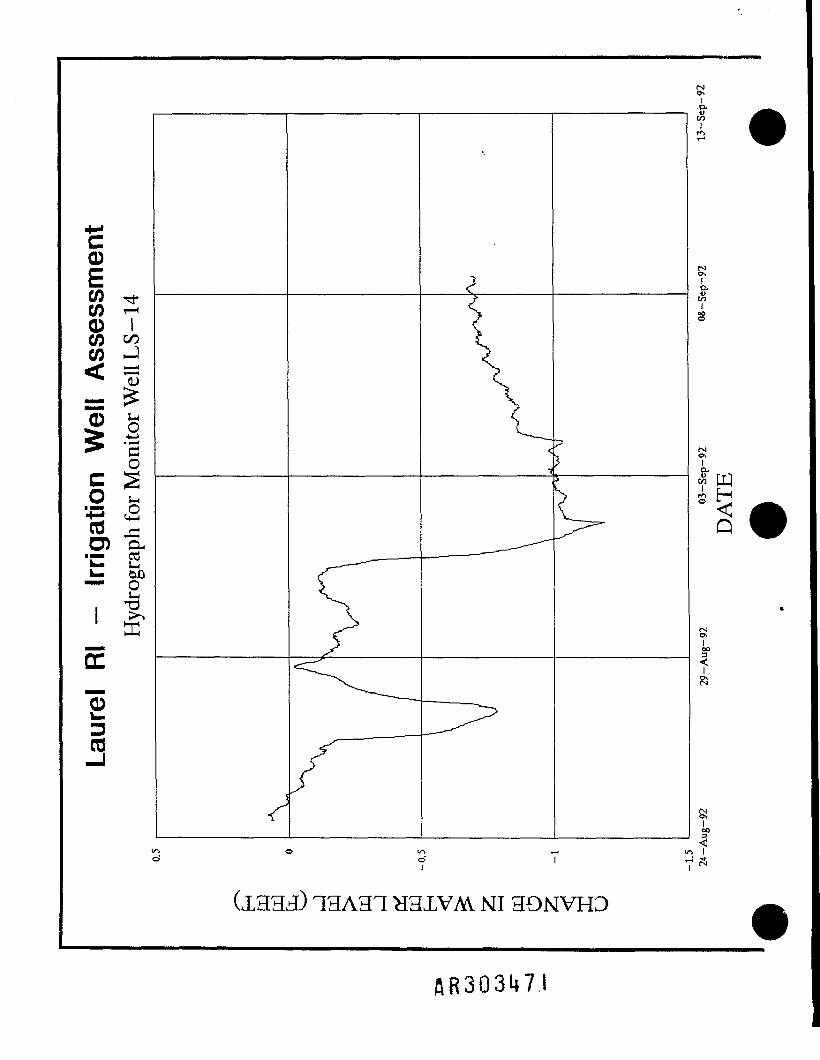
Monitor Well LS-14
AR303l»65
k0
I 20 ICO coCO J
SMO§ co
C 5
03UtooO
DC
"5303
Io
PJ
S!ic
Siic3
d dI I
(X333) 13A3T H3XVAV NI 39NVH3
0
i 20 iCO coCO nJ<0
DC
£ID03
.2 t:JS O
03toOO \
Si
IO
PJ
Q
Si
dI
(X333) 33A31 >33XVAV NI 39NVH3

kc0to rtco S0 iCO coCO J
C
£D03
D ~ X * £. o , S %O) "OH
03j-itoOO
SiI
•5 PJ
NO ood d
I I
(X333) 13A33 H3XVM NI 39NVH3
0
1 20) I03 co
_£0 »-,
§ !'O5 "toJDOUc
DC
"0
03
Si
Is
SI00< wQ
ON_l_
3
. .o o oI I I
(X333) 13A31H3XVM NI 39NVH3
H
ONI
I00
(X333) 13A3T H3XVM NI 39NVH3
0
CO rfCO 1-10 1CO coCO J
CO'S03O)
co
too
003
r-iON
.0.oCOI
ONI8-COI
PJ
SiI003
I
f
(X333) 13A31 H3XVM NI 39NVH3

(X33d) 13A31H3XVAV NI 39NVH3
AR303t*72

0CO TJ-CO rH0 ICO coCO J^ "Vi •>'
05
Os s
ffi
0
03
_ . . . . . . . QO) o<•—» 03^ toO— Ol-i
ONI
ONI
I" qj
8-CO1
(NON
8-oo \o Tt (s o fs)o d d d d
(X333) 13A31 3XVAV NI 39NVH3
Monitor Well LS-16
&R3G3U7U

k0
8 s0 ICO co
Ro
S'5
C J0
03IMtooO
DC
"5303
Q
siic3
d d d dI I I I
(X333) 13A3T H3XVAV NI 39NVH3

T
0Eco S0 iCO coJ
Co
£03
i_o<—I
'5o
O) "a,
toOOJ-i
•
PJ
Sii
d c> o' o o' d d o' dI I I I I I I I I
(X333) 13A31H3XVM NI 39NVH3
RR303U76
0CO \oCO i-i0 ICO coCO J
0 n5 a
Oc S
O) CL,•j- 03
±1HH
0
303
ia
PJH
j_3
A
o' o" d d d d d d dI I I I I I I I I
(X333) 13A31H3XVAV NI 39NVH3
c0COco0COCO
oc S
03O) 03L-I
toO
DC
"0
03
(X333) 13A31H3XVM NI 39NVH3
AR303U78

c0COco ;£0 7to J,co 2<
l-itoJDO
DC
"0
03
H
(X333) 33A31H3XVM NI 39NVH3
1-1 i1 §
c0CO ^CO i-«0 ICO coCO H-l= 1IIoB *•*"D) OH••— 03H *Mi- too— o
DC
1303
T-l I I ^
ia.&
8-COI
In.
Si
SiIoo
?
(X333) 13A31 H3XVM NI 39NVH3
RR303U80
ONIO.
ONICu
Ia.ocoI
(X333) 13A31H3XVAV NI 39NVH3

0
CO \oCO 1-10 ICO coCO J
S_io•t—I
'So
2tooo
£303
ONI'ooI8
fs!ONI(X
Q
(NON
8-CO
I
CO( I«
(X333) 13A31H3XVM NI 39NVH3

Monitor Well LS-17
AR303U83
c0ES2 ^CO r-H0 ICO coCO J
<D= £Q> g
'S
O2Uia45a-03S_itooO
£303
Sii
S!I
oI10 I• 1/1
(X333) 33A3T H3XVAV NI 39NVH3

0CO r,CO S0 ICO coCO J
0
oc -
>O) B,'E 2^ toO
_ KDC
"0303
Si
io
PJ
107
(X333) 13A3T 3XVM NI 39NVH3

c0ECO £0 ICO coCO J
DC
0303
MO
C 5
V
i-<Q
toOO
g7toCS
i PJ
Si
(X333) 33A3T H3XVAV NI 39NVH3
fiR303t*86
0CO ^co u;0 iCO coCO J< =
03O)
DC
£303
QJ j-
co
1
§'
00
Q
d dl I
(X333) 13A31 >I3XVAV NI 39NVH3
RR303U87
0303
00
<
PJH
00_ 3
(X333) 13A3T H3XVM NI 39NVH3

0
CO ^CO S0 ICO coCO J
0
coC 2.2 %oS ^D) 71
toJDO
DC
£303
c1
o.Ic.oCOI
CO1
PJHQ
Sii
(X333) 13A31H3XVAV NI 39NVH3
&R3Q3U89

0CO ^CO ^0 ICO coCO J
«
£303
CD
"53 £
5 |O
I!D) B,
>-»DC
ONIO.UCOI00
PJ
COI
Icu
oI
(X333) 13A31 >33XVAV NI 39NVH3
fiR303if90

0
ITII
= IO 4= &03 ^
MH
0303
ONI
Q
I8-COI
COo I
(X3Hd) 73A31H3XVAV NI 3ONVH3
BR303U9.I

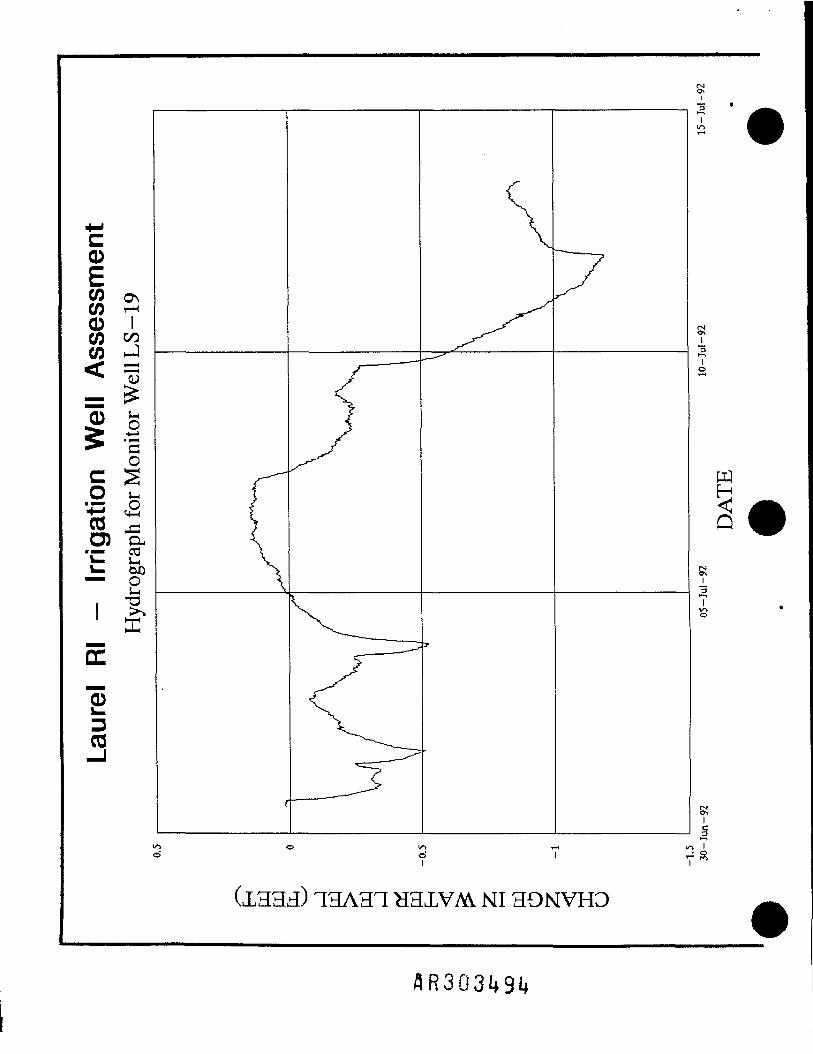
• Monitor Well LS-19

PJ
(X333) 13A31H3XVM NI 39NVH3
0COCO0C/3CO
coC SO t
•••% ZI?.-. 03V— s_<V_ toO•" Ou
DC
0303
PJ
SQ
s;
3
f ' 7s
(X333) 13A31 H3XVM NI 39NVH3

0COCO0COCO
o> g§ •£
OC
s-lo
^
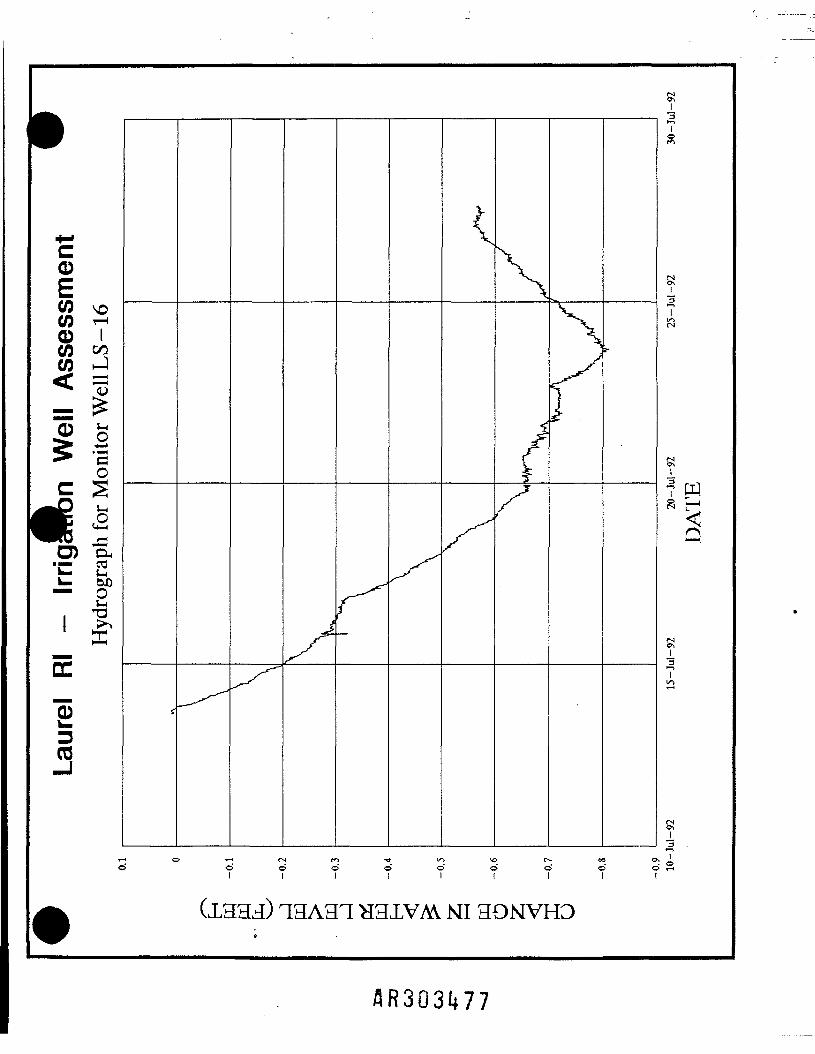
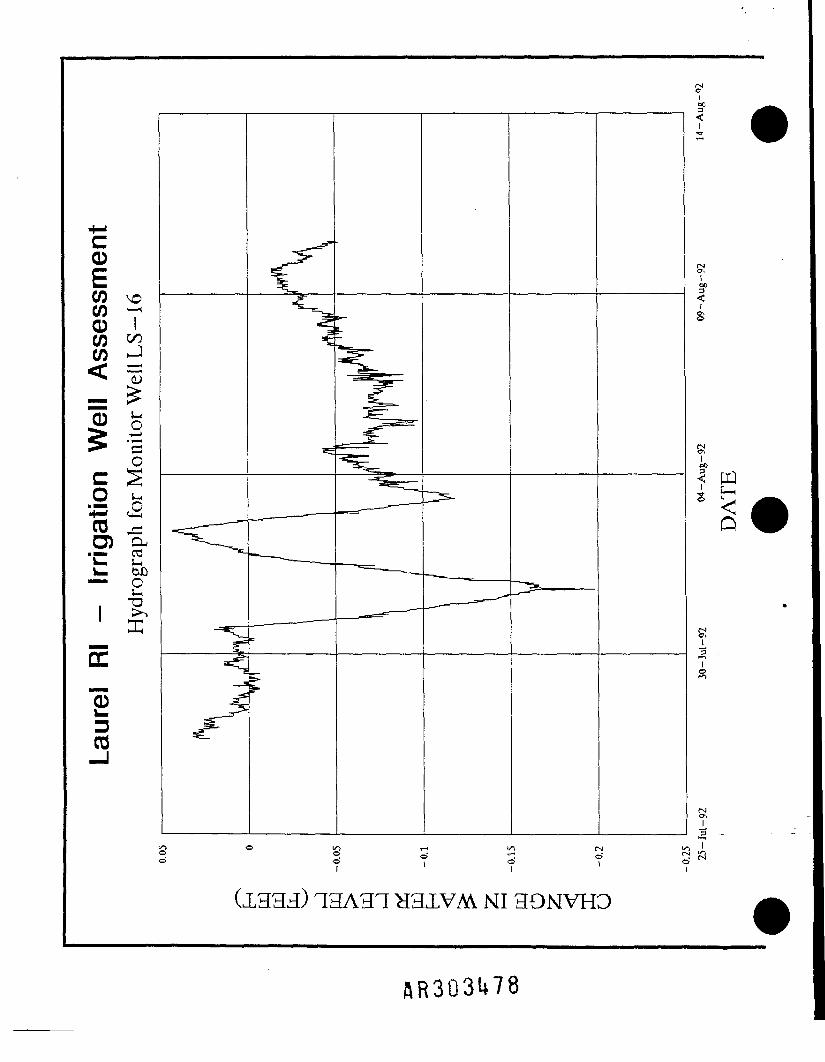
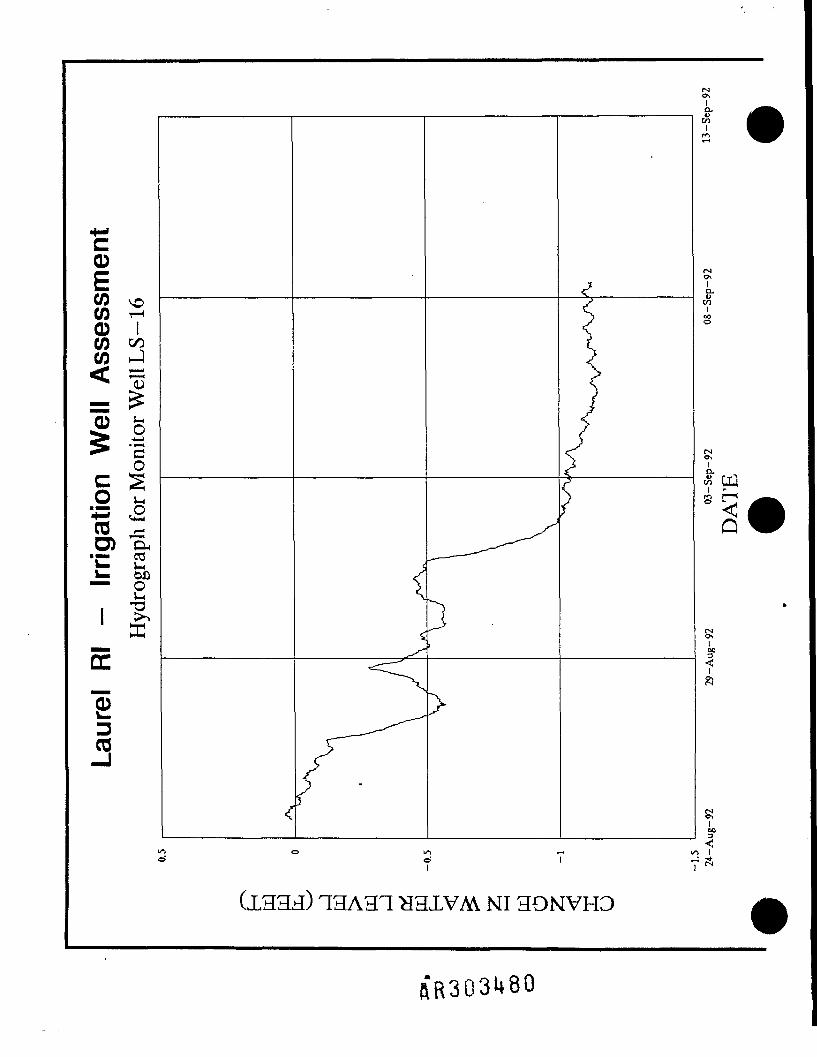
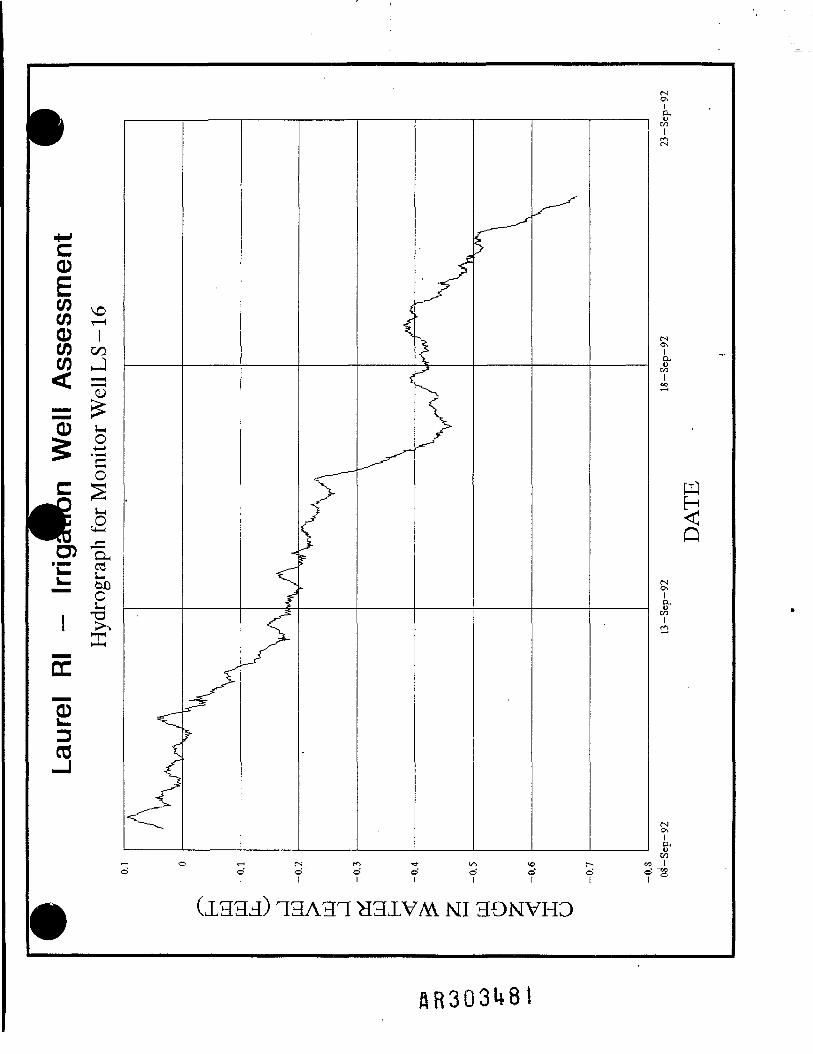
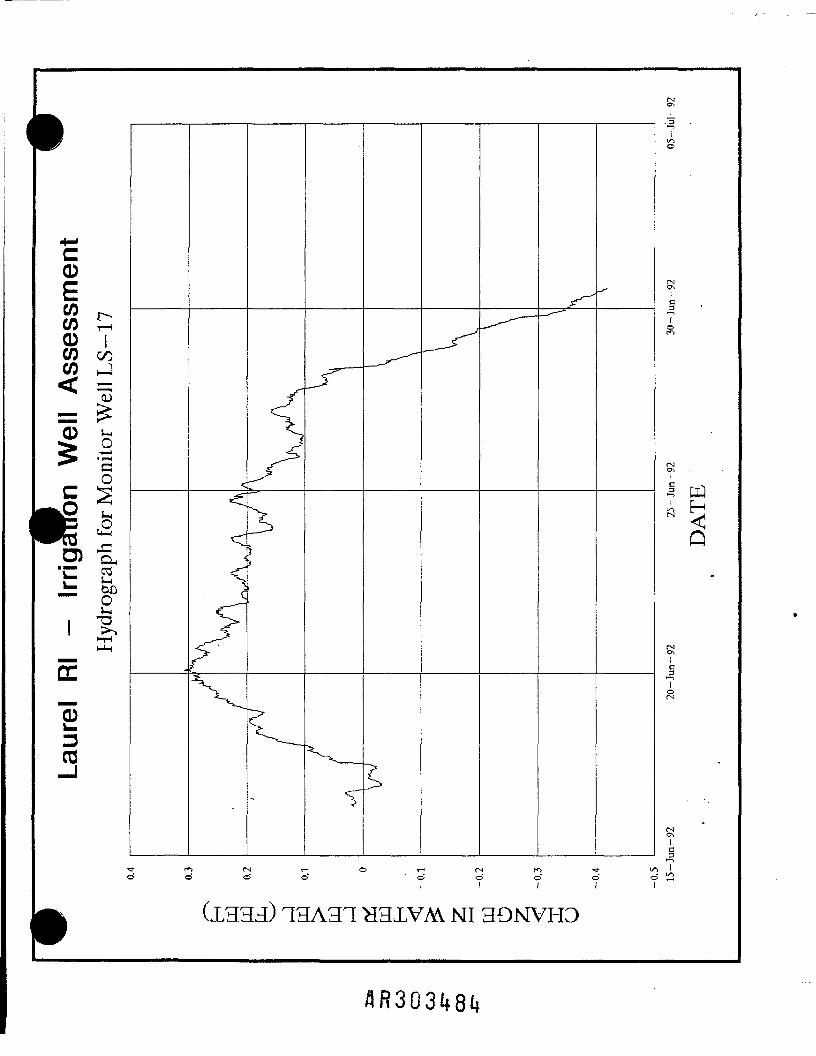
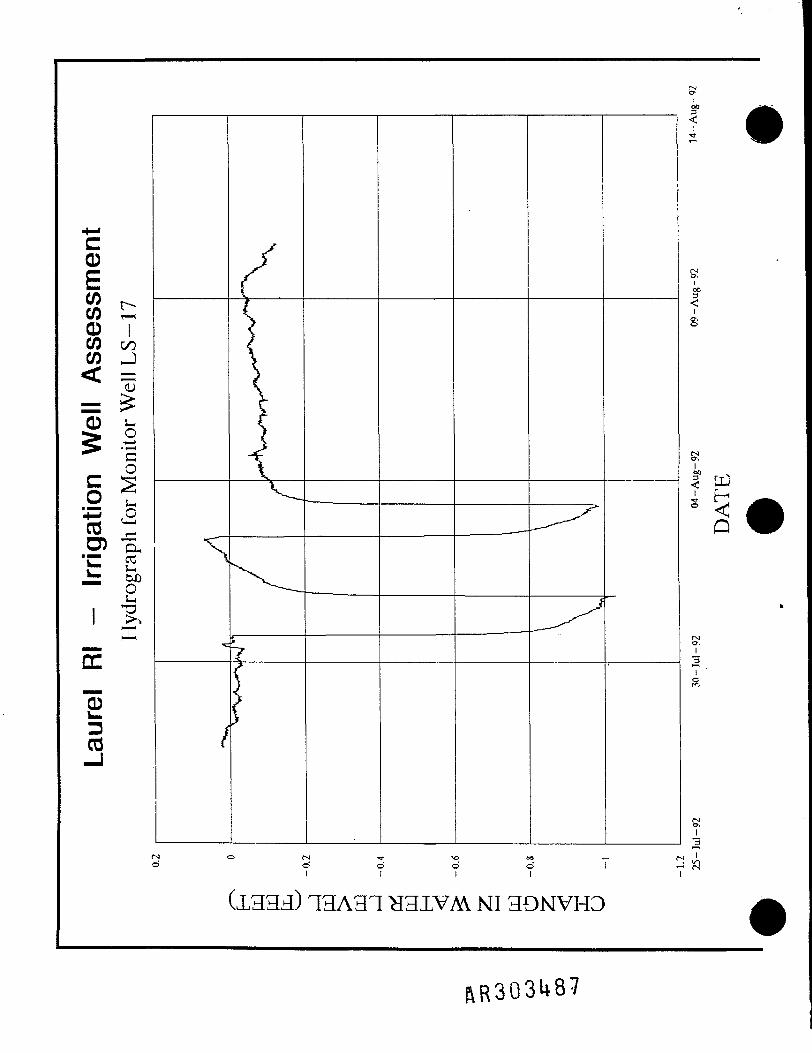
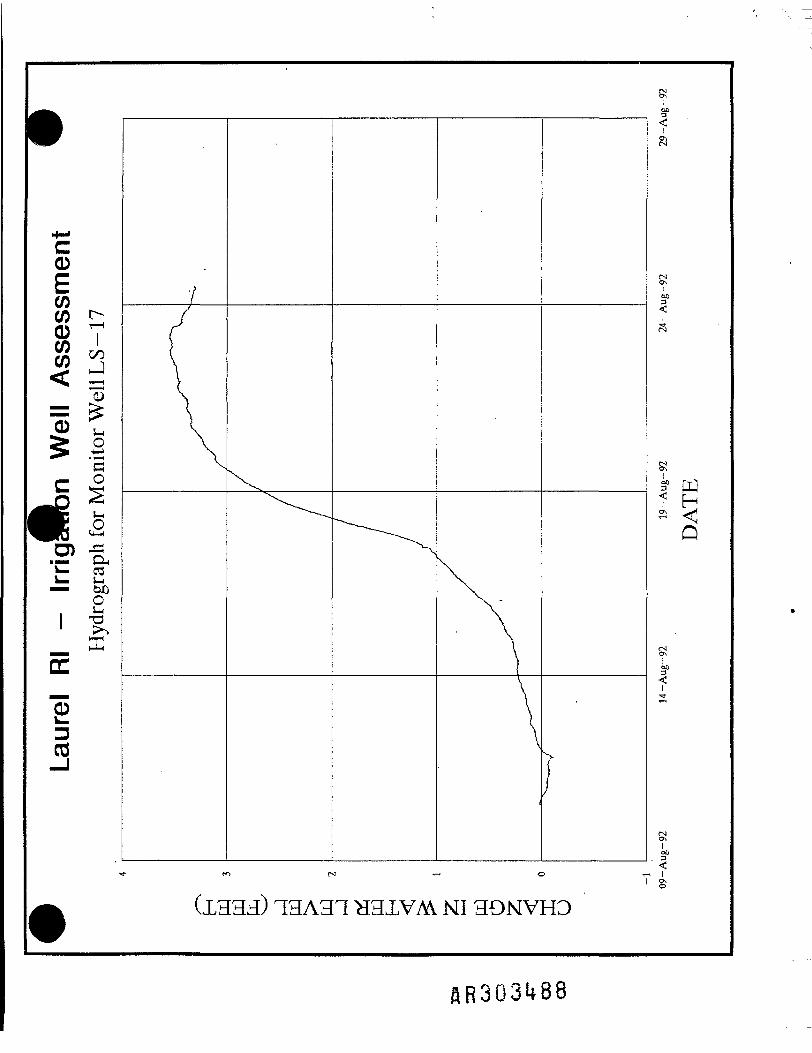
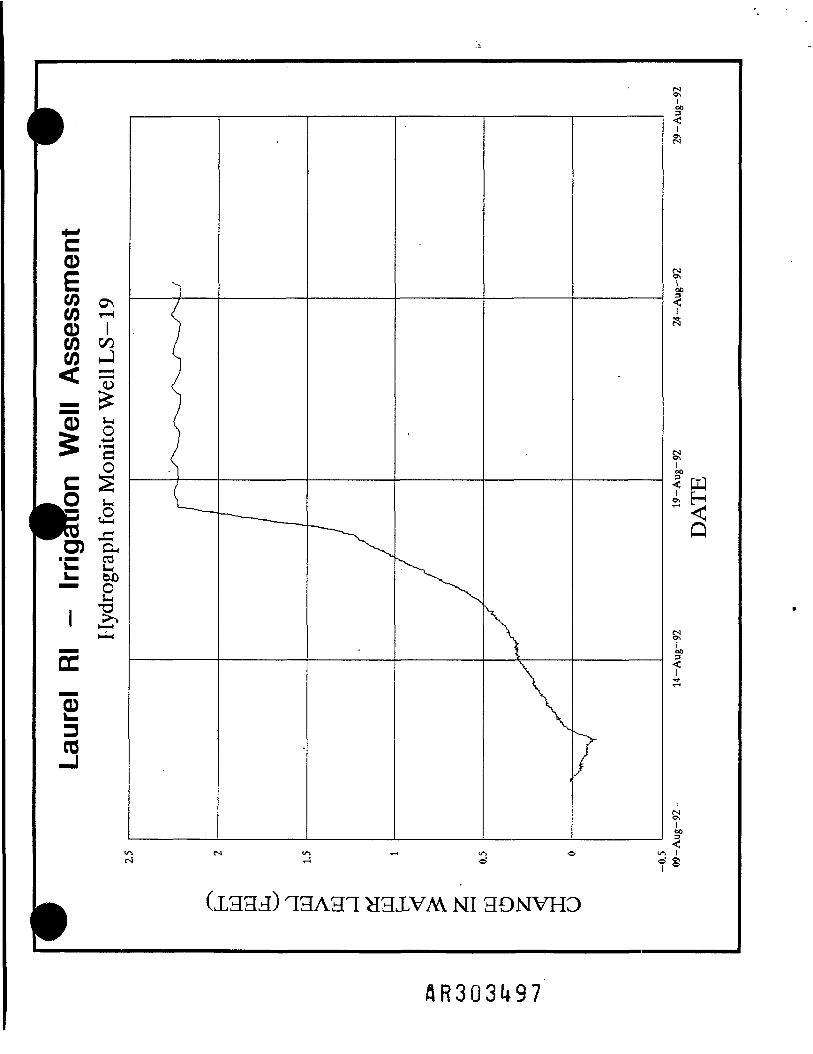
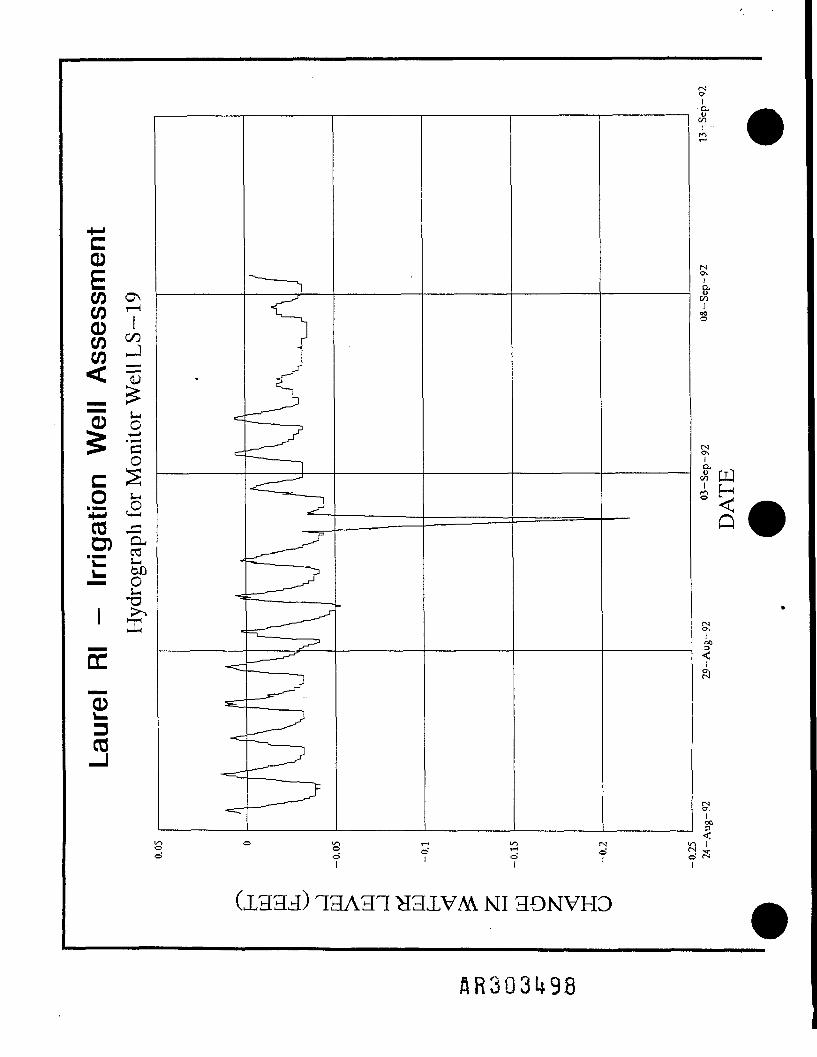
Laurel Rl -
Irr
igHydrograp
__^~
C^^
^
[&.
- ! O ( N i 3 - \ O O O i — i f ->' d o' d o' 1 i-1
(X333) 33A3T H3XVAV NI 39NVH3
ON1371—1
i
7
ONJi_3I
S
ONI3
SR303U95

(X333) 13A31H3XVAV NI 39NVH3
5R303496
(X333) 13A31 3XVAV NI 39NVH3
(X333) 13A31H3XVAV NI 39NVH3

(1,33d) 13A3T H3XVAV NI 3ONVHD
HR303U99

(X333) 13A3T H3XVM NI 39NVH3
RR303500
APPENDIX IMeteorological Data for 17 June 1992
4-R30350I
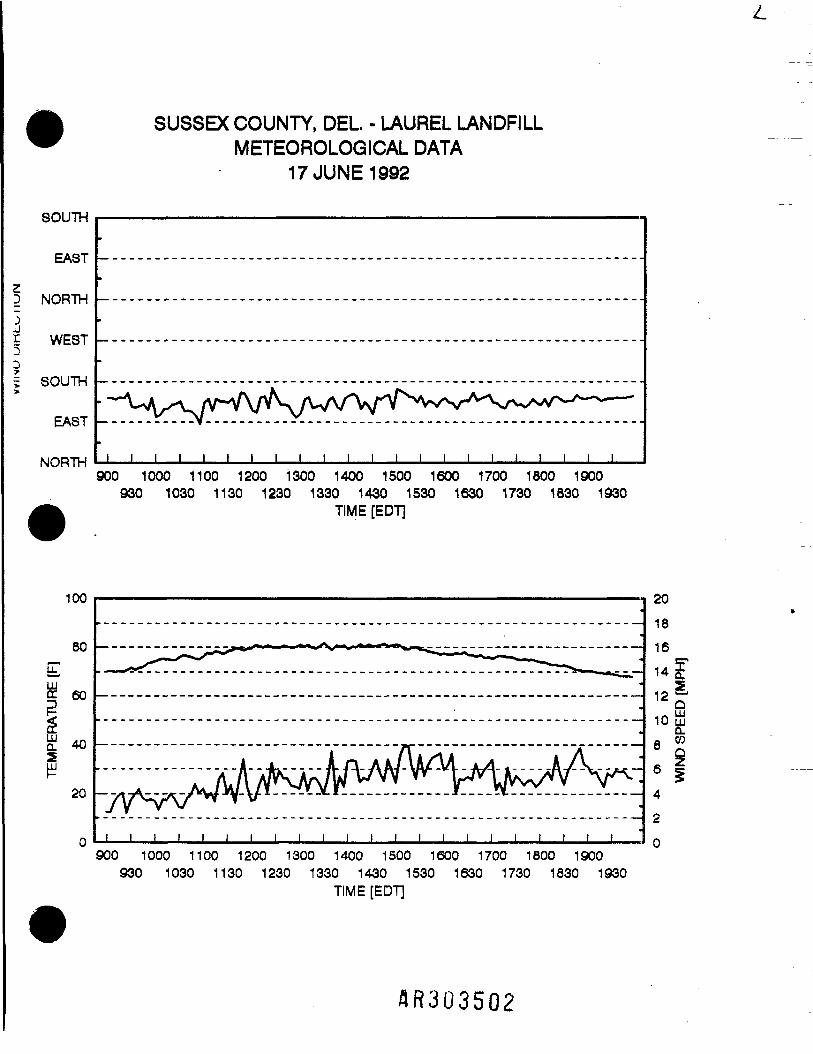
SUSSEX COUNTY, DEL • LAUREL LANDFILLMETEOROLOGICAL DATA
17 JUNE 1992
SOUTH
EAST
3 NORTH
j5 WEST
SOUTH
EAST
NORTH i i i l i i l i i l l i i i i i i i i i i i900 1000 1100 1200 1300 1400 1500 1600 1700 1800 1900
930 1030 1130 1230 1330 1430 1530 1630 1730 1830 1930TIME [EOT]
100
uT80
60
40
20
I I I I I I | | | | J I
201816
14
12
10
86
4
900 1000 1100 1200 1300 1400 1500 1600 1700 1800 1900930 1030 1130 1230 1330 1430 1530 1630 1730 1830 1930
TIME [EDT]
AR303502
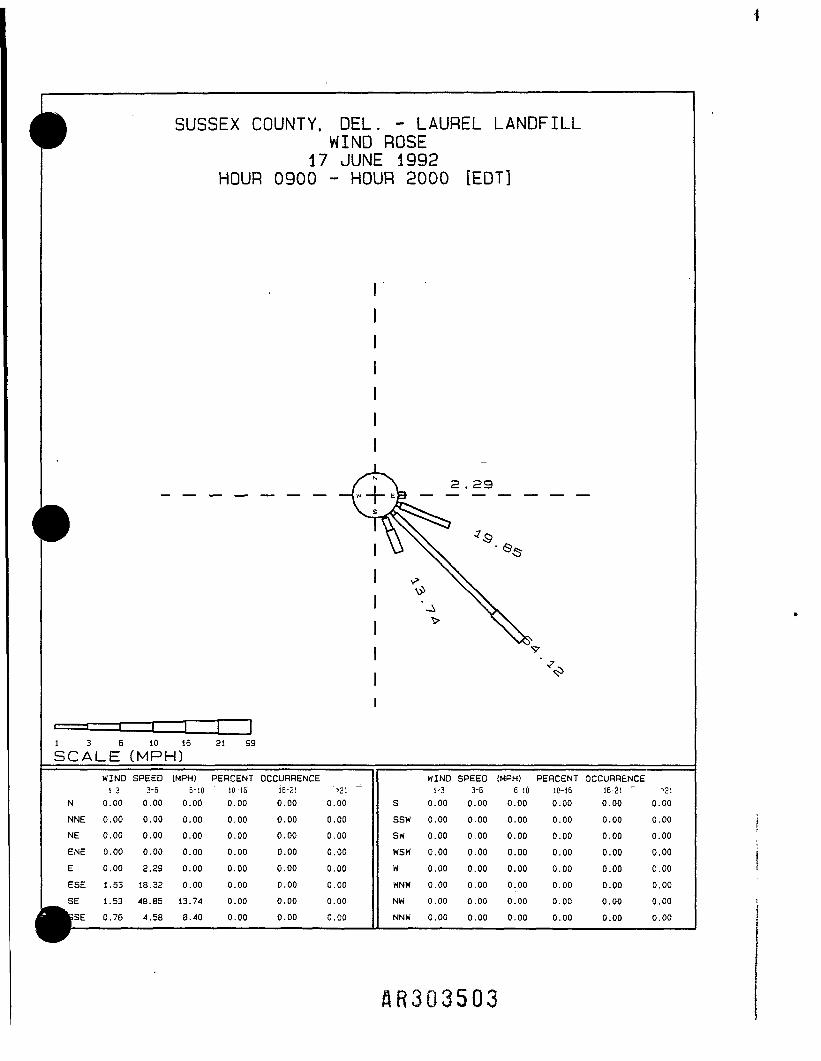
ll SUSSEX COUNTY. DEL. - LAUREL LANDFILLW WIND ROSE
17 JUNE 1992HOUR 0900 - HOUR 2000 [EOT]
.
-/J» ^
' ' * —— ' —— 1 —— 1 —— 11 3 B 10 16 21 99SCALE (MPH)
WIND SPEED (MPH) PERCENT OCCURRENCE1-3 3-6 6-10 " 10-16 1E-2P ">21 "
N 0.00 0.00 0.00 0.00 0.00 0.00
NNE 0.00 0.00 0.00 0.00 0.00 0.00
NE 0.00 0.00 0.00 0.00 0.00 0.00
ENE 0.00 0.00 0.00 0.00 0.00 0.00
E 0.00 2.29 0.00 0.00 0.00 0.00 '
ESE 1.53 18.32 0.00 0.00 0.00 0.00
SE 1.53 48.85 13.74 0.00 0.00 0.00
^ KSE 0.76 4.58 8.40 0.00 0.00 0.00
'
S, 2.29
\ \.
WIND SPEED (MPH) PERCENT1-3 3-6 6-10 10-16
S 0.00 0.00 0.00 0.00
SSW 0.00 0.00 0.00 0.00
SW 0.00 0.00 0.00 0.00
WSW 0.00 0.00 0.00 0.00W 0.00 0.00 0.00 0.00WNW 0.00 0.00 0.00 0.00NW 0.00 0.00 0.00 0.00
NNW 0.00 0.00 0.00 0.00
OCCURRENCE16-21 "~ *210.00 0.00
0.00 0.00
0.00 0.00
0.00 0.000.00 0.000.00 0.00
0.00 0.00
0.00 0.00
flR303503

APPENDIX J
Soil Gas Screening Results
/5R303501*

Summary of Soil Gas Survey
Results from Survey of Landfill GasesGridAR06-LGA
SampleLocationAR06-LGA-01AR06-LGA-02AR06-LGA-03AR06-LGA-04AR06-LGA-05AR06-LGA-06AR06-LGA-07AR06-LGA-08AR06-LGA-09AR06-LGA-10AR06-LGA-11AR06-LGA-12AR06-LGA-13AR06-LGA-14AR06-LGA-15AR06-LGA-16AR06-LGA-17AR06-LGA-18AR06-LGA-19AR06-LGA-20AR06-LGA-21AR06-LGA-22
Date17-Jun-9217-Jun-9217-Jun-9217-Jun-9217-Jun-9217-Jun-9217-Jun-9217-Jun-9217-Jun-9217-Jun-9217-Jun-9217-Jun-9217-Jun-9217-Jun-9217-Jun-9217-Jun-9217-Jun-9217-Jun-9217-Jun-9217-Jun-9217-Jun-9217-Jun-92
Monitoring Results (% Composition)Methane5.048.5 '5.80.00.00.053.34.40.00.02.18.050.61.611.86.11.643.30.012.03.020.5
Carbon Dioxide5.041.76.03.0
_ 5.00.029.15.20.99.63.510.341.44.816.98.313.823.33.617.18.323.5
Oxygen16.04.516.918.617.521.42.518.020.012.27.912.23.114.39.715.68.87.818.69.115.57.4
AR3035Q5

Summary of Soil Gas Survey(cont'd)
Results from Survey of Landfill GasesGridAR07-LGA
SampleLocationAR07-LGA-01AR07-LGA-02AR07-LGA-03AR07-LGA-04AR07-LGA-05AR07-LGA-06AR07-LGA-07AR07-LGA-08AR07-LGA-09AR07-LGA-10AR07-LGA-11AR07-LGA-12AR07-LGA-13AR07-LGA-14AR07-LGA-15AR07-LGA-16AR07-LGA-16(Duplicate)AR07-LGA-17AR07-LGA-18AR07-LGA-19AR07-LGA-20AR07-LGA-21AR07-LGA-22AR07-LGA-23AR07-LGA-24
Date18-Jun-9218-Jun-9218-Jun-9218-Jun-9218-Jun-9218-Jun-9218-Jun-9218-Jun-9218-Jun-9218-Jun-9218-Jun-9218-Jun-9218-Jun-9218-Jun-9218-Jun-9218-Jun-9218-Jun-92
18-Jun-9218-Jun-9218-Jun-9218-Jun-9218-Jun-9218-Jun-9218-Jun-9218-Jun-92
Monitoring Results (% Composition)Methane0.30.820.730.19.64.80.015.111.111.915.80.00.042.50.064.753.6
0.00.058.81.851.452.362.351.9
Carbon Dioxide4.40.810.612.58.44.30.910.49.49.420.40.52.130.86.622.916.9
1.52.833.02.839.740.320.717.7
Oxygen14.219.713.510.613.917.220.614.516.013.89.920.619.66.815.98.25.3
19.218.83.619.63.23.04.96.4
SR303506
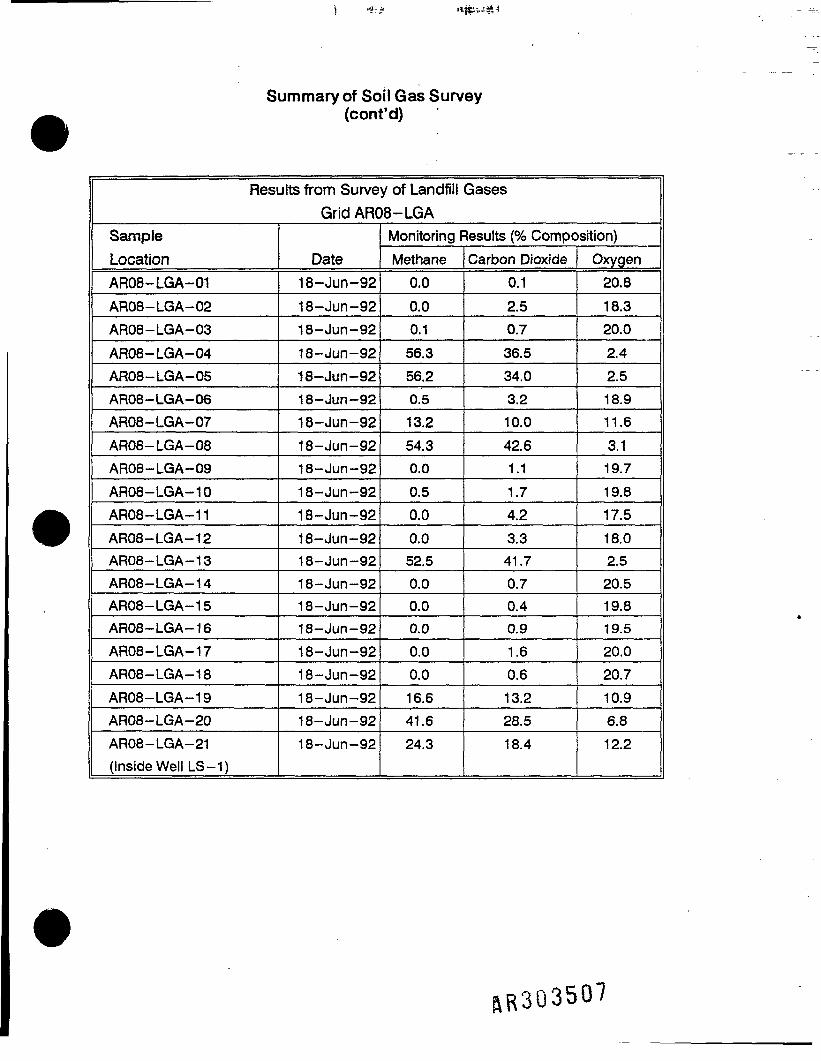
Summary of Soil Gas Survey(cont'd)
Results from Survey of Landfill GasesGridAR08-LGA
1 SampleLocationAR08-LGA-01AR08-LGA-02AR08-LGA-03AR08-LGA-04AR08-LGA-05AR08-LGA-06AR08-LGA-07AR08-LGA-08AR08-LGA-09AR08-LGA-10AR08-LGA-11AR08-LGA-12AR08-LGA-13AR08-LGA-14AR08-LGA-15AR08-LGA-16AR08-LGA-17AR08-LGA-18AR08-LGA-19AR08-LGA-20AR08-LGA-21(Inside Well LS-1)
Date18-Jun-9218-Jun-9218-Jun-9218-Jun-92ts-Jun-9218-Jun-9218-Jun-9218-Jun-9218-Jun-9218-Jun-9218-Jun-9218-Jun-9218-Jun-9218-Jun-9218-Jun-9218-Jun-9218-Jun-9218-Jun-9218-Jun-9218-Jun-9218-Jun-92
Monitoring Results (% Composition)Methane0.00.00.156.356.20.513.254.30.00.50.00.052.50.00.00.00.00.016.641.624.3
Carbon Dioxide0.12.50.736.534.03.210.042.61.11.74.23.341.70.70.40.91.60.613.228.518.4
Oxygen20.818.320.02.42.518.911.63.119.719.817.518.02.520.519.819.520.020.710.96.812.2
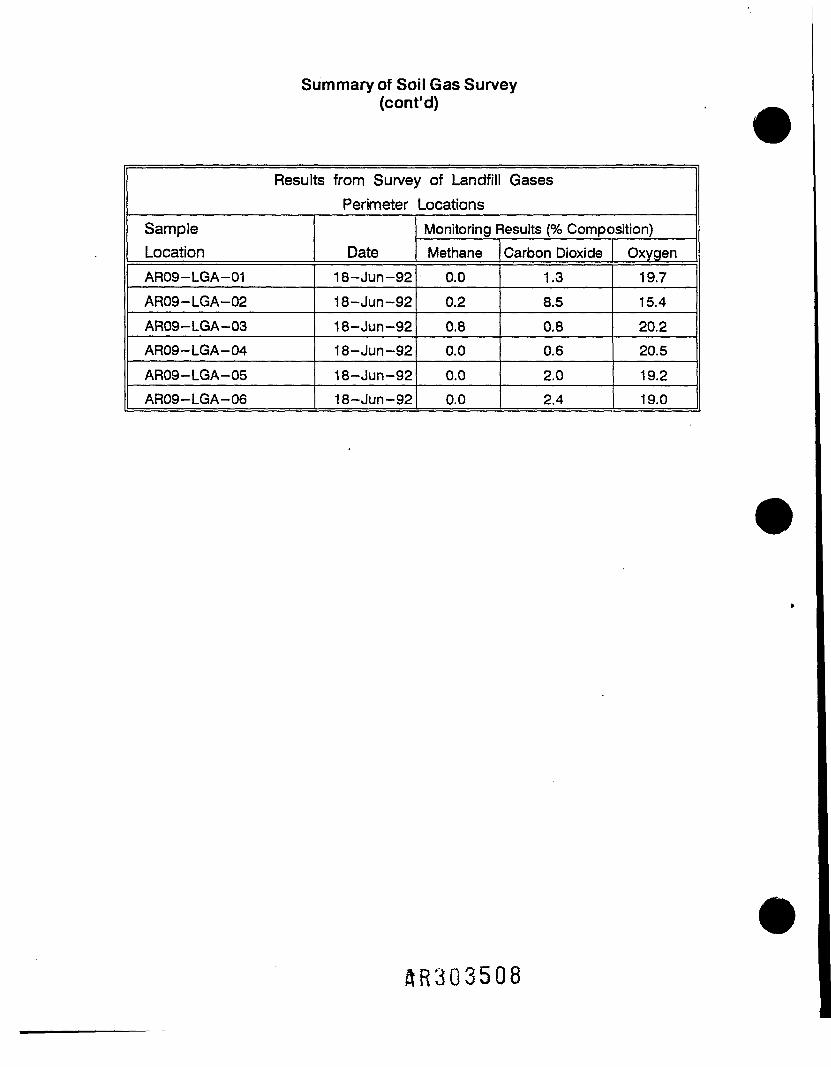
Summary of Soil Gas Survey(cont'd)
Results from Survey of Landfill GasesPerimeter Locations
SampleLocationAR09-LGA-01
AR09-LGA-02AR09-LGA-03AR09-LGA-04AR09-LGA-05AR09-LGA-06
Date18-Jun-9218-Jun-9218-Jun-9218-Jun-9218-Jun-9218~Jun-92
Monitoring Results (% Composition)Methane0.00.20.80.00.00.0
Carbon Dioxide1.38.50.80.62.02.4
Oxygen19.715.420.220.519.219.0
SR3Q3508

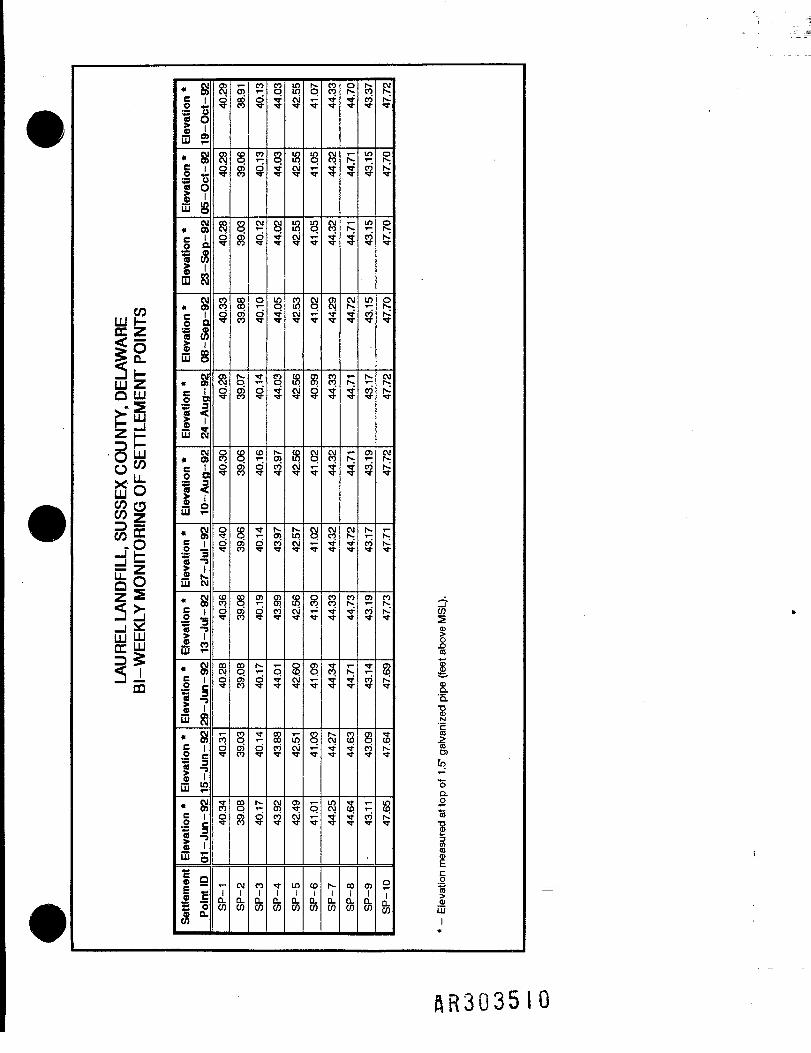
APPENDIX K
Landfill Settlement Point Elevation Summary
AR303509
CO££|51°-3iO UJ
B£g CO:* u.m oCO Oc/5 z8.SIIZ 253111 111S UJ
55
« Se iO «;
1?ijj »
Elevation *
05-Oct-92
Elevation *
23-Sep-92
CM« 0>C 1
Elevatio
08-Sep
Elevation *
24-Aug~9a
Elevation *
IO-Aug-92
«'Ifm E5
Elevation *
13-Jul-92
Bevation *
29-Jun-92
• S= l5 c1 'a 1E »
Bevation *
01-Jun-92
Settlement
Point ID
8S
%5
oow§
S39
Si
s9
orj-O
8d*r
ooCMoT
md
89
r-
8s
500
88
3&
§O5
fe
g
S8
8O5
S^
§8"
89?
S8'
CMIn.CO
CO
0
CT
i
CM
i
oo
•rf
i
COr-
?
TT
O
0)
§
Nr—
9'
T
C)
(
i
COIQ.03
S3
S?
S?
inQTJ-
S?
feco•fl-
feCO
sCOTT
0
?'
§CO
%9
VI£L(n
Scvi
a?
ISsi
scvi
S?$
s.5!
few
E8c\iM-
8cO•*
5Cvi
§$
inlQ_CO
5
q5
i"3-
8
g
§
8!5
§
S»»•
§r
2
5TT
COIQ.CO
%
8!5
8?
TT
8?
8!5
&*t
S?
S5
Si•T
K^t
r--lD.CO
S*t
N
5
fl5
CMh-TT
T—1 -
5
N?'
CJN-r
S?
fl?
8•f
S?
co
i
COCO
10
i
in
§
inco
-
f .i
en
i
h.i
O5
COf
•*
COTT
g°?
coTT
O)
ci
ei i
Rr>-'r
e
Rh-'
CMh-N•o-
Si^
r!j
Sh~"T
O>COh-;T
oSh-'
8t
o
i
CO
§£COi8.'5.
I<s
tto
"5a0
'S
1C/)m1.2I0UJ
1«
SR303510