Slug Flow Characteristics in Inclined and Vertical Channel s
13
Fluid Dynamics & Materials Processing FDMP, vol.15, no.5, pp.583-595, 2019 FDMP. doi: 10.32604/fdmp.2019.06847 www.techscience.com/fdmp Slug Flow Characteristics in Inclined and Vertical Channels Zhihui Wang 1, 2, 3 , Wei Luo 1, 2, 3, * , Ruiquan Liao 1, 2, 3 , Xiangwei Xie 4 , Fuwei Han 5 and Hongying Wang 6 Abstract: Horizontal well production technology gradually occupies a dominant position in the petroleum field. With the rise in water production in the later stage of exploitation, slug flow phenomena will exist in horizontal, inclined and even vertical sections of gas wells. To grasp the flow law of slug flow and guide engineering practice, the flow law of slug flow at various inclination angles (30°~90°) is studied by means of the combination of laboratory experiments (including high frequency pressure data acquisition system) and finite element numerical simulation. The results reveal that because of the delay of pressure variation at the corresponding position of pipeline resulting from gas expansion, the highest point of pressure change curve corresponds not to the highest point of liquid holdup curve (pressure change lags behind 0.125 s of liquid holdup change). Thus, the delay of pressure should be highlighted in predicting slug flow using pressure parameter change; otherwise the accuracy of prediction will be affected when slug flow occurs. It is generally known that liquid holdup and pressure drop are the major factors affecting the pressure variation and stable operation of pipelines. Accordingly, the results of finite element numerical simulation and Beggs-Brill model calculation are compared with those of laboratory experiments. The numerical simulation method is applicable to predicting the pressure drop of the pipeline, while the Beggs-Brill model is more suitable for predicting the liquid holdup variation of the pipeline. The research conclusion helps reveal the slug flow law, and it is of a scientific guiding implication to the prediction method of flow parameters under slug flow pattern in the process of gas well exploitation. Keywords: Slug flow, volume liquid holdup, pressure, pressure drop, flow pattern, numerical simulation. 1 Introduction Slug flow refers to a common flow pattern in the fields of petroleum production and 1 Petroleum Engineering Institute of Yangtze University, Wuhan, China. 2 Laboratory of Multiphase Pipe Flow, Gas Lift Innovation Center, China National Petroleum Corp, Wuhan, China. 3 The Branch of Key Laboratory of CNPC for Oil and Gas Production, Yangtze University, Jingzhou, China. 4 Exploration Department of Petro China Tarim Oilfield Company, Korla, China. 5 The Third Drilling Company of Bohai Drilling Engineering Co., Ltd. of CNPC, Tianjin, China. 6 Research and Development Center, Tuha Oilfield Company, CNPC, Tulufan, China. * Corresponding Author: Wei Luo. Email: [email protected].
Transcript of Slug Flow Characteristics in Inclined and Vertical Channel s

Fluid Dynamics & Materials Processing FDMP, vol.15, no.5, pp.583-595, 2019
FDMP. doi: 10.32604/fdmp.2019.06847 www.techscience.com/fdmp
Slug Flow Characteristics in Inclined and Vertical Channels
Zhihui Wang1, 2, 3, Wei Luo1, 2, 3, *, Ruiquan Liao1, 2, 3, Xiangwei Xie4, Fuwei Han5 and Hongying Wang6
Abstract: Horizontal well production technology gradually occupies a dominant position in the petroleum field. With the rise in water production in the later stage of exploitation, slug flow phenomena will exist in horizontal, inclined and even vertical sections of gas wells. To grasp the flow law of slug flow and guide engineering practice, the flow law of slug flow at various inclination angles (30°~90°) is studied by means of the combination of laboratory experiments (including high frequency pressure data acquisition system) and finite element numerical simulation. The results reveal that because of the delay of pressure variation at the corresponding position of pipeline resulting from gas expansion, the highest point of pressure change curve corresponds not to the highest point of liquid holdup curve (pressure change lags behind 0.125 s of liquid holdup change). Thus, the delay of pressure should be highlighted in predicting slug flow using pressure parameter change; otherwise the accuracy of prediction will be affected when slug flow occurs. It is generally known that liquid holdup and pressure drop are the major factors affecting the pressure variation and stable operation of pipelines. Accordingly, the results of finite element numerical simulation and Beggs-Brill model calculation are compared with those of laboratory experiments. The numerical simulation method is applicable to predicting the pressure drop of the pipeline, while the Beggs-Brill model is more suitable for predicting the liquid holdup variation of the pipeline. The research conclusion helps reveal the slug flow law, and it is of a scientific guiding implication to the prediction method of flow parameters under slug flow pattern in the process of gas well exploitation. Keywords: Slug flow, volume liquid holdup, pressure, pressure drop, flow pattern, numerical simulation.
1 Introduction Slug flow refers to a common flow pattern in the fields of petroleum production and
1 Petroleum Engineering Institute of Yangtze University, Wuhan, China. 2 Laboratory of Multiphase Pipe Flow, Gas Lift Innovation Center, China National Petroleum Corp, Wuhan,
China. 3 The Branch of Key Laboratory of CNPC for Oil and Gas Production, Yangtze University, Jingzhou, China. 4 Exploration Department of Petro China Tarim Oilfield Company, Korla, China. 5 The Third Drilling Company of Bohai Drilling Engineering Co., Ltd. of CNPC, Tianjin, China. 6 Research and Development Center, Tuha Oilfield Company, CNPC, Tulufan, China. * Corresponding Author: Wei Luo. Email: [email protected].
584 FDMP, vol.15, no.5, pp.583-595, 2019
transportation, nuclear energy, as well as chemical industry. It is characterized by alternating gas and liquid slugs. Such flow pattern can lead to periodic drastic variations in pressure and flow rate in pipelines, cause serious damage to stability of pipelines, shorten the life of pipelines, and cause a series of safety accidents. Kordyban et al. [Kordyban and Ranov (1970)] stated that the slug moves at the identical speed to that of the gas and slides over the underlying film without mixing or reacting between the slug and the film. However, due to the limitation of experimental conditions and the immature development of theory, their theory has not been further extended. Despite intensive research on slug flow Nydal, O. J, Barnea, D Kaya, A. S, Gomez, L. Hongyan Zhang, Xin Chang [NydaI, Pimus and Andreussi (1992); Barnea and Taite (1993); Chen and Chen (2010); Kaya, Sarica and Brill (1999); Gomez, Shoham and Schmidt (2000); Zhang, Bai and Wu (2017); Chang (2017)] their research only experimentally analyzed and predicted the flow law of slug flow in horizontal pipeline. Most of them were combined with experiments, using existing models to analyze and predict slug flow law [Liu and Li (2011); Li, Wu and Zhang (2018); Wang, Liu and Li (2016)]. As research technology for multiphase pipe flow continues to develop, the combination of laboratory experiment and numerical simulation has gradually become the mainstream research form. The combination of numerical simulation and experiment will be the most convincing method for flow pattern research. Thus, to gain more insights into the flow characteristics of slug flow at various angles simulation and laboratory experiments are employed to facilitate an in-depth study of the pressure, liquid holdup and gas-liquid distribution slug flow, providing reliable theoretical support for reducing the accidents attributed to slug flow in production field, It will be of high reference and guiding implication to the accurate assessment of slug hazards and quantitative analysis of slug characteristics.
2 Slug flow theory Generally, based on the nature of formation of slug flow, it can be divided into four types [Li and Jia (2015)]: hydraulic slug flow, severe slug flow, slug flow induced by topographic fluctuation and slug flow resulting from operation. Hydraulic slug flow and severe slug flow are the most common. The main characteristics of slug flow are the alternation of gas and liquid. Compared with other flow patterns, slug flow exhibits an unstable volume holdup, large fluctuation of pressure drops and obvious change of pressure when slug flow occurs in pipelines. In this study, only the formation and flow law of hydraulic slug flow will be studied. Hydraulic slug flow refers to slug flow attributed to hydraulic parameters (liquid holdup, gas superficial velocity and liquid superficial velocity) in pipeline just reaching the condition of slug flow formation. Before the formation of hydraulic slug flow, the liquid primarily behaves as wave current. Due to the superficial velocity of gas, the wave formed by liquid reaches the top of the pipeline, which cuts off the flow passage of gas. At this time, the slug flow is formed. The study of multiphase pipe flow primarily includes flow pattern identification, liquid holdup measurement and pressure drop calculation. The calculation of liquid holdup is the basis of flow pattern discrimination and pressure drop calculation, and plays an
Slug Flow Characteristics in Inclined and Vertical Channels 585
important role in process calculation. At present. It is generally accepted that Beggs-Brill [Beggs and Brill (1973); Brill and Beggs (1986)] obtained a classical comprehensive mechanism model after a large number of experiments. After fully considering various factors affecting the pressure drop, the pressure drops calculation theory, including gravity pressure drop, friction pressure drop and accelerated pressure drop, is summarized as Eq. (1).
( )( ){ }
1 sin2
1 1 /
l l g l
l l g l sg
GvH H g
dp DAdz H H vv p
ϕρ ρ θ
ρ ρ
+ − +=
− + −
−
(1)
whereϕ is the resistance coefficient along the two-phase flow, dimensionless, G is the mass flow rate of the mixture,v represents the average flow velocity of the mixture, Arepresents the cross-section area of the pipeline, D represents the diameter of the pipeline, θ represents the inclination angle of the pipeline, sg
v represents the apparent flow velocity of the gas phase, l
ρ , lH represents the density of the liquid phase and the liquid
holdup of the pipeline respectively.
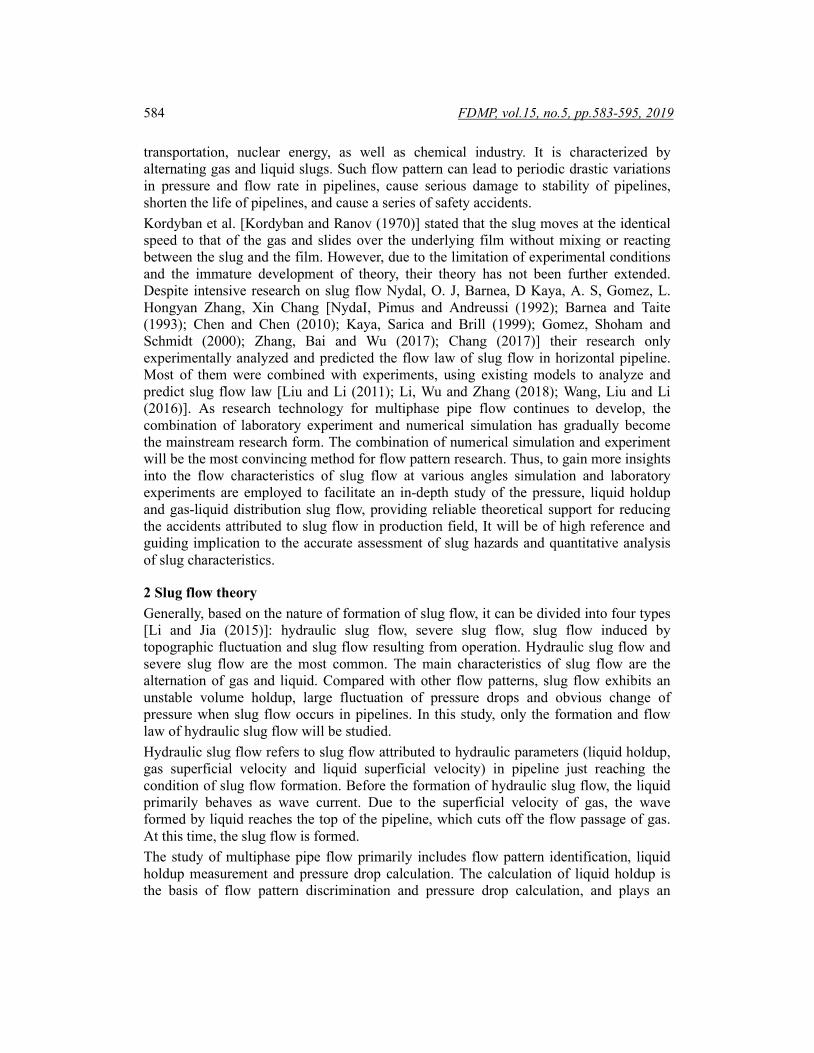
3 Numerical simulation 3.1 Geometric model To describe the flow pattern of slug flow more intuitively and accurately, relevant software was used to simulate the flow pattern in the whole pipeline, and water and air were selected as the simulation medium. First, using SolidWorks mapping software, a three-dimensional model of 40 mm diameter and 10 m length of pipeline is established (Fig. 1(a)). For transient numerical simulation, it is necessary to determine the number of meshes used in the calculation and the irrelevance between the time step and the calculated results, i.e., to verify the grid independence and time independence (irrelevance), because the density of meshing is directly related to the results of finite element analysis. This paper verifies the grid independence of four different mesh numbers. According to the Jiao study [Jiao and Deng (2013)], when the error of the results under different mesh numbers is less than 2%, the results are considered to be desirable. After comparison, 665,256 meshes are selected, and time step is 0.0001 s for simulation calculation [Johansen, Mo and Meese (2015)] (Fig. 1(b)).
(a) (b)
Figure 1: Pipeline three-dimensional model and structured grid
3.2 Mathematical model The VOF (Volume of Fluid) model is selected to yield the phase interface of two-phase

586 FDMP, vol.15, no.5, pp.583-595, 2019
fluid. The model refers to a surface tracking method based on a fixed Eulerian mesh provided that two or more fluids (or phases) do not mix with each other. In VOF model, different fluid components satisfy a set of momentum equations. The interface between phases is tracked by solving a continuity equation of phase volume fraction. The governing Eq. (2) is written as:
q qq
q
SV
tαα
αρ
∂+ ∇ =⋅
∂
(2)
where qα denotes the volume fraction of the q phase; V
is the velocity vector; qSα is the mass source phase. By default, the mass source term at the right end of the equation is zero. When each phase is assigned, the mass source term is not zero, and the volume fraction of the main phase is calculated by Eq. (3).
1
1n
α=
=∑ (3)
qρ denotes the density of the q phase, which is calculated by Eq. (4):
( )2 2 2 21ρ ρ α α ρ= + − (4)
The same momentum equation is adopted throughout the velocity field (5): 2( )
( ) ( )Tv
V p V V g Ft
ρ ρ µ ρ∂ + ∇ ⋅ = −∇ + ∇ + ∇ + + ∂
(5)
Lastly, the RNG K-epsilon turbulence model is employed to close the flow field, and the effect of gravity on the flow pattern is considered in the calculation.
3.3 Boundary conditions and solver settings The boundary conditions are set as mass flow inlet and free outflow outlet, and the inlet pressure is atmospheric pressure. To ensure the consistency of results with the experiment, the self-edited program is applied in the simulation calculation to assign the inlet flow in accordance with the sinusoidal fluctuation law. In the process of the simulation, the phase holdup, velocity, streamline, pressure, liquid holdup and other parameters in the flow direction are recorded.
3.4 Analysis of simulation results Given the results of simulation calculation, the working conditions of gas-liquid superficial velocity of 𝑣𝑣𝑠𝑠𝑠𝑠=7.0781 m/s and 𝑣𝑣𝑠𝑠𝑠𝑠=0.2687 m/s are taken, respectively. The flow characteristics of slug flow are analyzed as follows.
3.4.1 Pipeline holdup and pressure The variation curve of gas holdup and pressure (Fig. 2) suggests that the pressure in the gas phase region (Peak of gas content curve) is basically stable and the pressure in the liquid slug region (Valley of gas content curve) fluctuates greatly. Some reports [Wang, He and Luo (2007); Zhao, He and Xu (2005)] indicated that pressure rises instantaneously in the pipeline when the liquid slug flows past and decreases sharply in

Slug Flow Characteristics in Inclined and Vertical Channels 587
the gas phase region. In this study, whereas it is found that the highest pressure is not in the liquid slug zone, and there is no cliff-jumping drop in the gas phase zone. This is attributed to the compressibility of the bubbles carried in the liquid slug, Accordingly, the pressure variation lags behind due to the cushioning effect of the bubbles. The intersection of the blue vertical line and the gas content curve in Fig. 2 represents the formation of a liquid slug in the pipeline at this time, and the highest pressure always appears after the liquid slug.
(a) (b)
(c) (d)
Figure 2: Gas content and pressure curves at various inclination angles
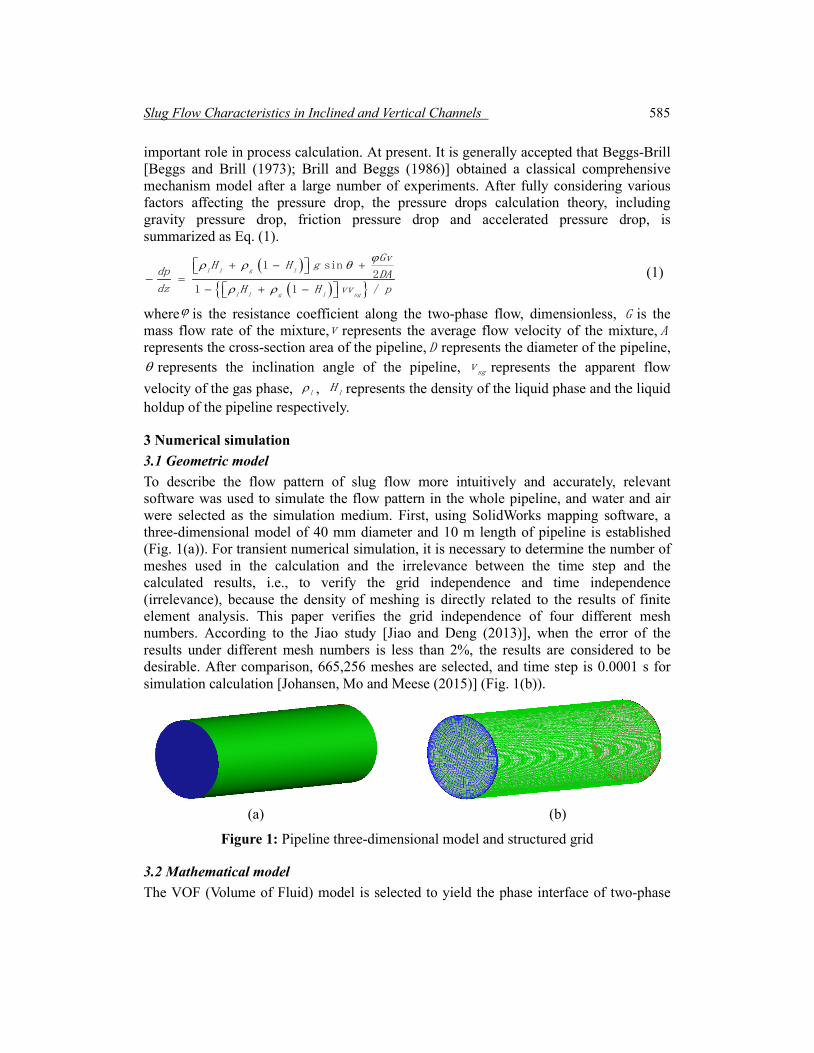
3.4.2 Distribution of liquid phase Fig. 3 (red area represents gas, blue area represents liquid, fluid flows from left to right) suggests that when slug flow occurs in the pipeline with an inclination of 30°, all the liquid will deposit at the bottom of the pipeline, primarily because the gravity of the liquid affects the distribution of gas and liquid phases in the pipeline. When the angle rises, the gas will gradually occupy the center of the pipe, so the liquid phase begins to extend around the pipe wall, and the head of the liquid slug will be gradually regularized, as indicated by degree 30°, 45°, 70°. In the vertical pipe, the liquid phase has been evenly distributed around the pipe wall (degree 90°). The liquid slug formed in the vertical pipe is a regular cylinder. The liquid film at the end of the liquid slug is squeezed by the gas core, and it adheres to the wall of the pipe evenly. With the rise in the angle, the gravitational force in the direction of vertical liquid flow gradually decreases, making the gas phase a vital factor affecting the flow pattern of liquid phase. To be specific, the liquid phase is disturbed by gas, and the flow becomes more dispersed and disordered.
588 FDMP, vol.15, no.5, pp.583-595, 2019
Figure 3: Gas holdup contours of slug flow at various inclination angles
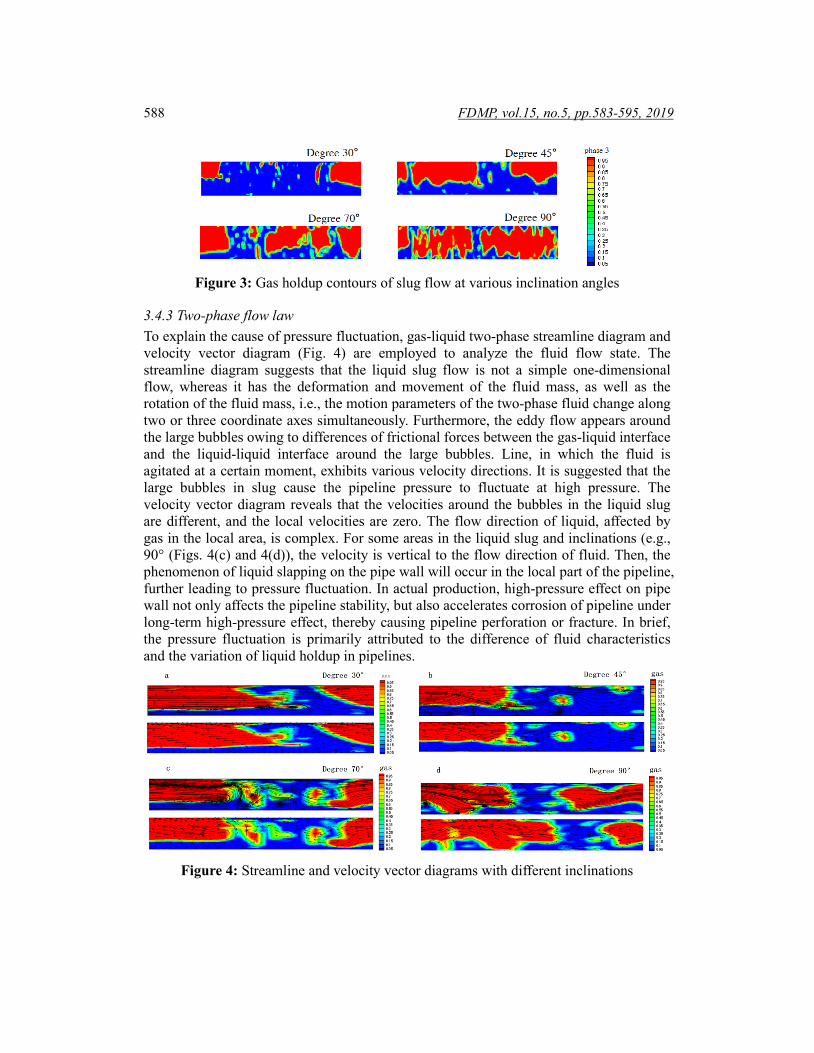
3.4.3 Two-phase flow law To explain the cause of pressure fluctuation, gas-liquid two-phase streamline diagram and velocity vector diagram (Fig. 4) are employed to analyze the fluid flow state. The streamline diagram suggests that the liquid slug flow is not a simple one-dimensional flow, whereas it has the deformation and movement of the fluid mass, as well as the rotation of the fluid mass, i.e., the motion parameters of the two-phase fluid change along two or three coordinate axes simultaneously. Furthermore, the eddy flow appears around the large bubbles owing to differences of frictional forces between the gas-liquid interface and the liquid-liquid interface around the large bubbles. Line, in which the fluid is agitated at a certain moment, exhibits various velocity directions. It is suggested that the large bubbles in slug cause the pipeline pressure to fluctuate at high pressure. The velocity vector diagram reveals that the velocities around the bubbles in the liquid slug are different, and the local velocities are zero. The flow direction of liquid, affected by gas in the local area, is complex. For some areas in the liquid slug and inclinations (e.g., 90° (Figs. 4(c) and 4(d)), the velocity is vertical to the flow direction of fluid. Then, the phenomenon of liquid slapping on the pipe wall will occur in the local part of the pipeline, further leading to pressure fluctuation. In actual production, high-pressure effect on pipe wall not only affects the pipeline stability, but also accelerates corrosion of pipeline under long-term high-pressure effect, thereby causing pipeline perforation or fracture. In brief, the pressure fluctuation is primarily attributed to the difference of fluid characteristics and the variation of liquid holdup in pipelines.
Figure 4: Streamline and velocity vector diagrams with different inclinations

Slug Flow Characteristics in Inclined and Vertical Channels 589
4 Experimental study 4.1 Experimental system The experimental device consists of a central control system, a high-speed camera system, a gas circulation system, a liquid supply system, a gas-liquid mixing system and a multi-phase separation system, as shown in Fig. 5. The gas flow and liquid flow are regulated by the central console, and the high-speed camera system is composed of the high-speed camera with the acquisition frequency of 1000fps and its control software Motion Studio. To obtain high frequency pressure signal in pipeline, DH5960 high performance dynamic signal test and analysis system is adopted to collect voltage signal, and then Eq. (6) is used to convert voltage signal into pressure signal.
( )minmin max min
max min
V Vp p p p
V V
−= + −
− (6)
where p denotes the pressure value to be converted; minp is the minimum range of the
corresponding sensor; maxp refers to the maximum range of the corresponding sensor; V
represents the voltage signal collected using the DH5960 data acquisition system; minV
represents the minimum voltage signal of the DH5960 data acquisition system; maxV is
the maximum voltage signal of the DH5960 data acquisition system. The experimental device adopts a 10 m length and 40 mm diameter organic glass tube; the inclination angle of the pipe ranges from 0° to 90°; the gas flow range is 0-150 m3/h; and the liquid flow range is 0-1.3 m3/h. To ensure the full development of flow pattern, a gas-liquid mixer and a stable section of 2 m are installed at the entrance of the experimental pipeline and at the entrance and exit of the pipeline, respectively. In the experiment, air and water are employed as experimental media. During the experiment, data are collected (e.g., gas flow rate, liquid flow rate, pressure drop, inlet pressure, outlet pressure, pipeline temperature and liquid holdup). Transient variations of pipeline flow pattern are recorded with high-speed camera, which are used as an important reference for flow pattern judgment.
Figure 5: Experimental devices and flow chart

590 FDMP, vol.15, no.5, pp.583-595, 2019
1-Data acquisition system; 2-Control system; 3-Compressor; 4-Dryer; 5-Plunger pump 6-Mass flowmeter; 7-Ball valve; 8-Mixer; 9-13-Pressure transducer; 10-12-Quick close valve; 11-High-speed camera; 14-Gas-liquid separator; 15-Water tank; 16-Buffer tank 17-One-way valve; 18-Pneumatic valve.
4.2 Experimental procedure First, the winch is adjusted to the required inclination angle, and the primary switch of the console is turned on. Subsequently, the gas flow and liquid flow are regulated by remote control pneumatic valve according to the gas flow and liquid flow designed in the experimental scheme. When the flow is stable, the data required for the experiment will be collected, and the high-speed camera is used to observe and record the experimental phenomena and flow pattern.
4.3 Image processing and data analysis Through observation(𝑣𝑣𝑠𝑠𝑠𝑠=7.0781 m/s and 𝑣𝑣𝑠𝑠𝑠𝑠=0.2687 m/s), it is found that when the liquid has not reached the top of the pipeline during flow from the left to the right, due to the different friction forces between liquid and gas, liquid and liquid, the velocity difference between upper and lower fluids in the pipeline will be raised, and the gravity of liquid makes the head of slug flow form a ladder shape. When the volume of liquid accumulated in the pipeline is up-regulated, and the wave crest reaches the upper wall of the pipeline, the slug flow will be formed (as shown in the head of the slug marked by the red curve in Fig. 6), the velocity difference value between the upper and lower layers will decrease, and the head of the slug will be gradually regular. After the slug flows, the bubble containing in the slug will accumulate [Deng, Liu and Bian (2018)] at the tail of the slug (the bubbles are marked in the green circle of Fig. 7). Fig. 7 suggests that with the rise in the inclination angle, the radial force of liquid gravity decreases. The principle of material balance indicates that when the liquid film at the bottom of the pipeline becomes thinner, the liquid film at the top will be thicker (the green curve in Fig. 7 indicates the liquid film thickness in the gas zone.). When the inclination angle is 90°, the liquid uniformly will surround the pipe wall. To collect the pressure signal at the outlet of the pipeline, the high frequency data acquisition system is used. The peak in the pressure waveform represents the liquid slug area, and the trough refers to the development stage of the gas slug area or slug flow. Fig. 8 suggests that when slug flow occurs, the fluctuation of pipeline pressure will be large, and the fluctuation of pressure wave peak will be small. The control variable method is employed to study the effect of angle change on slug flow characteristics by selecting the apparent gas-liquid flow velocities of 𝑣𝑣𝑠𝑠𝑠𝑠=7.0781 m/s, 𝑣𝑣𝑠𝑠𝑠𝑠=0.2687 m/s, respectively. The pressure signals corresponding to the steady slug flow at various angles are observed (Fig. 8). It is found that the oscillation frequency of pressure signal increases as inclination angle rises from 30° to 90°, i.e., the motion of fluid becomes more complex at large inclination angles.

Slug Flow Characteristics in Inclined and Vertical Channels 591
Figure 6: Head of slug Figure 7: Tail of slug
When the inclination angle is 30°, the peak of the pressure waveform (point A in Fig. 8(a)), due to the larger gas velocity and the shear action between the phases interfaces, drives the liquid flowing forward at the bottom of the pipeline and thus causes the rapid accumulation of low-speed liquid phase and the formation of liquid slug, thereby leading to the peak of pressure rise. The peak is very sharp, which reveals that there is no liquid slippage after the slug flow or there is no large number of bubbles in the slug body. The valley (point B in Fig. 8(a)) of the pressure waveform represents the gas phase region after the liquid slug. The variation of the trough curve reflects the process of liquid phase accumulation. With the rise in the inclination angle, the liquid phase in the pipeline will exhibit obvious slippage phenomenon, thus resulting in small fluctuation of pressure wave peak. Figs. 8(b), 8(c) and 8(d) suggest that calculated pressure fluctuation proves the accumulation and rupture of bubbles in the liquid slug region.
Degree 30°
Degree 45°
Degree 70°
Degree 90°
B A
Degree 30°
Degree 45°
Degree 70°
Degree 90°

592 FDMP, vol.15, no.5, pp.583-595, 2019
Figure 8: Slug flow pressure vs. time at various angles
By comparing the simulated and measured values of pipeline pressure at various angles, it is found that they are slightly different, and the measured results of pressure in gas phase region by the two methods are almost the same, because the pressure value of pipeline will be affected by factors in actual operation (e.g., gas-liquid flow instability and pipeline vibration). Compared with the simulated value, there will be slight fluctuation, whereas the frequency of liquid slug measured with the two methods is the same [LV, Chen and Du (2003); Li, Gong and Li (2013); Wang and Guo (2006); Yin, Li and Gong (2011)]. It also suggested that it is feasible to simulate the pipe flow, and the simulation results can be compared with the experimental data.
Figure 9: Variation of pressure drop and liquid holdup at various inclination angles
Fig. 9 draws a comparison of pressure drop and volume holdup using numerical simulation, actual test and Beggs-Brill calculation model under specific working conditions. Fig. 9(a) suggests that the actual measured pressure drop increases with the rise in the angle when the inlet gas-liquid flow rate and the medium viscosity remain unchanged, but both the simulated and the Beggs-Brill model calculation have maximum values. The relative error between the calculated results and the measured values is 53.6% when the inclination angle is 70°, and the calculated results of Beggs-Brill and the simulated when the inclination angle is 45°, the relative errors between the calculated and the measured are 9% and 14.9%, respectively. Under this condition, the slug flow pressure drop can be predicted by simulation study. The comparison of the measured holdup in Fig. 9(b) with the holdup calculated by Beggs-Brill model suggests that the holdup will peak at an inclined angle of 45° when the gas-liquid flow rate at the inlet is constant. The main reason is that the gravity and viscosity of the liquid affect the variation of the liquid holdup in the pipeline. When the shear force of gas is constant, θ<45°, the downward gravity of the liquid along the pipe wall will be greater than the

Slug Flow Characteristics in Inclined and Vertical Channels 593
friction force between the liquid and the pipe wall, thus increasing the slippage between the two phases and increases the liquid holdup gradually. When θ>45°, the liquid in the pipeline will be filled with the inner wall of the pipeline, and it in the pipeline is considered a whole. Because the slippage between the two phases decreases, the holdup will decrease gradually. The relative error of Beggs-Brill model is 11.62% when the inclination angle is 45°, and the simulated may be more applicable to predicting liquid holdup variation in vertical pipelines.
5 Conclusion Two research methods were adopted to compare and analyze the slug flow changes in the flow process. The experimental phenomena are well consistent with the simulation results. It is suggested that the simulation is reliable, feasible and comparable to the experiment. Combining the Laboratory experiment and simulation results, the following conclusions can be drawn: 1) When slug flow occurs in the pipeline, the volume holdup will change with the rise in the angle, which verifies the accuracy of the Beggs and Brill model in predicting the volume holdup of the pipeline. 2) When high pressure occurs at the position of the pressure measuring point in the pipeline, it was not certain that there must be a liquid slug at this point, and the gas expansion which promotes the flow of the liquid slug will also produce high pressure. 3) There are numerous types of movement in slug (e.g., deformation, movement and rotation). The bigger the inclination angle, the more complex the flow pattern inside the slug. 4) The two-phase distribution and flow pattern in slug flow can be observed from the simulated gas holdup contours. With the advantage of simulation technology, the flow state and variation mechanism in pipeline can be explained effectively. These results will theoretically support field construction and pipeline maintenance and have important reference and guiding significance for accurate assessment of slug hazards and quantitative analysis of slug characteristics. Acknowledgement: Gratitude is extended to Wei Luo, the corresponding author for the article. The authors would also like to acknowledge the support provided by the National Natural Science Fund Project (61572084) and major national projects (2017ZX05030-005, 2016ZX05056004-002, 2016ZX05046004-003).
References Barnea, D.; Taitel, Y. (1993): A model for slug length distribution in gas-liquid slug flow. Multiphase Flow, vol. 19, no. 5. Beggs, H. D.; Brill, J. P. (1973): A study of two-phase flow in inclined pipes. JPT, vol. 25, no. 5, pp. 607-617. Brill, J. P.; Beggs, H. D. (1986): Two-phase flow in pipes. University of Tulsa, no. 12. Chang, X. (2017): Studying pressure signal of vertical pipe bending slug flow in experiments. Petrochemical Industry Technology, vol. 24, no. 1, pp. 72-75.

594 FDMP, vol.15, no.5, pp.583-595, 2019
Chen, J. L.; Chen, T. P. (2010): LPG Two-Phase Pipe Flow, 2nd edition. Petroleum Industry Press. Chen, X. Y. (2017): Numerical Calculation of Liquid Holding Rate of Gas-Liquid Mixed Pipeline and Numerical Simulation of Pigging Process. Southwest Petroleum University. Deng, Z. F.; Liu, X. L.; Bian, J. (2018): Pressure fluctuation of oil-gas multiphase flow pipeline caused by rupture of gas slug. Contemporary Chemical Industry, vol. 47, no. 2, pp. 290-293. Gomez, L.; Shoham, O.; Schmidt, Z. (2000): Unified mechanistic model for steady state two-phase flow: horizontal to vertical upward flow. Society of Petroleum Engineers. Jiao F.; Deng, X. H. (2013): Structural optimization of converging-diverging tube based on heat transfer enhancement for self-support rectangle heat exchanger. CIESC Journal, vol. 64, no. 7, pp. 2376-2385. Johansen, S. T.; Mo, S.; Meese, E. (2015): CFD simulations of multiphase flows containing large scale interfaces and dispersed phases with selected production technology applications. Offshore Technology Conference. Kaya, A. S.; Sarica, C.; Brill, J. P. (1999): Comprehensive Mechanistic Modeling of Two-Phase Flow in Deviated Wells. Society of Petroleum Engineers. Kordyban, E. I.; Ranov, T. l. (1970): Mechanism of slug formation in horizontal two.phase flow. ASME Journal of Basic Engineering, vol. 92, no. 4. Li, C. J.; Jia, W. L. (2015): Multiphase Flow of Oil and Gas Pipelines. Chemical Industry Press. Li, C. J.; Wu, W.; Zhang, L. (2018): Numerical simulation on control measures of severe slug flow in Boxi oilfield. Oil & Gas Storage and Transportation, vol. 37, no. 1, pp. 95-100. Li, M.; Gong, J.; Li, Q. P. (2013): Mathematical model of severe slug flow in submarine riser system. Oil & Gas Storage and Transportation, vol. 32, no. 5, pp. 462-468. Liu, Y.; Li, W. Z. (2011): Numerical simulation on vertical upward gas-liquid annular flow. Chinese Journal of Computational Mechanics, no. 1, pp. 96-101. Lyu, Y. L.; Chen, Z. Y.; Du, S. W. (2003): Study on measurement of liquid-holding rate of gas-liquid two-phase flow by conducting probe. Industrial Metrology, no. S1, pp. 208-211. Lyu, Y. L.; Du, S. W.; He, L. M. (2006): Study on the characteristics parameters of gas-liquid two-phase flow. Oil & Gas Storage and Transportation, vol. 25, no. 3, pp. 48-51. NydaI, O. J.; Pimus, S.; Andreussi, P. (1992): Statistical characterization of slug flow in horizontal pipes. International Journal of Multiphase Flow. vol. 18, no. 3, pp. 439-453. Song, B.; Li, T. Y.; Wang, W. Q. (2016): Transient numerical simulation of severe slugging in marine riser system. Journal of Liaoning University of Petroleum & Chemical Technology, vol. 3, pp. 34-38.

Slug Flow Characteristics in Inclined and Vertical Channels 595
Wang, H. Q.; He, L. M.; Luo, X. M. (2007): Fluctuation characteristics of slug liquid holdup for slug flow in horizontal pipe. Journal of Engineering Thermophysics, vol. 28, no. 5, pp. 795-798. Wang, L.; Liu, C.; Li, Y. X. (2016): Numerical simulation of severe slugging in offshore riser on CFD. Science Technology and Engineering, vol. 16, pp. 162-167, 172. Wang, L.; Liu, C.; Li, Y. X. (2016): Transient mathematical model for severe slugging in the air-water riser system. Oil & Gas Storage and Transportation, vol. 35, no. 11, pp. 1235-1242. Wang, X.; Guo, L. J. (2006): Experimental investigation and simulation of severe slugging in pipeline riser system. Journal of Engineering Thermophysics, vol. 27, no. 4, pp. 611-614. Yin, T. T.; Li, Q. P.; Gong, J. (2011): A steady state model for slug flow in multiphase pipeline. Science Technology and Engineering, no. 22, pp. 5422-5424. Zhang, H. Y.; Bai, C. Q.; Wu, W. Y. (2017): Fluid-solid coupling dynamics analysis of pipeline under gas-liquid two-phase slug flow. Chinese Journal of Applied Mechanics, no. 4, pp. 661-665. Zhao, Q. J.; He, L. M.; Xu, J. Z. (2005): Fluctuation analysis of pressure and differential pressure for two-phase slug flow in a horizontal pipe. Journal of Engineering Thermophysics, vol. 26, no. 3, pp. 441-446.
![********************************************************** 02 32 00.pdf · Drilling, Without Sampling, [_____] mm inch Diameter Drill Holes, [Vertical] [Inclined]. 1.1.5.2 Measurement](https://static.fdocuments.us/doc/165x107/5f5ccdb50ef0e659b4354b48/-02-32-00pdf-drilling.jpg)