Slide 1 Corporate Presentationlibrary.corporate-ir.net/library/71/718/71865/items/234217/... ·...
50
Transcript of Slide 1 Corporate Presentationlibrary.corporate-ir.net/library/71/718/71865/items/234217/... ·...

Corporate PresentationSlide 1

Corporate PresentationSlide 2
Except for historical information, the matters discussed in thispresentation are forward-looking statements that are subject to certain risks and uncertainties which could cause the actual results to differ materially from those projected, including industry trends, the timing and strength of the Company's or competitors’ new product and service offerings, the mix of product and service revenues, changes in the Company's or competitors’ business or pricing strategies, changes in the prevailing political and regulatory framework in which the Company operates or in economic or technological trends or conditions, including currency fluctuations, inflation and consumer confidence, on a global, regional or national basis and other risks detailed from time to time in the Company’s SEC reports. The Company assumes no obligation to update the information herein contained.
PRIVATE SECURITIES LITIGATION REFORM ACT OF 1995 SAFE HARBOR
Disclaimer

Corporate PresentationSlide 3
WHO ARE WE?
Orbotech is a world leader in providing yield and productivity enhancement solutions to the electronics industry
Orbotech’s dedicated worldwide team ensures that it delivers the most innovative technologies
Virtually every electronic device in the world is produced using Orbotech systems

Corporate PresentationSlide 4
THE INDUSTRIES WE SERVE
Bare PCB Production5000 systems installed
PCB Assembly1400 systems installed
FPD Manufacturing500 systems installed

Corporate PresentationSlide 5
Other3%
PCB Bareboard
51%
Display35%
PCB Assembly
11%
SALES DISTRIBUTION 2006 BY PRODUCT LINES
Corporate PresentationSlide 6
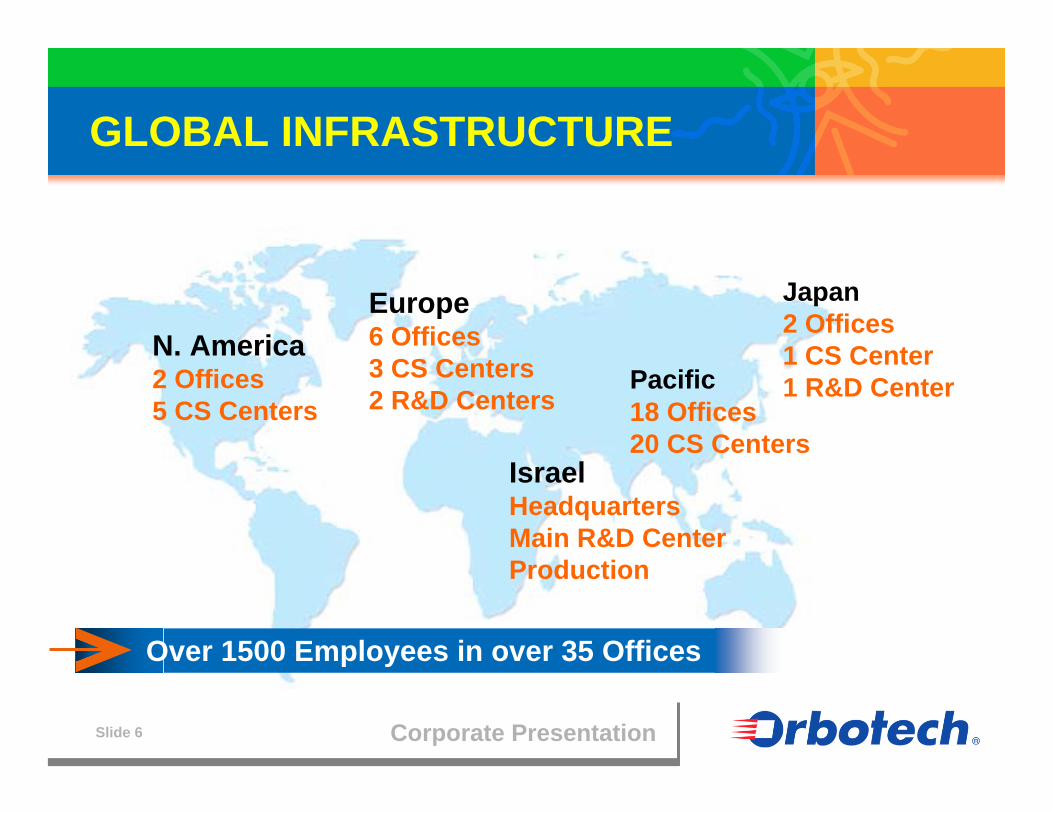
GLOBAL INFRASTRUCTURE
IsraelHeadquartersMain R&D CenterProduction
Europe6 Offices 3 CS Centers2 R&D Centers
N. America2 Offices 5 CS Centers
Japan2 Offices1 CS Center 1 R&D CenterPacific
18 Offices 20 CS Centers
Over 1500 Employees in over 35 Offices
Corporate PresentationSlide 7
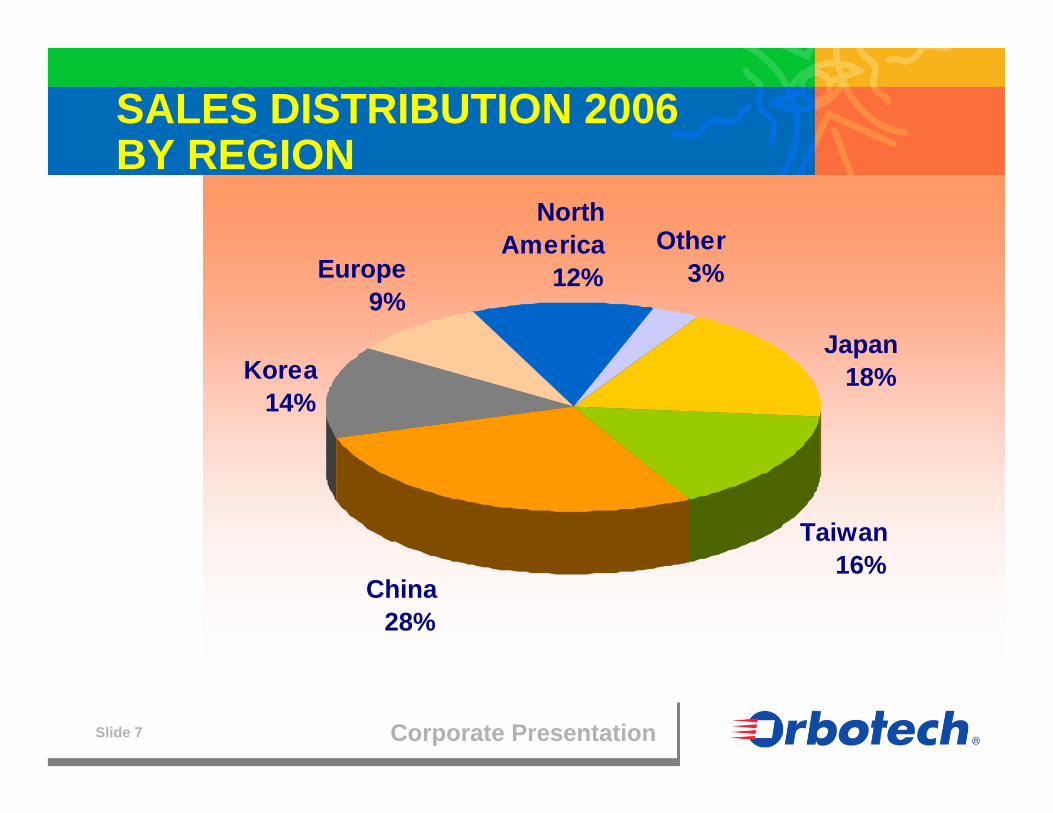
Europe9%
North America
12%Other
3%
Korea14%
Taiwan16%
Japan18%
China28%
SALES DISTRIBUTION 2006BY REGION

Corporate PresentationSlide 8
90% of current product sales are from products introduced over the last 24 monthsOver 400 Scientists and EngineersOver $60M annual R&D budget
R&D INVESTMENT

Corporate PresentationSlide 9
New
technologiesfor core m
arkets
AOI
CAM
DirectImaging
Plotting
New Technologies
GROWTH STRATEGY
BarePCBs
NewMarkets
Flat-PanelDisplays
YieldManagement
Metrology
AssembledPCBs
Corporate PresentationSlide 10
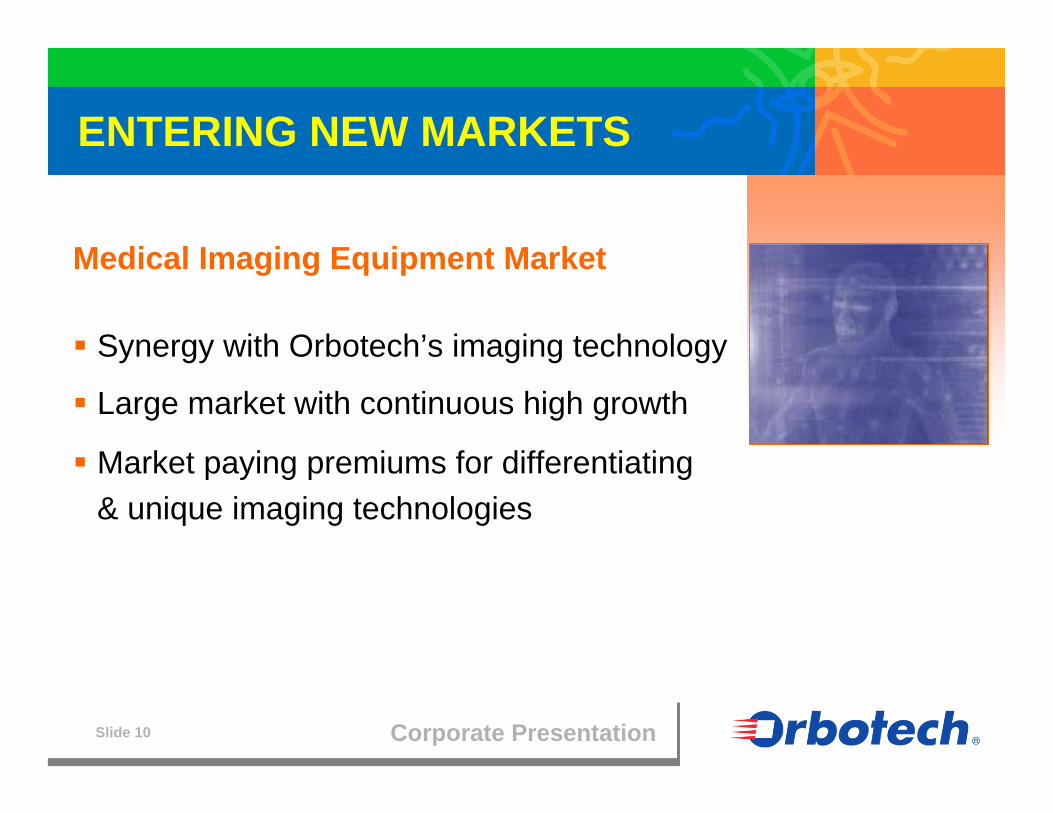
Medical Imaging Equipment Market
Synergy with Orbotech’s imaging technology
Large market with continuous high growth
Market paying premiums for differentiating & unique imaging technologies
ENTERING NEW MARKETS

Corporate PresentationSlide 11
ORBOTECH MEDICAL SOLUTIONS
Acquisition of Imarad Imaging Systems
Sensors for detection of Gamma Radiation using CZT
Initial market opportunity: the fast growing cardio-nuclear medicine camera
Total potential market for CZT sensors in 2010 > $250M

Bare PCB Production

Corporate PresentationSlide 13
BARE PCB PRODUCTION
Automated Optical Inspection (AOI)
Laser Direct Imaging (LDI)
Laser Plotting
Computer Aided Manufacturing (CAM)
Orbotech is the world leader in

Corporate PresentationSlide 14
Expected growth of 5-7% in next few years
Over 80% of the market in the Far East
- China is world’s largest PCB producer
Aggressive expansion plans
Cell phones driving the industry
- Over 1BN phones in 2007
Fastest growing segments: microvia, IC substrates, flex
BARE PCB MARKET SUMMARY

Corporate PresentationSlide 15
MISSION & KEY OBJECTIVES
PCB Division MissionImproving yields and productivity through technology and people
Key ObjectivesBe the first choice supplier of advanced solutions for the PCB industry
Continue to develop innovative technologies for the PCB industry
Corporate PresentationSlide 16
STRATEGY FUNDAMENTALS
Aim for business & technology leadership
Customer support is a major contributor to our business
Improve net contribution by focus on cost reduction & efficiency
Focus on growth
Corporate PresentationSlide 17
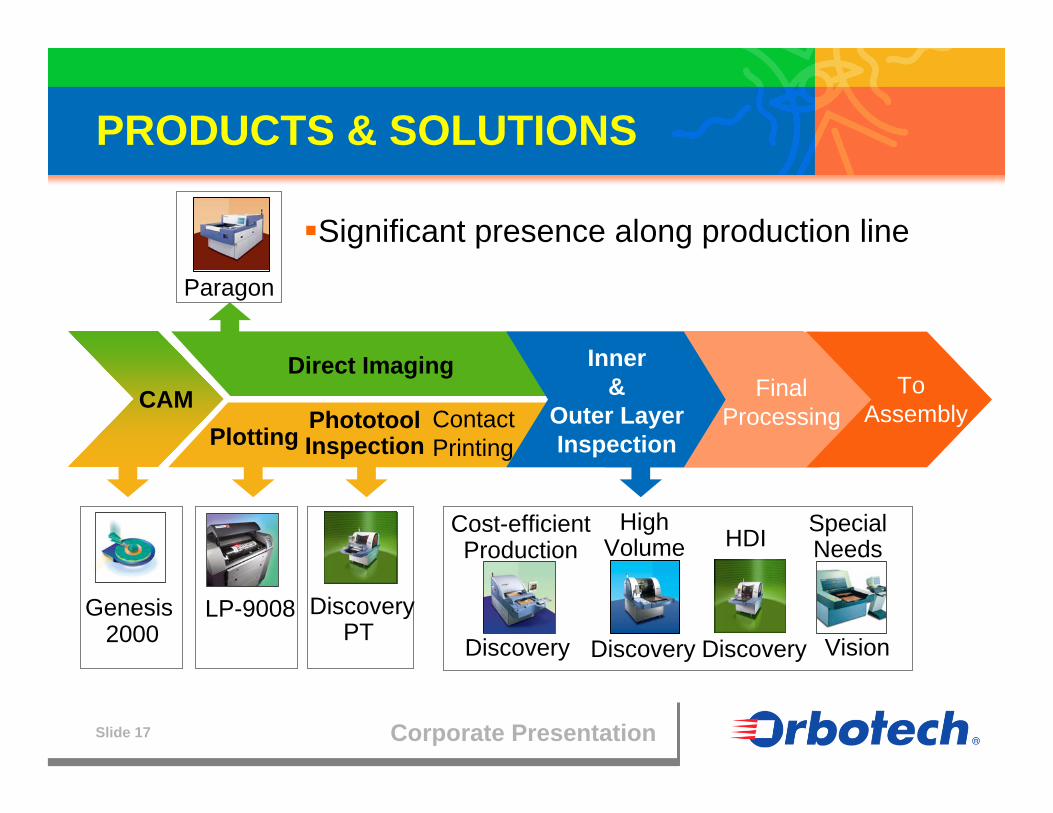
PRODUCTS & SOLUTIONS
PhototoolInspectionPlotting
Contact Printing
Direct ImagingCAM
Inner &
Outer LayerInspection
Final Processing
ToAssembly
Genesis 2000
LP-9008
HDI
Discovery
High Volume
DiscoveryDiscovery
Cost-efficientProduction
Vision
Special Needs
DiscoveryPT
Paragon
Significant presence along production line

Corporate PresentationSlide 18
DISCOVERY™
Industry’s Best Selling AOI
Simple with Push-to-Scan™- The easiest AOI solution in the industry
Intelligent with Visual Intelligence™- Detect all you want and only what you want
Powerful impact with new AOI economics- Maximum output with maximum availability
Over 600 sold worldwide in the last 18 months

Corporate PresentationSlide 19
PARAGON™
Industry’s Only Field Proven Laser Direct Imaging (LDI) SystemEnabling technology for complex and advanced applicationsIncreased adoption for high-end mainstream applicationsAdditional opportunities in packaging and solder maskFuture direction: higher resolution and throughput
Over 200 LDI systems sold worldwide

Corporate PresentationSlide 20
ORBOTECH LDI CUSTOMERS Cell Phone Applications
Used by most of the top cell phone makers

PCB Assembly

Corporate PresentationSlide 22
PCB ASSEMBLY
Orbotech is a leading provider of
Automated Optical Inspection
Process Control Software

Corporate PresentationSlide 23
MARKET SUMMARY
EMS and ODM market will reach $227B (TFI 10/2005), high growth > 12% from outsourcing
Volume production will continue to concentrate in China
Low volume & automotive will continue to be in Europe, USA and Japan
Overall AOI market > $470M in 2008 (PRG 9/2005)
Corporate PresentationSlide 24
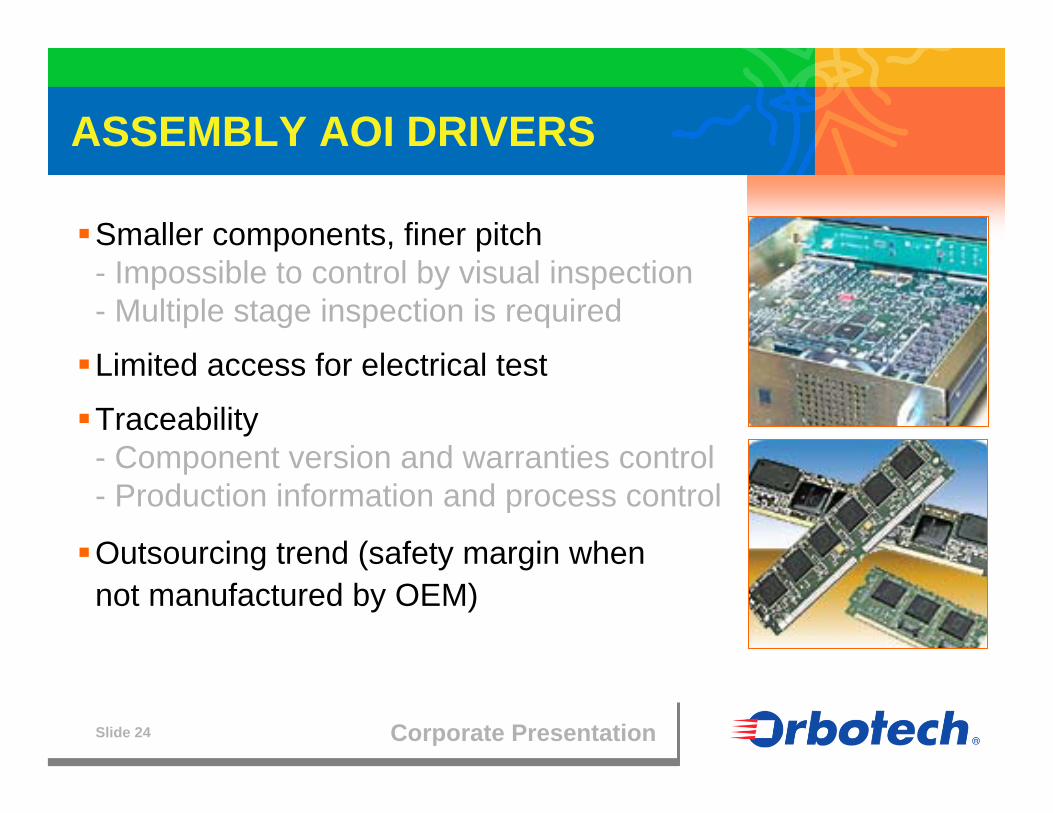
ASSEMBLY AOI DRIVERS
Smaller components, finer pitch- Impossible to control by visual inspection- Multiple stage inspection is required
Limited access for electrical test
Traceability- Component version and warranties control- Production information and process control
Outsourcing trend (safety margin when not manufactured by OEM)
Corporate PresentationSlide 25
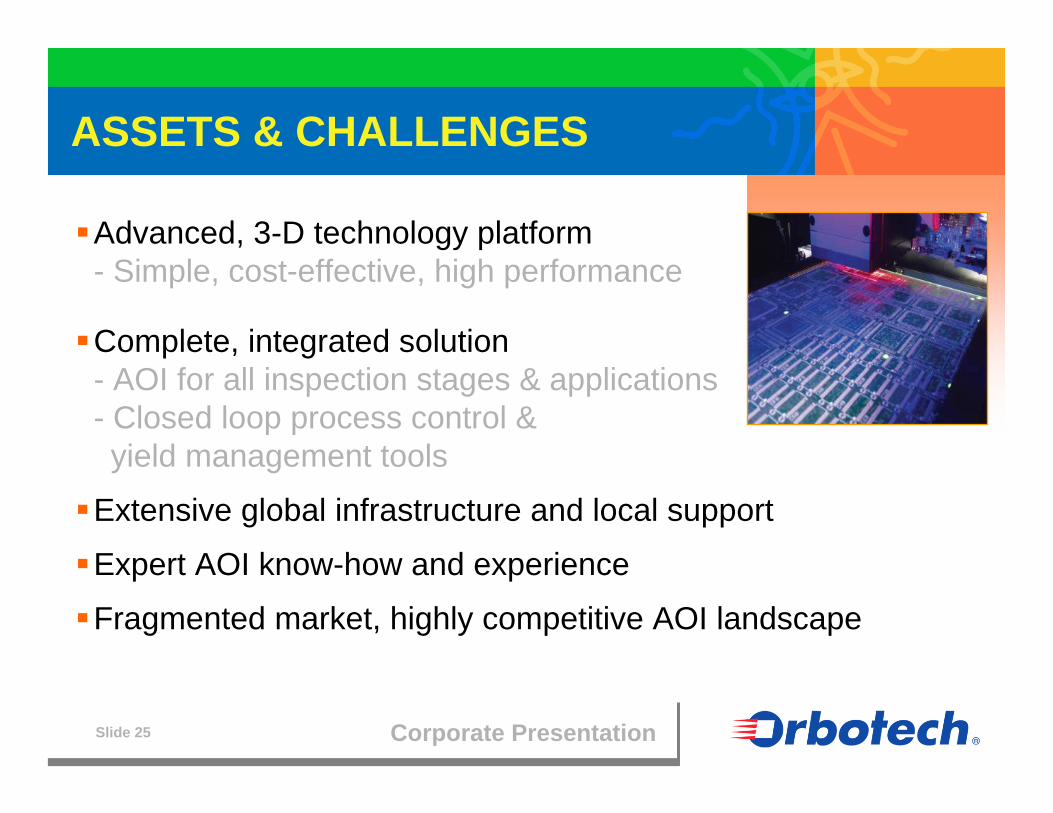
ASSETS & CHALLENGES
Advanced, 3-D technology platform - Simple, cost-effective, high performance
Complete, integrated solution- AOI for all inspection stages & applications- Closed loop process control & yield management tools
Extensive global infrastructure and local support
Expert AOI know-how and experience
Fragmented market, highly competitive AOI landscape

Corporate PresentationSlide 26
Placement & Post Reflow Inspection
PRODUCTS & SOLUTIONS
Symbion P36
ADVISOR - Process Control Tools
Paste Printer IC Mounter Reflow OvenChip Shooter
Paste Inspection
Symbion S36 Vantage S22
VeriFastVerification& Repair
VeriFastVerification& Repair

Corporate PresentationSlide 27
SYMBION™ SERIES
New generation solder paste and post-reflow AOI systems
Specialized 3-D & 2-D detection
Very simple operation
Ultra-fast speed
Integrated process control software
Over 230 new generation systems sold worldwide

Flat Panel Display Manufacturing

Corporate PresentationSlide 29
FPD MANUFACTURING
Orbotech is the world’s leading provider of
Yield Management
Automated Optical Inspection

Corporate PresentationSlide 30
ORBOTECH PRESENCE
Presence at all LCD fabs
Proven solutions for all generations
Future-proof technology: OLED, plastic-based & other specialties

Corporate PresentationSlide 31
MARKET SUMMARY
Main driver for investments is LCD TV growth
Analysts & manufacturers continue upward revisions
Main results- Continued glass growth due to cost effectiveness- Continued quality and yield management emphasis- Increased importance of Orbotech in process
Fab cost = > $3B

Corporate PresentationSlide 32
IMPLICATIONS OF LARGE-SIZE TV
TV Market
Image Quality
Cheaper
Larger
Yield Management
More & NewTest Methods
Rigorous QA& Repair
Cost-EffectiveProcess Control
FPD product strategy requires an integrated, multi-function yield management solution
Manufacturing
Complex Design
MinimizeHandling
HugeGlass

Corporate PresentationSlide 33
Micro Defect Detection
Metrology and Macro Inspection
OFFERING A COMPREHENSIVE SOLUTION

Corporate PresentationSlide 34
ORBOTECH CONNECTS IT ALL
30 fabs already implemented the EYES-2020 solutionAll new fabs purchase EYES-2020 with AOI systems
EYES 2020™
AOIAOI
AOIAOI
Defect Location
Classify Defects
CD Measurement
Layer Comparison

Corporate PresentationSlide 35
Bare Glass
Completed Array
EYES-2020
FPI-6590
FPI-7598
InVision
PRODUCTS & SOLUTIONS
Pointer
SuperVision
Deposition
Clean & Strip
Photo Coat Expose Develop
Etch
(Wet/Dry)

Corporate PresentationSlide 36
RECENT SUCCESSES
Metrology success- CD/O on AOI installation big success in G7 Korean TV FAB
- Won customer appreciation & recognition
Record implementation- World’s first G8 AOI installation - record time- Customer praised quick contribution to their ramp-up
Reflecting our leadership in technology and performance

Customer Support

Corporate PresentationSlide 39
CUSTOMER SUPPORT
Strategic & necessary for customer relationships
Differentiating factor vs. our competition
20% of our revenue
Source of recurring revenue
Consistent contributor to profitability
On-going presence at customer sites

Corporate PresentationSlide 40
CUSTOMER SUPPORT INFRASTRUCTURE
Over 500 employees in 35 countries
Supporting over5000 AOI systems,600 Plotters, 200 LDI and 4000 CAM stations
5 response centers, 5 customer training centers

Corporate PresentationSlide 41
CUSTOMER SUPPORT SERVICES
Response centersTraining centersRemote accessSoftware upgrades & ECOsSpare parts inventoriesApplication supportConsulting and site auditsPreventive maintenanceLocal satellite officesLocal adaptation

Corporate PresentationSlide 42
CUSTOMER SUPPORT EXAMPLE:RESPONSE CENTERS
Convenient, efficient “hotline”Expert-level staffRemote diagnostic capabilitiesMany calls closed over the phoneDispatched calls for on-site service with diagnostic information
Increases customer satisfaction and our profitability

Financials

Corporate PresentationSlide 44
REVENUES
($ Millions)
163.0
65.4
245.6
69.2
303.3
76.6
333.3
83.1
0.0
50.0
100.0
150.0
200.0
250.0
300.0
350.0
400.0
2003 2004 2005 2006
ServiceSales
228.4
315.2
379.9416.5

Corporate PresentationSlide 45
REVENUES BY QUARTER
($ Millions)
67.2
100.5 101.4
77.5
89.3
104.9
82.793.7
106.9
87.896.4
103.3
0
20
40
60
80
100
120
Q1 Q2 Q3 Q4
200420052006

Corporate PresentationSlide 46
NET INCOME
0.23
0.99
1.30
1.75
0
0.2
0.4
0.6
0.8
1
1.2
1.4
1.6
1.8
2003 2004 2005 2006
($ per share) from ongoing operations1.91 (Excluding option expense)

Corporate PresentationSlide 47
NET INCOME BY QUARTER
($ per share) from ongoing operations
0.15
0.32
0.43
0.260.29
0.46
0.290.33
0.49
0.290.360.38
0
0.1
0.2
0.3
0.4
0.5
0.6
0.7
0.8
Q1 Q2 Q3 Q4
2004
2005
2006

Corporate PresentationSlide 48
MARGIN ANALYSIS
42.7 44.0 43.0 45.5
0
10
20
30
40
50
2003 2004 2005 2006
3.3
11.2 12.0
14.3
02468
10121416
2003 2004 2005 2006
3.5
10.311.4
14.0
0
2
4
6
8
10
12
14
2003 2004 2005 2006
Gross Margin(On-going Operations)
Operating Income(On-going Operations) (On-going Operations)
Net Income

Corporate PresentationSlide 49
11.4
43.0
75
120
4.2
12/31 2005
3.510.314.0Net Profit to Revenues(% ongoing operations)
42.744.045.5Gross Profit (%)
767377Equity/Assets (%)
134118126Day’s Sales Outstanding
4.43.84.6Current Ratio
12/312003
12/312004
12/312006
FINANCIAL RATIOS

Corporate PresentationSlide 50