Sleep replay reveals premotor circuit structure for a ...
16
Article Sleep replay reveals premotor circuit structure for a skilled behavior Graphical abstract Highlights d Thalamic lesions eliminate singing behavior and underlying network dynamics d High-density recordings reveal reemergence of song activity during sleep d Temporal dynamics during sleep are controlled by premotor nucleus HVC d Structure of sleep replay events highlights role of local HVC connectivity Authors Margot Elmaleh, Devorah Kranz, Ariadna Corredera Asensio, Felix W. Moll, Michael A. Long Correspondence [email protected] In brief Elmaleh et al. use high-density recordings to measure the activity of the song control pathway in the zebra finch. They precisely decode snippets of song-related activity during sleep and leverage these ‘‘offline’’ dynamics to test three models of network connectivity responsible for sequence generation. Elmaleh et al., 2021, Neuron 109, 1–11 December 1, 2021 ª 2021 Elsevier Inc. https://doi.org/10.1016/j.neuron.2021.09.021 ll
Transcript of Sleep replay reveals premotor circuit structure for a ...

Article
Sleep replay reveals prem
otor circuit structure for askilled behaviorGraphical abstract
Highlights
d Thalamic lesions eliminate singing behavior and underlying
network dynamics
d High-density recordings reveal reemergence of song activity
during sleep
d Temporal dynamics during sleep are controlled by premotor
nucleus HVC
d Structure of sleep replay events highlights role of local HVC
connectivity
Elmaleh et al., 2021, Neuron 109, 1–11December 1, 2021 ª 2021 Elsevier Inc.https://doi.org/10.1016/j.neuron.2021.09.021
Authors
Margot Elmaleh, Devorah Kranz,
Ariadna Corredera Asensio,
Felix W. Moll, Michael A. Long
In brief
Elmaleh et al. use high-density recordings
tomeasure the activity of the song control
pathway in the zebra finch. They precisely
decode snippets of song-related activity
during sleep and leverage these ‘‘offline’’
dynamics to test three models of network
connectivity responsible for sequence
generation.
ll

Please cite this article in press as: Elmaleh et al., Sleep replay reveals premotor circuit structure for a skilled behavior, Neuron (2021), https://doi.org/10.1016/j.neuron.2021.09.021
ll
Article
Sleep replay reveals premotor circuitstructure for a skilled behaviorMargot Elmaleh,1,2 Devorah Kranz,1,2 Ariadna Corredera Asensio,1,2 Felix W. Moll,1,2 and Michael A. Long1,2,3,*1NYU Neuroscience Institute and Department of Otolaryngology, New York University Langone Medical Center, New York, NY 10016, USA2Center for Neural Science, New York University, New York, NY 10003, USA3Lead contact
*Correspondence: [email protected]://doi.org/10.1016/j.neuron.2021.09.021
SUMMARY
Neural circuits often exhibit sequences of activity, but the contribution of local networks to their generationremains unclear. In the zebra finch, song-related premotor sequenceswithin HVCmay result from some com-bination of local connectivity and long-range thalamic inputs from nucleus uvaeformis (Uva). Because lesionsto either structure abolish song, we examine ‘‘sleep replay’’ using high-density recording methods to recon-struct precise song-related events. Replay activity persists after the upstream nucleus interfacialis of the ni-dopallium is lesioned and slowswhenHVC is cooled, demonstrating that HVCprovides temporal structure forthese events. To further gauge the importance of intra-HVC connectivity for shaping network dynamics, welesion Uva during sleep and find that residual replay sequences could span syllable boundaries, supporting amodel in which HVC can propagate sequences throughout the duration of the song. Our results highlight thepower of studying offline activity to investigate behaviorally relevant circuit organization.
INTRODUCTION
Neuronal sequences have been proposed to perform important
functions in many brain regions, such as navigation (Skaggs
et al., 1996), time generation (MacDonald et al., 2011; Pastalkova
et al., 2008), decision making (Harvey et al., 2012; Schmitt et al.,
2017), and skilledmovement (Peters et al., 2014). The zebra finch
has emerged as an excellent model system for studying the
mechanisms underlying neural sequences that drive a well-
defined complex behavior (Hahnloser et al., 2002). Through
months of intensive practice (Tchernichovski et al., 2001), male
zebra finches learned to produce a highly stereotyped courtship
song consisting of a repeated series of 2 to 7 distinct vocal ele-
ments called syllables. During singing, a sparse sequence of ac-
tivity is generated within the forebrain nucleus HVC (proper
name) in which each premotor neuron produces a single high-
frequency burst of spikes (duration: �10 ms) (Hahnloser et al.,
2002; Kozhevnikov and Fee, 2007); as a population, these neu-
rons form a temporally precise (jitter with respect to song:
<1 ms) neural sequence tiling the length of the song (Egger
et al., 2020; Lynch et al., 2016; Picardo et al., 2016; Figure 1A).
HVC activity is then sent to the robust nucleus of the arcopallium
(RA) and ultimately to motor neurons and song-production
musculature (Wild, 1993; Figure 1B).
Previous electrophysiological (Kosche et al., 2015;Mooney and
Prather, 2005) and ultrastructural (Kornfeld et al., 2017) work has
demonstrated that premotor HVC neurons form synapses with
each other, and these local axon collaterals have been proposed
to act as ameansof propagating activity by sequentially activating
premotor neurons during song (Egger et al., 2020; Fee et al., 2004;
Longet al., 2010). In addition, local circuitGABAergic interneurons
(Scotto-Lomasseseetal., 2007;Wildetal., 2005)provide inhibition
that may also contribute to premotor patterning (Gibb et al., 2009;
Kosche et al., 2015; Markowitz et al., 2015).
Along with this intrinsic circuitry, HVC receives input from a
multi-region feedback loop dedicated to song production. Feed-
back signalsmust pass through the vocal thalamic nucleus uvae-
formis (Uva) that projects both directly to HVC and indirectly via a
cortical sensorimotor region known as the nucleus interfacialis of
the nidopallium (NIf) (Figure 1B; Coleman and Mooney, 2004;
Hahnloser and Fee, 2007; Hahnloser et al., 2008; Reinke and
Wild, 1998; Striedter and Vu, 1998). Together, NIf and Uva pro-
vide the two important sources of external input to HVC. While
NIf has been demonstrated to be important for song learning in
juvenile birds (Mackevicius et al., 2020; Roberts et al., 2012;
Zhao et al., 2019), it does not play a critical role in adult song pro-
duction; complete lesions of NIf only temporarily perturb singing
(Cardin et al., 2005; Otchy et al., 2015). In contrast, lesions to
either HVC or Uva can permanently abolish song production (Co-
leman and Vu, 2005; Danish et al., 2017; Nottebohm et al., 1976;
Williams and Vicario, 1993). A clear understanding of how local
connectivity and external inputs (e.g., from Uva) work together
to enable sequence generation and propagation in HVC remains
elusive (Andalman et al., 2011; Galvis et al., 2017; Hamaguchi
et al., 2016; Long et al., 2010). A similar barrier also exists in
many other systems, where elimination of either cortical or
Neuron 109, 1–11, December 1, 2021 ª 2021 Elsevier Inc. 1
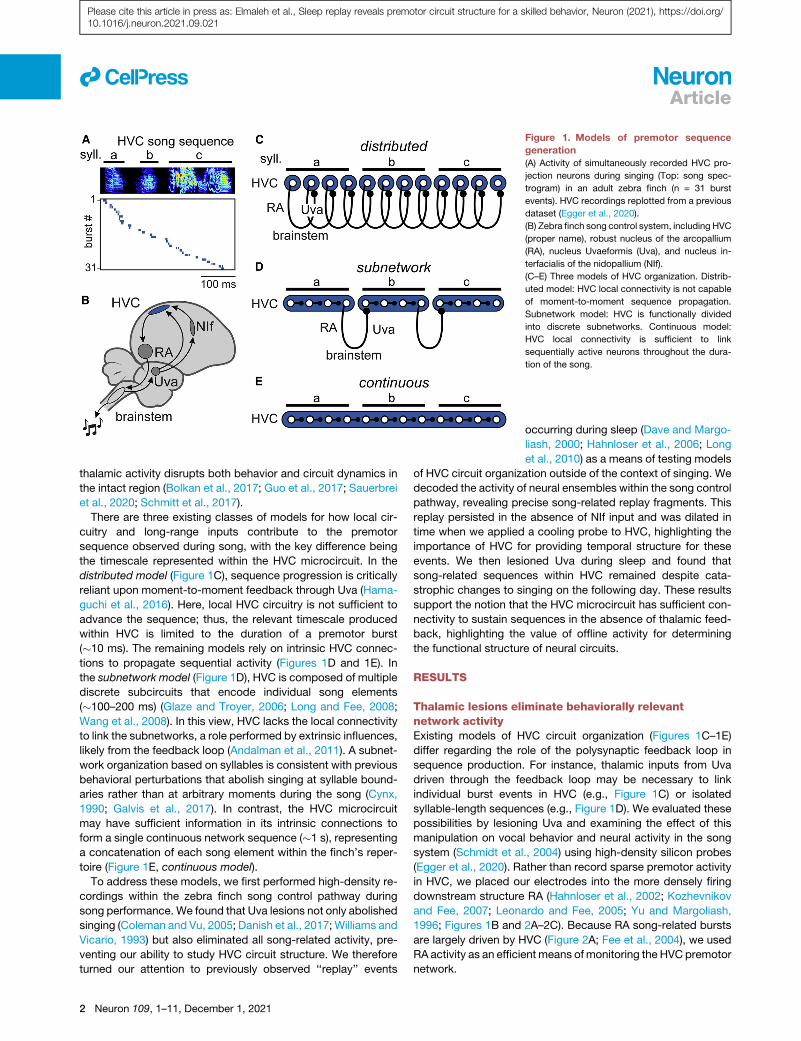
Figure 1. Models of premotor sequence
generation
(A) Activity of simultaneously recorded HVC pro-
jection neurons during singing (Top: song spec-
trogram) in an adult zebra finch (n = 31 burst
events). HVC recordings replotted from a previous
dataset (Egger et al., 2020).
(B) Zebra finch song control system, including HVC
(proper name), robust nucleus of the arcopallium
(RA), nucleus Uvaeformis (Uva), and nucleus in-
terfacialis of the nidopallium (NIf).
(C–E) Three models of HVC organization. Distrib-
uted model: HVC local connectivity is not capable
of moment-to-moment sequence propagation.
Subnetwork model: HVC is functionally divided
into discrete subnetworks. Continuous model:
HVC local connectivity is sufficient to link
sequentially active neurons throughout the dura-
tion of the song.
llArticle
Please cite this article in press as: Elmaleh et al., Sleep replay reveals premotor circuit structure for a skilled behavior, Neuron (2021), https://doi.org/10.1016/j.neuron.2021.09.021
thalamic activity disrupts both behavior and circuit dynamics in
the intact region (Bolkan et al., 2017; Guo et al., 2017; Sauerbrei
et al., 2020; Schmitt et al., 2017).
There are three existing classes of models for how local cir-
cuitry and long-range inputs contribute to the premotor
sequence observed during song, with the key difference being
the timescale represented within the HVC microcircuit. In the
distributed model (Figure 1C), sequence progression is critically
reliant upon moment-to-moment feedback through Uva (Hama-
guchi et al., 2016). Here, local HVC circuitry is not sufficient to
advance the sequence; thus, the relevant timescale produced
within HVC is limited to the duration of a premotor burst
(�10 ms). The remaining models rely on intrinsic HVC connec-
tions to propagate sequential activity (Figures 1D and 1E). In
the subnetwork model (Figure 1D), HVC is composed of multiple
discrete subcircuits that encode individual song elements
(�100–200 ms) (Glaze and Troyer, 2006; Long and Fee, 2008;
Wang et al., 2008). In this view, HVC lacks the local connectivity
to link the subnetworks, a role performed by extrinsic influences,
likely from the feedback loop (Andalman et al., 2011). A subnet-
work organization based on syllables is consistent with previous
behavioral perturbations that abolish singing at syllable bound-
aries rather than at arbitrary moments during the song (Cynx,
1990; Galvis et al., 2017). In contrast, the HVC microcircuit
may have sufficient information in its intrinsic connections to
form a single continuous network sequence (�1 s), representing
a concatenation of each song element within the finch’s reper-
toire (Figure 1E, continuous model).
To address these models, we first performed high-density re-
cordings within the zebra finch song control pathway during
song performance. We found that Uva lesions not only abolished
singing (Coleman and Vu, 2005; Danish et al., 2017; Williams and
Vicario, 1993) but also eliminated all song-related activity, pre-
venting our ability to study HVC circuit structure. We therefore
turned our attention to previously observed ‘‘replay’’ events
2 Neuron 109, 1–11, December 1, 2021
occurring during sleep (Dave and Margo-
liash, 2000; Hahnloser et al., 2006; Long
et al., 2010) as a means of testing models
of HVC circuit organization outside of the context of singing. We
decoded the activity of neural ensembles within the song control
pathway, revealing precise song-related replay fragments. This
replay persisted in the absence of NIf input and was dilated in
time when we applied a cooling probe to HVC, highlighting the
importance of HVC for providing temporal structure for these
events. We then lesioned Uva during sleep and found that
song-related sequences within HVC remained despite cata-
strophic changes to singing on the following day. These results
support the notion that the HVC microcircuit has sufficient con-
nectivity to sustain sequences in the absence of thalamic feed-
back, highlighting the value of offline activity for determining
the functional structure of neural circuits.
RESULTS
Thalamic lesions eliminate behaviorally relevantnetwork activityExisting models of HVC circuit organization (Figures 1C–1E)
differ regarding the role of the polysynaptic feedback loop in
sequence production. For instance, thalamic inputs from Uva
driven through the feedback loop may be necessary to link
individual burst events in HVC (e.g., Figure 1C) or isolated
syllable-length sequences (e.g., Figure 1D). We evaluated these
possibilities by lesioning Uva and examining the effect of this
manipulation on vocal behavior and neural activity in the song
system (Schmidt et al., 2004) using high-density silicon probes
(Egger et al., 2020). Rather than record sparse premotor activity
in HVC, we placed our electrodes into the more densely firing
downstream structure RA (Hahnloser et al., 2002; Kozhevnikov
and Fee, 2007; Leonardo and Fee, 2005; Yu and Margoliash,
1996; Figures 1B and 2A–2C). Because RA song-related bursts
are largely driven by HVC (Figure 2A; Fee et al., 2004), we used
RA activity as an efficient means ofmonitoring the HVC premotor
network.

Figure 2. Thalamic lesions eliminate motor-related signals in the song production pathway
(A) Schematic (adapted from Fee et al., 2004) depicts the transformation of the sparse HVC sequence to a dense RA representation due to synaptic convergence.
Recordings in panels (B), (C), and (F–I) performed within RA, a downstream target of HVC.
(B) Spiking activity from 60 simultaneously recorded RA neurons during 3 successive songs.
(C) Song-aligned spiking activity from 8 example neurons in (B).
(D and E) Retrogradely labeled cell bodies in NIf and Uva following dextran injection into HVC in (D) intact and (E) Uva-lesioned brains. White arrows highlight Uva
axons. Red dashed line in (E) shows lesion border. White dashed line represents estimated location of Uva before lesion.
(F and G) Top: annotated spectrograms of vocalizations (F) before and (G) after lesion for Bird C42 (i: introductory note, asterisk: attempted song vocalizations).
Bottom: spiking activity for 47 simultaneously recorded RA neurons. Spectrogram elements representing cage noise and female vocalizationswere removed post
hoc for visual clarity.
(H and I) Top: two example introductory notes from Bird C42, expanded from yellow and red boxes in (F) and (G), respectively. Bottom: introductory note aligned
spike rasters (H) before and (I) after Uva lesion. Instantaneous firing rate for all trials shown below. Black line: mean. White dashed lines (top) and gray shaded
region (bottom) indicate duration of vocal element.
(J) Fraction of song-related spikes meeting burst criteria for Bird C42 (n = 47 neurons) before (black) and after (red) Uva lesion (Wilcoxon sign rank: p < 0.0001).
(legend continued on next page)
llArticle
Neuron 109, 1–11, December 1, 2021 3
Please cite this article in press as: Elmaleh et al., Sleep replay reveals premotor circuit structure for a skilled behavior, Neuron (2021), https://doi.org/10.1016/j.neuron.2021.09.021

llArticle
Please cite this article in press as: Elmaleh et al., Sleep replay reveals premotor circuit structure for a skilled behavior, Neuron (2021), https://doi.org/10.1016/j.neuron.2021.09.021
We found that Uva lesions had a profound impact on both
behavior and motor-related activity (Figures 2D–2M). In agree-
ment with previous studies (Coleman and Vu, 2005; Danish
et al., 2017; Williams and Vicario, 1993), birds were unable to
produce normal song following Uva ablation (Figure 2G), though
introductory notes—distinct vocalizations which precede
song—were considerably less affected (Figures 2F–2I). Impor-
tantly, song-related bursting events (e.g., Figure 2F) were
eliminated following Uva lesions (e.g., Figures 2G, 2J, and 2K;
proportion of burst spikes: 0.86 ± 0.15 control; 0.02 ± 0.04
lesion). Instead, RA neurons exhibited regular firing patterns typi-
cally found outside the context of vocalization (Figure 2F; Leo-
nardo and Fee, 2005; Yu and Margoliash, 1996), which are likely
the result of intrinsic cellular properties (Mooney, 1992). Unlike
burst events, the tonic firing patterns lacked trial-to-trial regular-
ity across vocalizations (control: r = 0.66 ± 0.20; Uva lesion: r =
0.07 ± 0.09) (Figures 2H, 2I, 2L, and 2M). These data indicate
that, in addition to strongly perturbing singing behavior, lesions
to the motor thalamic nucleus Uva result in a complete disap-
pearance of patterned premotor activity during vocal production,
rendering us unable to test the previously introduced models
regarding the functional organization of HVC (Figures 1C–1E).
Robust song-related replay occurs during sleepTo assess the contribution of local circuit connectivity to the
propagation of neural sequences, we needed an assay in which
the structure of behaviorally relevant network activity could be
examined following thalamic ablation. The lack of such dynamics
during vocalization prompted us to consider sleep activity, which
has been shown to display episodes of burst-firing in single neu-
rons resembling patterns observed during song in the zebra finch
(Dave and Margoliash, 2000; Hahnloser et al., 2002; Long et al.,
2010). Singing and sleep are vastly different states in which dy-
namics are strongly influenced by changes in neuromodulatory
tone (Cardin and Schmidt, 2004; Schmidt and Konishi, 1998).
However, the stability of singing (Deregnaucourt et al., 2005;
Lombardino and Nottebohm, 2000) and related neural activity
(Katlowitz et al., 2018; Rauske et al., 2010) from one day to the
next in the adult zebra finch provides the foundation to leverage
sleep as a means of examining network organization within the
song control pathway.
We used our multielectrode probe to measure activity during
singing (Figures 3A and 3B) and sleep (Figures 3C and 3D) in
both HVC and RA. Indeed, both regions exhibited population ac-
tivity during sleep that highly resembled that observed during
song, supporting the notion that song-related replay is a
network-wide event (Fee et al., 2004; Hahnloser and Fee,
2007). We found that RA recordings provided a more precise
means of estimating the position of sleep replay events with
respect to song (3.2 ± 1.1 ms) than those in HVC (62.5 ±
52.8 ms) (see STAR Methods; Figure 3E) despite having re-
(K) Population data of the fraction of song-related spikes meeting burst criteria for
birds (n = 375 neurons; 62.5 ± 27 neurons per bird) (Wilcoxon rank sum test: p <
(L) Average Pearson correlation scores across instantaneous firing rates during i
(M) Population data of average Pearson correlation scores during introductory n
neurons; Wilcoxon rank sum: p < 0.0001).
(L and M) Neurons with fewer than two spikes on average per trial were exclude
4 Neuron 109, 1–11, December 1, 2021
corded a similar number of neurons in each structure (RA:
52.1 ± 14.8 cells/bird, 8 birds; HVC projection neurons: 49.6 ±
17.6 cells/bird, 5 birds). Distinguishing between our models (Fig-
ures 1C–1E) requires a highly precise measurement of replayed
song activity in the temporal domain (�10 ms, or roughly the
duration of an HVC burst). We therefore used RA recordings to
decode activity in the zebra finch motor pathway during sleep.
We directly compared the activity of RA neurons in four birds
during sleep and singing by recording for 15.3 ± 2.2 h, including
a continuous dark period (9.7 ± 0.9 h) when birds spent the ma-
jority of time sleeping, and RA exhibited typical ‘‘sleep bursts’’
(Dave and Margoliash, 2000; Hahnloser et al., 2006). We first
tested whether individual neurons could be recorded continu-
ously during this period using our high-density recording
approach. In addition to our spike-sorting protocol (see STAR
Methods), the unique electrophysiological properties of RA neu-
rons provided further evidence for recording stability. Because
each RA neuron exhibits its own invariant pattern of bursting dur-
ing vocalization (or temporal ‘‘barcode’’) (e.g., Figure S1; Leo-
nardo and Fee, 2005; Yu and Margoliash, 1996), we could
directly compare song-related activity before and after the sleep
session (Rauske et al., 2010). In all cases, we found the activity of
individual RA neurons was preserved (Figure S1), confirming that
neurons could be stably recorded throughout the duration of our
experiment.
To precisely decode the song content of network activity dur-
ing sleep, we used a template-matching strategy in which candi-
date sleep ‘‘replay’’ epochs (Figure 3D, arrows)—defined by the
presence of high-frequency bursts (see STAR Methods)—were
discretized into 6-ms bins and compared to population activity
recorded during song (Figure S2). Often, sequential bins re-
corded during sleep closely resembled sequential bins of the
song template, allowing us to detect and analyze population-
wide sleep replay events (Figures 3F, 3G, and S2; see STAR
Methods). Population activity during replay events was highly
correlated with that observed during song (median: 0.74; inter-
quartile range: 0.65–0.83), approaching the degree of regularity
observed across different song renditions (median: 0.82;
interquartile range: 0.74–0.90) and considerably greater than ex-
pected by chance (median: 0.00; interquartile range:�0.11–0.12)
(n = 7 birds) (Figure S2K). A direct comparison of template corre-
lation values reveals that sleep events have 89.9% ± 2.8% of the
precision inherent in song events (Figure S2L). Single replay
events occurred with a frequency of 11.3 ± 7.9 events/min (Fig-
ure 3H). These events rarely spanned the entire length of the
song (range: 0.51–0.95 s) and instead formed shorter sequence
fragments (interquartile range: 56–140ms) (Figure 3I) (n = 4birds).
We observed that the network progressed forward through the
song sequence during sleep at nearly the same speed as it did
during song itself (replay event slope: 0.96 ± 0.08; n = 26,215
events from 4 birds) (Figure 3J), which is in contrast to the
10 intact birds (n = 445 neurons; 49.4 ± 16 neurons per bird) and 6 Uva lesioned
0.0001).
ntroductory notes for Bird C42 (Wilcoxon sign rank: p < 0.0001).
otes for 10 intact birds (n = 399 neurons) and 6 Uva lesioned birds (n = 344
d from this analysis. (K and M) Histograms show mean ± SEM.

Figure 3. Song-related activity during sleep in HVC and RA
(A–D) Simultaneously recorded spiking activity of 11 HVC projection neurons and 76 RA neurons during (A and B) song and (C and D) sleep. Arrows in (C) indicate
position of example replay sequences to the right.
(E) Temporal certainty from 8 RA (magenta) and 5 HVC (blue) datasets (see STAR Methods). Dashed line (10 ms) represents the threshold for testing functional
models described in Figure 1.
(F) Templatematching applied to RA activity in (D). Each data point is aligned to the assigned bin of song template (y axis), and color indicates Pearson correlation
score. Detected events fitted by purple line. Inset: template matching results from event 6 (indicated by black dashed square).
(G) Binarized bursting activity for replay event 2 from (D) compared with the assigned fragment of the song from (B).
(H–J) Characterization of replay event frequency during each 1-min period of the recording (H) as well as the replay length (I) and slope (J) for 4 birds.
See also Figures S1–S3.
llArticle
Please cite this article in press as: Elmaleh et al., Sleep replay reveals premotor circuit structure for a skilled behavior, Neuron (2021), https://doi.org/10.1016/j.neuron.2021.09.021
temporally compressed (slope: >1) and reversed (slope: <0)
replay events observed in the rodent hippocampus (Diba and
Buzsaki, 2007; Lee and Wilson, 2002; Wilson and McNaughton,
1994) and consistent with the lack of temporal distortion of replay
observed during REM sleep (Louie and Wilson, 2001). Unlike
what occurs during song production,where sequence start times
are limited to syllable boundaries, we found that sleep replay
events are initiated throughout the entirety of the song (Figure S3)
(88.5%±7.7%of analyzed timebins; n=4birds). Taken together,
these observations demonstrate that replay events in RA during
Neuron 109, 1–11, December 1, 2021 5

Figure 4. Focal HVC cooling slows sleep
replay events in RA
(A and B) Top: Schematic of experiment, with sili-
con probes in RA and a Peltier device on the sur-
face of HVC. Spiking activity (Middle) and template
matching results (Bottom) for 39 simultaneously
recorded RA neurons in the (A) baseline and (B)
cooled conditions. Detected example events for
baseline and cooled conditions shown in white (A)
and teal (B), respectively.
(C) Distribution of slopes for each temperature
condition in bird 5 normalized to the median
baseline (DT = 0�C) slope.(D) Population data for all birds (n = 5); each data
point indicates the mean slope relative to baseline
for a given condition in a single bird. Teal triangle is
maximum cooling condition from (C) (DT =
�7.8�C). Best fit line: slope = 2.6%/�C; R2 = 0.51.
See also Figure S4.
llArticle
Please cite this article in press as: Elmaleh et al., Sleep replay reveals premotor circuit structure for a skilled behavior, Neuron (2021), https://doi.org/10.1016/j.neuron.2021.09.021
sleep accurately reflect fragments of song-related neural activity,
suggesting the circuit architecture responsible for controlling
song patterning is engaged during this offline state.
HVC establishes temporal structure for sleep replayOur study aims to use sleep activity to examine the contribution
of local HVC circuit organization to sequence generation (Fig-
ure 1). To accomplish this goal, wemust ensure that sleep replay
in RA is driven by activity within HVC rather than by dynamics
originating within an upstream structure. Previous work used
pharmacological inactivation and electrophysiological record-
ings to conclude that the upstream cortical nucleus NIf may be
initiating sleep sequences within HVC (Hahnloser and Fee,
2007). To directly test the role of NIf in sleep replay, we per-
formed excitotoxic lesions within that structure in two birds
and confirmed the completeness of our manipulation with sub-
sequent histological analysis (Figure S4A). Although the NIf le-
sions resulted in transient behavioral abnormalities (Figure S4B;
Cardin et al., 2005; Otchy et al., 2015), we found that robust
replay (Figures S4C–S4G) remained, demonstrating that RA
sleep replay dynamics do not require upstream inputs from NIf.
In addition to NIf, several other structures, such as the medial
magnocellular nucleus of the anterior neostriatum (Foster et al.,
1997; Nottebohm et al., 1976) and the nucleus avalanche (Akuta-
gawa and Konishi, 2010), directly project to HVC and may shape
sleep-related activity. To determine the collective contribution of
all upstream nuclei to HVC sleep sequences, we measured the
impact of mild HVC cooling on replay activity. Previous work
has demonstrated that cooling axonal inputs conveying impor-
tant sequential timing information in a downstream nucleus did
not alter the speed of the resultant behavioral sequence (Long
and Fee, 2008). Therefore, if a region upstream of HVC were
6 Neuron 109, 1–11, December 1, 2021
acting as the pattern generator during
sleep, we would not expect stretching of
sleep-related dynamics upon simply
cooling the axon targets within HVC.
Alternatively, if the timescale of sleep
replay is shaped by local HVC activity,
then cooling that structure should measurably slow down replay
events (Banerjee et al., 2021).
We distinguished between these possibilities by placing a
Peltier device capable of producing graded temperature
changes in HVC (DT range: �2.8�C to �8.7�C) while measuring
sleep activity in RA (n = 5 birds) (Figure 4). The slope of detected
replay events during the cooled periods decreased systemati-
cally as a function of HVC temperature (Figures 4A–4C) with an
average decrease in replay speed of 2.6%±1.8%/�C (Figure 4D),
a value consistent with the impact of both induced (Hamaguchi
et al., 2016; Long and Fee, 2008) and naturally occurring (Aronov
and Fee, 2012) temperature changes on singing behavior. We
conclude that HVC dynamics set the tempo for RA replay events,
further reinforcing the strategy of testing models of HVC network
structure by measuring sleep replay in RA.
Sleep replay events do not require thalamic inputTo directly determine the contribution of intrinsic HVC connectiv-
ity to sequence propagation, we compared the activity of 134 RA
neurons (n = 3 birds) recorded before and after performing
overnight electrolytic Uva lesions using a chronically implanted
bipolar electrode (Figures 5A, 5B, S5, and S6). If inputs from
Uva specifically, or feedback from the song production loop
generally, are central to the moment-to-moment burst genera-
tion and sequence propagation in the song system (Figure 1C,
distributed model), we would expect a significant decrease in
sleep bursting and replay events after lesioning, as observed
during singing (Figure 2). However, we found that the percentage
of spikes in high-frequency bursts did not decrease postlesion
(Figures 5A, S5, and S6) (prelesion: 7.5% ± 6.5%; postlesion:
9.7%± 7.1%;Wilcoxon signed-rank test). To test whether replay
was preserved following the Uva lesion, we returned to our
Figure 5. Sleep replay is unperturbed by
thalamic lesion
(A and B) Percentage of spikes across the popu-
lation that meet burst criteria (A) and the number of
detected replay events (B) throughout the
recording duration for Bird C44. Bin size = 1 min.
Lights off indicated by shaded region; black verti-
cal ticks show timing of vocal production.
(C–E) Template aligned spiking activity during (C)
song, (D) prelesion sleep, and (E) postlesion sleep
for example neuron 19. Bottom: instantaneous
firing rates for each song or replay event with
average in black.
(F) Average instantaneous firing rates for song
(black) and sleep replay (prelesion: blue; post-
lesion: red) for 5 example neurons.
(G) Pearson correlation scores between song ac-
tivity and average prelesion or postlesion replay
before and after Uva lesion for all birds (n = 134
neurons across 3 birds; slope = 0.96; 95% CI =
[0.85, 1.07]). Black circles indicate neurons from
(F).
(H) Pearson correlation scores for RA firing activity
during introductory notes for all birds before and
after Uva lesion (n = 117 neurons across 3 birds;
slope = 0.08; 95% CI = [0.001,0.15]). Neurons with
fewer than two spikes on average per trial were
excluded from this analysis.
See also Figure S5 and S6.
llArticle
Please cite this article in press as: Elmaleh et al., Sleep replay reveals premotor circuit structure for a skilled behavior, Neuron (2021), https://doi.org/10.1016/j.neuron.2021.09.021
template matching strategy (Figures 3 and S2) andmeasured the
incidence of replay events. We found that the frequency (prele-
sion: 4.1 ± 3.2 events/min; postlesion: 5.4 ± 3.2 events/min; Wil-
coxon signed-rank test) and duration (prelesion: 56.3 ± 20.1 ms;
postlesion: 62.1 ± 34.0 ms; Wilcoxon rank-sum test) of detected
events did not decrease following the lesion (Figures 5B, S5,
and S6).
We next examined the fine structure of replay events in the
absence of thalamic feedback to HVC by aligning the spiking
activity of individual neurons during song and sleep (Figures
5C–5F; see STAR Methods). The temporal precision of postle-
sion sleep activity during replay, defined by similarity to song
aligned activity, was consistent with prelesion levels (prelesion:
0.85 ± 0.09; postlesion: 0.82 ± 0.11) (Figure 5G), even though
the same neurons no longer exhibited precisely timed bursts
during vocalization (Figures 2 and 5H; prelesion: r = 0.68 ±
0.19; postlesion: r = 0.06 ± 0.07). Therefore, despite depriving
the network of its thalamic feedback, HVC retained its ability
to propagate sequences of song-related
activity during sleep, indicating HVC
does not require moment-to-moment
thalamic input for sequence propagation
as described in the distributed model
(Figure 1C).
Replay events continue to crosssyllable boundaries followingthalamic lesionThe retention of patterned bursting activ-
ity in the absence of Uva input confirms a
role for local HVC circuitry in sequence propagation, which is
consistent with the remaining two proposed models. In the sub-
network model (Figure 1D), each vocal element (e.g., syllable) is
represented by a distinct HVC circuit, which is activated and
linked through thalamic feedback (Andalman et al., 2011). This
model predicts that, following the Uva lesion, replay events
should be unable to cross syllable boundaries (Figure 6A). On
the other hand, the continuous model, in which the full sequence
is reflected in the organization of the HVC circuit, predicts that
replay events should not be constrained by the timescales of
distinct behavioral units (Figure 6B).
To test these models, we delineated syllable onsets within
the corresponding moments of the song template, accounting
for the delay between neural activity and vocal onset (Fee
et al., 2004; see STAR Methods). In the absence of thalamic
input from Uva, individual replay events continued to cross
these boundaries, as in the prelesion period (Figures 6C and
6D). We estimated the expected boundary crossings according
Neuron 109, 1–11, December 1, 2021 7

Figure 6. Sleep replay events cross syllable
boundaries following Uva lesion
(A and B) Predictions for replay event structure
following Uva lesion given the (A) subnetwork
model or (B) continuous model.
(C and D) Example replay events (C) before and (D)
after Uva lesion. (Top) Template matching assign-
ments and corresponding detected events. (Bot-
tom) The decoded song times for 20 example
replay epochs (event start: filled circle; event stop:
open circle; syllable boundaries: dashed lines).
Examples illustrated above are bold.
(E and F) Pooled distribution of replay event stop
times across 3 birds normalized to syllable
boundaries before (n = 2,405 events) and after (n =
2,726 events) lesioning Uva. In black, a shuffled
distribution (see STAR Methods). Histograms
show mean ± SEM.
(G) Percentage of detected sleep events that cross
syllable boundaries from 3 birds. Each point rep-
resents a distinct syllable (n = 10). The incidence of
syllable crossings does not change following the
lesion (Wilcoxon sign rank: p = 0.70), consistent
with the prediction from the continuous model.
llArticle
Please cite this article in press as: Elmaleh et al., Sleep replay reveals premotor circuit structure for a skilled behavior, Neuron (2021), https://doi.org/10.1016/j.neuron.2021.09.021
to the subnetwork model by shuffling the syllable order of song
templates, which accounts for those crossings that would be
expected by chance if independent subnetworks were respon-
sible for each syllable (prelesion: 0.3% ± 0.5%; postlesion:
0.6% ± 0.5%) (Figures 6E and 6F). Instead, we found that
replay events crossed syllable boundaries with a frequency
much greater than the shuffled estimates (prelesion: 27.1% ±
9.6%; postlesion: 31.1% ± 17.8%) (Figures 6E and 6F). The
proportion of crossings for each syllable boundary in the prele-
sion and postlesion datasets did not differ (Wilcoxon rank-sum
test: p = 0.70). The measured slope of the resultant linear
regression (0.72, 95% CI [0.43 1.01]) was inconsistent with
the subnetwork model (Figure 6G; predicted slope: 0). Instead,
our findings support a synaptic architecture in which the HVC
microcircuit can produce a single continuous sequence (Fig-
ure 6G; predicted slope: 1) representing all song elements
(Figure 1E).
8 Neuron 109, 1–11, December 1, 2021
DISCUSSION
In this study, we examined the circuit or-
ganization of a behaviorally relevant
premotor structure underlying song
production in the adult zebra finch. To
determine the contributions of local and
long-range connections to observed dy-
namics, we lesioned a thalamic node in
a feedback pathway critical for song pro-
duction. In this ‘‘open loop’’ configuration,
both behavior and the associated neural
activity were severely compromised. We
therefore turned to network reactivation
during sleep and observed that local
HVC circuit connectivity contains suffi-
cient information to propagate throughout
the entirety of the song sequence. Our approach could be
instructive for other systems in which the reactivation of behav-
iorally relevant neural ensembles has been observed during off-
line states, such as sleep (Gardner et al., 2019; Lee and Wilson,
2002; Trettel et al., 2019;Wilson andMcNaughton, 1994) or quiet
wakefulness (Diba and Buzsaki, 2007; Foster and Wilson, 2006).
Using this strategy, offline circuit examination may become a
broadly applicable approach for understanding complex
network functions, especially in cases where the specific contri-
butions of interdependent structures remain ambiguous (Bolkan
et al., 2017; Guo et al., 2017; Sauerbrei et al., 2020; Schmitt
et al., 2017).
Our results highlight the importance of local HVC circuit con-
nectivity for sequence generation. Previous work examining
the fine structure of HVC network activity suggested a ‘‘poly-
chromous’’ architecture (Egger et al., 2020) in which sequentially
active HVC premotor neurons are linked through local axon

llArticle
Please cite this article in press as: Elmaleh et al., Sleep replay reveals premotor circuit structure for a skilled behavior, Neuron (2021), https://doi.org/10.1016/j.neuron.2021.09.021
collaterals (Kornfeld et al., 2017), likely with an additional contri-
bution from HVC inhibitory interneurons (Gibb et al., 2009; Ko-
sche et al., 2015; Markowitz et al., 2015; Wild et al., 2005). We
advance this model by indicating that premotor synaptic archi-
tecture is capable of continuously representing the entire syllable
repertoire of the finch (Figures 1E and 6B). We find that the
sequence sustaining circuitry within HVC is not subdivided into
dedicated networks related to individual vocal elements, despite
the fact that song syllables are functionally (Andalman et al.,
2011; Cynx, 1990; Glaze and Troyer, 2006) and developmentally
(Lipkind et al., 2017; Okubo et al., 2015) chunked. Therefore, in
the zebra finch, identified behavioral components (Wiltschko
et al., 2015) are not overtly reflected within the functional organi-
zation of this critical premotor circuit.
Circuitry within HVC appears to be differentially engaged
across singing and sleep. Activity occurring during sleep can
be initiated at nearly every time point along the sequence (Fig-
ure S3), forming fragmented events. Our observation that sleep
replay persists in the absence of NIf raises important questions
regarding the factors that initiate these sleep sequences (Hahn-
loser et al., 2008), which may be impacted by sleep-related
changes in neuromodulatory tone (Cardin and Schmidt, 2004).
In contrast, during singing, the sequence appears to be ballisti-
cally engaged at the level of syllables (Cynx, 1990), initiated at
a small number of points corresponding to the onsets of vocal el-
ements (Glaze and Troyer, 2006). Although the mechanisms un-
derlying this process remain unknown, we propose that Uvamay
be central to this function; the expression of individual behaviors
(i.e., syllables) may arise through precisely timed Uva activity
(i.e., at syllable onsets) (Danish et al., 2017) and/or through a
dedicated thalamocortical pathway onto a subset of HVC pre-
motor neurons capable of initiating the sequences for each vocal
element (Andalman et al., 2011; Schmidt, 2003).
The necessity for thalamic input at the level of the syllable may
reflect specific requirements for expert song performance. For
example, studies using lesions (Williams et al., 1992), cooling
(Long and Fee, 2008), and stimulation (Wang et al., 2008) have
indicated that neural activity across hemispheres is required
for proper song production. In the zebra finch, however, most
song control nuclei on the left and right hemispheres (including
HVC, RA, NIf, and Uva) do not directly communicate with each
other (Schmidt et al., 2004). We therefore propose that bilaterally
coordinated brainstem inputs working through Uva can align the
activity of otherwise independent song production systems,
thereby ensuring that both hemispheres engage the same part
of the sequence (Schmidt, 2003). The requirement of hemi-
spheric coordination during vocal performance could account
for the catastrophic impact of Uva lesions on song and the
modest (or nonexistent) effects of the same manipulation on
sleep when the hemispheres need not be synchronized (Young
et al., 2017).
Our results make specific predictions concerning the organi-
zation of motor networks in other systems. Although the syntax
of the zebra finch is comparatively simple (i.e., invariant syllable
order across renditions), we propose a similar network organiza-
tion in other songbird species that exhibit more variable vocal
behavior (Cohen et al., 2020; Fujimoto et al., 2011), with an up-
stream region playing an important role in determining the order
of syllables (Hosino and Okanoya, 2000). While the underlying
substrate may be more complex than the continuous represen-
tation we observe in the zebra finch, the initiation of discrete local
motor programs could bemore universal. Future work can deter-
mine whether such thalamic engagement of mammalian cortical
regions can dynamically coordinate neural assemblies subserv-
ingmultiple tasks (Dacre et al., 2021; Harvey et al., 2012; Schmitt
et al., 2017).
STAR+METHODS
Detailed methods are provided in the online version of this paper
and include the following:
d KEY RESOURCES TABLE
d RESOURCE AVAILABILITY
B Lead contact
B Materials availability
B Data and code availability
d EXPERIMENTAL MODEL AND SUBJECT DETAILS
d METHOD DETAILS
B Surgical procedures
B Extracellular recordings
B Focal cooling
B Histology
d DATA ANALYSIS
B Recording neural activity during song
B Template matching
B Sleep activity and replay measurements
B Syllable boundary crossings
d QUANTIFICATION AND STATISTICAL ANALYSIS
SUPPLEMENTAL INFORMATION
Supplemental information can be found online at https://doi.org/10.1016/j.
neuron.2021.09.021.
ACKNOWLEDGMENTS
This research was supported by NIH F31 NS116933-01 (M.E.), NIH R01
NS075044 (M.A.L.), and Simons Global Brain (M.A.L.). We thank Arkarup
Banerjee, Gyorgy Buzsaki, Dezhe Jin, Katherine Nagel, and members of the
Long laboratory for comments on earlier versions of thismanuscript. Ralph Pe-
terson helped with data collection, and Abby Paulson provided technical
assistance. We acknowledge helpful conversations with Robert Egger, Liam
Paninski, Josh Glaser, and Erdem Varol.
AUTHOR CONTRIBUTIONS
M.E. and M.A.L. conceived the study and designed the experiments; M.E.,
F.W.M., A.C.A., and D.K. conducted the research; M.E. and M.A.L. performed
data analyses; M.E. and M.A.L. created the figures; M.E. wrote the initial draft
of the manuscript; M.E., F.W.M., and M.A.L. edited and reviewed the final
manuscript; M.E. and M.A.L. acquired funding; M.A.L. supervised the project.
DECLARATION OF INTERESTS
The authors declare no competing interests.
Received: April 24, 2021
Revised: August 12, 2021
Accepted: September 13, 2021
Published: October 8, 2021
Neuron 109, 1–11, December 1, 2021 9

llArticle
Please cite this article in press as: Elmaleh et al., Sleep replay reveals premotor circuit structure for a skilled behavior, Neuron (2021), https://doi.org/10.1016/j.neuron.2021.09.021
REFERENCES
Akutagawa, E., and Konishi, M. (2010). New brain pathways found in the vocal
control system of a songbird. J. Comp. Neurol. 518, 3086–3100.
Andalman, A.S., Foerster, J.N., and Fee, M.S. (2011). Control of vocal and res-
piratory patterns in birdsong: dissection of forebrain and brainstem mecha-
nisms using temperature. PLoS ONE 6, e25461.
Aronov, D., and Fee, M.S. (2012). Natural changes in brain temperature under-
lie variations in song tempo during a mating behavior. PLoS ONE 7, e47856.
Banerjee, A., Egger, R., and Long, M.A. (2021). Using focal cooling to link neu-
ral dynamics and behavior. Neuron 109, 2508–2518.
Bolkan, S.S., Stujenske, J.M., Parnaudeau, S., Spellman, T.J., Rauffenbart, C.,
Abbas, A.I., Harris, A.Z., Gordon, J.A., and Kellendonk, C. (2017). Thalamic
projections sustain prefrontal activity during working memory maintenance.
Nat. Neurosci. 20, 987–996.
Cardin, J.A., and Schmidt, M.F. (2004). Noradrenergic inputs mediate state
dependence of auditory responses in the avian song system. J. Neurosci.
24, 7745–7753.
Cardin, J.A., Raksin, J.N., and Schmidt, M.F. (2005). Sensorimotor nucleus NIf
is necessary for auditory processing but not vocal motor output in the avian
song system. J. Neurophysiol. 93, 2157–2166.
Cohen, Y., Shen, J., Semu, D., Leman, D.P., Liberti, W.A., 3rd, Perkins, L.N.,
Liberti, D.C., Kotton, D.N., and Gardner, T.J. (2020). Hidden neural states un-
derlie canary song syntax. Nature 582, 539–544.
Coleman, M.J., and Mooney, R. (2004). Synaptic transformations underlying
highly selective auditory representations of learned birdsong. J. Neurosci.
24, 7251–7265.
Coleman, M.J., and Vu, E.T. (2005). Recovery of impaired songs following uni-
lateral but not bilateral lesions of nucleus uvaeformis of adult zebra finches.
J. Neurobiol. 63, 70–89.
Cynx, J. (1990). Experimental determination of a unit of song production in the
zebra finch (Taeniopygia guttata). J. Comp. Psychol. 104, 3–10.
Dacre, J., Colligan,M., Clarke, T., Ammer, J.J., Schiemann, J., Chamosa-Pino,
V., Claudi, F., Harston, J.A., Eleftheriou, C., Pakan, J.M.P., et al. (2021). A cere-
bellar-thalamocortical pathway drives behavioral context-dependent move-
ment initiation. Neuron 109, 2326–2338.e8.
Danish, H.H., Aronov, D., and Fee, M.S. (2017). Rhythmic syllable-related ac-
tivity in a songbirdmotor thalamic nucleus necessary for learned vocalizations.
PLoS ONE 12, e0169568.
Dave, A.S., and Margoliash, D. (2000). Song replay during sleep and compu-
tational rules for sensorimotor vocal learning. Science 290, 812–816.
Deregnaucourt, S., Mitra, P.P., Feher, O., Pytte, C., and Tchernichovski, O.
(2005). How sleep affects the developmental learning of bird song. Nature
433, 710–716.
Diba, K., and Buzsaki, G. (2007). Forward and reverse hippocampal place-cell
sequences during ripples. Nat. Neurosci. 10, 1241–1242.
Egger, R., Tupikov, Y., Elmaleh, M., Katlowitz, K.A., Benezra, S.E., Picardo,
M.A., Moll, F., Kornfeld, J., Jin, D.Z., and Long, M.A. (2020). Local Axonal
Conduction Shapes the Spatiotemporal Properties of Neural Sequences.
Cell 183, 537–548.e12.
Fee, M.S., Kozhevnikov, A.A., and Hahnloser, R.H. (2004). Neural mechanisms
of vocal sequence generation in the songbird. Ann. N Y Acad. Sci. 1016,
153–170.
Foster, D.J., and Wilson, M.A. (2006). Reverse replay of behavioural se-
quences in hippocampal place cells during the awake state. Nature 440,
680–683.
Foster, E.F., Mehta, R.P., and Bottjer, S.W. (1997). Axonal connections of the
medial magnocellular nucleus of the anterior neostriatum in zebra finches.
J. Comp. Neurol. 382, 364–381.
Fujimoto, H., Hasegawa, T., andWatanabe, D. (2011). Neural coding of syntac-
tic structure in learned vocalizations in the songbird. J. Neurosci. 31,
10023–10033.
10 Neuron 109, 1–11, December 1, 2021
Galvis, D., Wu, W., Hyson, R.L., Johnson, F., and Bertram, R. (2017). A distrib-
uted neural network model for the distinct roles of medial and lateral HVC in
zebra finch song production. J. Neurophysiol. 118, 677–692.
Gardner, R.J., Lu, L., Wernle, T., Moser, M.B., and Moser, E.I. (2019).
Correlation structure of grid cells is preserved during sleep. Nat. Neurosci.
22, 598–608.
Gibb, L., Gentner, T.Q., and Abarbanel, H.D. (2009). Inhibition and recurrent
excitation in a computational model of sparse bursting in song nucleus HVC.
J. Neurophysiol. 102, 1748–1762.
Glaze, C.M., and Troyer, T.W. (2006). Temporal structure in zebra finch song:
implications for motor coding. J. Neurosci. 26, 991–1005.
Guo, Z.V., Inagaki, H.K., Daie, K., Druckmann, S., Gerfen, C.R., and Svoboda,
K. (2017). Maintenance of persistent activity in a frontal thalamocortical loop.
Nature 545, 181–186.
Hahnloser, R.H., and Fee, M.S. (2007). Sleep-related spike bursts in HVC are
driven by the nucleus interface of the nidopallium. J. Neurophysiol. 97,
423–435.
Hahnloser, R.H., Kozhevnikov, A.A., and Fee, M.S. (2002). An ultra-sparse
code underlies the generation of neural sequences in a songbird. Nature
419, 65–70.
Hahnloser, R.H., Kozhevnikov, A.A., and Fee, M.S. (2006). Sleep-related neu-
ral activity in a premotor and a basal-ganglia pathway of the songbird.
J. Neurophysiol. 96, 794–812.
Hahnloser, R.H., Wang, C.Z., Nager, A., and Naie, K. (2008). Spikes and bursts
in two types of thalamic projection neurons differentially shape sleep patterns
and auditory responses in a songbird. J. Neurosci. 28, 5040–5052.
Hamaguchi, K., Tanaka, M., and Mooney, R. (2016). A Distributed Recurrent
Network Contributes to Temporally Precise Vocalizations. Neuron 91,
680–693.
Harvey, C.D., Coen, P., and Tank, D.W. (2012). Choice-specific sequences in
parietal cortex during a virtual-navigation decision task. Nature 484, 62–68.
Hosino, T., and Okanoya, K. (2000). Lesion of a higher-order song nucleus dis-
rupts phrase level complexity in Bengalese finches. Neuroreport 11,
2091–2095.
Katlowitz, K.A., Picardo, M.A., and Long, M.A. (2018). Stable Sequential
Activity Underlying the Maintenance of a Precisely Executed Skilled
Behavior. Neuron 98, 1133–1140.e3.
Kornfeld, J., Benezra, S.E., Narayanan, R.T., Svara, F., Egger, R., Oberlaender,
M., Denk, W., and Long, M.A. (2017). EM connectomics reveals axonal target
variation in a sequence-generating network. eLife 6, e24364.
Kosche, G., Vallentin, D., and Long, M.A. (2015). Interplay of inhibition and
excitation shapes a premotor neural sequence. J. Neurosci. 35, 1217–1227.
Kozhevnikov, A.A., and Fee, M.S. (2007). Singing-related activity of identified
HVC neurons in the zebra finch. J. Neurophysiol. 97, 4271–4283.
Lee, A.K., and Wilson, M.A. (2002). Memory of sequential experience in the
hippocampus during slow wave sleep. Neuron 36, 1183–1194.
Leonardo, A., and Fee, M.S. (2005). Ensemble coding of vocal control in bird-
song. J. Neurosci. 25, 652–661.
Lipkind, D., Zai, A.T., Hanuschkin, A., Marcus, G.F., Tchernichovski, O., and
Hahnloser, R.H.R. (2017). Songbirds work around computational complexity
by learning song vocabulary independently of sequence. Nat. Commun.
8, 1247.
Lombardino, A.J., and Nottebohm, F. (2000). Age at deafening affects the sta-
bility of learned song in adult male zebra finches. J. Neurosci. 20, 5054–5064.
Long, M.A., and Fee, M.S. (2008). Using temperature to analyse temporal dy-
namics in the songbird motor pathway. Nature 456, 189–194.
Long, M.A., Jin, D.Z., and Fee, M.S. (2010). Support for a synaptic chain model
of neuronal sequence generation. Nature 468, 394–399.
Louie, K., and Wilson, M.A. (2001). Temporally structured replay of awake hip-
pocampal ensemble activity during rapid eye movement sleep. Neuron 29,
145–156.

llArticle
Please cite this article in press as: Elmaleh et al., Sleep replay reveals premotor circuit structure for a skilled behavior, Neuron (2021), https://doi.org/10.1016/j.neuron.2021.09.021
Lynch, G.F., Okubo, T.S., Hanuschkin, A., Hahnloser, R.H., and Fee, M.S.
(2016). Rhythmic Continuous-Time Coding in the Songbird Analog of Vocal
Motor Cortex. Neuron 90, 877–892.
MacDonald, C.J., Lepage, K.Q., Eden, U.T., and Eichenbaum, H. (2011).
Hippocampal ‘‘time cells’’ bridge the gap in memory for discontiguous events.
Neuron 71, 737–749.
Mackevicius, E.L., Happ, M.T.L., and Fee, M.S. (2020). An avian cortical circuit
for chunking tutor song syllables into simple vocal-motor units. Nat. Commun.
11, 5029.
Markowitz, J.E., Liberti, W.A., 3rd, Guitchounts, G., Velho, T., Lois, C., and
Gardner, T.J. (2015). Mesoscopic patterns of neural activity support songbird
cortical sequences. PLoS Biol. 13, e1002158.
Mooney, R. (1992). Synaptic basis for developmental plasticity in a birdsong
nucleus. J. Neurosci. 12, 2464–2477.
Mooney, R., and Prather, J.F. (2005). The HVCmicrocircuit: the synaptic basis
for interactions between song motor and vocal plasticity pathways.
J. Neurosci. 25, 1952–1964.
Nottebohm, F., Stokes, T.M., and Leonard, C.M. (1976). Central control of
song in the canary, Serinus canarius. J. Comp. Neurol. 165, 457–486.
Okubo, T.S., Mackevicius, E.L., Payne, H.L., Lynch,G.F., and Fee,M.S. (2015).
Growth and splitting of neural sequences in songbird vocal development.
Nature 528, 352–357.
Otchy, T.M., Wolff, S.B., Rhee, J.Y., Pehlevan, C., Kawai, R., Kempf, A.,
Gobes, S.M., and Olveczky, B.P. (2015). Acute off-target effects of neural cir-
cuit manipulations. Nature 528, 358–363.
Pachitariu, M., Steinmetz, N., Kadir, S., Carandini, M., and Kenneth, D.H.
(2016). Kilosort: realtime spike-sorting for extracellular electrophysiology
with hundreds of channels. bioRxiv, 061481.
Pastalkova, E., Itskov, V., Amarasingham, A., and Buzsaki, G. (2008). Internally
generated cell assembly sequences in the rat hippocampus. Science 321,
1322–1327.
Peters, A.J., Chen, S.X., and Komiyama, T. (2014). Emergence of reproducible
spatiotemporal activity during motor learning. Nature 510, 263–267.
Picardo, M.A., Merel, J., Katlowitz, K.A., Vallentin, D., Okobi, D.E., Benezra,
S.E., Clary, R.C., Pnevmatikakis, E.A., Paninski, L., and Long, M.A. (2016).
Population-Level Representation of a Temporal Sequence Underlying Song
Production in the Zebra Finch. Neuron 90, 866–876.
Rauske, P.L., Chi, Z., Dave, A.S., and Margoliash, D. (2010). Neuronal stability
and drift across periods of sleep: premotor activity patterns in a vocal control
nucleus of adult zebra finches. J. Neurosci. 30, 2783–2794.
Reinke, H., and Wild, J.M. (1998). Identification and connections of inspiratory
premotor neurons in songbirds and budgerigar. J. Comp. Neurol. 391,
147–163.
Roberts, T.F., Gobes, S.M., Murugan, M., Olveczky, B.P., and Mooney, R.
(2012). Motor circuits are required to encode a sensory model for imitative
learning. Nat. Neurosci. 15, 1454–1459.
Rossant, C., Kadir, S.N., Goodman, D.F.M., Schulman, J., Hunter, M.L.D.,
Saleem, A.B., Grosmark, A., Belluscio, M., Denfield, G.H., Ecker, A.S., et al.
(2016). Spike sorting for large, dense electrode arrays. Nat. Neurosci. 19,
634–641.
Sauerbrei, B.A., Guo, J.Z., Cohen, J.D., Mischiati, M., Guo, W., Kabra, M.,
Verma, N., Mensh, B., Branson, K., and Hantman, A.W. (2020). Cortical pattern
generation during dexterous movement is input-driven. Nature 577, 386–391.
Schmidt, M.F. (2003). Pattern of interhemispheric synchronization in HVc dur-
ing singing correlates with key transitions in the song pattern. J. Neurophysiol.
90, 3931–3949.
Schmidt, M.F., and Konishi, M. (1998). Gating of auditory responses in the
vocal control system of awake songbirds. Nat. Neurosci. 1, 513–518.
Schmidt, M.F., Ashmore, R.C., and Vu, E.T. (2004). Bilateral control and inter-
hemispheric coordination in the avian song motor system. Ann. N Y Acad. Sci.
1016, 171–186.
Schmitt, L.I., Wimmer, R.D., Nakajima, M., Happ, M., Mofakham, S., and
Halassa, M.M. (2017). Thalamic amplification of cortical connectivity sustains
attentional control. Nature 545, 219–223.
Scotto-Lomassese, S., Rochefort, C., Nshdejan, A., and Scharff, C. (2007).
HVC interneurons are not renewed in adult male zebra finches. Eur. J.
Neurosci. 25, 1663–1668.
Skaggs,W.E., McNaughton, B.L.,Wilson,M.A., andBarnes, C.A. (1996). Theta
phase precession in hippocampal neuronal populations and the compression
of temporal sequences. Hippocampus 6, 149–172.
Striedter, G.F., and Vu, E.T. (1998). Bilateral feedback projections to the fore-
brain in the premotor network for singing in zebra finches. J. Neurobiol.
34, 27–40.
Tchernichovski, O., Mitra, P.P., Lints, T., and Nottebohm, F. (2001). Dynamics
of the vocal imitation process: how a zebra finch learns its song. Science 291,
2564–2569.
Trettel, S.G., Trimper, J.B., Hwaun, E., Fiete, I.R., and Colgin, L.L. (2019). Grid
cell co-activity patterns during sleep reflect spatial overlap of grid fields during
active behaviors. Nat. Neurosci. 22, 609–617.
Wang, C.Z., Herbst, J.A., Keller, G.B., and Hahnloser, R.H. (2008). Rapid inter-
hemispheric switching during vocal production in a songbird. PLoS Biol.
6, e250.
Wild, J.M. (1993). Descending projections of the songbird nucleus robustus ar-
chistriatalis. J. Comp. Neurol. 338, 225–241.
Wild, J.M., Williams, M.N., Howie, G.J., and Mooney, R. (2005). Calcium-bind-
ing proteins define interneurons in HVC of the zebra finch (Taeniopygia gut-
tata). J. Comp. Neurol. 483, 76–90.
Williams, H., and Vicario, D.S. (1993). Temporal patterning of song production:
participation of nucleus uvaeformis of the thalamus. J. Neurobiol. 24, 903–912.
Williams, H., Crane, L.A., Hale, T.K., Esposito, M.A., and Nottebohm, F. (1992).
Right-side dominance for song control in the zebra finch. J. Neurobiol. 23,
1006–1020.
Wilson, M.A., and McNaughton, B.L. (1994). Reactivation of hippocampal
ensemble memories during sleep. Science 265, 676–679.
Wiltschko, A.B., Johnson, M.J., Iurilli, G., Peterson, R.E., Katon, J.M.,
Pashkovski, S.L., Abraira, V.E., Adams, R.P., and Datta, S.R. (2015).
Mapping Sub-Second Structure in Mouse Behavior. Neuron 88, 1121–1135.
Yang, L., Lee, K., Villagracia, J., andMasmanidis, S.C. (2020). Open source sil-
icon microprobes for high throughput neural recording. J. Neural Eng. 17,
016036.
Young, B.K., Mindlin, G.B., Arneodo, E., and Goller, F. (2017). Adult zebra
finches rehearse highly variable song patterns during sleep. PeerJ 5, e4052.
Yu, A.C., and Margoliash, D. (1996). Temporal hierarchical control of singing in
birds. Science 273, 1871–1875.
Zhao, W., Garcia-Oscos, F., Dinh, D., and Roberts, T.F. (2019). Inception of
memories that guide vocal learning in the songbird. Science 366, 83–89.
Neuron 109, 1–11, December 1, 2021 11

llArticle
Please cite this article in press as: Elmaleh et al., Sleep replay reveals premotor circuit structure for a skilled behavior, Neuron (2021), https://doi.org/10.1016/j.neuron.2021.09.021
STAR+METHODS
KEY RESOURCES TABLE
REAGENT or RESOURCE SOURCE IDENTIFIER
Antibodies
Anti-NeuN antibody, clone A60 Millipore MAB377; RRID:AB_2298772
Chemicals, peptides, and recombinant proteins
N-methyl-DL-aspartic acid (NMA, 4%) AA Blocks 17833-53-3
Dextran, Alexa 488 Invitrogen D22910
Experimental models: Organisms/strains
Zebra finch (Taeniopygia guttata) Magnolia Bird Farm, Anaheim, CA N/A
Software and algorithms
MATLAB MathWorks https://www.mathworks.com/products/
matlab.html
KiloSort spike sorting software Pachitariu et al., 2016 https://github.com/cortex-lab/KiloSort
Sleep replay decoder (Template-matching tool) This paper https://github.com/LongLabGit/Template
Matching; https://doi.org/10.5281/
zenodo.5500262
Other
High-density silicon probe (with integrated headstage) Diagnostic Biochips 128-5 integrated
High-density silicon probe (acute) S. Masmanidis, UCLA 128-K
Chronic microdrive Neuronexus dDrive-xL
Assisted Fiber-optic & Electric Rotary Joint Doric Lenses AHRJ-OE_FC_AD_12_HARW
Omnetics cable adaptor Doric Lenses ADAPTER_HO12
Acquisition board Intan Technologies RHD Recording Controller (512 channels)
Stimulus generator A-M Systems Model 2100
Tungsten stimulating electrode MicroProbes WE30030.5B3
Omnidirectional microphone Audio-Technica AT803
Audio amplifier Presonus Studio Channel
RESOURCE AVAILABILITY
Lead contactFurther information and requests for resources and reagents should be directed to and will be fulfilled by the Lead Contact, Michael
Long ([email protected]).
Materials availabilityThis study did not generate new unique reagents.
Data and code availabilityAll code necessary to run templatematching as described here can be found at < https://github.com/LongLabGit/TemplateMatching
> (https://doi.org/10.5281/zenodo.5500262). The datasets generated during this study and any additional information required to re-
analyze the data reported in this paper are available upon request from the Lead Contact.
EXPERIMENTAL MODEL AND SUBJECT DETAILS
We used adult (> 90 days posthatch) male zebra finches (Taeniopygia guttata) that were obtained from an outside breeder and main-
tained in a temperature- and humidity-controlled environment with a 12/12 hr light/dark schedule. All animal maintenance and exper-
imental procedures were performed according to the guidelines established by the Institutional Animal Care and Use Committee at
the New York University Langone Medical Center.
e1 Neuron 109, 1–11.e1–e4, December 1, 2021

llArticle
Please cite this article in press as: Elmaleh et al., Sleep replay reveals premotor circuit structure for a skilled behavior, Neuron (2021), https://doi.org/10.1016/j.neuron.2021.09.021
METHOD DETAILS
Surgical proceduresAll surgical procedureswere performed under isoflurane anesthesia (1%–3% in oxygen) following established guidelines. Details per-
taining to the use of high-density silicon probes for chronic recordings have been described elsewhere (Egger et al., 2020). Briefly, for
all chronic recordings, silicon probes were implanted directly into the target area using the bifurcation of the sagittal sinus as the
stereotaxic origin. For recordings in the robust nucleus of the archipallium (RA) the craniotomies were 2.35 mm lateral and
0.1 mm posterior; for recordings in HVC, the craniotomies were 2.25 mm lateral and 0.25 mm anterior. The ground wire was inserted
between the skull and the dura above the cerebellum contralateral to the probe implantation. Silicon elastomer (Kwik-Cast, WPI) was
applied to the craniotomy once the target region was successfully identified on all channels (depth: �2.5-3 mm for RA and 0.5-
0.8 mm for HVC) using the Intan Recording system (RHD USB interphase evaluation board or RHD Recording Controller).
For both acute and chronic lesions to Uvaeformis (Uva), coordinates varied from 1.5-1.6 mm lateral, 3.0-3.6 mm anterior and
5.1-5.4 mm ventral. An ipsilateral craniotomy above HVC centered at 2.3 mm lateral and 0.25 mm anterior of the superior
sagittal sinus were made for the injection of dextran Alexa Fluor 488 to retrogradely label projections from Uva to HVC allowing
for post hoc assessment of lesion success. HVC and Uva craniotomies were done at different head angles: beak bar posi-
tioned 45 degrees down from horizontal and 5 degrees up from horizontal for HVC and Uva respectively. Acute lesions
were made using custom made bipolar stainless steel electrodes lowered into the Uva craniotomy 24-48 h prior to probe im-
plantation. Both craniotomies were covered with Kwik-Cast (WPI), and the behavioral effects of the lesion were monitored until
probe implantation.
For chronic Uva lesions, a platinum-iridium or tungsten search electrode (0.5 MU, MicroProbes) was used under isoflurane anes-
thesia to precisely locate Uva through antidromic activation of HVC-projecting Uva neurons. Next, a custom-built bipolar electrode,
composed of a platinum-iridium electrode (0.5 MU, MicroProbes) and an insulated stainless steel wire (0.002,’’ California Fine Wire)
was lowered into Uva and secured with dental acrylic. The uninsulated tip of the stainless steel wire and the tip of the platinum-iridium
electrode were�400 mm apart. Birds recovered from implantation surgery and were monitored to ensure no disruptions to song pro-
duction following bipolar electrode implantation. Lesions were performed in the middle of the dark period following silicon probe im-
plantation. For both acute and chronic lesion approaches the implantation of silicon probes was carried out as described above, and
electrolytic lesions were achieved with 30 s biphasic pulses (acute: 50 mA, 6 total pulses; chronic: 50-500 mA, 6-10 total pulses).
NIf lesions were performed using the excitotoxin N-methyl-DL-aspartic acid (NMA, 4%), as described previously (Otchy et al.,
2015). The extent and exact position of NIf wasmapped using a 0.5MU tungsten electrode (MicroProbes, WE30030.5B3) tomeasure
antidromic responses evoked by a stainless steel bipolar electrode in HVC that was constructed from 50 mm Teflon coated stainless
steel wire (California Fine Wire). NMA injections (12 sites, 30 nL each, 200 mm spacing) were then made along the anterior-posterior
axis of NIf. Prior to application of NMA, dextran was injected into HVC (see Uva lesion protocol) to retrogradely label HVC-projecting
NIf and Uva neurons. Following surgery, all vocalizations were recorded until song recovered to prelesion performance (Cardin et al.,
2005; Otchy et al., 2015), at which time high-density silicon probes were implanted into RA.
Extracellular recordingsChronic recordings were performed using integrated 128-channel high-density silicon probes (Diagnostic Biochips, 128-5). Prior to
surgery, integrated probes were mounted to a microdrive (NeuroNexus, d-XL) and a stainless steel ground wire (0.001’’ AM systems)
was soldered to the reference of the headstage, which was held in place by a custom made 3D printed enclosure (Formlabs). Within
the hour following surgery, we began continuously recording neural activity from RA (Intan Recording Controller) and all vocalizations
using an omnidirectional microphone (Audio Technica) and an analog preamplifier (Presonus). Free movement was enabled by an
electrically assisted commutator (Doric Lenses). Female zebra finches were placed in an adjacent cage to elicit song. In a subset
of experiments, electrolytic lesions were performed following 3-6 hours of sleep.
Focal coolingCooling experiments required a preparatory surgery, during which a stainless steel headplate was secured to the anterior-most po-
sition on the skull. A small craniotomy and durotomy were made for access to RA 2.3 mm lateral and 1.8 mm posterior to the superior
sagittal sinus, and a large craniotomy 2 mmmedial-lateral x 1.3 mm anterior-posterior centered on HVCwas made to accommodate
the cooling device as described previously (Long and Fee, 2008).
For the cooling experiments, birds were head-fixed and held in a foam restraint prior to recording. At the beginning of the recording
session, a Peltier device (Custom Thermoelectric) was lowered onto the surface of the brain within the HVC craniotomy. This device
was wired to a power source (Kepko) that allowed for careful control of applied current. A thin copper pouch whose temperature was
maintained through flowing water was used as a heat sink (Long and Fee, 2008). Next, 128-channel acute high-density silicon probes
(S.Masmanidis, UCLA; 128-K) (Yang et al., 2020) were lowered into the RA craniotomy. The temperature was varied in a block fashion
(�1 hour per condition) with a return to baseline temperature between each cooling session. Following recording, a thermocouple
probe (Omega) was inserted into HVC (depth: 0.5 mm) to measure the temperature changes resulting from each current level admin-
istered during the experiment.
Neuron 109, 1–11.e1–e4, December 1, 2021 e2

llArticle
Please cite this article in press as: Elmaleh et al., Sleep replay reveals premotor circuit structure for a skilled behavior, Neuron (2021), https://doi.org/10.1016/j.neuron.2021.09.021
HistologyAfter recording, birds were perfused with 4% PFA and probes were recovered. Brains were fixed overnight and sliced at 50-100 mm
using a vibrating microtome (VT1200S, Leica). Slices were mounted (Vectashield) and imaged using a Zeiss Confocal microscope
(LSM800).
DATA ANALYSIS
Recording neural activity during songCustom MATLAB software was used to analyze song recordings and to align single unit data to behavior. To characterize song el-
ements, the audio signal was bandpass filtered (low freq. = 500 Hz, high freq. = 8 kHz) and downsampled to 300 Hz to extract the
amplitude envelope. This signal was then divided into three second segments; those segments with amplitude above of the noise
floor for greater than 30 samples were assessed for vocal content. The start and stop times of all male vocalizations in these seg-
ments as well as the identity of the vocalization (i.e., syllable A, introductory note, call) were manually annotated.
For electrophysiological recordings, automated spike detection and sorting was carried out using Kilosort software (Pachitariu
et al., 2016) and manual post-processing was performed using Phy (Rossant et al., 2016) as described previously (Egger et al.,
2020). To confirm that we were holding the same neurons throughout our recording, in addition to amplitude and waveform stability
(Phy), we compared singing activity in a subset of birds where songwas recorded before (day 1) and after (day 2) sleep. For each bird,
we calculated the Pearson correlation between the average song-related instantaneous firing rate on day 1 and day 2 for each neuron
after aligning all song-related activity to the beginning and end of the song motif. All instantaneous firing rate measurements used in
this study were smoothed with a 10 ms boxcar kernel. The instantaneous firing rates for each aligned trial were smoothed with a
10 ms boxcar kernel and compared within condition (intact or postlesion) using the Pearson correlation. This firing rate threshold
and smoothing procedure was used for all instantaneous firing rate measurements throughout the study.
Both singing and sleep replay are associated with high frequency burst firing in the song production pathway. For each neuron, we
calculated the percent of spikes within all song-related vocalizations belonging to a burst (instantaneous firing rate: > 100 Hz) within
the window of vocal production after accounting for a 15 ms motor delay (Fee et al., 2004). Vocalizations defined as ‘song-related’
included both introductory notes and either song syllables (intact: control and chronic prelesion) or song attempts (postlesion: acute
lesion and chronic postlesion) and excluded calls. Tomeasure spiking precision during vocalizations, all spikes occurringwithin intro-
ductory notes were aligned to the warped start and stop times of each vocalization. The instantaneous firing rates for each aligned
trial were compared within condition (intact or postlesion) using the Pearson correlation.
To calculate temporal uncertainty, we compared song-related RA data collected as part of this study with a previously acquired
HVC dataset (Egger et al., 2020). The population activity during song was temporally subsampled every 2 ms and the probability of a
given unique active neural ensemble was used to calculate entropy (I) (Leonardo and Fee, 2005); uncertainty was then defined as
song length divided by 2I for each recording.
Template matchingA single template was chosen from the burst activity of the population of RA neurons during the performance of one song rendition
and subdivided into bins (bin width: 6 ms, step size: 2 ms). The data were then further binarized; if a neuron was bursting within that
bin, it was assigned a value of 1; no bursting was assigned a 0. Following the creation of the template, activity throughout the
recording period was similarly binarized, segmented into bins, and assigned to the template bin it most resembles using Pearson
correlation.
Sleep replay events were defined as fragments of sleep activity resembling significant portions of the song template using the
following guidelines during the lights-off portion of the recording. Individual replay events were detected by traversing the two-dimen-
sional space (template bin versus recording time); a given bin assignment was joined with its neighbor if the absolute value of the
distance between them was less than 4 ms, thus allowing for the detection of both forward and reverse replay events. Adjacent de-
tected events were joined if the distance between them was less than 10 ms.
We calculated the slope of each event using a best fit linear approximation of the bin assignments within the detected event. Initial
manual annotation of robust replay events suggested that most slope values were near 1. We therefore used outlier slope values (less
than 0 and greater than 2) as ameans of identifying spurious events. Using this metric, we found that replay events of sufficient length
(i.e., 40 ms) very rarely exhibited an outlier slope value (Figure S2G), and we therefore established 40 ms as a minimum requirement
for sleep replay events uponwhich we performed further analysis. We estimated the spectrogram of sleep replay events by assigning
the portion of the song spectrogram corresponding to the template bin with the highest correlation value. For the cooling experi-
ments, where no song template was available, we created a template from a period of robust bursting during a baseline temperature
recording block, and slopes for the events detected during the cooled portions were normalized to the median slope of the detected
baseline events.
To compare the similarity between song activity and sleep replay activity, we looked at the template matching results for detected
sleep replay events as well as the non-template song repeats (i.e., the neural activity occurring during song renditions not used for the
template). We compared all correlation scores assigned during non-template song repeats with those assigned during sleep events.
We produced a shuffled distribution of correlation scores by comparing the neural activity during non-template song repeats and
e3 Neuron 109, 1–11.e1–e4, December 1, 2021
llArticle
Please cite this article in press as: Elmaleh et al., Sleep replay reveals premotor circuit structure for a skilled behavior, Neuron (2021), https://doi.org/10.1016/j.neuron.2021.09.021
detected replay events to random portions of the song (rather than the winner-take-all approach used for event detection). We also
performed a direct comparison in which we measured the correlation scores across sleep and song for each bin of our template,
using the mean values for each bird to calculate a ratio (i.e., rsleep/rsong).
Sleep activity and replay measurementsPopulation bursting during sleep was measured as the percent of all spikes occurring within a burst (instantaneous firing rate: >
100Hz; bin width: 1 minute). To compare spiking precision within detected replay events pre- and postlesion, template matching
was performed on neural data collected during awake singing trials. All spiking activity for a given neuron was aligned to all the de-
tected events during song, prelesion replay, and postlesion replay. Average instantaneous firing rates for pre- and postlesion replay
activity were compared to that of singing activity (Pearson correlation). To quantify potential differences in replay events before and
after the lesion, we narrowed our analysis to the hour preceding the lesion and the second hour following the lesion.
Syllable boundary crossingsAll detected sleep replay events were assessed for boundary crossing by comparing the event’s template location with the corre-
sponding position in song. A syllable was defined as the onset of the vocalization to the onset of the following syllable vocalization
or the end of that vocalization for the last syllable in the song. Replay event starting times were normalized to their location within the
starting syllable and stop times were adjusted to the position in the ending syllable. We also quantify the proportion of reconstructed
replay events that cross syllable boundaries (e.g., sleep events initiated in syllable A that cross over into syllable B). To create replay
events predicted by the subnetwork model, we shuffled the template such that the corresponding neural activity for each syllable
remained intact, but previously adjacent syllables were no longer continuous. For each bird, we generated either ten such templates
meeting this criterion or all shuffled templates when fewer than ten were possible. Using the shuffled template bin assignments,
events were detected and syllable boundary crossings were measured as above.
QUANTIFICATION AND STATISTICAL ANALYSIS
All statistical details of experiments can be found in figure legends and the Results section, including the statistical tests used, exact
value of n and what n represents (e.g., number of animals, number of cells, etc.). Values are reported asmean ± SD unlessmentioned
otherwise, and values are plotted asmeanwith error bars representing SD unlessmentioned otherwise. Significance was defined at a
level of 0.05. Normal distribution of data was not assumed. No data were excluded from analysis. Statistical calculations were per-
formed using MATLAB R2017a.
Neuron 109, 1–11.e1–e4, December 1, 2021 e4