Size, density and composition of cell–mineral aggregates ...
18
Size, density and composition of cell–mineral aggregates formed during anoxygenic phototrophic Fe(II) oxidation: Impact on modern and ancient environments Nicole R. Posth a, * , Sonia Huelin a , Kurt O. Konhauser b , Andreas Kappler a a Geomicrobiology, Center for Applied Geosciences, University of Tuebingen, Sigwartstrasse 10, 72076 Tuebingen, Germany b Department of Earth and Atmospheric Sciences, University of Alberta, Edmonton, AB, Canada T6G 2E3 Received 27 April 2009; accepted in revised form 18 February 2010; available online 16 March 2010 Abstract Cell–Fe(III) mineral aggregates produced by anoxygenic Fe(II)-oxidizing photoautotrophic microorganisms (photoferro- trophs) may be influential in the modern Fe cycle and were likely an integral part of ancient biogeochemical cycles on early Earth. While studies have focused on the environmental conditions under which modern photoferrotrophs grow and the kinetics, physiology and mechanism of Fe(II) oxidation, no systematic analyses of the physico-chemical characteristics of those aggregates, such as shape, size, density and chemical composition, have as yet been conducted. Herein, experimental results show most aggregates are bulbous or ragged in shape, with an average particle size of 10–40 lm, and densities that typically range between 2.0 and 2.4 g/cm 3 ; the cell fraction of the aggregates increased and their density decreased with initial Fe(II) concentration. The mineralogy of the ferric iron phase depended on the composition of the medium: goethite formed in cultures grown by oxidation of dissolved Fe(II) medium in the presence of low phosphate concentrations, while poorly ordered ferrihydrite (or Fe(III) phosphates) formed when amorphous Fe(II) minerals (Fe(II)-phosphates) and high concen- trations of phosphate were initially present. Importantly, in all experiments, a fraction of the photoautotrophic cells remained planktonic, demonstrating a constant stoichiometric excess of Fe(III) compared to the autotrophically fixed carbon in the bio- genic precipitate. These results not only have an important bearing on nutrient and trace element cycling in the modern water column, but the size, shape and composition of the aggregates can be used to estimate aggregate reactivity during sediment diagenesis over short and geologic time scales. Ó 2010 Elsevier Ltd. All rights reserved. 1. INTRODUCTION Anoxygenic Fe(II)-oxidizing photoautotrophic bacteria are found in a variety of oxygen-poor freshwater and mar- ine settings with elevated Fe(II) concentrations. The seven known strains of these organisms comprise three major photosynthetic branches; purple sulfur, purple non-sulfur, and green sulfur bacteria (Widdel et al., 1993; Heising et al., 1999), which utilize light energy to oxidize Fe(II) and reduce CO 2 , forming Fe(III) oxides and biomass in the following process: 4Fe 2þ þ HCO 3 þ 10H 2 O ! 4FeðOHÞ 3 þ CH 2 O þ 7H þ ð1Þ Aside from dissolved Fe(II), anaerobic Fe(II)-oxidizing phototrophs can also use a diverse set of substrates as elec- tron donors, such as H 2 , acetate, FeS and FeCO 3 (Kappler and Newman, 2004). Since the isolation of these modern strains, increased knowledge of their diverse habitats, physiology, as well as the rates and magnitude at which they oxidize Fe(II), sup- ports their potential as important players in the global iron 0016-7037/$ - see front matter Ó 2010 Elsevier Ltd. All rights reserved. doi:10.1016/j.gca.2010.02.036 * Corresponding author. Tel.: +49 7071 29 73184; fax: +49 7071 29 5059. E-mail address: [email protected] (N.R. Posth). www.elsevier.com/locate/gca Available online at www.sciencedirect.com Geochimica et Cosmochimica Acta 74 (2010) 3476–3493
Transcript of Size, density and composition of cell–mineral aggregates ...

Available online at www.sciencedirect.com
www.elsevier.com/locate/gca
Geochimica et Cosmochimica Acta 74 (2010) 3476–3493
Size, density and composition of cell–mineral aggregatesformed during anoxygenic phototrophic Fe(II) oxidation:
Impact on modern and ancient environments
Nicole R. Posth a,*, Sonia Huelin a, Kurt O. Konhauser b, Andreas Kappler a
a Geomicrobiology, Center for Applied Geosciences, University of Tuebingen, Sigwartstrasse 10, 72076 Tuebingen, Germanyb Department of Earth and Atmospheric Sciences, University of Alberta, Edmonton, AB, Canada T6G 2E3
Received 27 April 2009; accepted in revised form 18 February 2010; available online 16 March 2010
Abstract
Cell–Fe(III) mineral aggregates produced by anoxygenic Fe(II)-oxidizing photoautotrophic microorganisms (photoferro-trophs) may be influential in the modern Fe cycle and were likely an integral part of ancient biogeochemical cycles on earlyEarth. While studies have focused on the environmental conditions under which modern photoferrotrophs grow and thekinetics, physiology and mechanism of Fe(II) oxidation, no systematic analyses of the physico-chemical characteristics ofthose aggregates, such as shape, size, density and chemical composition, have as yet been conducted. Herein, experimentalresults show most aggregates are bulbous or ragged in shape, with an average particle size of 10–40 lm, and densities thattypically range between 2.0 and 2.4 g/cm3; the cell fraction of the aggregates increased and their density decreased with initialFe(II) concentration. The mineralogy of the ferric iron phase depended on the composition of the medium: goethite formed incultures grown by oxidation of dissolved Fe(II) medium in the presence of low phosphate concentrations, while poorlyordered ferrihydrite (or Fe(III) phosphates) formed when amorphous Fe(II) minerals (Fe(II)-phosphates) and high concen-trations of phosphate were initially present. Importantly, in all experiments, a fraction of the photoautotrophic cells remainedplanktonic, demonstrating a constant stoichiometric excess of Fe(III) compared to the autotrophically fixed carbon in the bio-genic precipitate. These results not only have an important bearing on nutrient and trace element cycling in the modern watercolumn, but the size, shape and composition of the aggregates can be used to estimate aggregate reactivity during sedimentdiagenesis over short and geologic time scales.� 2010 Elsevier Ltd. All rights reserved.
1. INTRODUCTION
Anoxygenic Fe(II)-oxidizing photoautotrophic bacteriaare found in a variety of oxygen-poor freshwater and mar-ine settings with elevated Fe(II) concentrations. The sevenknown strains of these organisms comprise three majorphotosynthetic branches; purple sulfur, purple non-sulfur,and green sulfur bacteria (Widdel et al., 1993; Heisinget al., 1999), which utilize light energy to oxidize Fe(II)
0016-7037/$ - see front matter � 2010 Elsevier Ltd. All rights reserved.
doi:10.1016/j.gca.2010.02.036
* Corresponding author. Tel.: +49 7071 29 73184; fax: +49 707129 5059.
E-mail address: [email protected] (N.R. Posth).
and reduce CO2, forming Fe(III) oxides and biomass inthe following process:
4Fe2þ þHCO3� þ 10H2O! 4FeðOHÞ3 þ CH2Oþ 7Hþ
ð1Þ
Aside from dissolved Fe(II), anaerobic Fe(II)-oxidizingphototrophs can also use a diverse set of substrates as elec-tron donors, such as H2, acetate, FeS and FeCO3 (Kapplerand Newman, 2004).
Since the isolation of these modern strains, increasedknowledge of their diverse habitats, physiology, as well asthe rates and magnitude at which they oxidize Fe(II), sup-ports their potential as important players in the global iron

Cell–mineral aggregates formed during anoxygenic Fe(II) oxidation 3477
cycle (Thamdrup, 2000; Kappler and Straub, 2005; Weberet al., 2006; Hegler et al., 2008). For example, the formationof reactive Fe(III) compounds is promoted by bacterialFe(II) oxidation, forming an integral part of the Fe cycleat oxic–anoxic interfaces (Sobolev and Roden, 2001). Inaddition, the importance of anoxygenic Fe(II)-oxidizingphototrophs for ancient biogeochemical cycles was hypoth-esized several decades ago (e.g., Garrels et al., 1973; Hart-man, 1984), yet such strains have only been successfullyisolated within the past 15 years (Widdel et al., 1993). Re-cent genetic studies suggest Fe(II)-oxidizing phototrophsas the forerunners of oxygenic photosynthesis (Brockset al., 2005; Papineau et al., 2005; Xiong, 2006; Rashbyet al., 2007). Due to their oxygen-free, light-driven metabo-lism, they are also presumed to be involved and in the pre-cipitation of Precambrian banded iron formations(Konhauser et al., 2002; Kappler et al., 2005a; Trouwborstet al., 2007; Posth et al., 2008; Posth et al., in press).
The mechanism behind Fe(II) oxidation in phototrophicbacteria is still not fully understood. Initial studies postu-lated that Fe(II) oxidation must be located at the cell sur-face; if it were to take place in the periplasm orcytoplasm, the massive amounts of poorly soluble Fe(III)oxides formed would impede cell function (Ehrenreichand Widdel, 1994). Therefore, theoretical models place a re-dox-active component at the outer cell membrane with elec-trons transported through the periplasm to the reactioncenter; a similar mechanism has been put forth for acido-philic Fe(II)-oxidizing bacteria Acidithiobacillus ferrooxi-
dans (Yarzabal et al., 2002). More recently, however, theoperons responsible for phototrophic Fe(II) oxidation intwo strains were identified, one part of which in both strainsencode c-type cytochromes, which could function as theFe(II) oxidoreductase (Croal et al., 2007; Jiao and New-man, 2007). This suggests that Fe(II) oxidation may takeplace there, thus requiring some mechanism which preventsinner-cellular precipitation of ferric iron. Such mechanismscould be the production of a pH microenvironment aroundthe cell which would allow for Fe(III) oxide precipitationaway from the cell wall, solubilization of the Fe(III) bycomplexation, or possibly surface charge modification(Sobolev and Roden, 2001; Kappler and Newman, 2004;Schadler et al., 2009).
For Fe-rich systems, the nature of the Fe(III) mineral–cell aggregates formed from this metabolism are of funda-mental importance to the reactions in these settings. It isknown that biogenic Fe(III) mineral–cell aggregates arereactive, sometimes more so than their abiogenic counter-parts (James and Ferris, 2004; Roden, 2004). Mineralogicalstudies with Fe(II)-oxidizing phototrophs show that unlikethe nitrate-reducing Fe(II)-oxidizing strain Acidovorax sp.BoFeN1 (Kappler et al., 2005b), precipitates are associatedwith the cell wall, but do not cover them completely. In-deed, STXM studies have shown that the Fe(III) mineralsprecipitate exclusively extracellularly on polymer fibersemerging from the cells, which are coated with Fe(III) con-centrations that decreases with distance from the cell (Miotet al., 2009). This suggests that the Fe(III) is released in dis-solved form as an inorganic aqueous complex or colloidalaggregate prior to mineral precipitation (Kappler and New-
man, 2004). This differs from similar studies with theencrusting nitrate-reducing Fe(II)-oxidizing strain Acidovo-
rax BoFeN1, for which STXM studies found a 40-nm thickmineralized layer within the periplasm (Miot et al., 2009).
Importantly, cell–Fe(III) aggregates produced by aero-bic or anaerobic Fe(II)-oxidizing bacteria will settle out ofthe water column to accumulate in the bottom sediment.Once buried, these aggregates comprise a highly reactivefraction of sediment that will influence the early stages ofdiagenesis and determine the course of mineral transforma-tions over the long term. For example, Fe(III) oxyhydrox-ide particles have a high specific surface area whichmakes them ideal sorbents for a number of major and tracesolutes (Fortin et al., 1993; Clarke et al., 1997). Conse-quently, the transport and mobility of various ions, metalcomplexes and pollutants (i.e., As, Cu) in modern Fe-richsurface water and aquifer systems is greatly impacted bythe composition and character of the minerals in sediment.Studies with abiotically produced minerals established thatiron minerals with different crystal sizes vary significantly insurface area (ferrihydrite ranges between 250 and 350 m2/g(Cornell and Schwertmann, 2003) and therefore in stability,solubility and reactivity (Schwertmann and Cornell, 2000).With their organic carbon component, biogenic minerals,such as the aggregates produced by Fe(II)-oxidizing photo-trophs, may be particularly reactive in Fe-rich settings.
While it is evident that microbial Fe(II) oxidation repre-sents an important link in the global Fe cycle, the study ofthese strains and their mineral products is still nascent. Themicrobial and geochemical complexity of natural settingsmakes full understanding of the role of cell–mineral aggre-gates produced by Fe(II)-oxidizing phototrophs in an envi-ronmental system challenging. For instance, it is unclearhow the cell (organic carbon) component in the aggregateinfluences the mineral properties and thus the interactionsof the iron minerals with nutrients, contaminants, and otherions in solution. Therefore, in this study, cell–Fe aggregatesfrom pure lab strains were classified by size, morphology,density and composition in order to estimate the impactof cell–mineral aggregates in both modern and ancient sys-tems. Aggregate behavior, such as sedimentation rate, isalso calculated for marine and freshwater systems in an at-tempt to tie processes of Fe(II) oxidation in the surfacewater column to diagenetic recycling in the bottomsediment.
2. MATERIALS AND METHODS
2.1. Source of the microorganisms
Rhodobacter ferrooxidans sp. strain SW2 was isolatedfrom a pond in Schaumburger Wald, Hannover region,Germany (Ehrenreich and Widdel, 1994). Chlorobium ferro-
oxidans sp. strain KoFox (in co-culture with Geospirillum
sp. strain KoFum) was isolated from a ditch near the Uni-versity of Konstanz, Germany (Heising et al., 1999). Thio-
dictyon sp. strain F4 was isolated from a freshwatermarsh in Woods Hole, MA (Croal et al., 2004). All threestrains have been maintained in our lab strain collectionfor the past several years.

3478 N.R. Posth et al. / Geochimica et Cosmochimica Acta 74 (2010) 3476–3493
2.2. Preparation of the growth medium and cultivation
conditions
A 10-fold freshwater medium stock solution was pre-pared and added to distilled water to yield a final concen-tration in the medium of 0.5 g/l MgSO4�7H2O, 0.6 g/lKH2PO4, 0.3 g/l NH4Cl, and 0.1 g/l CaCl2�2H2O. Thisgrowth medium was autoclaved in a Widdel flask. Afterautoclaving, the medium was cooled to room temperatureunder a N2/CO2 atmosphere (90:10). Finally, the followingcomponents were added in the order listed: bicarbonatebuffer solution (NaHCO3) to a 22 mM final concentrationin the medium, 1 ml/l trace element solution SL10, 1 ml/lSelenite–Tungsten solution (after Widdel, 1980), 1 ml/l ofa 7-vitamin solution (Widdel and Pfennig, 1981). AfterpH-adjustment to pH 6.9, 25 ml of medium were filled into58-ml serum bottles, closed with butyl-rubber stoppers,crimped, and the headspace was flushed with N2/CO2
(90:10). The Fe(II) (either 4 or 10 mM final concentration)was added directly into the serum bottles from a 1 M stocksolution of FeCl2�4H2O, resulting in an unfiltered mediumcontaining Fe(II) precipitates from the added Fe(II) plusthe bicarbonate and phosphate in the medium. Filteredmedium was prepared in parallel in order to grow cultureswith only a dissolved Fe(II) source. Here, after the additionof Fe(II) from the 1 M stock solution of FeCl2, the mediumwas filtered with a 0.2 lm filter in a glove box (100% N2)and transferred into serum bottles, also resulting in lowerphosphate concentrations in the final culture medium (seealso Kappler and Newman, 2004). In case of growth withH2 as electron donor, the headspace was exchanged withoverpressure of H2/CO2 (90:10) every 2 days.
Cultures of R. ferrooxidans sp. strain SW2, Thiodictyon
sp. F4 and C. ferrooxidans sp. strain KoFox were inoculatedwith 2% inoculum from cultures pre-grown on H2/CO2 oriron and incubated at 21 �C at light intensity equal or higherthan 700 lux. All cultures were set-up in triplicate for eachstrain and for each Fe(II) concentration. Control samplescontained all medium components besides the bacteria.
2.3. Preparation of iron (oxy)hydroxides
Suspensions (0.5 M) of four different iron oxides, hydrox-ides and oxyhydroxides, (ferrihydrite (Fe5HO8�4H2O), goe-thite (a-FeOOH), magnetite (Fe3O4) and lepidocrocite(c-FeOOH)), were prepared in distilled water. All ironoxides, except for ferrihydrite, were supplied by Bayferrox(LANXESS Inorganic Pigments, Krefeld, Germany). Forthe synthesis of 2-line ferrihydrite, 40 g Fe(NO3)�9H2O weredissolved in 500 ml Millipore water and 310 ml of 1 MKOH was added at a fixed addition rate of 100 ml/min,while vigorously stirring with a magnetic stirrer. After thepH was adjusted to �7.5 by the addition of 1 M KOH,the suspension was left on the shaker for approximately12 h. The pH was then measured and re-adjusted to pH7.5 when found necessary. The mineral suspension waswashed 3 times with Millipore water in order to removeremnant salts. For a 0.5 M suspension, the ferrihydritewas resuspended in Millipore water. Finally, the identityof the purchased iron minerals, as well as the chemically
synthesized ferrihydrite was ascertained by l-XRD(Mineralogy, University of Tuebingen).
2.4. Preparation of samples for scanning electron microscopy
(SEM)
Samples were prepared as described in Schadler et al.(2008) both with and without fixation of the cells. In sam-ples in which no fixation was carried out, approximately1 ml of the sample was withdrawn with a syringe (in theglove box for anoxic samples) and transferred onto car-bon-coated copper grids (200 mesh, holey C-coated, SPIsupplies 3620C-MB). After they were dried in an anoxicchamber by exposure to the nitrogen atmosphere and novacuum or heat, they were taken to the SEM for imaging.No further sample preparation or fixation steps were car-ried out in order to preserve the chemistry of the samplesand in order to hinder oxidation of any remaining Fe(II).The samples were placed on aluminum stubs for imaging.
For fixation of cell–mineral aggregates, 2 ml of samplewas taken from the culture bottles at the end of Fe(II) oxi-dation, fixed with 200 ll Karnovsky solution (para formal-dehyde–glutaraldehyde mixture), dehydrated in successiveisopropanol steps and transferred onto carbon-coatedcopper grids (200 mesh, holey C-coated, SPI supplies3620C-MB) (for details, see Schadler et al., 2008). Goldor palladium coating was used for imaging.
2.5. Cell–mineral aggregate sample preparation for density
determination
For the preparation of the samples for cell–mineralaggregate density determination, precipitates of 25-ml sam-ples of R. ferrooxidans sp. strain SW2 and Thiodictyon sp.F4, grown either with 4 or 10 mM Fe(II), were collectedstepwise by centrifugation in 1.5-ml Eppendorf tubes(14,000 rpm, 2 min; removal of the supernatant after eachcentrifugation step). After collecting the precipitates, theywere washed 3 times with 2 ml sodium chloride (0.9%).Although we were aware of the fact that centrifugationbrings with it the risk of artificial aggregation, collectionof precipitate without centrifugation did not yield enoughmaterial to carry out the density experiments within a rea-sonable time frame.
2.6. Analytical methods
2.6.1. Fe determination
Fe(II) and Fe(III) concentrations were determined spec-trophotometrically (FlashScan 550, Analytik Jena, Ger-many) via the ferrozine method (after Viollier et al.,2000). Samples were prepared in triplicate with a blank,which allowed determination of Fe(II) loss due to sorptionto the glass culture bottle or potential abiotic oxidation.Samples of the Fe(II)-grown cultures were taken sterilelywith a syringe through the butyl-rubber culture bottle stop-per, diluted and prepared for Fe(II) and total Fe determina-tion as further described in Hegler et al. (2008). Theoxidation rates of the triplicates were averaged and thestandard deviation calculated.

Cell–mineral aggregates formed during anoxygenic Fe(II) oxidation 3479
2.6.2. Determination of aggregate biomass composition
The determination of biomass in the suspension at the endof Fe(II) oxidation was carried out via cell counts (followingLovley and Phillips, 1986; Suter et al., 1988; Roden and Za-chara, 1996). Cell counts were performed for the culture solu-tion directly after inoculation of the strains and at the end ofFe(II) oxidation. For all experiments, cultures were grown intriplicate, with an abiotic (uninoculated) blank. 0.5–8 ml ofsample was taken sterilely with syringe through the butyl-rubber stopper of the culture tubes and transferred into a testtube. The sample was immediately fixed with 100 ll of 25%glutaraldehyde and 8.9 ml oxalate solution (28 g ammoniumoxalate and 15 g oxalic acid/1 l Millipore water) added.Then, one ml of a filtered, anoxic 100 mM ferrous ethylene-diammonium sulfate was added to each test tube. The tubeswere swirled periodically for 10 min until all of the Fe min-eral particles were dissolved. Fifty-five microliters of DAPI(40,6-diamidino-2-phenylindole-dihydrochloride) solutionwas added to each test tube in order to reach the optimumstaining concentration of 10 mg/l. After 5 min, 1–3 ml(depending on cell number) was then transferred to a filterand viewed with fluorescence (AxioVison Microscope, Zeiss)and an oil immersion object lens.
2.6.3. Scanning electron microscopy
For imaging via scanning electron microscopy, the sam-ples were analyzed with a Field Emission Scanning ElectronMicroscope (Leo 1550 VP) at the Natural and Medical Sci-ence Institute in Reutlingen (NMI) and with a Scanning Elec-tron Microscope (Leo 1450 VP) at the University ofTuebingen, Institute for Geoscience, following methods de-scribed in Schadler et al. (2008). At the NMI, an in-lens detec-tor was used for imaging. The acceleration was 2 kV and theworking distance was 3 mm. During microscopy, the sampleswere exposed to air for a maximum of 30 s from the openingof the glass until the pump in the microscope chamber wasstarted. At the University of Tuebingen, the secondary elec-tron (SE) imaging was carried out at an acceleration of 15–20 kV. The working distance was 5–12 mm and pressure tar-geted to 8 � 10�6 mbar. The samples were sputter-coated(Sputter Coater BAL-TEC Model SCD 005/CEA 035) withAu for 150 s to achieve a 45 nm gold coverage thickness.
2.6.4. Laser light diffractometry
Laser diffractometry (particle size analyzer MalvernMastersizer Micro, Malvern, UK) was used for cell–mineralaggregate size determination. The samples were added step-wise as slurry to distilled water at a constant stirring rate of1490 rpm (which allowed suspension of all the materialwithout causing air entrainment) directly from the bottlesuntil a grade of obscuration of approximately 15% wasachieved. A depiction of three subsequent runs (Fig. A1)demonstrates that mechanical disintegration of the particlesdue to the stirring is no longer significant after the first run.All data for particle size via this method is presented as anaverage of three runs, with bars depicting the error.
2.6.5. Mineral analysis by l-X-ray diffraction (l-XRD)
Biogenic minerals were withdrawn in an anoxic glove boxwith a syringe. In order to increase the sample amount for l-
XRD analysis, 10 ml of samples with a 4 mM Fe(II) concentra-tion and 8 ml of those with 10 mM Fe(II) were transferred step-wise into 2 ml plastic tubes. These were centrifuged at12,000 rpm for 2 min in between each step, followed by removalof the supernatant. After the last step, the precipitates werewashed 3 times in an anoxic glove box with 1.5 ml of anoxicwater to remove loosely sorbed Fe(II) from the precipitatesand to avoid the oxidation and formation of non-biogenicFe(III) precipitates. The tubes were then left open in the anoxicchamber for 24 hours until the precipitates were dried.
The dried precipitates were ground in a mortar in theglove box and 40–60 ll of ethanol were added in order tohave a suspension that could be transferred with a glass pip-ette onto a silicon wafer sample holder. After the ethanolevaporated, the sample holder was covered with a pieceof transparent plastic foil in order to prevent oxidation ofpotentially present Fe(II) species or Fe(II) mineral phases,and transported in a tightly closed (air-tight) glass con-tainer to the l-XRD instrument for measurement. Theywere then quickly placed in the l-XRD and the measure-ments were performed within 2 min in order to prevent sig-nificant oxidation of oxygen-sensitive mineral phases. Thismethod was designed by Katja Amstaetter and ChristophBerthold at the University of Tuebingen.
2.6.6. Mossbauer spectroscopy
The minerals produced both in filtered (only dissolvedFe(II)) and non-filtered medium were studied using Moss-bauer spectroscopy. The cell–mineral aggregates were sepa-rated from solution by centrifugation (10 min, 6500g) andthe supernatant was removed in a glove box (100% N2).These aggregates including the Fe minerals were then al-lowed to dry in an anoxic chamber. Before removal fromthe anoxic chamber, the solid samples were placed betweentwo layers of Kapton� tape. Mossbauer spectra were col-lected with a constant acceleration drive system in transmis-sion mode and with a 57Co source at room temperature.Samples were then mounted in a Janis close-cycle exchangegas cryostat, which allowed cooling of the sample to 4.2 K.Spectra were calibrated against a spectrum of a-Fe metalfoil collected at room temperature. Finally, spectra calibra-tion and fitting was carried out with Recoil� software (Uni-versity of Ottawa, Canada) using Voigt based spectral linesfollowing the model parameters of the average center shift,CS, 0.49 mm/s (CS of goethite approximately 0.48–0.5 at4.2 K), the average quadrupole shift, e, �0.1 mm/s (charac-teristic of goethite (�0.12)), the average hyperfine field, H,48.2 T, most probable hyperfine field, Hp, was 49.3 T (goe-thite has a hyperfine magnetic field of about 50 T at 4.2 K).
2.6.7. Density
The density of cell–mineral aggregates and referenceiron minerals was determined by following sedimentationbehavior in sodium polytungstate solutions (SOMETUI,Berlin, Germany). The densities of these solutions were ad-justed by addition of distilled water to a sodium polytung-state stock solution with a starting density of 3.01 g/cm3.0.5 ml of 500 mM suspensions of each iron (oxy)hydroxidewas transferred with a 1 ml syringe to a glass test tube con-taining the diluted polytungstate solution.
3480 N.R. Posth et al. / Geochimica et Cosmochimica Acta 74 (2010) 3476–3493
Cell–mineral aggregate samples were added to a series oftest tubes containing 10 ml of sodium polytungstate solu-tions at set densities of: 2.4, 2.0, 1.6 and 1.2 g/cm3. Theaggregates were allowed to settle in this solution eitherfor 5 min or 24 h. The particles still present at the surfaceof the liquid had a lower or equal density than the poly-tungstate solution applied, while those sedimented in thetubes were those with a higher density than the solution.Those aggregates present at the surface of the solution werecollected with a glass pipette and transferred into separatetest tubes. The glass test tubes of either sedimented or sus-pended particles were then centrifuged at 7000 rpm for10 min. After the removal and collection of the supernatant(sodium polytungstate solution) for its reuse, the precipi-tates (cell–mineral aggregates) were washed 3 times with0.9% sodium chloride. Finally, the iron content of the pre-cipitates was determined via ferrozine assay after dissolu-tion of an aliquot in 6 M HCl (Stookey, 1970; Viollieret al., 2000).
2.7. Calculation of sedimentation rates by Stokes’ Law
Following Stokes’ law, particles (in our case cell–mineralaggregates), falling in a water column by their own weight,reach a terminal (settling) velocity when the frictional forcecombined with the buoyant force balances the gravitationalforce. While Stokes’ law is most accurately applied forspherical particles, we have still utilized this law as an esti-mate of the irregular cell–mineral aggregate sedimentationrate. The resulting settling velocity (Vs) is therefore given by
V s ¼2
9
r2gðqp � qfÞg
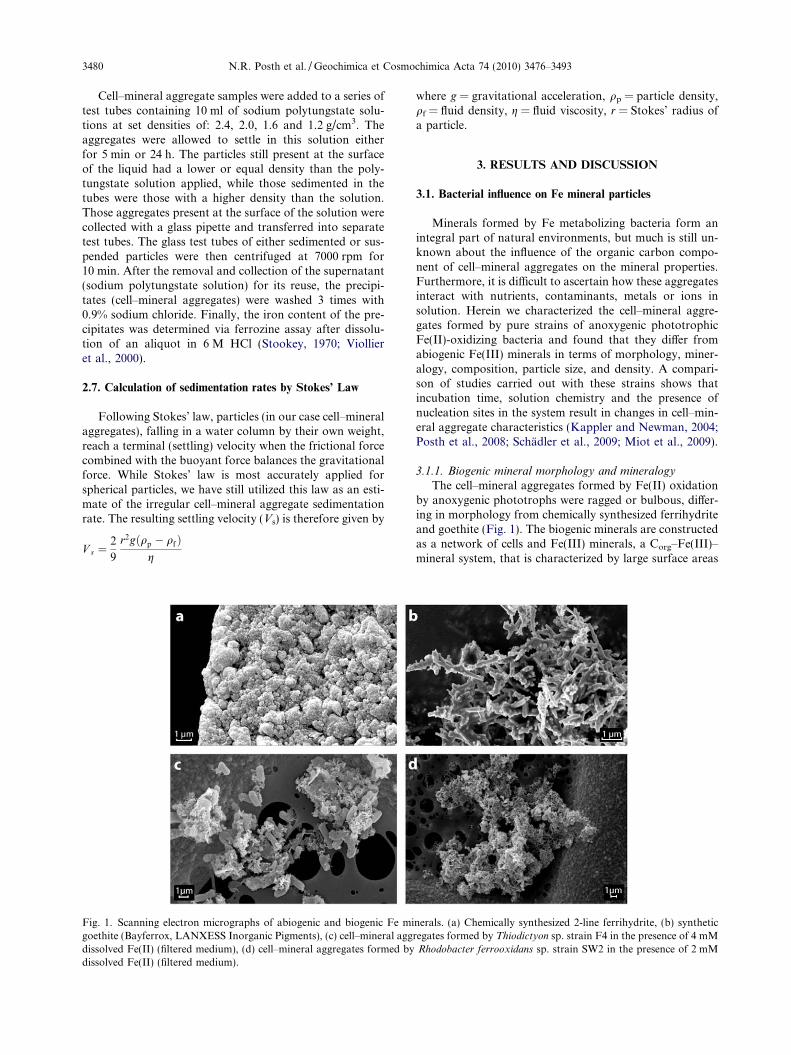
Fig. 1. Scanning electron micrographs of abiogenic and biogenic Fe migoethite (Bayferrox, LANXESS Inorganic Pigments), (c) cell–mineral aggdissolved Fe(II) (filtered medium), (d) cell–mineral aggregates formed bydissolved Fe(II) (filtered medium).
where g = gravitational acceleration, qp = particle density,qf = fluid density, g = fluid viscosity, r = Stokes’ radius ofa particle.
3. RESULTS AND DISCUSSION
3.1. Bacterial influence on Fe mineral particles
Minerals formed by Fe metabolizing bacteria form anintegral part of natural environments, but much is still un-known about the influence of the organic carbon compo-nent of cell–mineral aggregates on the mineral properties.Furthermore, it is difficult to ascertain how these aggregatesinteract with nutrients, contaminants, metals or ions insolution. Herein we characterized the cell–mineral aggre-gates formed by pure strains of anoxygenic phototrophicFe(II)-oxidizing bacteria and found that they differ fromabiogenic Fe(III) minerals in terms of morphology, miner-alogy, composition, particle size, and density. A compari-son of studies carried out with these strains shows thatincubation time, solution chemistry and the presence ofnucleation sites in the system result in changes in cell–min-eral aggregate characteristics (Kappler and Newman, 2004;Posth et al., 2008; Schadler et al., 2009; Miot et al., 2009).
3.1.1. Biogenic mineral morphology and mineralogy
The cell–mineral aggregates formed by Fe(II) oxidationby anoxygenic phototrophs were ragged or bulbous, differ-ing in morphology from chemically synthesized ferrihydriteand goethite (Fig. 1). The biogenic minerals are constructedas a network of cells and Fe(III) minerals, a Corg–Fe(III)–mineral system, that is characterized by large surface areas
nerals. (a) Chemically synthesized 2-line ferrihydrite, (b) syntheticregates formed by Thiodictyon sp. strain F4 in the presence of 4 mMRhodobacter ferrooxidans sp. strain SW2 in the presence of 2 mM

Cell–mineral aggregates formed during anoxygenic Fe(II) oxidation 3481
and varying surface properties within the aggregate. TheCorg–Fe(III)–mineral components (Fig. 1), influences aggre-gate reactivity in microbially (as suitable electron acceptorsfor microbial Fe(III) reduction; Straub et al., 1998) and abi-otically driven redox reactions, as well as in sorption pro-cesses (Postma, 1993; Roden and Zachara, 1996; Roden,2003; Hansel et al., 2004; Langley et al., 2009). In the envi-ronment, the identity and reactivity of primary biogeniciron minerals are also known to change with time (Roden,2003; Hansel et al., 2004), and be enhanced as mineral mix-tures of varying crystallinity develop and mineral transfor-mations alter surface properties (Postma, 1993). Suchtransformations, for example, can influence the porosityof sediment layers (e.g., Canfield, 1989) as well as biologicaland chemical degradation of carbon in the water column.
The biogenic Fe(III) mineral product at the end ofphototrophic Fe(II) oxidation by R. ferrooxidans sp. strainSW2 was also strongly influenced by the bacterial growthmedium composition or solution chemistry. In this study,strain SW2 cells were transferred into the batch systemsfrom H2-grown (Fe mineral free) cultures, ensuring thatthe Fe(III) mineralogy observed after Fe(II) oxidation didnot stem from minerals transferred with the inoculum,but from the primary phases themselves. For one set ofexperiments, the medium was carbonate buffered, and con-tained bicarbonate along with phosphate and sulfate, aswell as a variety of trace elements. FeCl2 was added as an
Fig. 2. Comparison of Fe(III) minerals formed during microbial Fe(II) ofiltered medium (disordered Fe(II)-phosphate is present when microbiaminerals produced by Fe(II) oxidation with Rhodobacter ferrooxidans spgoethite model is represented by a solid gray line. All samples were collecnon-filtered medium by strain SW2 (c). The reference pattern for goethiwhich indicates the signal of the foil used to cover the sample during me
electron source (see method of medium preparation above).Past geochemical studies performed with this bacterialgrowth medium showed that the addition of FeCl2 causesthe precipitation of Fe(II)-phosphate mineral phases,mostly vivianite (Miot et al., 2009), consistent with theirlow solubility (Ksp = 1 � 10�36, Stumm and Morgan). An-other Fe(II) mineral potentially to precipitate in this car-bonate buffered medium, FeCO3, is more soluble(Ksp = 1 � 10�10.45) and was not seen in the precipitate.Depending on starting Fe(II) concentration, microbial oxi-dation required between 3 and 12 days (Fig. A2, Hegleret al., 2008, for oxidation rates by these strains). In line withthis, l-XRD and Mossbauer spectroscopy performed at theend of Fe(II) oxidation by R. ferrooxidans sp. strain SW2,in medium containing high phosphate concentrations(4.4 mM), showed disordered ferrihydrite or Fe(III) phos-phate (Fig. 2). The mineral product in this set-up was notseen to change its mineralogy with time nor with increasedFe concentrations (not shown). In a second set of experi-ments with R. ferrooxidans sp. strain SW2, this mediumwas filtered after the addition of FeCl2 as a comparison.The Fe(II)-phosphate phases were largely removed by thisfiltration, leaving 3.6 mM dissolved Fe(II) as the electronsource and lower concentrations of phosphate in solution(�40 lM, data not shown). Here, goethite, rather than dis-ordered ferrihydrite or Fe(III) phosphate as in the non-fil-tered medium set-ups was detected at the end of
xidation in filtered (just dissolved Fe(II) as electron source) vs. non-l Fe(II) oxidation starts). Mossbauer spectra of biogenic Fe(III). strain SW2 in unfiltered medium (a) and filtered medium (b). Ated at 4.2 K. l-XRD analyses of precipitates formed in filtered andte is shown for comparison in gray. Please note the wide gray barasurement to maintain anoxic conditions.

3482 N.R. Posth et al. / Geochimica et Cosmochimica Acta 74 (2010) 3476–3493
oxidation (Fig. 2), confirming earlier studies from ourgroup (Kappler and Newman, 2004).
In past studies of biogenic iron minerals, the presence ofpre-existing nucleation sites influenced the final mineralproduct. XRD studies of precipitates formed in filteredmedium by the nitrate-reducing, Fe(II)-oxidizing strain Aci-
dovorax sp. BoFeN1 detected the crystalline Fe(III) mineralgoethite and poorly crystalline iron mineral phases. Thesecultures were inoculated from Fe-acetate grown culturesthat contained some Fe(III) minerals in the inoculum. Incultures inoculated with cells pre-grown with only acetate(without Fe(II) and therefore also without transfer ofFe(III) phases during inoculation), poorly crystalline ferriciron (hydr)oxides were detected (Kappler et al., 2005b). Theauthors concluded the presence of Fe(III) nucleation sitesintroduced by the Fe-acetate grown inoculum aided the for-mation of the more crystalline goethite. The mineralsformed in cultures with pre-existing Fe(III) minerals werelarger and more crystalline, while in cultures without pre-existing minerals, the Fe(III) product was smaller and irreg-ularly shaped (Kappler et al., 2005b).
While in Kappler et al. (2005b), the presence of Fe min-eral nucleation sites was determined as the controlling fac-tor for the crystallinity of the mineral product, in thepresent study, solution chemistry appeared to determinethe primary mineral product (see also studies of passive bio-mineralization, Chatellier et al., 2001, 2004). The biogenicminerals produced from cultures grown in non-filteredmedium were exposed to higher concentrations of phos-phate (up to 4 mM), while the filtered medium containsonly �40 lM phosphate. The influence of the solutionchemistry was seen in separate experiments with this med-ium. First, in studies of Acidovorax sp. strain BoFeN1 in fil-tered medium with an estimated initial phosphateconcentration of 1.3 mM, Miot et al. (2009) observed theproduction of Fe(III) phosphates. Second, in experimentscarried out in filtered medium with lower initial concentra-tions of phosphate (herein, �40 and �10 lM; Hohmannet al., 2010), goethite or nano-goethite were observed asmain mineral products. It is well-established that abioticprimary iron mineral formation is driven by counter ions(chloride and bicarbonate) both in situ and in vitro(Konhauser, 1997; Brown et al., 1999; Schwertmann andCornell, 2000; Chatellier et al., 2001; Fortin and Langley,2005; also see Ferris, 2005, for a review of biogenic iron oxi-des). Specifically, goethite development in Fe(II) oxidationand Fe(III) mineral formation has been reported to beinfluenced by bicarbonate concentration in solution (Cor-nell and Schwertmann, 2003). For biotic systems, it isknown that the presence of microbially produced Fe(II)(via microbial reduction) drives the formation of magnetite,goethite (and lepidocrocite) from ferrihydrite (Hansel et al.,2003).
By comparing the solubility of the potential end pointmineral products after Fe(II) oxidation in microbial growthmedium, it is expected that ferrihydrite (Ksp = 1 � 10�38,Stumm and Morgan, 1996) or even goethite(Ksp = 1 � 10�40, Cornell and Schwertmann, 2003) wouldform. Yet, in unfiltered medium which contains high con-
centrations of phosphate and carbonate (Table A1), Fe(III)phosphate (Ksp = 1 � 10�26; Stumm and Morgan, 1996)and some ferrihydrite forms rapidly and appears stablewithin the timeframe of these experiments (Miot et al.,2009). In filtered systems with low phosphate, the Fe(III)phosphate phase does not form after oxidation. It is likelythat in unfiltered systems, the high concentrations ofphosphate block the mineral surface, effectively preventingre-precipitation or transformation to goethite as is seen infiltered medium cultures. This is in contrast to the filteredmedium systems of low phosphate concentrations wherethe ferrihydrite could transform to goethite unhindered byphosphate. As in previous studies with other Fe(II)-oxidiz-ing bacteria and abiotic Fe(II) oxidation, geochemicalparameters and environmental conditions, such as thepresence of nucleation sites and solution chemistry, ratherthan the cell enzymatic mechanism, seem also to determinethe final Fe(III) mineral phase precipitating after the initialformation of dissolved Fe(III) aquo complexes (mainlyFe2(OH)2
4+) (Schwertman et al., 1999) for photoautotro-phic Fe (II) - oxidizing bacteria.
3.1.2. Biogenic Fe mineral composition
Anoxygenic Fe(II)-oxidizing phototrophic bacteria areloosely associated with the Fe(III) minerals they produce(Fig. 1c and d), a trait which has also been observed in nat-ural samples (Konhauser, 1997). This differs from somephototrophic and nitrate-reducing Fe(II)-oxidizing strains,which instead become encrusted by the Fe(III) mineralproduct, yielding an intimate association of organic mate-rial and Fe(III) (Heising and Schink, 1998; Schadleret al., 2009). As interactions with other compounds in theenvironment or further transformations of the sedimentedcell–mineral aggregates depend upon the surface characterand composition, differences in reactivity for these two sys-tems are expected.
It is known that an increase in initial cell number in aculture of R. ferrooxidans sp. strain SW2 results in a lowernumber of planktonic cells at the end of Fe(II) oxidationand therefore a precipitate with larger organic carbon frac-tions (Konhauser et al., 2005). Building on these experi-ments, we carried out batch experiments with R.
ferrooxidans sp. strain SW2 to test the effect of increasinginitial concentrations of Fe(II) on cell–mineral aggregatecomposition. Fe(II) oxidation in these experiments ranfrom 3 to 12 days, depending on starting Fe(II) concentra-tion (Fig. A2). The planktonic cells and suspended Fe werequantified with respect to total cells and Fe at the end ofFe(II) oxidation. It was found that initial cell number anddissolved Fe(II) concentration in the solution influencesaggregate structure. Higher initial dissolved Fe(II) concen-trations in cultures resulted in a higher fraction of precipi-tated SW2 cells at the end of Fe(II) oxidation (Fig. 3 andTable 1), which confirms the lower density also seen in theseaggregates (Fig. 4). The organic carbon fraction of the pre-cipitate increased dramatically with initial Fe(II) concentra-tion; from 63% in the precipitate in cultures of 0.8 mMinitial dissolved Fe(II) concentration to 96% in the precipi-tate in 4 mM initial concentration cultures (Table 1). The

Fig. 3. Total organic carbon (water column and precipitates) andorganic carbon in the water column quantified as the number ofsuspended microbial cells in cultures of Rhodobacter ferrooxidans
sp. strain SW2 growing with 0.8, 2 or 4 mM Fe(II). Samples weretaken directly at the end of Fe(II) oxidation.
Table 1Percent of cells found in suspension and in the precipitatedaggregate at the end of Fe(II) oxidation by the anoxygenic Fe(II)-oxidizing phototroph, Rhodobacter ferrooxidans sp. strain SW2.Refer to Appendix A4 for detailed description of Fe/C ratioestimation.
Fe(II) (mM) % Cells insuspension
SD (%) % Cells inagg/ppt
Fe/C ratioa
Harvested directly after completion of Fe(II) oxidation
0.8 37 ±17 63 1.80:12 48 ±25 52 4.38:14 4 ±3 96 2.24:1
a A 4:1 Fe/C ratio in the aggregates would be expected in ascenario where all Fe(III) produced by photoautotrophic Fe(II)oxidation were associated with the cell biomass produced.
Cell–mineral aggregates formed during anoxygenic Fe(II) oxidation 3483
Fe/C ratio in the aggregates would be 4:1 if all Fe(III) pro-duced by photoautotrophic Fe(II) oxidation were associ-ated completely with all cell biomass produced. In ourexperiments a surplus of Fe(III) was seen in the Fe:C ratio,which was between 1.80:1 and 4.38:1 (Tables 1 and A2, to-tal organic carbon related to cell density with 50% C con-tent in cell; Neidhardt et al., 1990). An increase in Fe:Cnot linearly correlated to the increase in initial Fe(II) con-centration in the system. Importantly, as a consequence, afraction of cells remained planktonic in all set-ups afterthe end of Fe(II) oxidation, which resulted in a constantstoichiometric excess of Fe(III) in the precipitate for all sce-narios of initial cell number and Fe(II) concentration(Fig. 3).
In a scenario in which cell–mineral aggregates would set-tle to the sediment surface, reduction of these Fe(III) min-erals during diagenesis could be instigated not only by theco-precipitated cells, but also by native Fe(III)-reducingmicroorganisms. Even after all the C is oxidized, therewould still be Fe(III) minerals remaining, which could ac-count for the lack of carbon found in ancient BIFs sedi-ments. Yet, the potential consequences for a modernsystem can be illustrated by studies on modern systems.Roden (2003) showed the impact of the functional groups
exposed in cell–mineral aggregates for metal sorption tothese particles; the increased amounts of bacterial organicmatter enhanced solid-phase metal partitioning. The associ-ation between positively charged Fe(III) (hydr)oxides andnegatively charged cell surfaces in the aggregate would dic-tate reactions with charged organic molecules, nutrientsand metal ions in an aqueous environment.
3.1.3. Biogenic Fe mineral particle size
It is known that particle size and aggregation behavior,particularly of smaller primary particles, influences mineralsolubility and reactivity (Cornell and Schwertmann, 2003),and in the case of ferric oxyhydroxides, determines whetherFe(III)-reducing bacteria can access these minerals. In or-der to compare chemically synthesized Fe(III) minerals tothe biogenic Fe(III) minerals, the particle diameters of bothchemically synthesized ferrihydrite and goethite were mea-sured using light diffraction and SEM. This was then com-pared to the diameter of the cell–mineral aggregates formedin culture. The chemically synthesized ferrihydrite had anaverage hydrodynamic particle size of 8–16 lm (Fig. 5a)although primary ferrihydrite particles are on the nm scale(Fig. 1a), while the goethite (BayFerrox 910 pigment) had apeak hydrodynamic particle diameter of approximately5 lm (Figs. 1a, b and 5a).
The cell size of the anoxygenic phototrophs, Thiodictyon
sp. strain F4, C. ferrooxidans sp. strain KoFox and R. fer-
rooxidans sp. strain SW2, grown in the absence of iron(with acetate or H2/CO2, 10:90), can be estimated withSEM (Fig. 6). Thiodictyon sp. strain F4 differs from theother species in that it forms gas vacuoles, making themthe largest of the anoxygenic phototrophs yet studied witha length as much as 4 lm (Fig. 6a). As a co-culture, C. fer-
rooxidans sp. strain KoFox shows cell sizes on average of0.7 lm in length (for the phototrophic Fe(II)-oxidizer)and 10 lm in length for the chemotrophic co-culture strainKoFum (Fig. 6b). R. ferrooxidans sp. strain SW2 culturescontained cells approximately 1 lm in length and 0.5 lmin width (Fig. 6c).
The anoxygenic Fe(II)-oxidizing phototrophs formedcell–Fe mineral aggregates across a wide size range for allFe(II) concentrations tested (Table 2) as based on SEM(Fig. A3) in contrast to the values based on hydrodynamicsize (Fig 5). These aggregates have an average particle sizeof 10–40 lm, with some aggregates reaching �56 lm indiameter (Fig. 5b and Table 2). While aggregate sizes weresimilar for strain SW2 and F4, the aggregates produced byC. ferrooxidans sp. strain KoFox were slightly larger (Ta-ble 2 and Fig. A3) with aggregates of up to 56 lm at2 mM initial Fe(II) concentrations (Table 2). EM imagesshowed that on average, strain F4 builds larger aggregatesin the presence of Fe than strain SW2 (Table 2); a trait notdetected with laser light diffraction. While a strong trendbetween initial Fe(II) concentration and aggregate sizewas not observed, large aggregates were no longer observedon average in cultures of high Fe(II) concentrations (e.g.,10 mM initial dissolved Fe(II)) (Table 2 and Fig. A3). Itis plausible that cells and Fe(III) oxides form mineral netswhich grow larger in size. At higher Fe(II) concentrations,

Fig. 4. Density of cell–mineral aggregates formed by two different photoautotrophic Fe(II)-oxidizing strains with two concentrations of Fe(II)as determined by observing sedimentation behavior in sodium polytungstate solution. Samples of Thiodictyon sp. strain F4 and Rhodobacter
ferrooxidans sp. strain SW2 cultured in the presence of either 4 or 10 mM Fe(II) were collected stepwise and centrifuged. 0.5 ml of 500 mMsuspensions were added to four solutions of sodium polytungstate with densities of 2.4, 2.0, 1.6 and 1.2 g/cm3. Images were taken after 5 min.Particles with a higher density than the solution precipitate settled to the bottom, while those less dense or of equal density remain at or nearthe surface of the solution. Dashed lines indicate precipitate fronts in the solution.
3484 N.R. Posth et al. / Geochimica et Cosmochimica Acta 74 (2010) 3476–3493
the higher production of Fe(III) oxides may cause the rela-tive stability of larger aggregates to break causing the resil-ience of these large aggregates to fail, yielding smalleraggregates than at lower concentrations. In co-cultures ofKoFox, the chemolithotroph, KoFum, which can exceedlengths of 10 lm (Fig. 6b) could help establish these largecell–mineral aggregates, especially in fairly fresh cultureswith vital chemolithotrophs. The controlling factor in thesize of cell–mineral aggregates, therefore, seems not to beinitial Fe(II) concentration, but rather cell characteristics,like size and surface properties.
3.1.4. Biogenic Fe mineral density
As a comparison, the density of chemically synthesizedgoethite, ferrihydrite, as well as magnetite (BayoxideE8710) and lepidocrocite (Bayferrox 943) was first esti-mated by precipitation in a polytungstate solution set at
3.01 g/cm3. As sedimentation was observed within 48 hfor all minerals in this solution, particle densities were high-er than 3.01 g/cm3 (Fig. A4). This is consistent with pastiron mineral density determination of goethite (4.26 g/cm3), ferrihydrite (3.96 g/cm3), magnetite (5.18 g/cm3) andlepidocrocite (4.08 g/cm3) (Schwertmann and Cornell,2000).
Of the iron minerals tested, magnetite precipitated fast-est, attributable to its higher density (Fig. A4). In fact, inprevious studies on the settling behavior of iron oxide sus-pensions, magnetic flocs (maghemite) were found to be onaverage 1.3–1.4 times denser than their non-magnetic ana-logs (hematite), driven by magnetic forces between the par-ticles (Glasrud et al., 1993). In comparison to magnetitewhere complete sedimentation was observed already after24 h, a fraction of ferrihydrite, goethite and lepidocrocitewith smaller particle size remained in suspension after a

Fig. 5. Hydrodynamic particle size distribution of chemicallysynthesized ferrihydrite and goethite (a). In (b), cell–mineralaggregates formed by oxidation of 4 mM Fe(II) by the photo-trophic Fe(II)-oxidizers Thiodictyon sp. F4 and Rhodobacter
ferrooxidans sp. strain SW2 were measured in three successivelaser diffractometry runs (average of all three measurementsshown). Dashed gray lines ( ) represent the aggregate diameterrange of the biogenic minerals.
Fig. 6. Scanning electron micrographs (SEM) depicting cellmorphology. (a) Thiodictyon sp. F4 grown on 10 mM acetate.Any Fe(III) minerals seen in the image were transferred with theinoculum. (b) Chlorobium ferrooxidans sp. strain KoFox (whitearrow) grown with H2/CO2 (90:10). The large, chemolithic strain,KoFum, grows in co-culture with the phototroph (black arrow). (c)Rhodobacter ferrooxidans sp. strain SW2 (white arrow), grown withH2/CO2 (90:10).
Cell–mineral aggregates formed during anoxygenic Fe(II) oxidation 3485
24 h period (Fig. A4). Considering the 10 ml volume ofpolytungstate solution in the culture tubes and the particledensities suggested by Schwertman and Cornell (2000),applying Stokes’ law predicts the size of these particleswould be less than 0.5 lm in diameter (for goethite<0.412 lm and for lepidocrocite <0.446 lm). Such particlesmay be visible in these samples as the appendices along thegoethite needles (Fig. 1b).
From the biogenic Fe(III) precipitates, aggregatesformed by R. ferrooxidans strain SW2 and Thiodictyon sp.strain F4 were chosen for density studies (Fig. 4). As thesecells differ greatly in size (Fig. 6) and one of them containsgas vacuoles, it was believed that density could differ withamount of biomass in the aggregates and therefore with ini-tial Fe(II) concentration. For both 4 mM and 10 mM initialFe(II) concentration, it was found that the biogenic miner-als formed by both strain SW2 and strain F4 had densitiesbetween 2.0 and 2.4 g/cm3 with only a small fraction athigher values (Fig. 4). As the biogenic Fe minerals formedby the anoxygenic phototrophs contain an organic carbonfraction (cells), it was not surprising to find that the densi-ties of these particles were lower than abiotically formed Fe
minerals (Fig. 4). Both strains SW2 and F4 formed cell–mineral aggregates with very similar densities, which onlydeviated at high initial Fe(II) concentrations. At 10 mM ini-tial dissolved Fe(II) concentrations, cell–mineral aggregatesproduced by strain SW2 settled faster than those formed bystrain F4. The faster settling of SW2 cell–mineral aggre-gates may be due to the size or the gas vacuoles of Thiodict-
yon sp. strain F4. These vacuoles may help the strainremain buoyant in a water column. The cell–mineral aggre-gates formed by the smaller strain SW2 are denser withoutthe vacuoles and subsequently dragged out of suspension.

Table 2The size of cell–mineral aggregates based on SEM produced byThiodictyon sp. strain F4, Rhodobacter ferrooxidans sp. strain SW2and Chlorobium ferrooxidans sp. strain KoFox by the oxidation ofinitial concentrations of 2, 4 and 10 mM Fe(II).
Fe(II) inmedium (mM)
Aggregate sizerange (lm)
Mean (lm) Median (lm)
Cell–mineral aggregates formed by Thiodictyon sp. F4
2 5–40 16.8 14.04 2–52 16.3 11.5
10 2–32 10.4 7.9
Cell–mineral aggregates formed by Rhodobacter ferrooxidans sp.
strain SW2
2 3–28 11.2 9.54 3–12 6.7 6.0
10 2.5–35 12.5 8.3
Cell–mineral aggregates formed by Chlorobium ferrooxidans sp.
strain KoFox
2 5–56 27.2 25.04 5–45 18.3 17.0
10 2–20 7.8 6.5
Fig. 7. Sedimentation rates calculated from measured particle sizesand density. (a) Sedimentation rates of cell–mineral aggregatesproduced by Rhodobacter ferrooxidans sp. strain SW2 grown onFe(II) (�), abiogenic ferrihydrite (h) and Rhodobacter ferrooxidans
cells alone (s) as calculated for seawater. (b) The sedimentationrates calculated for cell–mineral aggregates produced by Rhodob-
acter ferrooxidans sp. strain SW2 grown on Fe(II) in seawater (j)as compared to freshwater (h) using the same data used for (a).
3486 N.R. Posth et al. / Geochimica et Cosmochimica Acta 74 (2010) 3476–3493
In general, aggregates from cultures grown with high initialFe(II) concentrations settled slower than those grown atlower Fe(II) concentrations (Fig. 4). On the one hand, cul-tures grown with high initial Fe(II) concentrations pro-duced on average aggregates of smaller particle size (seeabove). Furthermore, in cultures containing higher concen-trations of Fe, the aggregate Fe:C ratio shifts as more cellsare produced and “trapped” in the aggregates (see above).A higher organic carbon component would lower the den-sity of the aggregates overall and increase settling time.
3.2. Sedimentation and water column residence time of cell–
mineral aggregates
The particle size and density measurements made forabiotically formed ferrihydrite, anoxygenic phototrophiccells grown without Fe, and biogenic Fe minerals can beused to estimate sedimentation rates (or residence time ina water column) by applying Stokes’ Law. In general, sed-imentation rate increases with particles size (Fig. 7), andcells alone settle slower than pure Fe minerals. The cellcomponent of the biogenic minerals lowers the total particledensity resulting in a decreased sedimentation rate. In sea-water, biogenic minerals would settle at a rate of 0.42–10.6 m/h on average (Fig. 7a). The spread between sedi-mentation rates was highest between large cell particlesand cell–Fe mineral aggregates. In seawater settings, the ef-fect of higher fluid viscosity and density, as considered byStokes’ law, shows that sedimentation rates decreasedslightly as compared to a freshwater system (Fig. 7b). Forexample, in a freshwater setting, a cell–mineral aggregateof the average 20 lm size would require 1.11 days to fallthrough 100 m. In a seawater setting, this aggregate wouldsettle out of the 100 m photic zone in 1.23 days. This rela-tive similarity of particle sedimentation rates for freshwaterand saltwater was shown, specifically where the settling
velocity of lake snow was reported to be fairly similar tomarine snow (Grossart and Simon, 1993).
3.3. Mineral transformation and diagenesis of aggregates
The organic component of the cell–Fe mineral aggre-gates will determine surface charge, but also drive second-ary abiotic and biotic mineral transformation processes.As most organic carbon is recycled in the water columnand in the unconsolidated sediment, this makes these parti-cles highly reactive during precipitation and the early stagesof sediment diagenesis.
While the poorly crystalline Fe phases can remain stablefor years when dried, they eventually transform into hema-tite (via dehydration), goethite and lepidocrocite (throughFe(II) catalyzed transformation) in aqueous suspension,depending on pH and solution chemistry (Schwertmannand Cornell, 2000). In lab experiments, and dependentupon solution chemistry and presence of nucleation sites,the initially formed Fe(III) mineral precipitated by theanoxygenic phototroph R. ferrooxidans sp. strain SW2(poorly crystalline ferric hydroxide) converts to the morecrystalline goethite and lepidocrocite after approximately

Cell–mineral aggregates formed during anoxygenic Fe(II) oxidation 3487
one month (Kappler and Newman, 2004). This transition ispotentially stimulated by the presence of small amounts ofremaining Fe(II) in solution or by slow microbially cata-lyzed Fe(III) reduction (Hansel et al., 2003; Kappler andNewman, 2004).
The rates of chemical and microbial iron (III) mineraltransformation depend on mineral surface properties, suchas the presence of sorbed Fe(II), the point of zero charge(ZPC) and the number of available reactive surface sites(i.e., the surface area) (Roden and Zachara, 1996; Roden,2003). The bioavailable mineral surface is inversely depen-dent on crystallinity, and mineral aggregate size. As ironminerals with different crystal sizes vary significantly in sur-face area, they have varying stability, solubility and reactiv-ity (Schwertmann and Cornell, 2000). BET analysis ofchemically synthesized ferrihydrite yielded values of be-tween 250 and 350 m2/g (Cornell and Schwertmann,2003). Recent studies of poorly crystalline biogenic miner-als produced by the Fe(II)-oxidizing anaerobe Acidovorax
sp. strain BoFeN1 showed BET of 158 m2/g. Yet, asidefrom surface area, microbial mineral transformation rateshave also been found to be controlled by Fe(III) oxide sol-ubility, as has been tested for microbial Fe(III) reduction(Bonneville et al., 2004). As mentioned earlier, the primarymineral product of carbonate buffered microbial Fe(II) oxi-dation studied herein transformed either to goethite(Ksp = 1 � 10�41) in systems of low phosphate or Fe(III)phosphate (Ksp = 1 � 10�26) in systems of higher phos-phate, so that in high phosphate systems microbial re-reduction may occur at higher rates (Bonneville et al.,2004).
In modern aqueous environments where Fe(II) ispresent, the small (<100 lm) cell–Fe(III) mineral aggre-gates help contribute to the downward sediment flux,but as was evident from the present experiments, a frac-tion of cells always remained planktonic at the end ofFe(II) oxidation; the consequence being a constant stoi-chiometric excess of Fe(III) in the precipitate. The frac-tion of organic carbon present, and the stoichiometricexcess of Fe(III) shown by these experiments, could helpdrive Fe(III) re-reduction and Fe(II) remobilization(Konhauser et al., 2005). Stemming from thiscycle, Fe(II) would also be provided as an energyrich substrate for chemolithotrophic microorganisms.Short- and long-term diagenesis transformations, drivenrespectively by microbial reduction and temperatureand pressure, would incorporate any metals or ionicspecies sorbed to the falling aggregate and may eveninfluence fossil or biomarker preservation.
3.4. The relevance of cell–mineral aggregates for BIF
deposition in ancient environments
Given the probable antiquity of anoxygenic Fe(II)-oxi-dizing phototrophs (Widdel et al., 1993; Papineau et al.,2005; Xiong, 2006; Rashby et al., 2007), the identity, size,density and composition of modern analog cell–mineralaggregates may tell us more about the characteristic pro-cesses in early ocean water columns and sediments. These
organisms have been proposed as key players in the deposi-tion of ancient iron deposits known as banded iron forma-tions (BIF) (Konhauser et al., 2002; Posth et al., 2008),which are studied today as geological archives of past cli-mate and biosphere (Konhauser et al., 2009). As Precam-brian oceans were characterized by a high Fe flux, highsilica concentrations (up to 2 mM as compared to the70 lM average for modern oceans), a circumneutral pH(Grotzinger and Kasting, 1993) and anoxic conditions,which allowed the iron to accumulate (Holland, 1973; An-bar et al., 2007), biogenic Fe minerals likely constituted asignificant fraction of the pelagic sediment in the ancientoceans.
In an ancient ocean basin in which BIF precipitated,very little carbon is found (<0.5%; Gole and Klein, 1981)which in the past seemed to negate the possibility of amicrobial mechanism, such as proposed by the anoxygenicphototroph model. As shown in Eq. (1), anoxygenic Fe(II)-oxidizing phototrophy theoretically yields a molar ratio of4Fe:1C. Accordingly, 90.0 mol Fe(III) m�2 year�1 pro-duced annually by anoxygenic phototrophs in a basin thesize of the Hamersley would correspond to 1=4 that amountin C, or 22.5 mol m�2 (2.3 � 1012 mol C for the entirerange) (Konhauser et al., 2005). However, in the presentstudy, a constant stoichiometric excess of Fe(III) was foundin the precipitate after the completion of Fe(II) oxidation.This excess of Fe(III) may explain the lack of high amountsof C expected if a microbial process were to have played arole in BIF deposition. The BIF carbon record was likelyinfluenced by the microbial processes active in the deposi-tional basin, as well as any transformation pathways actingon the cell–mineral aggregate precipitate. Through pro-cesses such as fermentation to H2 or methanogenesis toCH4, the reactivity of the cell–mineral aggregate could pro-mote conversion of complex compounds in both the watercolumn and seafloor sediment and remove electrons fromthe system that would allow Fe(III) reduction. As a com-parison, it is known that organic matter–cell aggregates(marine snow) are sites of enhanced microbial activity;the decomposition of which is also a source of considerablenutrient release into the water column (Wakeman and Lee,1993). These organic matter–cell aggregates in lake systemseven comprise anoxic microzones which can support anaer-obic processes within an oxic water body (Paerl and Pruf-ert, 1987).
The excess of Fe(III) minerals to C in BIF sedimentsmay also have stemmed from an additional microbial Fe(II)oxidation mechanism, which would shift the Fe:C ratio(Konhauser et al., 2005). For example, either aerobicmicrobial Fe(II) oxidation without the deposition of thebiomass produced in this process or, alternatively, aerobic,abiotic Fe(II) oxidation via cyanobacterial oxygen withoutthe precipitation of the cyanobacterial biomass could bothlead to an excess of Fe(III) in the deposits. Yet, as shown inthis study, a stoichiometric excess of Fe(III) is also possiblewith a photoferrotrophic mechanism and would lead to areduced amount of carbon in the sediment. It is further-more conceivable that if photoferrotrophs remain plank-tonic or are converted in the water column, the majority

3488 N.R. Posth et al. / Geochimica et Cosmochimica Acta 74 (2010) 3476–3493
of Fe(III) turnover in an ancient basin sediment could bedriven by Fe(III)-reducing bacteria (Johnson et al., 2008;Wu et al., 2009). Konhauser et al. (2005) estimated howmuch Fe(III) produced via anoxygenic phototrophs wasfound again in BIF deposits and conclude that with thisdepositional mechanism, as much as 70% could have beenrecycled back into the water column. Indeed, while theaverage oxidation state of Fe+2.4 in BIF could be explainedby the simultaneous deposition of Fe(II) and Fe(III), thepartial microbial reduction of Fe(III) to Fe(II) could havealso caused this mixed oxidation state.
The organic carbon present in the sediment via any ofthese microbial mechanisms would additionally drive min-eral transformations under temperature and pressure con-ditions over geological time. In the anoxic setting of theBIF basin, any fermentation products in the shallow sedi-ments would have been oxidized via some form of anaero-bic respiratory process (Rothman et al., 2003). Minimalnitrate and sulfate would be available due to the lack ofO2 (Ewers and Morris, 1981; Strauss, 2003). The presenceof MnO2 was likely not significant as the concentrationof Mn(II) released in hydrothermal effluent is up to 5 timeslower than that of iron (Campbell et al., 1988) and thereare presently no known anoxygenic phototrophic Mn(II)-oxidizing bacteria which would attest the importance ofthis pathway. However, the ferric hydroxide in a BIF depo-sitional basin, as well as the partially reduced phases suchas magnetite found in BIF could have supported a micro-bial process coupling the oxidation of organic carbon tothe reduction of ferric iron (Nealson and Myers, 1990;Johnson et al., 2008).
Recently, Kappler et al. (2005a) estimated that in anarea as large as the Hamersley (1 � 1011 m2), it would onlyrequire a 17.6-m thick layer of anoxygenic Fe(II)-oxidizingphototrophic R. ferrooxidans sp. strain SW2 cells growingat least at 100 m depth below a wind-mixed ocean surfacelayer to generate 9.0 � 1012 mol Fe(III) annually or90.0 mol Fe(III) m�2 year�1. Accordingly, considering the20 lm average particle size established for the anoxygenicphototroph biogenic minerals in this study, it would requireapproximately 3.4 days for such a particle to fall 400 mthrough seawater to the basin floor. As we have seen fromthese experiments using the modern analog bacteria, not allof the cells are dragged out of solution as part of the aggre-gate. This means that some cells could have remained in thewater column continuing Fe(II) oxidationphototrophically.
4. SUMMARY AND CONCLUSIONS
Anoxygenic photosynthetic Fe(II)-oxidizing bacteriaproduce small (<100 lm), bulbous or ragged aggregates,with high surface areas that are highly reactive. In the pres-ence of high concentrations of phosphate and Fe(II) min-
eral phases, poorly ordered ferrihydrite is formed,whereas strains cultured in dissolved Fe(II) medium andlowered concentrations of phosphate produced goethite.These variations demonstrate how the solution chemistryinfluences mineral product identity. Cell–mineral aggregatesize was shown to be primarily driven by cell aggregationbehavior and cell size, rather than the presence of higherinitial Fe(II) concentrations. Cell–mineral aggregate densityranged between 2.0 and 2.4 g/cm3, with a small fractionhigher than 2.4 g/cm3. These low densities can be attributedto the organic carbon (cell) component of these aggregates,as chemically synthesized Fe(III) minerals, such as goethite,magnetite, lepidocrocite and ferrihydrite, have higher densi-ties. Studies of cell–mineral co-precipitation and aggregatecomposition showed that the organic carbon (cell) fractionin the precipitate increases greatly with an increase in initialFe(II) concentration. Notably, in all experiments, a fractionof the cells remained planktonic, demonstrating a constantstoichiometric excess of Fe(III) in the precipitate, which hasimplications for understanding sediment–water interfacereactions in both ancient and modern settings. For exam-ple, sorption to these minerals would have consequencesfor sediment porosity, but also for flow and pollutant trans-port modeling and remediation. For studies of ancient set-tings, the long-term temperature and pressure drivendiagenetic fate of the carbon and the iron in the cell–min-eral aggregates could be tested in order to determine the po-tential for preservation.
ACKNOWLEDGMENTS
We would like to acknowledge Dagmar Kost and GerlindeHockh at the University of Tuebingen for their advice and helpwith the density experiments. Thanks to Claus Burkhardt andSebastian Schadler (NMI-Reutlingen), Christoph Baisch, Nik-olas Hagemann and Hartmut Schultz (Universitat Tubingen)for SEM imaging. Thanks to Christoph Berthold (UniversitatTubingen) and Katja Amstaetter (Universitat Tubingen, nowNGI) for help with the l-XRD measurements, as well as lightdiffractometry. Special thanks to Phil Larese-Casanova forMossbauer spectroscopy and many helpful discussions. Thiswork was supported by an Emmy-Noether fellowship and a re-search grant from the German Research Foundation (DFG)made to A.K. (KA 1736/2-1, 2-2, and 4-1), funding from theGeoEnviron program for NP, and the Natural Sciences andEngineering Research Council of Canada to K.K. Finally, wethank Stephan Kraemer and our anonymous reviewers for theircomments which greatly improved the quality of thismanuscript.
APPENDIX. .
See Fig. A1, Fig. A2, Table A1, Table A2, Fig. A3,Fig. A4.

Table A1Ions present in bacterial growth medium used in these studies. Thefreshwater growth medium used for the cultivation of Fe(II)-oxidizing phototrophs in the laboratory medium is modified from(Ehrenreich and Widdel, 1994). It contains 0.6 g/l potassiumphosphate (KH2PO4), 0.3 g/l ammonium chloride (NH4Cl); 0.5 g/l magnesium sulfate (MgSO4�7H2O) and 0.1 g/l calcium chloride(CaCl2�2H2O). The medium is buffered to pH 6.8–6.9 with22 mmol/l bicarbonate. After autoclaving, 1 ml/l trace elementsolution (Tschech and Pfennig, 1984), 1 ml/l selenate–tungstatesolution (Widdel, 1980) and 1 ml/l sterile filtered vitamin solution(Widdel and Pfennig, 1981) are added. For details on mediumpreparation, see Hegler et al. (2008).
mol/l
Ion
K+ 0.00440H2PO4
� 0.00440HPO4
2� 0.00440NH4
þ 0.00560Cl� 0.00560Mg2+ 0.00200SO4
2� 0.00200Ca2+ 0.00067HCO3
� 0.02200
Vitamins
4-Aminobenzoic acid 0.000000360D(+) biotin 0.000000041Nicotinic acid 0.000081000Ca-D(+) pantothenate 0.000000110Pyridoxamine (Vit. B6) dihydrochloride 0.000001030Thiaminium (Vit. B1) dihydrochloride 0.000000150Cyanocobalamin 0.000000150
Trace elements
25% HCl 10 ml/lFeCl2�4H2O 1.5 g/lH3BO3 30 mgMnCl2�4H2O 100 mgCoCl2�6H2O 190 mgNiCl2�6H2O 24 mgCuCl2�2H2O 2 mgZnCl2 70 mgNa2MoO4�2H2O 36 mg
Se–W solution
NaOH 0.4 g/lNa2SeO3�5H2O 6 mgNa2WO4�2H2O 8 mg
Fig. A2. The Fe(II) oxidation of (a) 0.8 mM, (b) 2 mM and (c)4 mM starting Fe(II) concentrations by anoxygenic phototrophRhodobacter ferrooxidans sp. strain SW2 for experiments in whichcell counts were also analyzed. Abiotic blanks (d) are compared totriplicates of Fe(II) oxidation in microbial set-ups (h).
Fig. A1. Particle size distribution shift to slightly smaller particlesizes in the second and third measurements of the same sample,suggesting mechanical disintegration during circulation/pumpingof the particle suspension through the measuring chamber in theinstrument.
Cell–mineral aggregates formed during anoxygenic Fe(II) oxidation 3489

Fig. A3. Scanning electron micrographs of cell–mineral aggregates produced by Thiodictyon sp. strain F4, Rhodobacter ferrooxidans sp. strainSW2 and Chlorobium ferrooxidans sp. strain KoFox by the oxidation of 2, 4 and 10 mM Fe(II). Images illustrate data provided in Table 2.
Table A2Estimation of the Fe/C ratio in cell–mineral aggregates at the end of Fe(II) oxidation produced by anoxygenic phototrophic bacteriaRhodobacter ferrooxidans sp. strain SW2. Initial Fe(II) concentration of 0.8, 2.0 and 4.0 mM. These values correspond to both Fig. 3 andTable 2.
Initial Fe(II) concentration (mM) mmol/l mol/l g Fe/l mg Fe/l
Total Fe in the cell–mineral aggregates at the end of Fe(II) oxidation
0.8 0.74 0.000740 0.0414 41.442.0 1.80 0.001800 0.1008 100.804.0 3.71 0.003710 0.2078 207.76
Initial Fe(II) concentration (mM) Total cells in aggregate mg C/l
Cells in the cell–mineral aggregates at the end of Fe(II) oxidation
0.8 2.3 � 108 232.0 2.3 � 108 234.0 9.3 � 108 9.3
Important values: dry weight of cells based on the dry weight in early stationary phase (Escherichia coli), 200 fg (Loferer-Krossbacher et al.,1998). The percent of dry mass that is carbon, 50% (Neidhardt et al., 1990). Resulting dry weight in C considered here was 100 fg(1 � 10�10 mg).
Initial Fe(II) concentration (mM) mg Fe/l mg C/l Fe/C
Ratio of Fe/C in the aggregates
0.8 41.44 2.30 � 10�1 1.802 100.80 2.30 � 10�1 4.384 207.76 9.28 � 10�1 2.24
3490 N.R. Posth et al. / Geochimica et Cosmochimica Acta 74 (2010) 3476–3493

Fig. A4. Sedimentation of goethite, lepidocrocite, magnetite and ferrihydrite in sodium polytungstate solutions set to a density of 3.01 g/cm3.Sedimentation of these chemically synthesized iron minerals shown at time 0 and at 0.5, 3.5, 24 and 48 h after the addition of the samples tothe solution. Parallels are shown for each iron (oxy)hydroxide. Arrows and bars show where the precipitates were visible at each time point.
Cell–mineral aggregates formed during anoxygenic Fe(II) oxidation 3491
REFERENCES
Anbar A. D., Duan Y., Lyons T. W., Arnold G. L., Kendall B.,Creaser R. A., Kaufman A. J., Gordon G. W., Scott C., GarvinJ. and Buick R. (2007) A whiff of oxygen before the greatoxidation event?. Science 317 1903–1906.
Bonneville S., Van Cappellen P. and Behrends T. (2004) Microbialreduction of iron (III) oxyhydroxides: effects of mineralsolubility and availability. Chem. Geol. 212, 255–268.
Brocks J. J., Love G. D., Summons R. E., Knoll A. H., Logan G.A. and Bowden S. A. (2005) Biomarker evidence for green and
purple sulphur bacteria in a stratified Palaeoproterozoic sea.Nature 437, 866–870.
Brown D. A., Sherriff B. L., Sawicki J. A. and Sparling R. (1999)Precipitation of iron minerals by a natural microbial consor-tium. Geochim. Cosmochim. Acta 63(15), 2163–2169.
Campbell A. C., Palmer M. R., Klinkhammer G. P., Bowers T. S.,Edmond J. M., Lawrence J. R., Casey J. F., Thompson G.,Humphris S., Rona P. and Karson J. A. (1988) Chemistry ofhot springs on the Mid-Atlantic Ridge. Nature 335, 514–519.
Canfield D. E. (1989) Reactive iron in marine sediments. Geochim.
Cosmochim. Acta 53, 619–632.

3492 N.R. Posth et al. / Geochimica et Cosmochimica Acta 74 (2010) 3476–3493
Chatellier X., Fortin D., West M. M., Rose J., Leppard G. G. andFerris F. G. (2001) Effect of the presence of bacterial surfacesduring the synthesis of Fe oxides by oxidation of ferrous ions.Eur. J. Mineral. 13, 705–714.
Chatellier X., West M. M., Rose J., Fortin D., Leppard G. G. andFerris F. G. (2004) Characterization of iron-oxides formed byoxidation of ferrous iron in the presence of various bacterialspecies and inorganic ligands. Geomicrobiol. J. 21, 99–112.
Clarke W. A., Konhauser K. O., Thomas J. C. and Bottrell S. H.(1997) Ferric hydroxide and ferric hydroxysulfate precipitationby bacteria in an acid mine drainage lagoon. FEMS Microbiol.
Rev. 20, 351–361.
Cornell R. and Schwertmann U. (2003) The Iron Oxides: Struc-
tures, Properties, Reactions, Occurrences and Uses, second ed.Wiley-VCH, Weinheim.
Croal L., Johnson C., Beard B. and Newman D. (2004) Ironisotope fractionation by Fe(II)-oxidizing photoautotrophicbacteria. Geochim. Cosmochim. Acta 68(6), 1227–1242.
Croal L. R., Jiao Y. and Newman D. K. (2007) The fox operonfrom Rhodobacter strain SW2 promotes phototrophic Fe(II)oxidation in Rhodobacter capsulatus SB1003. J. Bacteriol.
189(5), 1774–1782.
Ehrenreich A. and Widdel F. (1994) Anaerobic oxidation of ferrousiron by purple bacteria, a new type of phototrophic metabo-lism. Appl. Environ. Microbiol. 60(12), 4517–4526.
Ewers W. E. and Morris R. C. (1981) Studies of the Dales GorgeMember of the Brockman iron formation, Western Australia.Econ. Geol. 76, 1929–1953.
Ferris F. G. (2005) Biogeochemical properties of bacteriogenic ironoxides. Geomicrobiol. J. 22, 79–85.
Fortin D., Leppard G. G. and Tessier A. (1993) Characteristics oflacustrine diagenetic iron oxyhydroxides. Geochim. Cosmochim.
Acta 57, 4391–4404.
Fortin D. and Langley S. (2005) Formation and occurrence ofbiogenic iron-rich minerals. Earth Sci. Rev. 72, 1–19.
Garrels R. M., Perry, Jr., E. A. and MacKenzie F. T. (1973)Genesis of Precambrian iron-formations and the developmentof atmospheric oxygen. Econ. Geol. 68, 1173–1179.
Glasrud G. G., Navarette R. C., Scriven L. E. and Macosko C.(1993) Settling behaviors if iron oxide suspensions. AIChE J.
39, 560–568.
Gole M. J. and Klein C. (1981) Banded iron formations throughmuch of Precambrian time. J. Geol. 89, 169–183.
Grossart H.-P. and Simon M. (1993) Limnetic macroscopic organicaggregates (lake snow): occurence, characteristics, and micro-bial dynamics in Lake Constance. Limnol. Oceanogr. 38(3),
532–546.
Grotzinger J. P. and Kasting J. F. (1993) New constraints onPrecambrian ocean composition. J. Geol. 101, 235–243.
Hansel C. M., Benner S. G., Neiss J., Dohnalkova A., KukkadapuR. K. and Fendorf S. (2003) Secondary mineralization path-ways induced by dissimilatory iron reduction of ferrihydriteunder advective flow. Geochim. Cosmochim. Acta 67(16), 2977–
2992.
Hansel C. M., Benner S. G., Nico P. and Fendorf S. (2004)Structural constraints of ferric (hydr)oxides on dissimilatoryiron reduction and the fate of Fe(II). Geochim. Cosmochim.
Acta 68(15), 3217–3229.
Hartman H. (1984) The evolution of photosynthesis and microbialmats: a speculation on banded iron formations. In Microbial
Mats: Stromatolites (eds. Y. Cohen, R. W. Castenholz and H.O. Halvorson). Alan Liss, New York, pp. 451–453.
Hegler F., Posth N. R., Jiang J. and Kappler A. (2008) Physiologyof phototrophic iron(II)-oxidizing bacteria: implications formodern and ancient environments. FEMS Microbiol. Ecol. 66,
250–260.
Heising S. and Schink B. (1998) Phototrophic oxidation of ferrousiron by a Rhodomicrobium vannielii strain. Microbiology 144,
2263–2269.
Heising S., Richter L., Ludwig W. and Schink B. (1999) Chloro-
bium ferrooxidans sp. nov., a phototrophic green sulfur bacte-rium that oxidizes ferrous iron in coculture with a Geospirillum
sp. strain. Arch. Microbiol. 172, 116–124.
Hohmann C., Winkler E., Morin G. and Kappler A. (2010)Anaerobic Fe(II)-oxidizing bacteria show As resistance and co-precipitate As during Fe(III) mineral precipitation. Environ.
Sci. Technol. 44, 94–101.
Holland H. D. (1973) The oceans: a possible source of iron in iron-formations. Econ. Geol. 68, 1169–1172.
James R. E. and Ferris F. G. (2004) Evidence for microbial-mediated iron oxidation at a neutrophilic groundwater spring.Chem. Geol. 212, 301–311.
Jiao Y. and Newman D. K. (2007) The pio operon is essential forphototrophic Fe(II) oxidation in Rhodopseudomonas palustris
TIE-1. J. Bacteriol. 189(5), 1765–1773.
Johnson C., Beard B. L. and Roden E. E. (2008) The iron isotopefingerprints of redox and biogeochemical cycling in modern andancient earth. Annu. Rev. Earth Planet. Sci. 36, 457–493.
Kappler A. and Newman D. K. (2004) Formation of Fe (III)minerals by Fe(II) oxidizing photoautotrophic bacteria. Geo-
chim. Cosmochim. Acta 68(6), 1217–1226.
Kappler A. and Straub K. L. (2005) Geomicrobiological cycling ofiron. Rev. Mineral. Geochem. 59, 85–108.
Kappler A., Pasquero C., Konhauser K. O. and Newman D. K.(2005a) Deposition of banded iron formations by anoxygenicphototrophic Fe(II)-oxidizing bacteria. Geology 33, 865–868.
Kappler A., Schink B. and Newman D. K. (2005b) Fe(III) mineralformation and cell encrustation by the nitrate-dependent Fe(II)oxidizer strain BoFeN1. Geobiology 3, 235–245.
Konhauser K. (1997) Bacterial biomineralization in nature. FEMS
Microbiol. Rev. 20, 315–326.
Konhauser K., Hamade T., Raiswell R., Morris R. C., Ferris F. G.,Southam G. and Canfield D. E. (2002) Could bacteria haveformed the Precambrian banded iron formations? Geology 30,
1079–1082.
Konhauser K., Newman D. K. and Kappler A. (2005) Thepotential significance of microbial Fe(III) reduction duringdeposition of Precambrian banded iron formations. Geobiology
3, 167–177.
Konhauser K. O., Pecoits E., Lalonde S. V., Papineau D., NisbetE. G., Barley M. A., Arndt N. T., Zahnle K. and Kamber B. S.(2009) Oceanic nickel depletion and a methanogen faminebefore the great oxidation event. Nature 458, 750–753.
Langley S., Gault A., Ibrahim A., Renaud R., Fortin D., Clark I.D. and Ferris F. G. (2009) A comparison of the rates of Fe(III)reduction in synthetic and bacteriogenic iron oxides by Shewa-
nella putrefaciens CN32. Geomicrobiol. J. 26, 57–70.
Loferer-Krossbacher M., Klima J. and Psenner R. (1998) Deter-mination of bacterial cell dry mass by transmission electronmicroscopy and densitometric image analysis. Appl. Environ.
Microbiol. 64(2), 688–694.
Lovley D. R. and Phillips E. J. P. (1986) Availability of ferric ironfor microbial reduction in bottom sediments of the freshwatertidal Potomac River. Appl. Environ. Microbiol. 52, 751–757.
Miot J., Benzerara K., Morin G., Kappler A., Bernard S., Obst M.,Ferard C., Skouri-Panet F., Guigner J.-M., Posth N. R., GalvezM., Brown, Jr., G. E. and Guyot F. (2009) Iron biomineral-ization by anaerobic neutrophilic iron-oxidizing bacteria. Geo-
chim. Cosmochim. Acta 73, 696–711.
Nealson K. H. and Myers C. R. (1990) Iron reduction by bacteria:a potential role in the genesis of banded iron formations. Am. J.
Sci. 290-A, 35–45.

Cell–mineral aggregates formed during anoxygenic Fe(II) oxidation 3493
Neidhardt F., Ingraham J. and Schaechter M. (1990) Physiology of
the Bacterial Cell: A Molecular Approach. Sinauer Associates,Inc., Sunderland, Massachusetts.
Paerl H. W. and Prufert L. E. (1987) Oxygen-poor microzones aspotential sites of microbial N2 fixation in nitrogen-depletedaerobic marine waters. Appl. Environ. Microbiol. 53(5), 1078–
1087.
Papineau D., Walker J. J., Mojzsis S. J. and Pace N. R. (2005)Composition and structure of microbial communities fromstromatolites of Hamelin pool in Shark Bay, Western Australia.Appl. Environ. Microbiol. 71, 4822–4832.
Posth N. R., Hegler F., Konhauser K. O. and Kappler A. (2008)Alternating Si and Fe deposition caused by temperaturefluctuations in Precambrian oceans. Nat. Geosci. 1(10), 703–
708.
Posth N. R., Konhauser K. O. and Kappler A. (in press)Microbiological processes in BIF deposition. In AuthigenicMinerals: Sedimentology, Geochemistry, Origins, Distributionand Applications, J. Sedimentology IAS Special Publication
Series (eds. C. Glenn and I. Jarvis).Postma D. (1993) The reactivity of iron oxides in sediments: a
kinetic approach. Geochim. Cosmochim. Acta 57, 5027–5034.
Rashby S. E., Sessions A. L., Summons R. E. and Newman D. K.(2007) Biosynthesis of 2-methylbacteriohopanepolyols by ananoxygenic phototroph. Proc. Natl. Acad. Sci. USA 104,
15099–15104.
Roden E. (2003) Fe(III) oxide reactivity toward biological versuschemical reduction. Environ. Sci. Technol. 37, 1319–1324.
Roden E. (2004) Analysis of long-term bacterial vs. chemicalFe(III) oxide reduction kinetics. Geochim. Cosmochim. Acta
68(15), 3205–3216.
Roden E. and Zachara J. (1996) Microbial reduction of crystallineiron (III) oxides: influence of oxid surface area and potential forcell growth. Environ. Sci. Technol. 30, 1618–1628.
Rothman D. H., Hayes J. M. and Summons R. E. (2003) Dynamicsof the Neoproterozoic carbon cycle. Proc. Natl. Acad. Sci. USA
100, 8124–8129.
Schadler S., Burkhardt C. and Kappler A. (2008) Evaluation ofelectron microscopic sample preparation methods and imagingtechniques for characterization of cell–mineral aggregates.Geomicrobiol. J. 25, 228–239.
Schadler S., Burkhardt C., Hegler F., Straub K. L., Miot J.,Benzerara K. and Kappler A. (2009) Formation of cell–iron–mineral aggregates by phototrophic and nitrate-reducing anaer-obic Fe(II)-oxidizing bacteria. Geomicrobiol. J. 26, 93–103.
Schwertman U., Friedl J. and Stanjek H. (1999) From Fe(III) ionsto ferrihydrite and then to hematite. J. Colloid Interface Sci.
209, 215–223.
Schwertmann U. and Cornell R. M. (2000) Iron Oxides in the
Laboratory. Wiley-VCH, Weinheim.Sobolev D. and Roden E. E. (2001) Suboxic deposition of ferric
iron by bacteria in opposing gradients of Fe(II) and oxygen atcircumneutral pH. Appl. Environ. Microbiol. 67(3), 1328–1334.
Stookey L. (1970) Ferrozine—a new spectrophotometric reagentfor iron. Anal. Chem. 42, 779–781.
Straub K. L., Hanzlik M. and Buchholz-Cleven B. E. E. (1998) Theuse of biologically produced ferrihydrite for the isolation of
novel iron-reducing bacteria. Syst. Appl. Microbiol. 21, 442–
449.
Strauss H. (2003) Sulphur isotopes and the early Archean sulphurcycle. Precambrian Res. 126, 349–361.
Stumm W. and Morgan J. L. (1996) Aquatic Chemistry: Chemical
Equilibria and Rates in Natural Waters. John Wiley & Sons,New York.
Suter D., Siffert C., Sulzberger B. and Stumm W. (1988)Catalytic dissolution of iron(III) (hydr)oxides by oxalicacid in the presence of Fe(II). Naturwissenschaften 75, 571–
573.
Thamdrup B. (2000) Bacterial manganese and iron reduction inaquatic sediments. Adv. Microb. Ecol. 16, 41–84.
Trouwborst R. E., Johnston A., Koch G., Luther, III, G. W. andPierson B. K. (2007) Biogeochemistry of Fe(II) oxidation in aphotosynthetic microbial mat: implications for PrecambrianFe(II) oxidation. Geochim. Cosmochim. Acta 71, 4629–
4643.
Tschech A. and Pfennig N. (1984) Growth yield increase linked tocaffeate reduction in Acetobacterium woodii. Arch. Microbiol.
137, 163–167.
Viollier E., Inglett P., Hunter K., Roychoudhury A. and VanCappellen P. (2000) The ferrozine method revisited: Fe(II)/Fe(III) determination in natural waters. Appl. Geochem. 15,
785–790.
Wakeman S. G. and Lee C. (1993) Production, transport, andalteration of particulate organic matter in the marine watercolumn. In Organic Geochemistry (eds. M. H. Engel and S. A.Macko). Plenum Press, New York, pp. 145–169.
Weber K. A., Achenbach L. A. and Coates J. D. (2006)Microorganisms pumping iron: anaerobic microbial iron oxi-dation and reduction. Nat. Rev. 4, 752–764.
Widdel F. (1980) Anaerober Abbau von Fettsauren und Benz-oesaure durch neu isolierte Arten Sulfat-reduzierender Bakte-rien. Doctorate dissertation, University of Gottingen, FRG.
Widdel F. and Pfennig N. (1981) Studies on dissimilatory sulfate-reducing bacteria that decompose fatty acids: I. Isolation of anew sulfate-reducer enriched with acetate from saline environ-ments. Description of Desulfobacter postgatei gen. nov. sp.nov.. Arch. Microbiol. 129, 395–400.
Widdel F., Schnell S., Heising S., Ehrenreich A., Assmus B. andSchink B. (1993) Ferrous iron oxidation by anoxygenic photo-trophic bacteria. Nature 362, 834–836.
Wu L., Beard B. L., Roden E. E. and Johnson C. M. (2009)Influence of pH and dissolved Si on Fe isotope fractionationduring dissimilatory microbial reduction of hematite. Geochem.
Cosmochim. Acta 73, 5584–5599.
Yarzabal A., Brasseur G., Ratouchniak J., Lund K., Lemesle-Meunier D., DeMoss J. A. and Bonnefoy V. (2002) The high-molecular-weight cytochrome c Cyc2 of Acidithiobacillus ferro-
oxidans is an outer membrane protein. J. Bacteriol. 184, 313–
317.
Xiong J. (2006) Photosynthesis: What Color Was Its Origin?Genome Biol. 7, 245.1–245.5.
Associate editor: Stephan M. Kraemer