Mineral and Organic Matter Characterization of Density...
25
2 Mineral and Organic Matter Characterization of Density Fractions of Basalt- and Granite-Derived Soils in Montane California C. Castanha 1 , S.E. Trumbore 2 and R. Amundson 3 1 Earth Sciences Division, Lawrence Berkeley National Laboratory, Berkeley, 2 Max Planck Institute for Biogeochemistry, Jena, 3 Division of Ecosystem Sciences, University of California Berkeley, 1,3 USA 2 Germany 1. Introduction There is ample evidence that soil mineralogy affects carbon cycling rates (e.g. Feller and Beare, 1997; Masiello et al., 2004; Torn et al., 1997). Humus may be physically protected from biological attack by (1) direct adhesion to clay surfaces via electrostatic interactions, hydrogen bonds, and cation bridges; (2) complexation with Fe and Al cations, amorphous oxides, and terminal atoms within the mineral structure; and (3) occlusion within mineral aggregates (Baldock and Skjemstad, 2000; Krull et al., 2003). In addition, the mineral matrix affects the stability of soil organic matter (OM) via the distribution of soil pores, water retention, O 2 diffusion, and the pH of soil water. But while methods for measuring the effects of texture, aggregation, and structure are relatively well-established (see Christensen, 1992 for a review), there is no generally accepted way of isolating discrete organo-mineral complexes, so that the effects of distinct minerals can be compared and ultimately extrapolated over a wide range of mineral and environmental conditions. Density has routinely been used to separate soil OM fractions based on their degree of association with mineral particles (Baisden et al., 2002; Christensen, 1992; Golchin et al., 1995; Monnier et al., 1962). In addition, due to variations in the specific gravity of different minerals, it has also served as a proxy for mineral species in clay (Jaynes and Bigham, 1986; Spycher and Young, 1979) and silt (Shang and Tiessen, 1998). In this study we evaluate density as a means of separating organo-mineral complexes, and use this method to explore the role of mineralogy on OM storage and cycling. In an early study along the western flank of California’s Sierra Nevada, mafic soils were found to have higher levels of clay, carbon (C), and nitrogen (N), but lower levels of OM per unit of clay (Harradine and Jenny, 1958; Harradine, 1954). To learn more about the reasons www.intechopen.com
Transcript of Mineral and Organic Matter Characterization of Density...
2
Mineral and Organic Matter Characterization of Density Fractions of Basalt-
and Granite-Derived Soils in Montane California
C. Castanha1, S.E. Trumbore2 and R. Amundson3 1Earth Sciences Division,
Lawrence Berkeley National Laboratory, Berkeley, 2Max Planck Institute for Biogeochemistry, Jena,
3Division of Ecosystem Sciences, University of California Berkeley,
1,3USA 2Germany
1. Introduction
There is ample evidence that soil mineralogy affects carbon cycling rates (e.g. Feller and Beare, 1997; Masiello et al., 2004; Torn et al., 1997). Humus may be physically protected from biological attack by (1) direct adhesion to clay surfaces via electrostatic interactions, hydrogen bonds, and cation bridges; (2) complexation with Fe and Al cations, amorphous oxides, and terminal atoms within the mineral structure; and (3) occlusion within mineral aggregates (Baldock and Skjemstad, 2000; Krull et al., 2003). In addition, the mineral matrix affects the stability of soil organic matter (OM) via the distribution of soil pores, water retention, O2 diffusion, and the pH of soil water. But while methods for measuring the effects of texture, aggregation, and structure are relatively well-established (see Christensen, 1992 for a review), there is no generally accepted way of isolating discrete organo-mineral complexes, so that the effects of distinct minerals can be compared and ultimately extrapolated over a wide range of mineral and environmental conditions.
Density has routinely been used to separate soil OM fractions based on their degree of association with mineral particles (Baisden et al., 2002; Christensen, 1992; Golchin et al., 1995; Monnier et al., 1962). In addition, due to variations in the specific gravity of different minerals, it has also served as a proxy for mineral species in clay (Jaynes and Bigham, 1986; Spycher and Young, 1979) and silt (Shang and Tiessen, 1998). In this study we evaluate density as a means of separating organo-mineral complexes, and use this method to explore the role of mineralogy on OM storage and cycling.
In an early study along the western flank of California’s Sierra Nevada, mafic soils were found to have higher levels of clay, carbon (C), and nitrogen (N), but lower levels of OM per unit of clay (Harradine and Jenny, 1958; Harradine, 1954). To learn more about the reasons
www.intechopen.com
An Introduction to the Study of Mineralogy
16
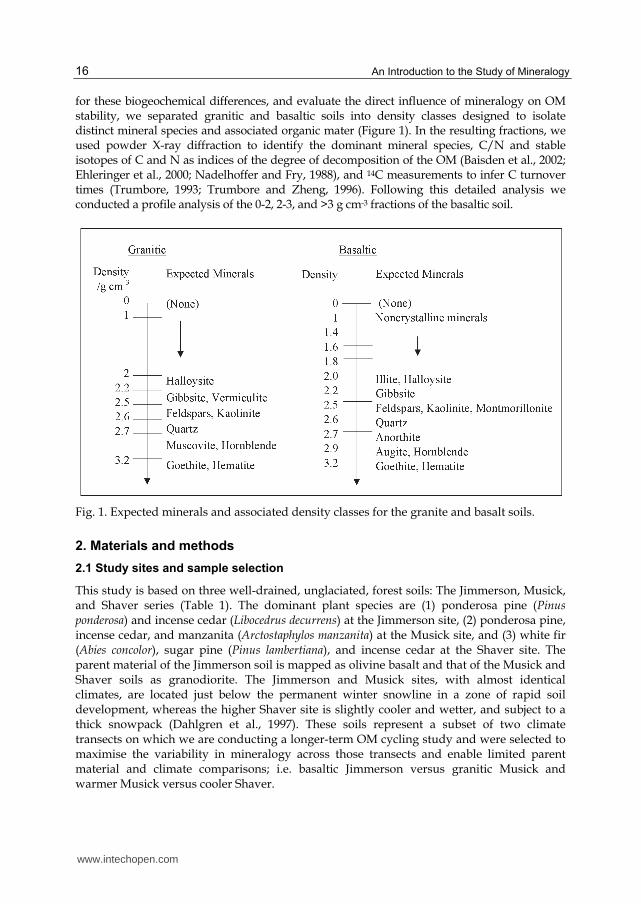
for these biogeochemical differences, and evaluate the direct influence of mineralogy on OM stability, we separated granitic and basaltic soils into density classes designed to isolate distinct mineral species and associated organic mater (Figure 1). In the resulting fractions, we used powder X-ray diffraction to identify the dominant mineral species, C/N and stable isotopes of C and N as indices of the degree of decomposition of the OM (Baisden et al., 2002; Ehleringer et al., 2000; Nadelhoffer and Fry, 1988), and 14C measurements to infer C turnover times (Trumbore, 1993; Trumbore and Zheng, 1996). Following this detailed analysis we conducted a profile analysis of the 0-2, 2-3, and >3 g cm-3 fractions of the basaltic soil.
Fig. 1. Expected minerals and associated density classes for the granite and basalt soils.
2. Materials and methods
2.1 Study sites and sample selection
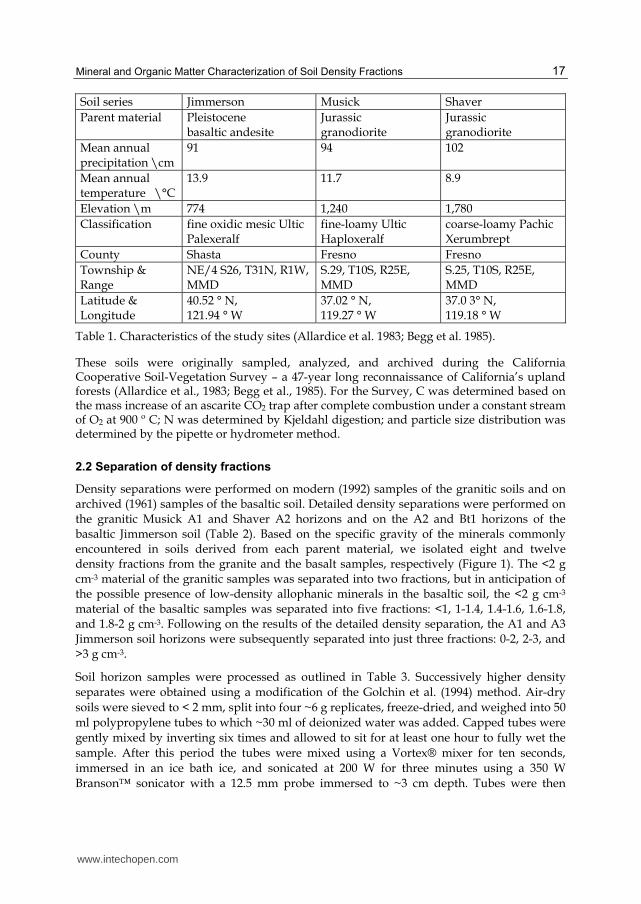
This study is based on three well-drained, unglaciated, forest soils: The Jimmerson, Musick, and Shaver series (Table 1). The dominant plant species are (1) ponderosa pine (Pinus ponderosa) and incense cedar (Libocedrus decurrens) at the Jimmerson site, (2) ponderosa pine, incense cedar, and manzanita (Arctostaphylos manzanita) at the Musick site, and (3) white fir (Abies concolor), sugar pine (Pinus lambertiana), and incense cedar at the Shaver site. The parent material of the Jimmerson soil is mapped as olivine basalt and that of the Musick and Shaver soils as granodiorite. The Jimmerson and Musick sites, with almost identical climates, are located just below the permanent winter snowline in a zone of rapid soil development, whereas the higher Shaver site is slightly cooler and wetter, and subject to a thick snowpack (Dahlgren et al., 1997). These soils represent a subset of two climate transects on which we are conducting a longer-term OM cycling study and were selected to maximise the variability in mineralogy across those transects and enable limited parent material and climate comparisons; i.e. basaltic Jimmerson versus granitic Musick and warmer Musick versus cooler Shaver.
www.intechopen.com
Mineral and Organic Matter Characterization of Soil Density Fractions
17
Soil series Jimmerson Musick Shaver
Parent material Pleistocene basaltic andesite
Jurassic granodiorite
Jurassic granodiorite
Mean annual precipitation \cm
91 94 102
Mean annual temperature \°C
13.9 11.7 8.9
Elevation \m 774 1,240 1,780
Classification fine oxidic mesic Ultic Palexeralf
fine-loamy Ultic Haploxeralf
coarse-loamy Pachic Xerumbrept
County Shasta Fresno Fresno
Township & Range
NE/4 S26, T31N, R1W, MMD
S.29, T10S, R25E, MMD
S.25, T10S, R25E, MMD
Latitude & Longitude
40.52 ° N, 121.94 ° W
37.02 ° N, 119.27 ° W
37.0 3° N, 119.18 ° W
Table 1. Characteristics of the study sites (Allardice et al. 1983; Begg et al. 1985).
These soils were originally sampled, analyzed, and archived during the California Cooperative Soil-Vegetation Survey – a 47-year long reconnaissance of California’s upland forests (Allardice et al., 1983; Begg et al., 1985). For the Survey, C was determined based on the mass increase of an ascarite CO2 trap after complete combustion under a constant stream of O2 at 900 º C; N was determined by Kjeldahl digestion; and particle size distribution was determined by the pipette or hydrometer method.
2.2 Separation of density fractions
Density separations were performed on modern (1992) samples of the granitic soils and on archived (1961) samples of the basaltic soil. Detailed density separations were performed on the granitic Musick A1 and Shaver A2 horizons and on the A2 and Bt1 horizons of the basaltic Jimmerson soil (Table 2). Based on the specific gravity of the minerals commonly encountered in soils derived from each parent material, we isolated eight and twelve density fractions from the granite and the basalt samples, respectively (Figure 1). The <2 g cm-3 material of the granitic samples was separated into two fractions, but in anticipation of the possible presence of low-density allophanic minerals in the basaltic soil, the <2 g cm-3 material of the basaltic samples was separated into five fractions: <1, 1-1.4, 1.4-1.6, 1.6-1.8, and 1.8-2 g cm-3. Following on the results of the detailed density separation, the A1 and A3 Jimmerson soil horizons were subsequently separated into just three fractions: 0-2, 2-3, and >3 g cm-3.
Soil horizon samples were processed as outlined in Table 3. Successively higher density
separates were obtained using a modification of the Golchin et al. (1994) method. Air-dry
soils were sieved to < 2 mm, split into four ~6 g replicates, freeze-dried, and weighed into 50
ml polypropylene tubes to which ~30 ml of deionized water was added. Capped tubes were
gently mixed by inverting six times and allowed to sit for at least one hour to fully wet the
sample. After this period the tubes were mixed using a Vortex® mixer for ten seconds,
immersed in an ice bath ice, and sonicated at 200 W for three minutes using a 350 W
Branson™ sonicator with a 12.5 mm probe immersed to ~3 cm depth. Tubes were then
www.intechopen.com
An Introduction to the Study of Mineralogy
18
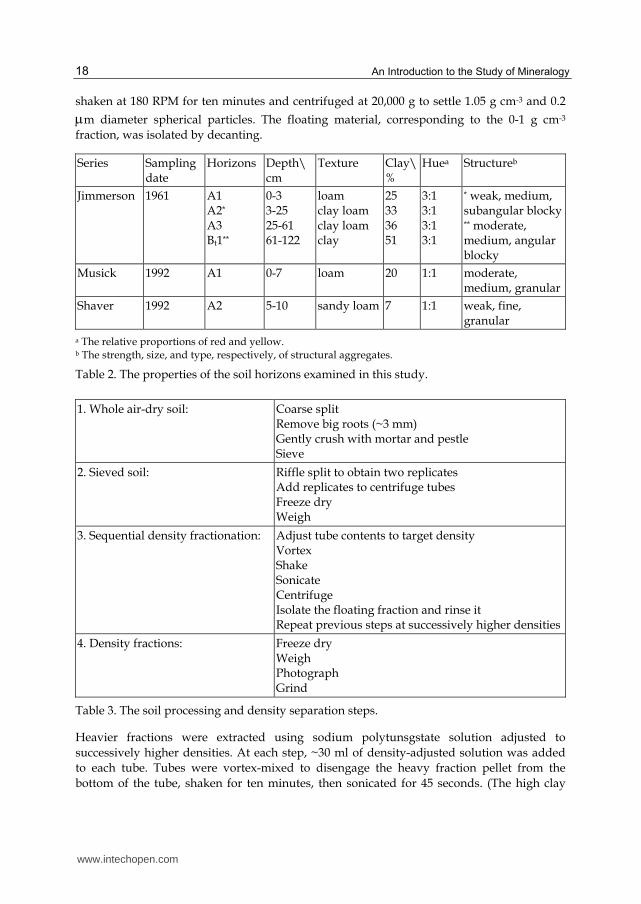
shaken at 180 RPM for ten minutes and centrifuged at 20,000 g to settle 1.05 g cm-3 and 0.2
m diameter spherical particles. The floating material, corresponding to the 0-1 g cm-3
fraction, was isolated by decanting.
Series Sampling date
Horizons Depth\ cm
Texture Clay\%
Huea Structureb
Jimmerson
1961 A1 A2* A3 Bt1**
0-3 3-25 25-61 61-122
loam clay loam clay loam clay
25 33 36 51
3:1 3:1 3:1 3:1
* weak, medium, subangular blocky ** moderate, medium, angular blocky
Musick 1992 A1 0-7 loam 20 1:1 moderate, medium, granular
Shaver 1992 A2 5-10 sandy loam 7 1:1 weak, fine, granular
a The relative proportions of red and yellow. b The strength, size, and type, respectively, of structural aggregates.
Table 2. The properties of the soil horizons examined in this study.
1. Whole air-dry soil:
Coarse split Remove big roots (~3 mm) Gently crush with mortar and pestle Sieve
2. Sieved soil:
Riffle split to obtain two replicates Add replicates to centrifuge tubes Freeze dry Weigh
3. Sequential density fractionation: Adjust tube contents to target density Vortex Shake Sonicate Centrifuge Isolate the floating fraction and rinse it Repeat previous steps at successively higher densities
4. Density fractions: Freeze dry Weigh Photograph Grind
Table 3. The soil processing and density separation steps.
Heavier fractions were extracted using sodium polytunsgstate solution adjusted to
successively higher densities. At each step, ~30 ml of density-adjusted solution was added
to each tube. Tubes were vortex-mixed to disengage the heavy fraction pellet from the
bottom of the tube, shaken for ten minutes, then sonicated for 45 seconds. (The high clay
www.intechopen.com

Mineral and Organic Matter Characterization of Soil Density Fractions
19
content of the Jimmerson Bt1 horizon made it extremely difficult to disengage and disperse
the pellet from the bottom of the tube; for these samples, shaking and sonication times were
increased as necessary). Following sonication, tubes were centrifuged to settle 0.2 m
diameter spherical particles with a density 0.05 g cm-3 higher than the solution. Following
centrifugation the floating fractions were isolated: Floating fractions with densities less than
2 g cm-3 were decanted onto precombusted and tared quartz fiber filters and rinsed with 1 L
deionized water. Higher density floating fractions were decanted into clean 50 ml tubes,
diluted with enough water to allow them to settle, centrifuged, and rinsed 3-4 times with
deionized water. All fractions were freeze-dried and weighed.
2.3 Characterization of density fractions
Morphology. Density fraction were observed and photographed through a Leica Stereo
Zoom visual microscope using a Sony Cybershot digital camera.
Mineralogy. Single laboratory replicates were ground to <100 m and placed in a Rigaku
Geigerflex (Cu K) X-ray diffractometer. The diffraction intensity was recorded every 0.05°
for 2.5 seconds by Theta software and the mineral species were identified based on the
resulting powder X-ray diffraction (XRD) spectra (Barnhisel and Bertsch, 1989; Brindley and
Brown, 1984).
Carbon, nitrogen, and stable isotopes. Two laboratory replicates were ground to <200 m
and analyzed on a Europa 20/20 continuous flow stable isotope ratio mass spectrometer at
the Center for Stable Isotope Biogeochemistry, University of California, Berkeley. The C and
N isotope ratios are reported as 13C and 15N values, where the standard is Pee Dee
Belemnite carbonate for C (Kendall and Caldwell, 1998) and atmospheric N2 for N. If
replicate size was insufficient for a stable isotope measurement, replicates were either
pooled or analyzed on a Carlo Erba CN Analyzer.
Radiocarbon. Single samples were weighed and sealed in evacuated Vycor tubes with 0.5g Cu, 1 g CuO, and a strip of Ag foil (Boutton, 1991), combusted for three hours at 875 º C, then cooled (Minagawa et al., 1984). The evolved CO2 was cryogenically purified under vacuum and measured manometrically. At the Center for Accelerator Mass Spectrometry, Lawrence Livermore National Labs, the CO2 gas was reduced to graphite on which 14C was
measured and reported as 14C (‰):
14C = (F-1) 1000 (1)
where
14
12( 25) (1950 )
14
121950 tan ( 19)
0.95
sample y
s dard
C
CF e
C
C
(2)
F is the absolute fraction modern, the ratio between the 14C/12C of the samples, (normalized
to 13C=-25 ‰) and that of the international standard (95% of the activity of the NBS oxalic
www.intechopen.com
An Introduction to the Study of Mineralogy
20
acid standard in AD 1950 normalized to 13C=-19 ‰). This value is corrected for the
radioactive decay of the standard between 1950 and y, the year of the measurement (Stuiver
and Polach, 1977). The radioactive decay constant, , is 1.21E-4 year-1. The F values of pre-
bomb atmospheric CO2 correspond to ~1, values <1 indicate that radioactive decay to has
taken place, and values >1 indicate that “bomb carbon” has been incorporated into the
sample.
2.4 The carbon turnover models
A mass balance model of soil organic C states that:
dCi/dt = Ii - kiCi (3)
where Ci is the carbon inventory in pool i, I is annual carbon inputs (mass year-1), and k is
the first-order decomposition constant (year-1). Similarly, the balance of 14C atoms in
reservoir i, FiCi, can be described by:
d (FiCi) /dt = Fatm I - FiCi (ki+) (4)
where, Fi is the 14C value of pool i, FC is the 14C inventory, and Fatm is the 14C value of the
atmosphere. Starting with the common assumption that the system is in steady state with
respect to 12C, and hence, Ii = kiCi (from Equation3), we used two distinct approaches to
translate the 14C values of density fractions into their turnover times (Ti), defined as 1/ki:
1. For the 1961 basalt soil fractions, which lack bomb-derived carbon, it is assumed that Fatm
= 1 (pre-bomb conditions). Thus, from Equation 4, Fatm I = Fi Ci (ki+), and
Fi = ki/(ki+) (5)
2. For the 1992 granite soil fractions, which contain bomb carbon, the 14C value of the
density fractions was translated into turnover times using a time-dependent box model. The
time series was initialized in 1890, using Equation 5. In each subsequent year (t):
C t Ft= I Fatm(t-lag) + Ct-1Ft-1 (1-k-) (6)
where Ct Ft is the 14C inventory of a soil fraction in year t; Fatm is the 14C value of the
atmosphere (Levin and Hesshaimer, 2000), and lag is the average number of years that
atmospheric carbon is retained in plant tissue before becoming part of the soil OM pool. The
remaining terms are defined as above. Given that at steady state, C t = C t-1 (and Ii = kiCi, as
above), we divide equation 6 by Ct, and obtain
Ft = Ftatm(t-lag) k + Ft-1 (1-k-) (7)
By matching the modelled and measured F values for the year in which the soil was
sampled, the decomposition constant, k (and corresponding turnover time) can be extracted.
This model assumes the fraction being modelled is homogeneous; i.e. that the
decomposition rate is the same for every C atom of the population. While this assumption
may be erroneous, the average turnover times derived using this approach allow for
comparisons among soils and fractions.
www.intechopen.com
Mineral and Organic Matter Characterization of Soil Density Fractions
21
3. Results
3.1 Morphology and mineralogy
Whole soil
The whole soil morphological attributes (Table 2) indicate that the degree of development of
the three soils increases from the Shaver, to the Musick, to the Jimmerson series. The Shaver
soil had a low clay content and poorly developed structure (fragile granules 1-2 mm in
diameter), whereas the Musick soil had higher clay and stronger structure (spherical
granules 2-5 mm in diameter). The Jimmerson soil had the highest clay content, a distinctly
redder hue (reflecting abundant iron oxides), and very strong structure (3-dimensional
blocks 10-20 mm in diameter). As will become evident, these morphological differences,
especially between the granite and the basalt soils, influenced the density separation results.
Density fractions
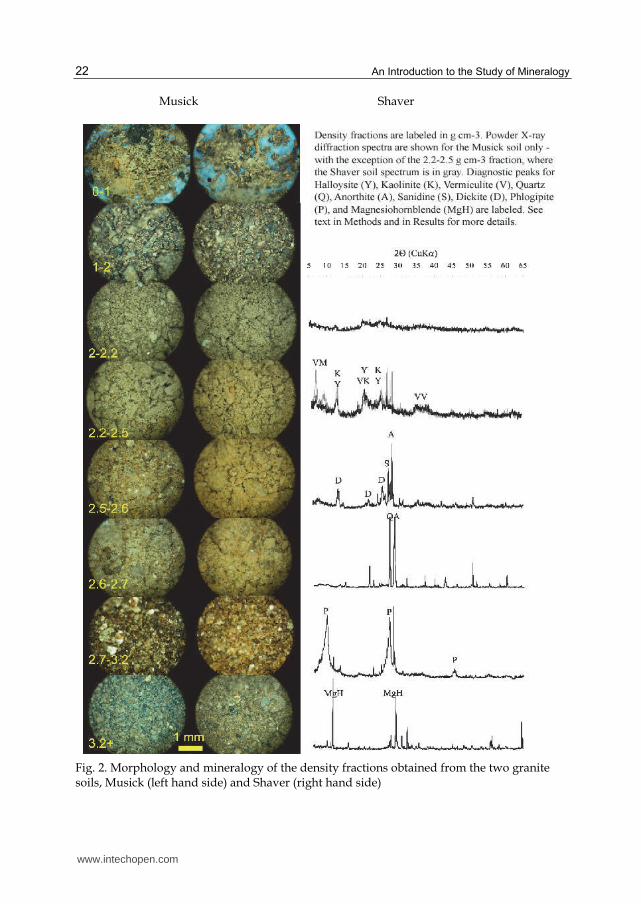
Granitic soils. We found striking differences in the morphology and powder X-ray diffraction (XRD) patterns across the density fractions of the granite soils (Figure 2). We found a mixture of organic matter, fine roots, root bark, mineral grains, and charcoal in the 1-2 g cm-3 fractions; decomposed organic matter, fine roots, and kaolin clays (kaolinite and halloysite) in the 2.0-2.2 g cm-3 fractions; kaolins and very few roots in the 2.2-2.5 g cm-3 fractions; dickite (a kaolin) and feldspars (principally anorthite, but also microcline and
sanidine) in the 2.5-2.6 g cm-3 fractions; quartz (large peak at 2 = 26.6˚, smaller peaks at 20.8, 50, and 59.9˚) and anorthite in the 2.6-2.7 g cm-3 fractions; phlogopite (mica) and some anorthite or albite in the 2.7-3.2 g cm-3 fraction; and magnesiohornblende grains in the >3.2 g cm-3 fractions.
The main difference in the mineralogy of the Shaver and Musick was that, in addition to
kaolins, we found gibbsite (peak at 2 = 18.3˚) and hydroxyl-interlayered vermiculite in the
2.2-2.5 g cm-3 Shaver fraction.
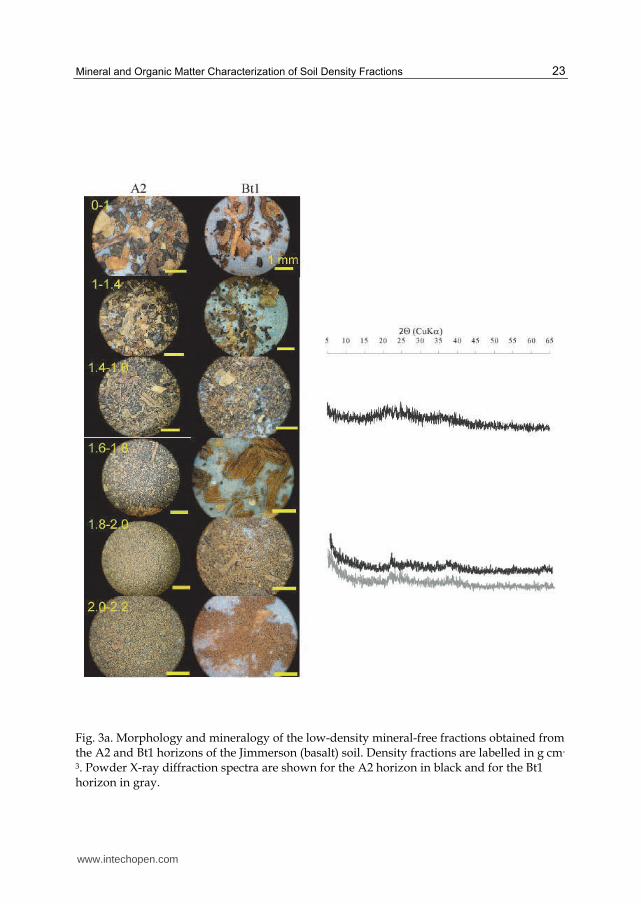
Basaltic soil. From 0 to 2 g cm-3 in the A2 and Bt1 horizons of the Jimmerson soil, OM
content and sample heterogeneity decreased steadily and the OM changed from
recognizable plant parts to more disintegrated and decomposed material (Figure 3a).
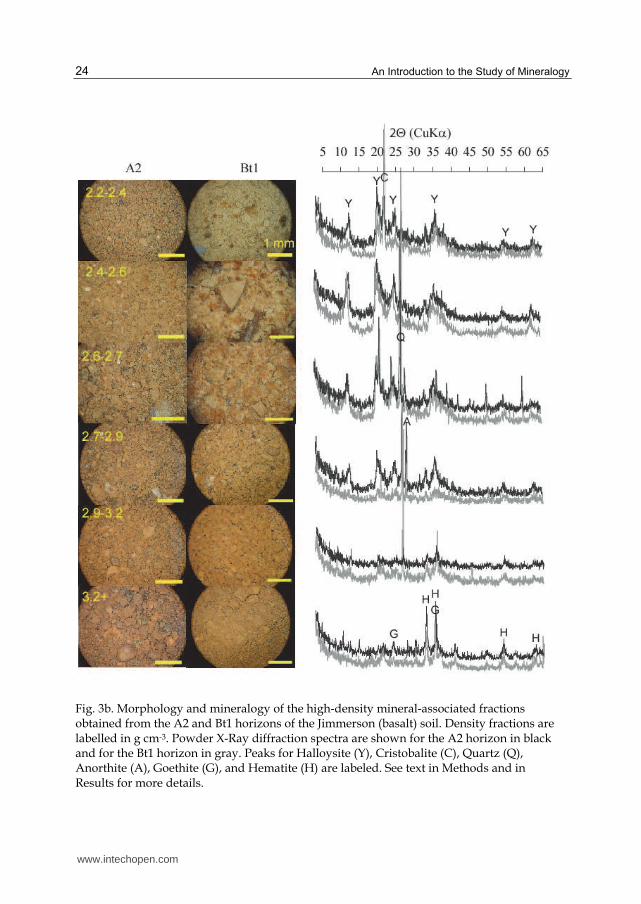
The diffraction patterns of the mineral density fractions, which were similar for A and B horizons, changed gradually with density (Figure 3b). Halloysite dominated the spectrum between 2.4 and 2.6 g cm-3, and remained an important phase up to 2.9 g cm-3. We found cristobalite in the 2.2-2.4 g cm-3 fraction; feldspar and quartz grains between 2.4 and 2.9 g cm-3 (A horizon) or between 2.6 and 2.9 g cm-3 (B horizon); quartz in the 2.6-2.7 g cm-3 fractions (its peak dwarfed all others and only the base is shown); and anorthite and/or albite in the 2.7-2.9 g cm-3 fraction. The orange skins we observed in the 2.2-2.7 g cm-3 fractions in the B horizon, which did not produce diagnostic XRD patterns, were presumably amorphous iron oxides. From 2.7 to 3.2 g cm-3 a transition occurred from fine halloysite particles to large reddish and metallic silver particles (A horizon) or to red/yellow particles (B horizon). Above 3.2 g cm-3 goethite and hematite phases dominate. The peak ratio at 35.6º versus 33.2º signifies relatively more goethite in the B horizon, which agrees with the difference in hue: More red in the A horizon and more yellow in the B horizon.
www.intechopen.com
An Introduction to the Study of Mineralogy
22
Musick Shaver
Fig. 2. Morphology and mineralogy of the density fractions obtained from the two granite soils, Musick (left hand side) and Shaver (right hand side)
www.intechopen.com
Mineral and Organic Matter Characterization of Soil Density Fractions
23
Fig. 3a. Morphology and mineralogy of the low-density mineral-free fractions obtained from the A2 and Bt1 horizons of the Jimmerson (basalt) soil. Density fractions are labelled in g cm-
3. Powder X-ray diffraction spectra are shown for the A2 horizon in black and for the Bt1 horizon in gray.
www.intechopen.com
An Introduction to the Study of Mineralogy
24
Fig. 3b. Morphology and mineralogy of the high-density mineral-associated fractions obtained from the A2 and Bt1 horizons of the Jimmerson (basalt) soil. Density fractions are labelled in g cm-3. Powder X-Ray diffraction spectra are shown for the A2 horizon in black and for the Bt1 horizon in gray. Peaks for Halloysite (Y), Cristobalite (C), Quartz (Q), Anorthite (A), Goethite (G), and Hematite (H) are labeled. See text in Methods and in Results for more details.
www.intechopen.com
Mineral and Organic Matter Characterization of Soil Density Fractions
25
3.2 Chemistry
Whole soil
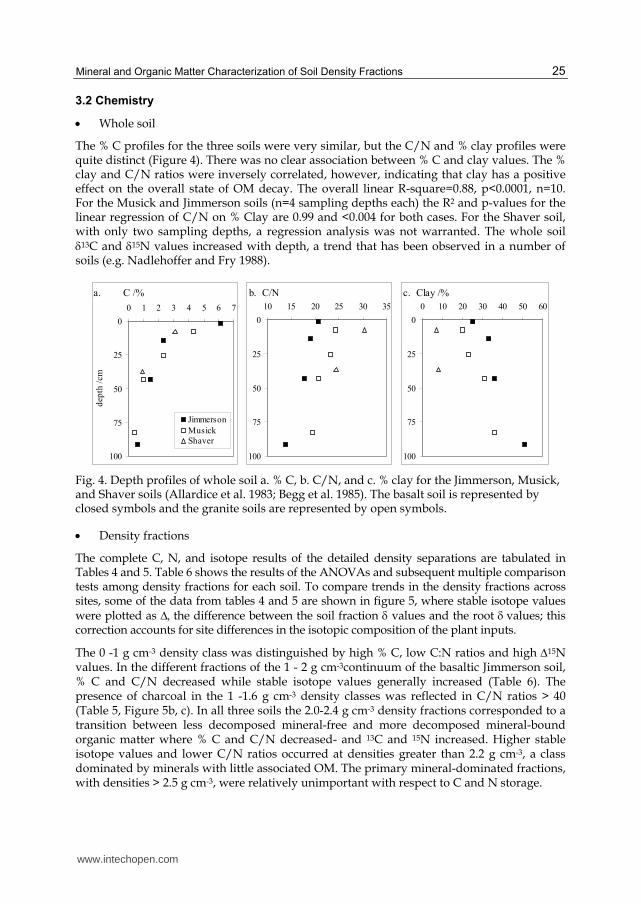
The % C profiles for the three soils were very similar, but the C/N and % clay profiles were quite distinct (Figure 4). There was no clear association between % C and clay values. The % clay and C/N ratios were inversely correlated, however, indicating that clay has a positive effect on the overall state of OM decay. The overall linear R-square=0.88, p<0.0001, n=10. For the Musick and Jimmerson soils (n=4 sampling depths each) the R2 and p-values for the linear regression of C/N on % Clay are 0.99 and <0.004 for both cases. For the Shaver soil, with only two sampling depths, a regression analysis was not warranted. The whole soil 13C and 15N values increased with depth, a trend that has been observed in a number of soils (e.g. Nadlehoffer and Fry 1988).
0
25
50
75
100
0 1 2 3 4 5 6 7
a. C /%
dep
th /
cm
Jimmerson
Musick
Shaver
0
25
50
75
100
10 15 20 25 30 35
b. C/N
0
25
50
75
100
0 10 20 30 40 50 60
c. Clay /%
Fig. 4. Depth profiles of whole soil a. % C, b. C/N, and c. % clay for the Jimmerson, Musick, and Shaver soils (Allardice et al. 1983; Begg et al. 1985). The basalt soil is represented by closed symbols and the granite soils are represented by open symbols.
Density fractions
The complete C, N, and isotope results of the detailed density separations are tabulated in Tables 4 and 5. Table 6 shows the results of the ANOVAs and subsequent multiple comparison tests among density fractions for each soil. To compare trends in the density fractions across sites, some of the data from tables 4 and 5 are shown in figure 5, where stable isotope values were plotted as the difference between the soil fraction values and the root values; this correction accounts for site differences in the isotopic composition of the plant inputs.
The 0 -1 g cm-3 density class was distinguished by high % C, low C:N ratios and high 15N values. In the different fractions of the 1 - 2 g cm-3continuum of the basaltic Jimmerson soil, % C and C/N decreased while stable isotope values generally increased (Table 6). The presence of charcoal in the 1 -1.6 g cm-3 density classes was reflected in C/N ratios > 40 (Table 5, Figure 5b, c). In all three soils the 2.0-2.4 g cm-3 density fractions corresponded to a transition between less decomposed mineral-free and more decomposed mineral-bound organic matter where % C and C/N decreased- and 13C and 15N increased. Higher stable isotope values and lower C/N ratios occurred at densities greater than 2.2 g cm-3, a class dominated by minerals with little associated OM. The primary mineral-dominated fractions, with densities > 2.5 g cm-3, were relatively unimportant with respect to C and N storage.
www.intechopen.com
A
n In
trod
uctio
n to
the
Stu
dy o
f Min
era
log
y
26
Density fraction /g cm-3
(mineral in fraction) mean s.e. mean s.e. mean s.e. mean s.e. mean s.e. mean s.e. mean s.e. mean s.e. F error F error
Musick
Bulk measured 4.0 0.5 0.18 0.0 22.8 2.8 -25.6 0.1 1.2 0.2 1.097 0.004
Roots 30.1 5.8 0.71 0.1 42.4 11.0 -26.0 0.2 -2.0 0.8
0-1 (free OM) 0.001 0.000 0.01 0.01 31.4 1.82 17.2 -26.2 1.3
1-2 (free OM) 0.063 0.001 0.60 0.07 0.47 0.02 38.7 0.0 1.31 0.0 29.6 0.8 -26.3 0.1 -0.1 0.2
2-2.2 (Kaolin) 0.035 0.001 0.11 0.01 0.18 0.01 12.5 0.4 0.85 0.0 14.6 0.5 -25.0 0.1 2.2 0.0 1.064 0.004
2.2-2.5 (Kaolin) 0.170 0.003 0.09 0.01 0.21 0.01 2.1 0.1 0.20 0.0 10.5 0.4 -24.2 0.0 3.2 0.0 1.068 0.004
2.5-2.6 (Feldspars) 0.182 0.007 0.03 0.00 0.05 0.00 0.6 0.0 0.05 0.0 11.3 0.3 -24.2 0.0 2.9 0.3 1.038 0.004
2.6-2.7 (Quartz) 0.356 0.013 0.01 0.00 0.02 0.00 0.1 0.0 0.01 0.0 9.4 0.7 -25.0 0.1 2.3 0.4
2.7-3.2 (Micas) 0.135 0.010 0.01 0.00 0.04 0.00 0.3 0.1 0.05 0.0 7.3 1.5 -25.1 0.0 1.4 0.0 0.952 0.004
3.2+ (Hornblende) 0.055 0.006 0.00 0.00 0.01 0.00 0.2 0.0 0.02 0.0 9.9 0.6 -25.3 5.3
Bulk recovered 0.997 0.019 0.87 0.07 0.98 0.02 3.5 0.0 0.17 0.00 19.9 0.6 -22.4 1.9 1.3 0.1 1.113 0.171
Shaver
Bulk measured 1.4 0.0 0.06 0.00 22.4 1.3 -24.8 0.0 4.1 0.1 1.060 0.004
Roots 27.8 5.5 0.58 0.05 47.3 10.2 -26.1 0.1 2.4 0.3
0-1 (free OM) 0.002 0.000 0.11 0.02 0.06 0.01 72.5 6.6 1.70 0.18 43.4 6.1 -24.9 0.1 4.3 0.2
1-2 (free OM) 0.021 0.001 0.32 0.04 0.22 0.03 22.4 2.8 0.68 0.07 32.8 5.3 -24.1 0.5 2.2 0.2
2-2.2 (Kaolin) 0.017 0.000 0.12 0.00 0.15 0.01 9.9 0.1 0.56 0.02 17.8 0.5 -24.5 0.1 4.8 0.1 1.039 0.004
2.2-2.5 (Kaolin) 0.136 0.010 0.14 0.01 0.27 0.03 1.4 0.1 0.12 0.01 11.7 1.1 -23.7 0.0 5.1 0.0 1.049 0.005
2.5-2.6 (Feldspars) 0.169 0.002 0.04 0.00 0.08 0.01 0.4 0.0 0.03 0.00 12.0 0.5 -24.0 0.3 4.8 0.1 1.045 0.004
2.6-2.7 (Quartz) 0.414 0.004 0.03 0.00 0.05 0.00 0.1 0.0 0.01 0.00 12.5 0.6 -24.3 0.0 3.9 0.0
2.7-3.2 (Micas) 0.173 0.002 0.02 0.00 0.07 0.00 0.2 0.0 0.03 0.00 6.8 0.3 -23.8 0.2 4.5 0.0 1.044 0.005
3.2+ (Hornblende) 0.079 0.002 0.01 0.00 0.01 0.00 0.1 0.0 0.01 0.00 12.3 0.8 -25.2 0.0 5.3 0.0
Bulk recovered 1.010 0.011 0.80 0.05 0.91 0.04 1.1 0.1 0.06 0.00 17.7 1.7 -19.3 2.2 3.8 0.2 1.067 0.097
15N / ‰13
C / ‰Nt14
CMt C / % C:NCt N/ %14
C
1.137
1.047 0.005
1.014 0.004
1.084 0.004
0.004
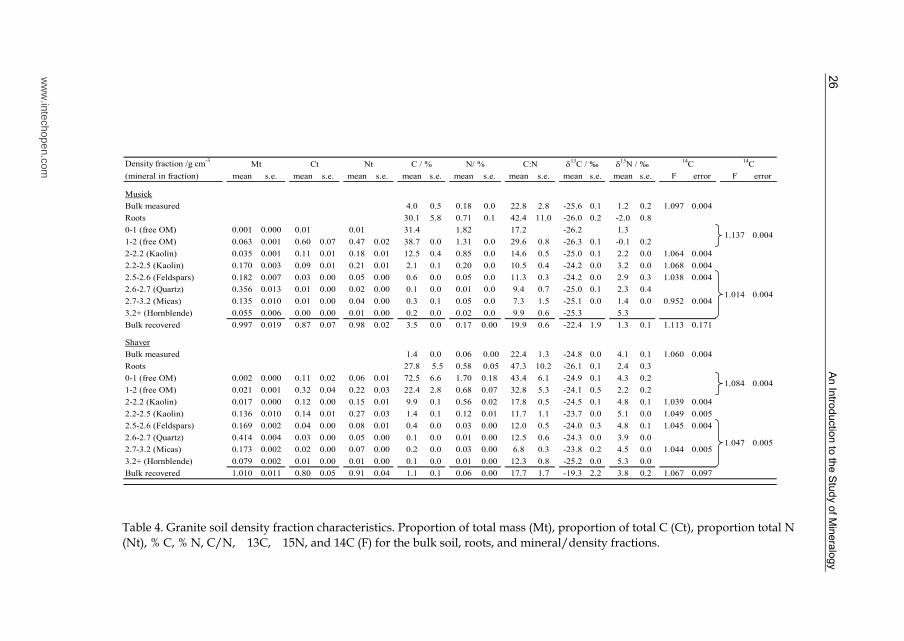
Table 4. Granite soil density fraction characteristics. Proportion of total mass (Mt), proportion of total C (Ct), proportion total N
(Nt), % C, % N, C/N, �13C, �15N, and 14C (F) for the bulk soil, roots, and mineral/density fractions.
ww
w.intechopen.com
Min
era
l an
d O
rga
nic
Ma
tter C
ha
racte
riza
tion
of S
oil D
en
sity
Fra
ctio
ns
27
Density fraction /g cm-3
(mineral in fraction) mean s.e. mean s.e. mean s.e. mean s.e. mean s.e. mean s.e. mean s.e. mean s.e. F error
A2 horizon
Bulk 2.0 0.0 0.11 0.00 18.2 0.4 -25.0 0.1 6.1 0.7 0.957 0.004
Roots 38.0 1.6 1.08 0.03 35.1 9.5 27.0 0.0 -0.5 0.1
0-1 (free OM) 0.000 0.00 0.01 0.00 0.00 0.00 43.9 1.5 1.15 0.07 38.4 2.7 -27.8 0.1 5.6 0.1
1-1.4 (free OM) 0.003 0.00 0.07 0.04 0.02 0.01 48.8 0.7 0.64 0.03 76.9 3.3 -27.7 0.1 2.7 0.1
1.4-1.6 (free OM) 0.008 0.00 0.15 0.00 0.06 0.00 45.0 0.0 0.93 0.06 48.6 3.0 -26.0 0.0 3.1 0.0 0.953 0.004
1.6-1.8 (free OM) 0.006 0.00 0.10 0.02 0.05 0.01 35.2 0.4 0.89 0.00 39.5 0.5 -25.7 0.1 3.4 0.1
1.8-2.0 (free OM) 0.007 0.00 0.08 0.01 0.05 0.00 23.6 1.1 0.86 0.02 27.6 1.4 -25.8 0.0 4.5 0.0
2.0-2.2 (Halloysite) 0.006 0.00 0.03 0.00 0.02 0.00 9.5 0.7 0.45 0.01 21.0 1.7 -25.4 0.1 5.7 0.1
2.2-2.4 (Halloysite) 0.064 0.01 0.07 0.00 0.10 0.03 2.2 0.6 0.18 0.01 12.9 3.3 -24.6 0.2 7.1 0.2
2.4-2.6 (Halloysite) 0.601 0.02 0.28 0.01 0.46 0.00 0.9 0.0 0.08 0.00 11.0 0.4 -23.7 0.1 8.2 0.1 0.974 0.004
2.6-2.7 (H+Quartz) 0.117 0.01 0.02 0.00 0.04 0.00 0.4 0.0 0.04 0.00 10.6 0.4 -23.8 0.1 7.7 0.1
2.7-2.9 (H+Anorthite) 0.082 0.00 0.02 0.00 0.03 0.00 0.5 0.0 0.04 0.00 12.8 1.1 -23.9 0.0 7.6 0.0
2.9-3.2 0.031 0.00 0.01 0.00 0.02 0.00 0.7 0.0 0.06 0.00 12.2 0.4 -23.9 0.1 7.7 0.1
3.2+ (Iron oxides) 0.097 0.00 0.03 0.00 0.03 0.00 0.6 0.0 0.03 0.00 20.4 0.7 -23.9 7.3 0.940 0.004
Bulk recovered 1.023 0.01 0.87 0.05 0.87 0.03 1.8 0.1 0.10 0.00 15.9 1.0 -21.7 1.2 6.1 0.2 0.965
Bt1 Horizon
Bulk 0.4 0.0 0.03 0.00 14.0 0.4 -23.4 0.1 9.2 0.0 0.879 0.003
0-1 (free OM) 0.000 0.000 -0.02 0.02 0.00 0.00 49.9 1.1 0.76 0.16 68.8 14.7
1-1.4 (free OM) 0.001 0.000 0.05 0.05 0.00 0.00 51.3 -28.4
1.4-1.6 (free OM) 0.001 0.000 0.06 0.02 0.00 0.00 41.6 1.5 0.45 95.8 -25.7 2.4 0.754 0.003
1.6-1.8 (free OM) 0.000 0.000 -0.03 0.01 -0.01 0.00 36.2 0.6 0.40 0.04 90.8 10.0
1.8-2.0 (free OM) 0.001 0.000 0.05 0.00 0.01 0.00 34.0 0.64 53.3
2.0-2.2 (Halloysite) 0.000 0.000 0.00 0.00 0.00 0.00 11.8 0.40 29.7
2.2-2.4 (Halloysite) 0.010 0.001 0.02 0.00 0.02 0.00 0.8 0.2 0.06 0.01 12.5 3.4 -25.7 6.6
2.4-2.6 (Halloysite) 0.679 0.079 0.52 0.02 0.69 0.10 0.3 0.0 0.03 0.00 9.4 0.4 -22.9 0.0 10.3 0.0 0.802 0.003
2.6-2.7 (H+Quartz) 0.053 0.004 0.04 0.00 0.05 0.00 0.3 0.0 0.03 0.00 11.0 0.4 -24.0 0.0 9.4 0.2
2.7-2.9 (H+Anorthite) 0.035 0.001 0.03 0.01 0.03 0.00 0.3 0.1 0.02 0.00 13.4 3.0 -24.6 0.1 6.2 0.7
2.9-3.2 (H+Anorthite) 0.018 0.001 0.02 0.00 0.01 0.01 0.5 0.03 17.8
3.2+ (Iron oxides) 0.112 0.001 0.12 0.00 0.05 0.00 0.4 0.0 0.01 0.00 36.7 1.1 -23.3 0.1 8.6 0.4 0.796 0.003
Bulk recovered 0.985 0.004 0.85 0.00 0.85 0.00 0.4 0.0 0.03 0.00 9.4 1.0 -19.9 1.4 8.3 1.0 0.797
N/ %Nt14
CMt C / % C:NCt 13C / ‰ 15
N / ‰
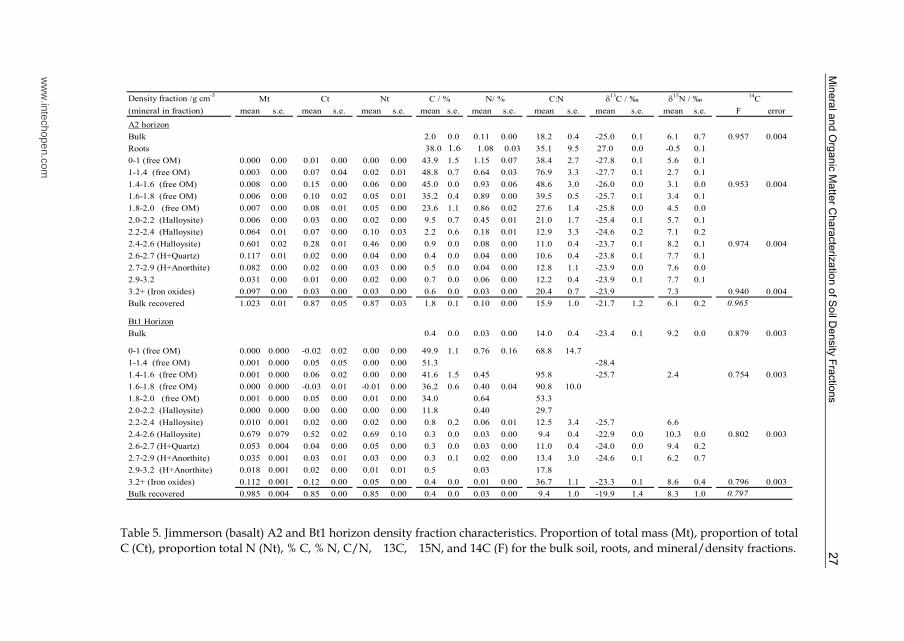
Table 5. Jimmerson (basalt) A2 and Bt1 horizon density fraction characteristics. Proportion of total mass (Mt), proportion of total
C (Ct), proportion total N (Nt), % C, % N, C/N, �13C, �15N, and 14C (F) for the bulk soil, roots, and mineral/density fractions.
ww
w.intechopen.com
An Introduction to the Study of Mineralogy
28
a. C / %
0.01
0.1
1
10
100
0 0.5 1 1.5 2 2.5 3 3.5
Musick 0-7cm, bulk soil C(%) = 4.0
Shaver 5-10cm, bulk soil C(%) = 1.4
Jimmerson 3-25 cm, bulk soil C(%) =2.0
b. C/N
0
10
20
30
40
50
60
70
80
90
0 0.5 1 1.5 2 2.5 3 3.5
Musick 0-7 cm
Shaver 5-10 cm
Jimmerson 3-25 cm
f. 13C (‰)
-1
0
1
2
3
4
0 0.5 1 1.5 2 2.5 3 3.5
Density fraction midpoint (g cm-3
)
c. g. 15N (‰)
-1
0
1
2
3
4
5
6
7
8
9
0 0.5 1 1.5 2 2.5 3 3.5
Density fraction midpoint (g cm-3
)
d.
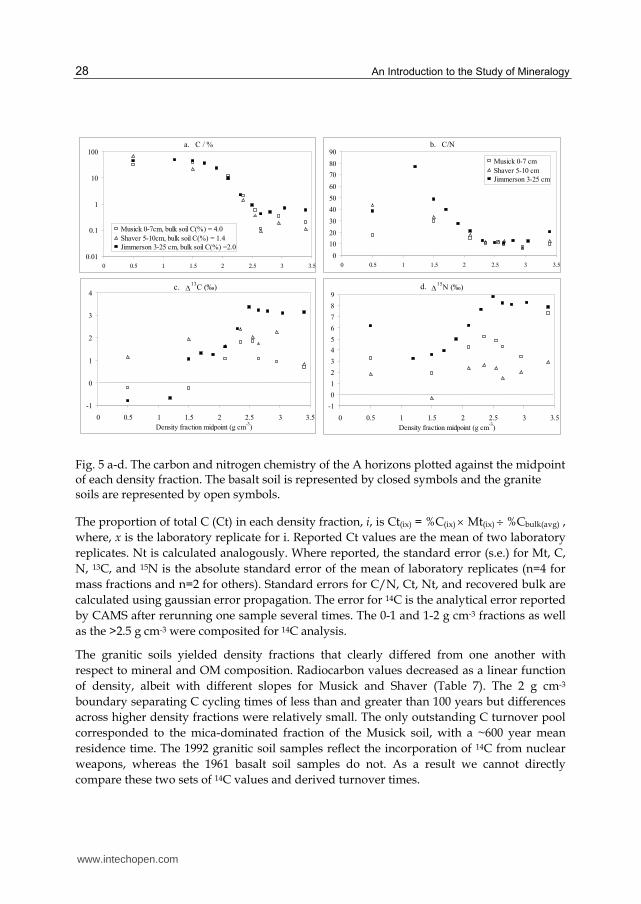
Fig. 5 a-d. The carbon and nitrogen chemistry of the A horizons plotted against the midpoint of each density fraction. The basalt soil is represented by closed symbols and the granite soils are represented by open symbols.
The proportion of total C (Ct) in each density fraction, i, is Ct(ix) = %C(ix) Mt(ix) %Cbulk(avg) ,
where, x is the laboratory replicate for i. Reported Ct values are the mean of two laboratory
replicates. Nt is calculated analogously. Where reported, the standard error (s.e.) for Mt, C,
N, 13C, and 15N is the absolute standard error of the mean of laboratory replicates (n=4 for
mass fractions and n=2 for others). Standard errors for C/N, Ct, Nt, and recovered bulk are
calculated using gaussian error propagation. The error for 14C is the analytical error reported
by CAMS after rerunning one sample several times. The 0-1 and 1-2 g cm-3 fractions as well
as the >2.5 g cm-3 were composited for 14C analysis.
The granitic soils yielded density fractions that clearly differed from one another with
respect to mineral and OM composition. Radiocarbon values decreased as a linear function
of density, albeit with different slopes for Musick and Shaver (Table 7). The 2 g cm-3
boundary separating C cycling times of less than and greater than 100 years but differences
across higher density fractions were relatively small. The only outstanding C turnover pool
corresponded to the mica-dominated fraction of the Musick soil, with a ~600 year mean
residence time. The 1992 granitic soil samples reflect the incorporation of 14C from nuclear
weapons, whereas the 1961 basalt soil samples do not. As a result we cannot directly
compare these two sets of 14C values and derived turnover times.
www.intechopen.com
Mineral and Organic Matter Characterization of Soil Density Fractions
29
Soil series Horizon Density / gcm-3
C / % N / % C:N 13C / ‰ 15N / ‰ Jimmerson A2 0-1 b a b a bc 1-1.4 a c a a a 1.4-1.6 b b b b a 1.6-1.8 c b b bc a 1.8-2 d b c bc abc 2-2.2 e d cd c bc 2.2-2.4 f e d d cd 2.4-2.6 f e d e d 2.6-2.7 f e d e cd 2.7-2.9 f e d e cd 2.9-3.2 f e d e cd 3.2+ f e cd e cd
ANOVA P values: <0.0001 <0.0001 <0.0001 <0.0001 <0.0001 Jimmerson Bt1 0-1 a a a - - 1-1.4 a - - a - 1.4-1.6 b ab a b a 1.6-1.8 c ab ab - - 1.8-2 c ab ac - - 2-2.2 d ab ab - - 2.2-2.4 e b b b b 2.4-2.6 e b b e c 2.6-2.7 e b bc d c 2.7-2.9 e b bc c b 2.9-3.2 e b bc - - 3.2+ e b bc e c
ANOVA P values: <0.0001 0.0002 0.0002 <0.0001 <0.0001 Musick A1 0-1 b a b a ab 1-2 a b a a a 2-2.2 c c b b bc 2.2-2.5 d d c c c 2.5-2.6 e e c c c 2.6-2.7 e e cd b bc 2.7-3.2 e e d b b 3.2+ e e cd b d
ANOVA P values: <0.0001 <0.0001 <0.0001 <0.0001 0.0001 Shaver A2 0-1 a a a ab bc 1-2 b b a ab a 2-2.2 c b b ab cde 2.2-2.5 c c b a de 2.5-2.6 c c b ab cde 2.6-2.7 c c b ab b 2.7-3.2 c c b a bcd 3.2+ c c b b e
ANOVA P values: <0.0001 <0.0001 <0.0001 0.0153 <0.0001
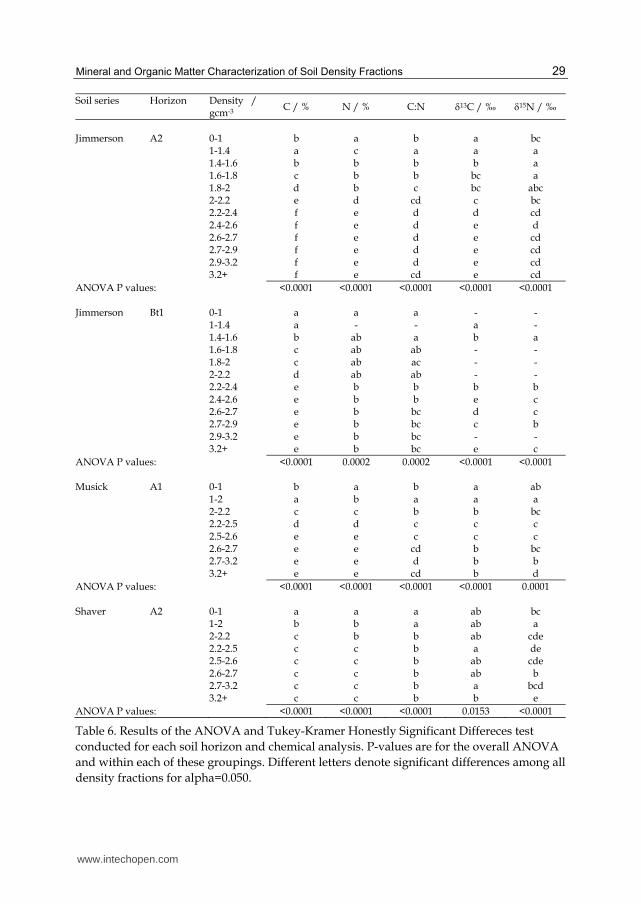
Table 6. Results of the ANOVA and Tukey-Kramer Honestly Significant Differeces test
conducted for each soil horizon and chemical analysis. P-values are for the overall ANOVA
and within each of these groupings. Different letters denote significant differences among all
density fractions for alpha=0.050.
www.intechopen.com
An Introduction to the Study of Mineralogy
30
In both the A2 and Bt1 horizons of the basaltic soil, high levels of clay, iron oxides, and
resulting aggregation hindered the segregation of its constituent minerals. Morphology and
mineralogy changed very gradually with density, such that the seven mineral density
fractions yielded only two discrete organo-mineral fractions dominated by halloysite versus
iron oxides. In our attempts to disperse the soil minerals, we used relatively high levels of
ultrasonic energy on all samples, and this contributed to substantial losses of dissolved C
(which, by difference, is 13C-depleted) into the polytungstate density solution (Tables 4, 5).
Most of the recovered C and N corresponds to the mineral-free (<2 g cm-3) and kaolin-
bearing (2-2.6 g cm-3) fractions.
Density fraction Radiocarbon values / FM / g cm-3 / years
Musick Shaver 0-2 1.137 1.084
2-2.2 1.064 1.039 2.2-2.5 1.068 1.049 2.5-2.6 1.038 1.045 2.7-3.2 0.952 1.044
Table 7. Radiocarbon values of the granitic soil density fractions. For Musick, 14C (FM) = 1.235 - 0.084 density midpoint (g cm-3), with R2=0.85, p=0.026, n=5 and for Shaver, 14C (FM) = 1.099 - 0.021 density midpoint (g cm-3), with R2=0.75, p=0.059, n=5.
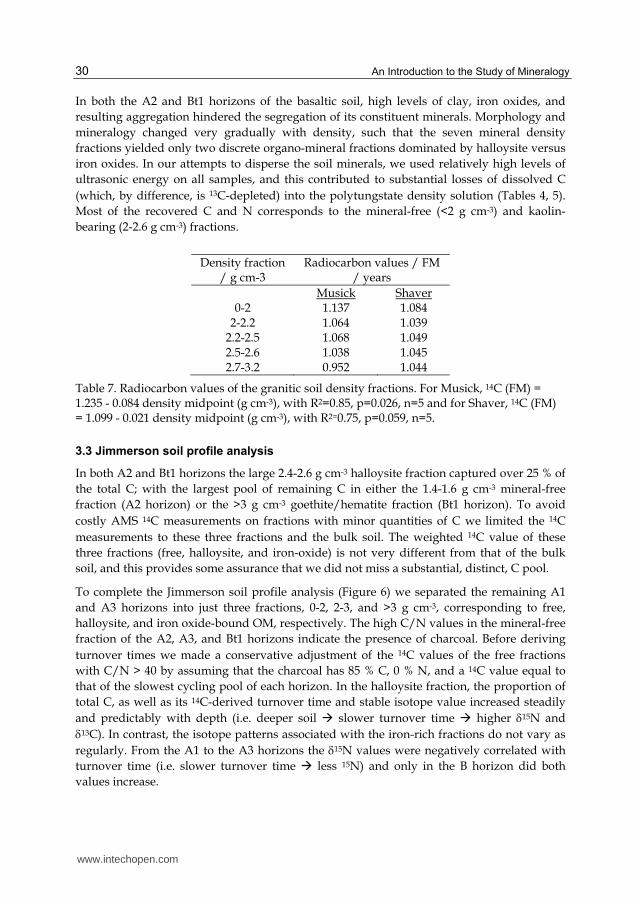
3.3 Jimmerson soil profile analysis
In both A2 and Bt1 horizons the large 2.4-2.6 g cm-3 halloysite fraction captured over 25 % of
the total C; with the largest pool of remaining C in either the 1.4-1.6 g cm-3 mineral-free
fraction (A2 horizon) or the >3 g cm-3 goethite/hematite fraction (Bt1 horizon). To avoid
costly AMS 14C measurements on fractions with minor quantities of C we limited the 14C
measurements to these three fractions and the bulk soil. The weighted 14C value of these
three fractions (free, halloysite, and iron-oxide) is not very different from that of the bulk
soil, and this provides some assurance that we did not miss a substantial, distinct, C pool.
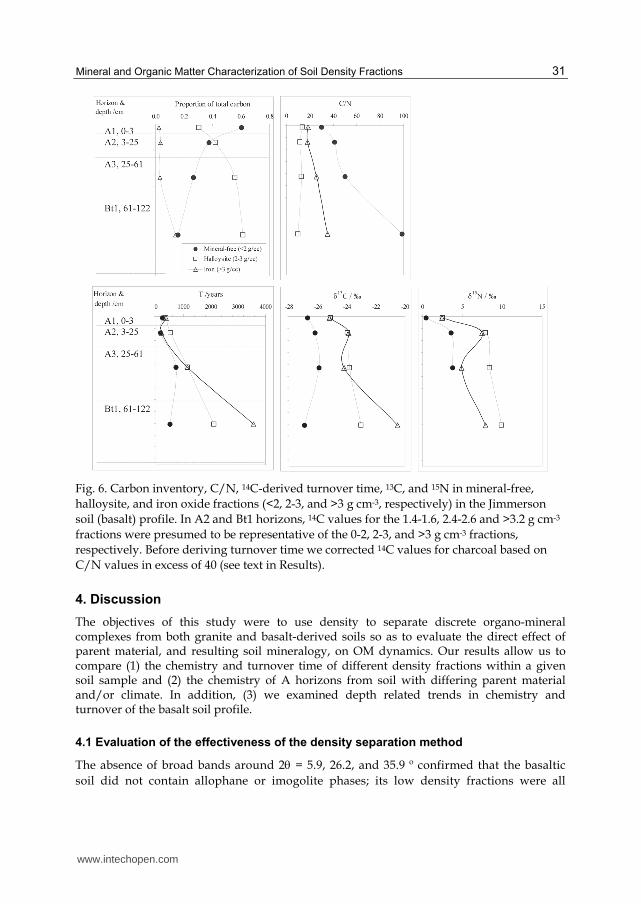
To complete the Jimmerson soil profile analysis (Figure 6) we separated the remaining A1
and A3 horizons into just three fractions, 0-2, 2-3, and >3 g cm-3, corresponding to free,
halloysite, and iron oxide-bound OM, respectively. The high C/N values in the mineral-free
fraction of the A2, A3, and Bt1 horizons indicate the presence of charcoal. Before deriving
turnover times we made a conservative adjustment of the 14C values of the free fractions
with C/N > 40 by assuming that the charcoal has 85 % C, 0 % N, and a 14C value equal to
that of the slowest cycling pool of each horizon. In the halloysite fraction, the proportion of
total C, as well as its 14C-derived turnover time and stable isotope value increased steadily
and predictably with depth (i.e. deeper soil slower turnover time higher 15N and
13C). In contrast, the isotope patterns associated with the iron-rich fractions do not vary as
regularly. From the A1 to the A3 horizons the 15N values were negatively correlated with
turnover time (i.e. slower turnover time less 15N) and only in the B horizon did both
values increase.
www.intechopen.com
Mineral and Organic Matter Characterization of Soil Density Fractions
31
Fig. 6. Carbon inventory, C/N, 14C-derived turnover time, 13C, and 15N in mineral-free,
halloysite, and iron oxide fractions (<2, 2-3, and >3 g cm-3, respectively) in the Jimmerson
soil (basalt) profile. In A2 and Bt1 horizons, 14C values for the 1.4-1.6, 2.4-2.6 and >3.2 g cm-3
fractions were presumed to be representative of the 0-2, 2-3, and >3 g cm-3 fractions,
respectively. Before deriving turnover time we corrected 14C values for charcoal based on
C/N values in excess of 40 (see text in Results).
4. Discussion
The objectives of this study were to use density to separate discrete organo-mineral complexes from both granite and basalt-derived soils so as to evaluate the direct effect of parent material, and resulting soil mineralogy, on OM dynamics. Our results allow us to compare (1) the chemistry and turnover time of different density fractions within a given soil sample and (2) the chemistry of A horizons from soil with differing parent material and/or climate. In addition, (3) we examined depth related trends in chemistry and turnover of the basalt soil profile.
4.1 Evaluation of the effectiveness of the density separation method
The absence of broad bands around 2 = 5.9, 26.2, and 35.9 º confirmed that the basaltic
soil did not contain allophane or imogolite phases; its low density fractions were all
www.intechopen.com
An Introduction to the Study of Mineralogy
32
mineral-free. The frequently high 15N and low C/N values of the 0-1 g cm-3 are probably
associated with the increased presence of ectomycorrhizal fungal products (Hogberg,
1997), such as spores and hyphae corresponding to the black spheres and spongy material
visible in figures 2 and 3a. The entire 1-2.4 g cm-3 interval of both soil types represented a
continuum of alteration from fresh litter, with high % C, N, and C/N, and low 13C and 15N, to highly humified kaolin-associated OM at the other end of the spectrum (Ehleringer
et al., 2000; Nadelhoffer and Fry, 1988). This result, which was true for both the basalt and
the granite samples, is consistent with both Golchin et al. (1995) and Baisden et al. (2002),
and suggests that the quantity of OM associated with the mineral surface is inversely
related to its degree of decomposition. The corresponding 14C analyses indicate, however,
that neither of these two parameters is useful for predicting the mean residence time of
the organic C.
Previous radiocarbon work on the granite soils has shown that acid/base hydrolysis of the
>2 g cm-3 mineral fraction can leave a substantial 14C-depleted residue (Trumbore and
Zheng 1996). The only density separates obtained in this study that are large enough to
account for this pool of distinctly older C are the secondary clay-dominated fractions. If
some of the C in these fractions is much older, the average residence times we report
actually represent a heterogenous mixture of faster and more slowly cycling C components.
This condition violates the assumption of homogeneity inherent in our C cycling model
(Equation 7), and the turnover times of the kaolin-rich, and possibly other, fractions should
therefore be cautiously interpreted as average 14C ages of mixed C pools. We conclude that
acid/base hydrolysis may be the best way to separate very long-lived C from these clay
fractions. But we also note that the sodium pyrophosphate used in the base hydrolysis
dissolves metastable iron chelates that can bind long-lived C (McKeague et al., 1971;
Trumbore and Zheng, 1996). Thus, in iron-rich samples such as the Jimmerson B horizon,
the very heavy fraction (> 3 g cm-3) may be appropriate for separating this potentially
important pool.
4.2 Organic matter dynamics as a function of parent material and climate
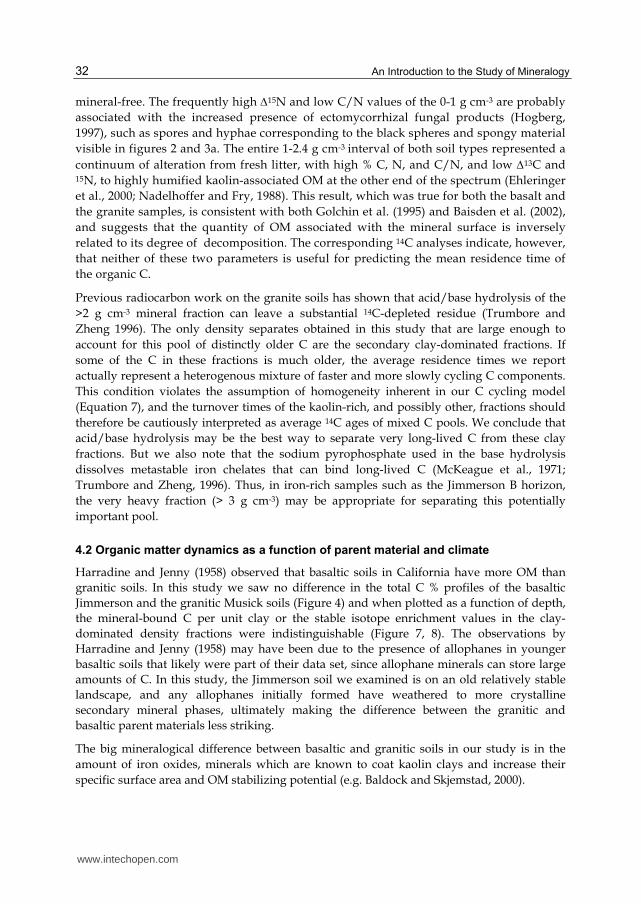
Harradine and Jenny (1958) observed that basaltic soils in California have more OM than
granitic soils. In this study we saw no difference in the total C % profiles of the basaltic
Jimmerson and the granitic Musick soils (Figure 4) and when plotted as a function of depth,
the mineral-bound C per unit clay or the stable isotope enrichment values in the clay-
dominated density fractions were indistinguishable (Figure 7, 8). The observations by
Harradine and Jenny (1958) may have been due to the presence of allophanes in younger
basaltic soils that likely were part of their data set, since allophane minerals can store large
amounts of C. In this study, the Jimmerson soil we examined is on an old relatively stable
landscape, and any allophanes initially formed have weathered to more crystalline
secondary mineral phases, ultimately making the difference between the granitic and
basaltic parent materials less striking.
The big mineralogical difference between basaltic and granitic soils in our study is in the
amount of iron oxides, minerals which are known to coat kaolin clays and increase their
specific surface area and OM stabilizing potential (e.g. Baldock and Skjemstad, 2000).
www.intechopen.com
Mineral and Organic Matter Characterization of Soil Density Fractions
33
1
10
100
0 20 40 60 80 100
Mineral-bound C per unit clay /g kg-1
Dep
th /
cm
Jimmerson
Musick
Shaver
Fig. 7. Mineral-bound C normalized for clay by sampling depth. The basalt soil is
represented by closed symbols and the granite soils are represented by open symbols.
Standard error values are based solely on the error associated with the mineral-associated C
(n=2), the error associated with % clay is unknown (n=1).
1
10
100
0 2 4 6
a. 13C / ‰
Dep
th /
cm
Jimmerson
Musick
Shaver
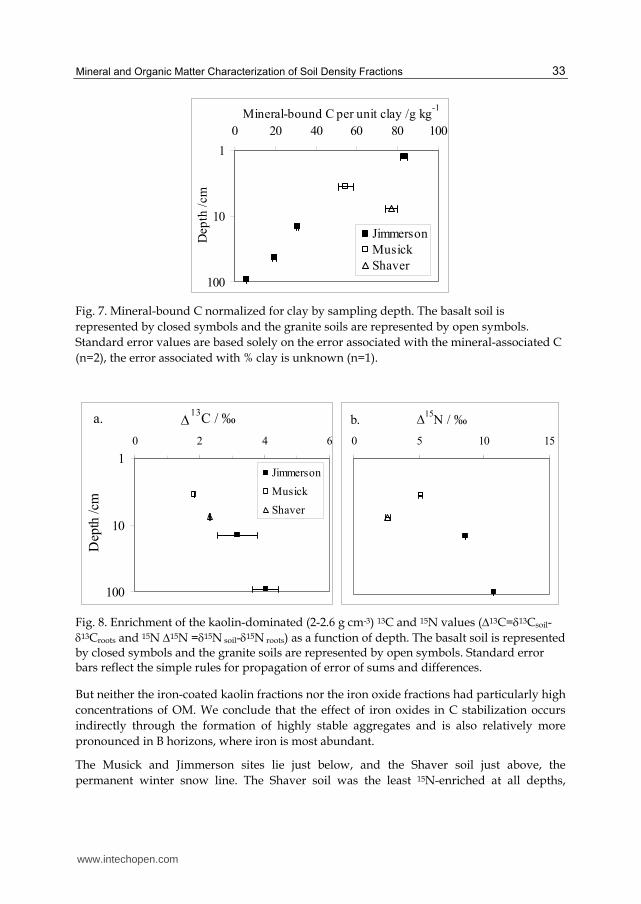
0 5 10 15
b. 15N / ‰
Fig. 8. Enrichment of the kaolin-dominated (2-2.6 g cm-3) 13C and 15N values (13C=13Csoil-13Croots and 15N 15N =15N soil-15N roots) as a function of depth. The basalt soil is represented by closed symbols and the granite soils are represented by open symbols. Standard error bars reflect the simple rules for propagation of error of sums and differences.
But neither the iron-coated kaolin fractions nor the iron oxide fractions had particularly high
concentrations of OM. We conclude that the effect of iron oxides in C stabilization occurs
indirectly through the formation of highly stable aggregates and is also relatively more
pronounced in B horizons, where iron is most abundant.
The Musick and Jimmerson sites lie just below, and the Shaver soil just above, the
permanent winter snow line. The Shaver soil was the least 15N-enriched at all depths,
www.intechopen.com
An Introduction to the Study of Mineralogy
34
possibly due to more effective retention of mineral forms of N or a preferential loss of
organic N (Amundson et al., 2003) during snowmelt at that site. Intense leaching at
snowmelt retards the accumulation of kaolinite and promotes the formation of vermiculite
(Dahlgren et al., 1997), with about fifty times more specific surface area. This mineral
difference led to higher levels of mineral-bound C per unit clay in the Shaver than in the
Musick soil (Figure 8). This effect is not an artefact of sampling depth, which would have
had the opposite effect, but may be enhanced by the direct effect of temperature on
biodegradation.
Mineralogy and/or climate may also influence C turnover, which was slightly slower in the
Shaver than the Musick clay fractions (142-167 versus 110-115 years, Table 7). Wattel-
Koekkoek and Buurman (2004) report similarly modest differences in the cycling rates of
OM on high activity smectite versus low activity kaolinite species, and we suspect that
much larger differences in clay activity, such as between noncrystalline and crystalline
species, are required to highlight the direct effect of mineralogy on C cycling rates (Torn et
al. 1997).
4.3 The Jimmerson soil mineralogy and profile development
The mineral analysis of the Jimmerson soil revealed an absence of allophanes and the
presence of quartz. The occurrence of quartz and cristobalite on this broad flat lava flow
suggest that either (1) quartz grains arrived by aeolian transport from a nearby sandstone
formation; or (2) the parent material, which is mapped as a broad Pleistocene vesicular
olivine basalt lava flow (MacDonald and Lydon, 1972), may in fact be a basalt-andesite
intergrade.
It has been observed (Allen and Hajek, 1989) that halloysite-dominated soils are rare,
however the XRD data for the Jimmerson soil clearly indicate that halloysite is the main
secondary mineral in both the A and B horizons. Volcanic glass and allophanes are
precursors to halloysite, which can also precipitate from the desilication of smectites (2:1
layer silicates) and may subsequently recrystallize to produce kaolinite (Allen and Hajek,
1989; Hendricks and Whittig, 1968; Southard and Southard, 1989). The absence of allophanes
is related to the relative age of the soil. This soil, which is not glaciated and has been
undergoing weathering for thousands of years, is presumably at an advanced stage of
development that lies between the allophanic (or smectitic) and kaolinitic endmembers. As
noted above, this mineralogical stage has muted parent material effects on soil C storage
that might be expected in less developed soils.
The depth profile of the >3 g cm-3 iron oxide fraction in the Jimmerson soil exhibited an intriguing pattern for which we present two interpretations: (1) The suite of organic compounds associated with the goethite and hematite may change with depth – a hypothesis that could be tested using 13C NMR spectroscopy (e.g. Golchin et al.1994); and/or (2) young humus with relatively high stable isotope values may be preferentially ‘cheluviated’ from the A1 to the A2 of horizon. Because the crystalline iron oxides we identified in the XRD patterns are almost certainly immobile, a corollary to this hypothesis is that the > 3 g cm-3 fractions also captured non-crystalline iron phases, an assumption that could be tested by directly examining the 14C and 15N contents of OM in various
www.intechopen.com
Mineral and Organic Matter Characterization of Soil Density Fractions
35
mineralogical phases separated by sodium pyrophosphate and ammonium oxalate extractions (e.g. Masiello et al., 2004).
5. Conclusions
In this study we examined three northern California forest soils: the Jimmerson (warm, basaltic), the Musick (warm, granitic), and the Shaver (cool, granitic). As expected, we found levels of clay, iron, and aggregation to be highest in the warmer basaltic soil and lowest in the cooler granitic soil. But although clay content was correlated with degree of humification as indicated by C/N ratios, there was no difference in % C depth profiles and total C storage across these three soils. In the A horizons, where most OM resides, the iron oxide fraction of the basaltic soil was associated with a very minor proportion of the OM. Overall, it was climate differences between the two granitic soils, rather than differences in the mineral composition of the parent materials, that resulted in the most obvious mineral effect on C. In the cooler granitic soil, more intense leaching has promoted the formation of more reactive clay and hence more mineral-bound C per unit clay.
The impetus of this study was to evaluate the mineral density separation method in the context of understanding the role of parent material and mineralogy in organic matter storage and turnover. Density is clearly appropriate for separating minerals with different specific gravities – such as allophanes, crystalline silicate clays, and iron oxides – and it is more effective when aggregation is weak – such as in ashy or sandy soils. In part because they span a relatively wide range of densities, primary minerals are easy to separate. They are also easy to subsequently identify. They do not, however, harbour much OM, so their utility in OM studies may be limited to special cases, such as ammonium fixation by altered mica.
Conversely, distinct silicate clay species, which are associated with high OM content, have a
relatively high degree of overlap in their specific densities, especially in light of their OM as
well as iron oxide coatings. For example, this study corroborates the notion that the density
of organo-clay complexes clearly reflects the OM:clay ratio (as well the degree of alteration
of the clay-associated OM). But, although the slowest cycling C is indeed associated with
clays, as most studies indicate, so is fast cycling C, and separating these two pools requires
additional chemical treatment. In conclusion, it will often be necessary to follow preliminary
density separations with complementary techniques.
If certain groups of mineral species occur and function together, as is the case with kaolins
and their likely ferric coating, there may be little value in attempting to separate them. In
fact, our density separation may have lifted some colloidal ferric coatings from the kaolin
surfaces and combined them with crystalline iron oxides, thereby obscuring our ability to
distinguish the effect of these ecologically distinct species on soil OM patterns. We note,
however, that the density separation technique can be used to exploit differences in particle
size as well as density. Iron species can range from sand sized macro crystals to colloidal
coatings and can be separated on the basis of their size – another determinant of settling
velocity.
Finally, although sonication is required in order to disaggregate the constituent minerals of
most soils, when the aggregation is strong it may be impractical to deliver enough energy to
accomplish this. For example, the sonication of the basalt soil was insufficient to fully lift the
www.intechopen.com
An Introduction to the Study of Mineralogy
36
iron coatings off the kaolin, but excessive insofar as it resulted in a significant amount of OM
becoming dissolved in the sodium polytungstate solution. This kind of trade-off needs to be
evaluated on a case by case basis.
This study highlights advantages and difficulties associated with the density fractionation approach. The success of the density separation is highly dependent on the individual soil characteristics – such as aggregation and the degree of overlap in the densities of the constituent clay minerals – and on the purpose of the separation, that is how the OM attributes of interest are related to the mineral density differences. We conclude that the principle of separating intact soil into discrete organo-mineral complexes on the basis of gravity is reproducible and effective, but the organic matter pools associate with these fractions are still heterogeneous with respect to composition and turnover time.
6. Acknowledgements
This research was undertaken as part of Cristina Castanha’s doctoral dissertation and primarily funded by a Kearney Foundation of Soil Science grant to Susan Trumbore. Ronald Amundson’s participation was funded by the California Agricultural Experiment Station. The 14C measurements were funded by a grant to Amundson from the Center for Accelerator Mass Spectrometry at the Lawrence Livermore National Laboratory. We thank Isabelle Basile for suggestions on soil mineral and density separation, Rudy Wenk and Timothy Teague at the Department of Earth and Planetary Science at UC Berkeley for facilitating the X-ray diffraction analyses, Alex Blum at the USGS in Menlo Park, California for help in designing a low background holder for small XRD samples, Andy Thompson in the Silver Lab at UC Berkeley for help with the CN analyzer, Paul Brooks and Stefania Mambelli at the Center for Stable Isotope Biogeochemistry at UC Berkeley for their kind and indefatigable assistance with the Mass Spectrometer, Michaele Kashgarian and Paula Zermeno at the Center for Accelerator Mass Spectrometry at LLNL for assistance with 14C AMS measurements.
7. References
Allardice, W.R., Munn, S.S., Begg, E.L. & Mallory, J.I. 1983. Laboratory Data and Description for Some Typical Pedons of California Soils. Volume I: Central and Southern Sierra. Department of Land, Air, and Water Resources, University of California Davis.
Allen, B.L. & Hajek, B.F. 1989. Mineral Occurence in Soil Environments. In: Minerals in Soil Environments (eds J.B. Dixon & S.B. Weed), pp. 199-264 . Soil Science Society of America, Madison, Wisconsin.
Amundson, R., Austin, A. T., Schuur, E.A.G., Yoo, K., Matzek, V., Kendall, C., Uebersax, A., Brenner, D. & Baisden, W.T. 2003. Global patterns of the isotopic composition of soil and plant nitrogen. Global Biogeochemical Cycles, 17:1031-1041.
Baisden, W.T., Amundson, R.G., Cook, A.C. and Brenner, D.L., 2002. Turnover and storage of C and N in five density fractions from California annual grassland surface soils. Global Biogeochemical Cycles, 16: 1117-1132.
Baldock, J.A. & Skjemstad, J.O., 2000. Role of the soil matrix and minerals in protecting natural organic materials against biological attack. Organic Geochemistry, 31: 697-710.
www.intechopen.com
Mineral and Organic Matter Characterization of Soil Density Fractions
37
Barnhisel, R.I. & Bertsch, P.M. 1989. Chlorites and hydroxy-interlayered vermiculite and smectite. In: Minerals in Soil Environments (eds J.B. Dixon & S.B. Weed), pp.729-779. Soil Science Society of America, Madison, Wisconsin.
Begg, E.L., Allardice, W.R., Munn, S.S. & Mallory, J.I., 1985. Laboratory Data and Description for Some Typical Pedons of California Soils. Volume III: Southern Cascade and Northern Sierra. Department of Land, Air, and Water Resources, University of California Davis.
Boutton, T.W. 1991. Stable carbon isotope ratios of natural materials. In: Carbon Isotope Techniques. (eds D.C. Coleman & B. Fry), pp. 155-171. Academic Press.
Brindley, G.W. & Brown, G. (eds). 1984. Crystal Structures of Clay Minerals and Their X-ray Diffraction Identification. Mineralogical Society, London.
Christensen, B.T., 1992. Physical fractionation of soil and organic matter in primary particle size and density separates. Advances in Soil Science, 20: 1-90.
Dahlgren, R.A., Boettinger, J.L., Huntington, G.L. and Amundson, R.G. 1997. Soil development along an elevational transect in the western Sierra Nevada, California. Geoderma, 78: 207-236.
Ehleringer, J.R., Buchmann, N. & Flanagan, L.B. 2000. Carbon isotope ratios in belowground carbon cycle processes. Ecological Applications, 10: 412-422.
Feller, C. & Beare, M.H. 1997. Physical control of soil organic matter dynamics in the tropics. Geoderma, 79: 69-116.
Golchin, A., Oades, J.M., Skjemstad, J.O. & Clarke, P. 1994. Study of free and occluded particulate organic matter in soils by solid state 13C CP/MAS NMR spectroscopy and scanning electron microscopy. Australian Journal of Soil Research, 32: 285-309.
Golchin, A., Oades, J.M., Skjemstad, J.O. & Clarke, P., 1995. Structural and dynamic properties of soil organic matter as reflected by 13C natural abundance, pyrolysis mass spectrometry and solid-state-13 C NMR spectroscopy in density fractions of an oxisol under forest and pasture. Australian Journal of Soil Research, 33: 59-76.
Harradine, F. & Jenny, H. 1958. Influence of parent material and climate on texture and nitrogen and carbon contents of virgin California soils I. Texture and nitrogen contents of soils. Soil Science, 85: 235-243.
Harradine, F.F. 1954. Factors influencing the organic carbon and nitrogen content of California soils. Doctoral Dissertation, University of California Berkeley.
Hendricks, C.W. & Whittig, L.D. 1968. Andesite weathering. II. Geochemical change from andesite to saprolite. Journal of Soil Science, 19: 147-153.
Hogberg, P. 1997. Tansley review no. 95 15N natural abundance in soil-plant systems. New Phytologist, 137: 179-203.
Jaynes, W.F. & Bigham, J.M. 1986. Concentration of Iron Oxides from Soil Clays by Density Gradient Centrifugation. Soil Science Society of America Journal, 50: 1633-1639.
Kendall, C. and Caldwell, E.A., 1998. Fundamentals of Isotope Geochemistry. In: Isotope Tracers in Catchment Hydrology (eds C. Kendall & J.J. McDonnel), pp. 51-84. Elsevier Science, New York.
Krull, E.S., Baldock, J.A. & Skjemstad, J.O. 2003. Importance of mechanisms and processes of the stabilisation of soil organic matter for modelling carbon turnover. Functional Plant Biology, 30: 207-222.
Levin, I. & Hesshaimer, V. 2000. Radiocarbon-a unique tracer of the global carbon cycle dynamics. Radiocarbon, 42: 69-80.
www.intechopen.com
An Introduction to the Study of Mineralogy
38
MacDonald, G.A. & Lydon, P.A. 1972. Geologic map of the Whitmore quadrangle. U.S. Geological Survey.
Masiello, C.A., Chadwick, O.A., Southon, J., Torn, M.S. & Harden, J.W. 2004. Weathering controls on mechanisms of carbon storage in grassland soils. Global Biogechemical Cycles, 18. doi: 10.1029/2004GB002219.
McKeague, J.A., Brydon, J.A. & Miles, N.M. 1971. Differentiation of forms of extractable iron and aluminum in soils. Soil Science Society of America Proceedings. 35: 33-38.
Minagawa, M., Winter, D.A. & Kaplan, I.R. 1984. Comparison of Kjedahl and combustion methods for measurement of nitrogen isotope ratios in organic matter. Analytical Chemistry, 56: 1859-1861.
Monnier, G., Turc, L. & Jeanson-Luusinang, C. 1962. Une methode de fractionnement densimetrique par centrifugation des mateires organiques du sol. Annales Agronomiques, 13: 55-63.
Nadelhoffer, K.J. & Fry, B. 1988. Controls on natural nitrogen-15 and carbon-13 abundances in forest soil organic matter. Soil Science Society of America Journal, 52: 1633-1640.
Shang, C. & Tiessen, H. 1998. Organic matter stabilization in two semiarid tropical soils: Size, density, and magnetic separations. Soil Science Society of America Journal, 62: 1247-1257.
Southard, S.B. & Southard, R.J. 1989. Mineralogy and Classification of Andic Soils in Northeastern California. Soil Science Society of America Journal, 53: 1784-1791.
Spycher, G. & Young, J.L. 1979. Water dispersible soil organic mineral particles. II: Inorganic amorphous and crystalline phases in density fractions of clay size particles. Soil Science Society of America Journal, 43: 328-332.
Stuiver, M. & Polach, H.A. 1977. Reporting of 14C data. Radiocarbon, 19: 355-363. Torn, M.S., Trumbore, S.E., Chadwick, O.A., Vitousek, P.M. & Hendricks, D.M. 1997.
Mineral control of soil organic carbon storage and turnover. Nature, London, 389: 170-173.
Trumbore, S.E. 1993. Comparison of carbon dynamics in tropical and temperate soils using radiocarbon measurements. Global Biogeochemical Cycles, 7: 275-290.
Trumbore, S.E. & Zheng, S. 1996. Comparison of fractionation methods for soil organic matter 14C analysis. Radiocarbon, 38: 219-229.
Wattel-Koekkoek, E.J.W. & Buurman, P. 2004. Mean residence time of kaolinite and smectite-bound organic matter in Mozambiquan soils. Soil Science Society of America Journal, 68: 154-161.
www.intechopen.com
An Introduction to the Study of MineralogyEdited by Prof. Cumhur Aydinalp
ISBN 978-953-307-896-0Hard cover, 154 pagesPublisher InTechPublished online 01, February, 2012Published in print edition February, 2012
InTech EuropeUniversity Campus STeP Ri Slavka Krautzeka 83/A 51000 Rijeka, Croatia Phone: +385 (51) 770 447 Fax: +385 (51) 686 166www.intechopen.com
InTech ChinaUnit 405, Office Block, Hotel Equatorial Shanghai No.65, Yan An Road (West), Shanghai, 200040, China
Phone: +86-21-62489820 Fax: +86-21-62489821
An Introduction to the Study of Mineralogy is a collection of papers that can be easily understood by a widevariety of readers, whether they wish to use it in their work, or simply to extend their knowledge. It is unique inthat it presents a broad view of the mineralogy field. The book is intended for chemists, physicists, engineers,and the students of geology, geophysics, and soil science, but it will also be invaluable to the more advancedstudents of mineralogy who are looking for a concise revision guide.
How to referenceIn order to correctly reference this scholarly work, feel free to copy and paste the following:
C. Castanha, S.E. Trumbore and R. Amundson (2012). Mineral and Organic Matter Characterization ofDensity Fractions of Basalt- and Granite-Derived Soils in Montane California, An Introduction to the Study ofMineralogy, Prof. Cumhur Aydinalp (Ed.), ISBN: 978-953-307-896-0, InTech, Available from:http://www.intechopen.com/books/an-introduction-to-the-study-of-mineralogy/mineral-and-organic-matter-characterization-of-density-fractions-of-basalt-and-granite-derived-soils