Site Remediation Using Chemical Oxidation Techniques
22
1 Site Remediation Using Chemical Oxidation Techniques Robert L. Siegrist, Ph.D., P.E. Professor and Director Environmental Science and Engineering Colorado School of Mines, Golden, Colorado USA Tel.: 303.384.2158, Email: [email protected] NATO/CCMS Pilot Study “Prevention and Remediation in Selected Industrial Sectors: Small Sites in Urban Areas” Athens, Greece 4-7 June 2006
Transcript of Site Remediation Using Chemical Oxidation Techniques

1
Site Remediation Using Chemical Oxidation Techniques
Robert L. Siegrist, Ph.D., P.E.Professor and Director
Environmental Science and EngineeringColorado School of Mines, Golden, Colorado USA
Tel.: 303.384.2158, Email: [email protected]
NATO/CCMS Pilot Study“Prevention and Remediation in Selected Industrial Sectors:
Small Sites in Urban Areas”Athens, Greece4-7 June 2006

2
Presentation OutlineNATO CCMS Pilot Study - 7 June 2006
Need for and motivation to develop and use oxidation processes for site remediation
Evolution and status of chemical oxidation
Ongoing technology initiatives
NATO Advanced Research Workshop - 8 June 2006Aspects of CSM research will be covered in a companion talk during the NATO Advanced Research Workshop
Enhanced DNAPL destruction in ‘reaction clouds’
Combining oxidation with other remediesOxidation enhanced bioremediation (chem-bio)Co-injection or sequential injection of oxidants with surfactants and cosolvents
Model development and application

3
BackgroundThe problem…widespread contamination of soil and groundwater by organic chemicals
Vadose zone
Well
Groundwater aquifer
Water Water wellwell
Vadose zone
Saturated zone
Contaminant Contaminant transport / fatetransport / fate
Contaminant source
Contaminant source
Receptors w/ exposures via ingestion of
drinking water or inhalation of
vapors
Major challenges
occur at sites with dense
nonaqueous phase liquids
(DNAPLs) such as PCE
and TCE solvents

4
Magnitude of the problem in the U.S.Estimated 30,000 to 50,000 sites with groundwater contamination (excludes petrol UST sites)
80% of the sites are contaminated with organic chemicals, and of these, 60% likely have DNAPLs
Clean up costs for 15,000 to 25,000 sites with DNAPLs...?Conventional groundwater pumping and treatment systems
Median is $180,000/year; range is $30,000 to $4,000,000/yearFor all sites, annual costs are $2.7 to 4.5 billion/year
Assuming a 30-year life and a 5 to 10% interest rate, life-cycle costs of “cleanup” could range from $50 to $100 billion dollars
Clean up based on groundwater pump and treat is hopeless; Alternative technologies and approaches are needed…..
Source: USEPA (2003). Source: USEPA (2003). www.epa.gov/ada/download/reports/600R03143/600R03143.pdf
5
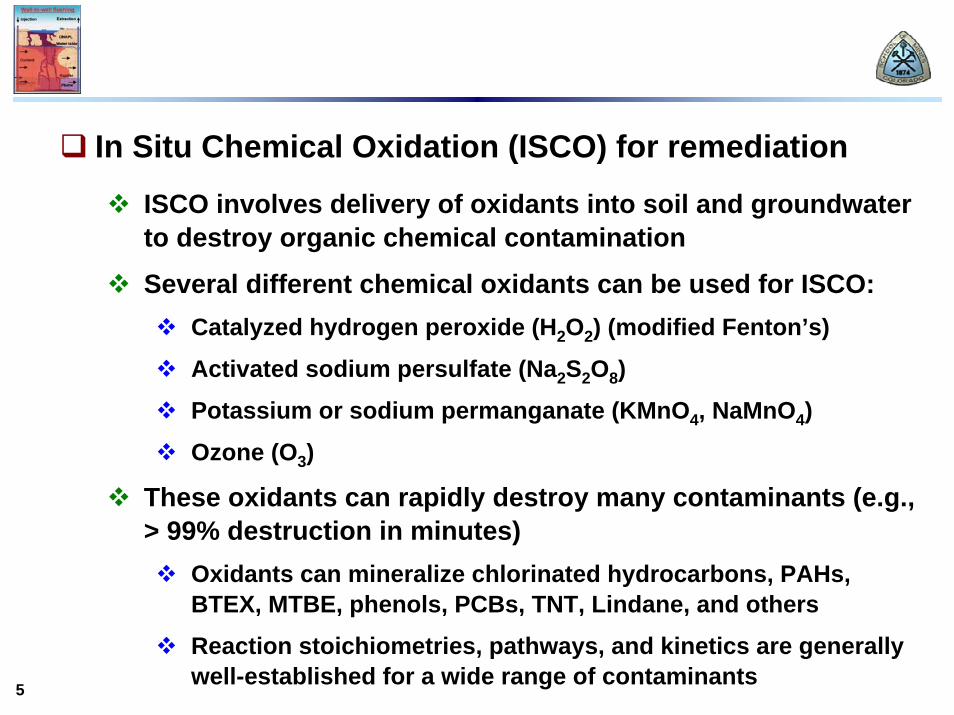
In Situ Chemical Oxidation (ISCO) for remediation
ISCO involves delivery of oxidants into soil and groundwater to destroy organic chemical contamination
Several different chemical oxidants can be used for ISCO:Catalyzed hydrogen peroxide (H2O2) (modified Fenton’s)
Activated sodium persulfate (Na2S2O8)
Potassium or sodium permanganate (KMnO4, NaMnO4)
Ozone (O3)
These oxidants can rapidly destroy many contaminants (e.g., > 99% destruction in minutes)
Oxidants can mineralize chlorinated hydrocarbons, PAHs, BTEX, MTBE, phenols, PCBs, TNT, Lindane, and others
Reaction stoichiometries, pathways, and kinetics are generally well-established for a wide range of contaminants

6
But,… successful use of ISCO for site clean up requires system engineering that must address:
Oxidant type and concentration to be usedNatural oxidant demand (NOD) of subsurface media
Contaminant type, mass level, and architectureSubsurface and surface site conditions
Method and mode of oxidant delivery to soil or groundwaterWells vs. probes vs. mixing etc. and One vs. many dosesHydraulic control and fugitive emissions controlMaintain permeability in injection wells and/or the aquiferPrevention of groundwater quality impacts
Synergy of ISCO with pre- and post-ISCO methods
Methods for process monitoring and performance validation
Health and safety controls

7
For clean up of small sites, ISCO can be very attractiveSmall sites often have contaminants that ISCO can treat
For example: dry cleaners, machining and metal working, vehicle repair, chemical factories, testing labs, etcetera
At small sites, ISCO can be relatively easy to use - why?
Engineers are ‘comfortable’ with chemical oxidation based on training and experience (e.g., with waste treatment)
ISCO can be designed and implemented with widely available materials and equipment
ISCO does not require large or highly specialized equipment
ISCO does not have unusual power requirements or other utility needs
ISCO can be done relatively quickly (days to a few weeks)
ISCO does not have major patent limitations

8
Technology StatusISCO has ‘matured’ since the early 1990’s
Laboratory research increased the fundamental understanding of chemical oxidation, including:
Reaction chemistry for organics in aqueous systems
Transport processes affecting oxidant delivery
Oxidant interactions with soil or aquifer media
Pilot-scale studies helped advance the engineering of ISCO for common types of contaminated sites, including:
Sites with dissolved and sorbed phase levels of organic chemicals in soil and groundwater plumes
To a lesser degree, sites with DNAPL source zones
DNAPL residuals suspended in homogeneous media
DNAPL pools resting on a low permeability layer

9
Based on the results of R&D and pilot-scale studies, guidance documents were produced in the late 1990’s and early 2000’s, including:
Project case study reviews
e.g., USEPA 1998, ESTCP 1999
Technical reference book
e.g., Siegrist et al. 2001
Technical and regulatory guidance
e.g., ITRC 2001, 2005
www.itrcweb.org/gd_ISCO.asp

10
During the late 1990’s, engineers and consultants increasingly used ISCO for site remediation
Different oxidants have been used alone or combinedH2O2, Na2S2O8, NaMnO4, KMnO4, O3
Optional subsurface delivery methods have been usedDirect-push probes, drilled wells, or specialized injectors, with some use of fracturing techniques
Reactive barriers, recirculation schemes, multiple delivery modes, or other strategies
Cleanup goals have varied, for example:Reduce the concentration or mass by some % (e.g., >90%)
Achieve a final soil concentration (e.g., 1 mg/kg or less)
Achieve a concentration in a plume at some compliance plane downgradient from a DNAPL source zone

11
A few examples help illustrate the features of ISCO remediation projects
Vertical well-to-well recirculation of NaMnO4 in Ohio
ISCO treatment of the source of a TCE groundwater plume in an industrial area
1.5 to 2.0 mg/L TCE in sandy gravel aquifer zone at 7.9- to 10.4-m depth bgs (Ksat ~ 7.9 to >90 m/d)
Treatment goal
Reduce the mass of TCE in the source zone causing the groundwater plume and prevent the plume from growing
Source: Lowe, K.S., F.G. Gardner, and R.L. Siegrist (2003). Ground Water Monitoring and Remediation. Winter issue.

12
System design and implementation
Lab tests, modeling, hydraulic control tracer test
Full-scale system included 1 center injection well and 4 perimeter extraction wells at 13.7-m radius
Extraction of groundwater, amendment with ~250 mg/L NaMnO4, flow-through reactor, inline filter, and re-injection
Injection/extraction rate was 68 Lpm yielding 3 pore volumes throughput in a 380 m2 treatment zone in ~10 days
Oxidant used = 162 kg (295 L) of 40 wt.% NaMnO4 solution

13
Performance observations
Effective hydraulic control was quickly accomplished
Monitoring revealed TCE reduction of >97%After 30 days, concentrations remained < 20 ug/L
Oxidant depletionTo <20 mg/L at 2 weeks
To <1 mg/L at 4 weeks
No loss in hydraulic conductivity within the treated zone
No biotoxicity measured by Microtox assays

14
Vertical well-to-well flushing of KMnO4 in FloridaISCO treatment of the source of a PCE plume in groundwater
PCE plume (10,000 ug/L near the source) located in shallow (0 to 25 ft) and deep (25 to 60 ft) sandy zones
The plume was estimated to be approximately 100 ft wide, 500 ft long, and 60 ft deep
100 ug/L1000 ug/L10000 ug/L
Treatment goal
Reduce the PCE mass in the source zone and enhance the effectiveness of bioremediation and phytoremediation in the downgradient plume
Source: Crimi and Siegrist (2003). J.Ground Water; Singletary et al. (2006). Battelle Recalcitrant Organics Conf.

15
System design and implementation
Lab tests, field pilot test, and flow modeling were done
The full-scale system included a vertical well network with KMnO4 flushing of shallow and deeper aquifer zones
Groundwater was extracted and processed in a treatment system prior to re-injection at a design rate of 57 Lpm (6.4 to 9.5 Lpm per well) and concentration of 1000 mg/L KMnO4
Medium-Density Silt-Sand Layer
Shallow Injection Well (Typ of 5)
Deep Injection Well (Typ of 2)
Shallow Extraction Well (Typ of 4)
Deep Extraction Well (Typ of 2)
Ground Surface
Settling Tank No. 1
Settling Tank No. 2
KMnO4 and Polymer Feeder
5 µm Bag Filters
Shallow Aquifer Zone
Deep Aquifer Zone
Reinjection Pump
Ambient Groundwater Flow Direction

16
Performance observations
During the initial months of operation the delivery and distribution of KMnO4 in the subsurface was much more limited than anticipated
The system was shutdown and CSM studies were done
Characterization studies revealed:Very fine uniform sands (small d10 and very low U.C.)
High organic carbon content and high NOD
High groundwater dissolved solids level
These conditions caused injection well permeability loss and an inability to achieve the design oxidant injection flow rateand limited the actual oxidant distribution at the site
Flow-through column tests and modeling studies using a new CSM model, CORT3D revealed:
Oxidant distribution could be improved by using a lower concentration at a faster injection rate for more pore volumes

17
In situ soil blending using Na2S2O8 in New Jersey
Treatment of VOC contaminated soil and groundwater
Depth to groundwater = 0.3 m
Treatment interval = 0.3 to 3.3 m depth bgs
System design and implementationIn situ blending using base-catalyzed persulfate (Klozur)
Applied 10 Klozur grams per kilogram of soilApplied 1 gram hydrated lime per kilogram of soil
Source: Dr. John Haselow (2006). Redox Tech, LLC. http://redox-tech.com/

18
Performance observations
Treated approximately 5000 tons in 2 days
Concentrations dropped from 100 – 200 ppm total VOCS (TCE plus daughters) in groundwater to < 0.1 ppm in 1 week

19
ISCO performance - design vs. outcomes…?At some sites, clean up goals have been met in a predictable, cost-effective and timely manner using ISCO
At other sites, ISCO performance has not met expectations
Examples of deficiencies have included:Inability to achieve site cleanup goals based on predictions for the ISCO system that was designed and implemented
So-called “rebound” in groundwater concentrations following the end of active ISCO operations
Poor performance is often attributed to:Site heterogeneities and low permeability zones
Excessive oxidant consumption by soil and aquifer media
Presence of large masses of contaminants (e.g., DNAPLs)

20
ISCO R&D at CSMCSM has been working along with others to help improve ISCO system design and performanceSeveral major projects are in progress at CSM
“Reaction and transport processes controlling in situ chemical oxidation of DNAPLs” ~ 2002 to 2005
Oxidants: Catalyzed H2O2, NaMnO4, KMnO4
Contaminants: Varied levels of PCE and TCEProcesses: Interphase mass transfer and oxidative degradationDelivery: advection and diffusion transport processesCoupling: oxidant enhanced bio, or surfactant flushingModeling: analytical and numerical methods

21
“In Situ Chemical Oxidation for Groundwater Remediation - Technology Practices Manual” ~ 2006 to 2008
New project being completed by a team from CSM, with CH2M Hill and the Navy
The goal is to advance the standard-of-practice and enable more predictable, cost-effective application of ISCO by providing engineering guidance and decision-support tools
Task 2.Test Protocol against case
studies
Task 2.Test Protocol against case
studies
Task 4.Apply ISCO Protocol to
selected DoD sites
Task 4.Apply ISCO Protocol to
selected DoD sites
Task 5.Refine the
ISCO Protocol and tools
Task 5.Refine the
ISCO Protocol and tools
Task 6.Produce an ISCO
Technology Practices Manual and FAQ guide
Task 6.Produce an ISCO
Technology Practices Manual and FAQ guide
Task 3.Select DoD sites
for Protocol application
Task 3.Select DoD sites
for Protocol application
Task 1.ISCO Protocol development
Task 1.ISCO Protocol development

22
Closing Remarks
AcknowledgementsCSM team members for their contributions
Drs. Michelle Crimi, Tissa Illangasekare, Junko Munakata-Marr
Jeff Heiderscheidt, Pamela Dugan, Ben Petri, Sarah Seitz, Jason Sahl, Shannon Jackson, Kathryn Lowe
DoD SERDP/ESTCP for CSM research funding
Dr. John Haselow (Redox Tech LLC) for case study slides
Thank you for listening…
Questions…?