SITE LOCATION P6=2
61
Transcript of SITE LOCATION P6=2

Dave
Callout
SITE LOCATION P6=2.7
Dave
Callout
SITE LOCATION P24=5.6
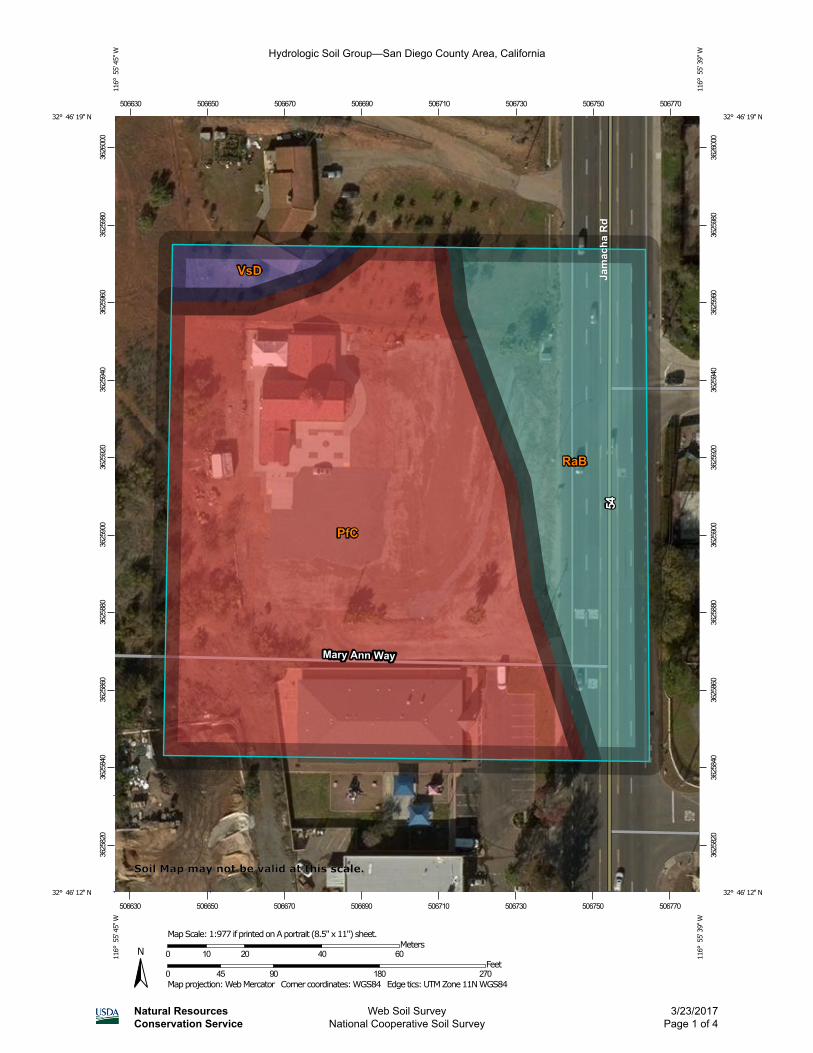
Hydrologic Soil Group—San Diego County Area, California
Natural ResourcesConservation Service
Web Soil SurveyNational Cooperative Soil Survey
3/23/2017Page 1 of 4
3625
820
3625
840
3625
860
3625
880
3625
900
3625
920
3625
940
3625
960
3625
980
3626
000
3625
820
3625
840
3625
860
3625
880
3625
900
3625
920
3625
940
3625
960
3625
980
3626
000
506630 506650 506670 506690 506710 506730 506750 506770
506630 506650 506670 506690 506710 506730 506750 506770
32° 46' 19'' N11
6° 5
5' 4
5'' W
32° 46' 19'' N
116°
55'
39'
' W
32° 46' 12'' N
116°
55'
45'
' W
32° 46' 12'' N
116°
55'
39'
' W
N
Map projection: Web Mercator Corner coordinates: WGS84 Edge tics: UTM Zone 11N WGS840 45 90 180 270
Feet0 10 20 40 60
MetersMap Scale: 1:977 if printed on A portrait (8.5" x 11") sheet.
Soil Map may not be valid at this scale.

MAP LEGEND MAP INFORMATION
Area of Interest (AOI)Area of Interest (AOI)
SoilsSoil Rating Polygons
A
A/D
B
B/D
C
C/D
D
Not rated or not available
Soil Rating LinesA
A/D
B
B/D
C
C/D
D
Not rated or not available
Soil Rating PointsA
A/D
B
B/D
C
C/D
D
Not rated or not available
Water FeaturesStreams and Canals
TransportationRails
Interstate Highways
US Routes
Major Roads
Local Roads
BackgroundAerial Photography
The soil surveys that comprise your AOI were mapped at1:24,000.
Warning: Soil Map may not be valid at this scale.
Enlargement of maps beyond the scale of mapping can causemisunderstanding of the detail of mapping and accuracy of soilline placement. The maps do not show the small areas ofcontrasting soils that could have been shown at a more detailedscale.
Please rely on the bar scale on each map sheet for mapmeasurements.
Source of Map: Natural Resources Conservation ServiceWeb Soil Survey URL:Coordinate System: Web Mercator (EPSG:3857)
Maps from the Web Soil Survey are based on the Web Mercatorprojection, which preserves direction and shape but distortsdistance and area. A projection that preserves area, such as theAlbers equal-area conic projection, should be used if moreaccurate calculations of distance or area are required.
This product is generated from the USDA-NRCS certified data asof the version date(s) listed below.
Soil Survey Area: San Diego County Area, CaliforniaSurvey Area Data: Version 10, Sep 12, 2016
Soil map units are labeled (as space allows) for map scales1:50,000 or larger.
Date(s) aerial images were photographed: Dec 7, 2014—Jan 4,2015
The orthophoto or other base map on which the soil lines werecompiled and digitized probably differs from the backgroundimagery displayed on these maps. As a result, some minorshifting of map unit boundaries may be evident.
Hydrologic Soil Group—San Diego County Area, California
Natural ResourcesConservation Service
Web Soil SurveyNational Cooperative Soil Survey
3/23/2017Page 2 of 4
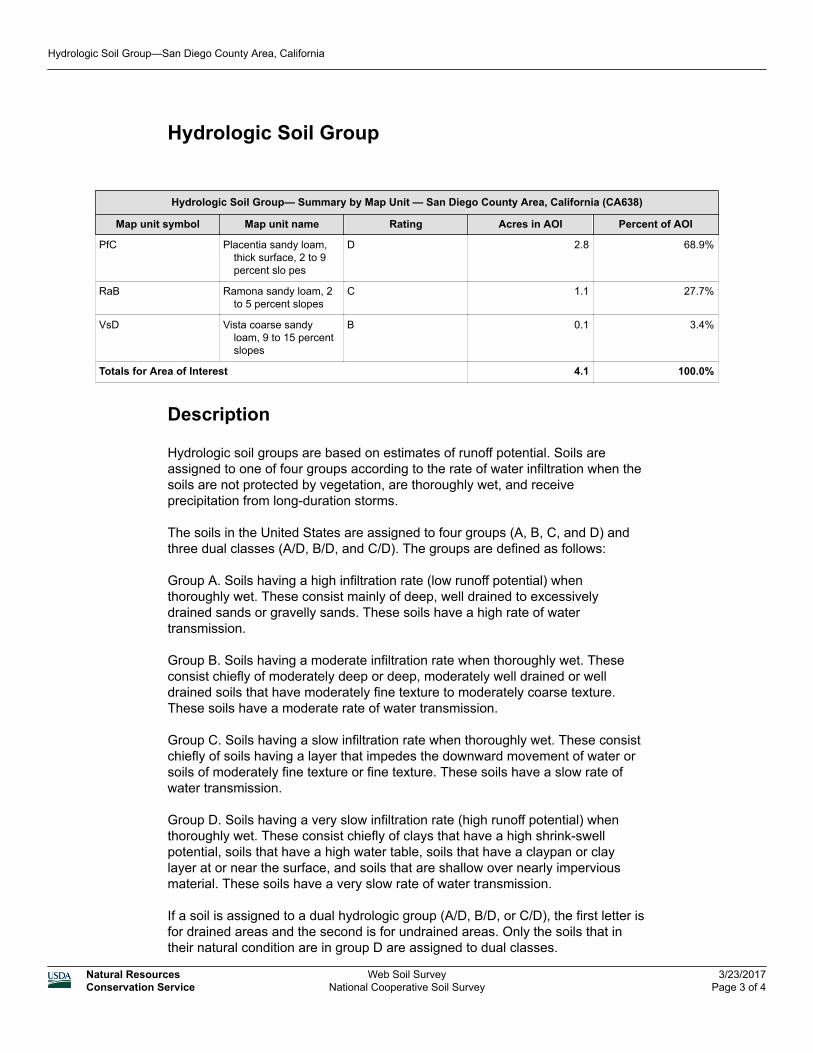
Hydrologic Soil Group
Hydrologic Soil Group— Summary by Map Unit — San Diego County Area, California (CA638)
Map unit symbol Map unit name Rating Acres in AOI Percent of AOI
PfC Placentia sandy loam,thick surface, 2 to 9percent slo pes
D 2.8 68.9%
RaB Ramona sandy loam, 2to 5 percent slopes
C 1.1 27.7%
VsD Vista coarse sandyloam, 9 to 15 percentslopes
B 0.1 3.4%
Totals for Area of Interest 4.1 100.0%
Description
Hydrologic soil groups are based on estimates of runoff potential. Soils areassigned to one of four groups according to the rate of water infiltration when thesoils are not protected by vegetation, are thoroughly wet, and receiveprecipitation from long-duration storms.
The soils in the United States are assigned to four groups (A, B, C, and D) andthree dual classes (A/D, B/D, and C/D). The groups are defined as follows:
Group A. Soils having a high infiltration rate (low runoff potential) whenthoroughly wet. These consist mainly of deep, well drained to excessivelydrained sands or gravelly sands. These soils have a high rate of watertransmission.
Group B. Soils having a moderate infiltration rate when thoroughly wet. Theseconsist chiefly of moderately deep or deep, moderately well drained or welldrained soils that have moderately fine texture to moderately coarse texture.These soils have a moderate rate of water transmission.
Group C. Soils having a slow infiltration rate when thoroughly wet. These consistchiefly of soils having a layer that impedes the downward movement of water orsoils of moderately fine texture or fine texture. These soils have a slow rate ofwater transmission.
Group D. Soils having a very slow infiltration rate (high runoff potential) whenthoroughly wet. These consist chiefly of clays that have a high shrink-swellpotential, soils that have a high water table, soils that have a claypan or claylayer at or near the surface, and soils that are shallow over nearly imperviousmaterial. These soils have a very slow rate of water transmission.
If a soil is assigned to a dual hydrologic group (A/D, B/D, or C/D), the first letter isfor drained areas and the second is for undrained areas. Only the soils that intheir natural condition are in group D are assigned to dual classes.
Hydrologic Soil Group—San Diego County Area, California
Natural ResourcesConservation Service
Web Soil SurveyNational Cooperative Soil Survey
3/23/2017Page 3 of 4

Rating Options
Aggregation Method: Dominant Condition
Component Percent Cutoff: None Specified
Tie-break Rule: Higher
Hydrologic Soil Group—San Diego County Area, California
Natural ResourcesConservation Service
Web Soil SurveyNational Cooperative Soil Survey
3/23/2017Page 4 of 4
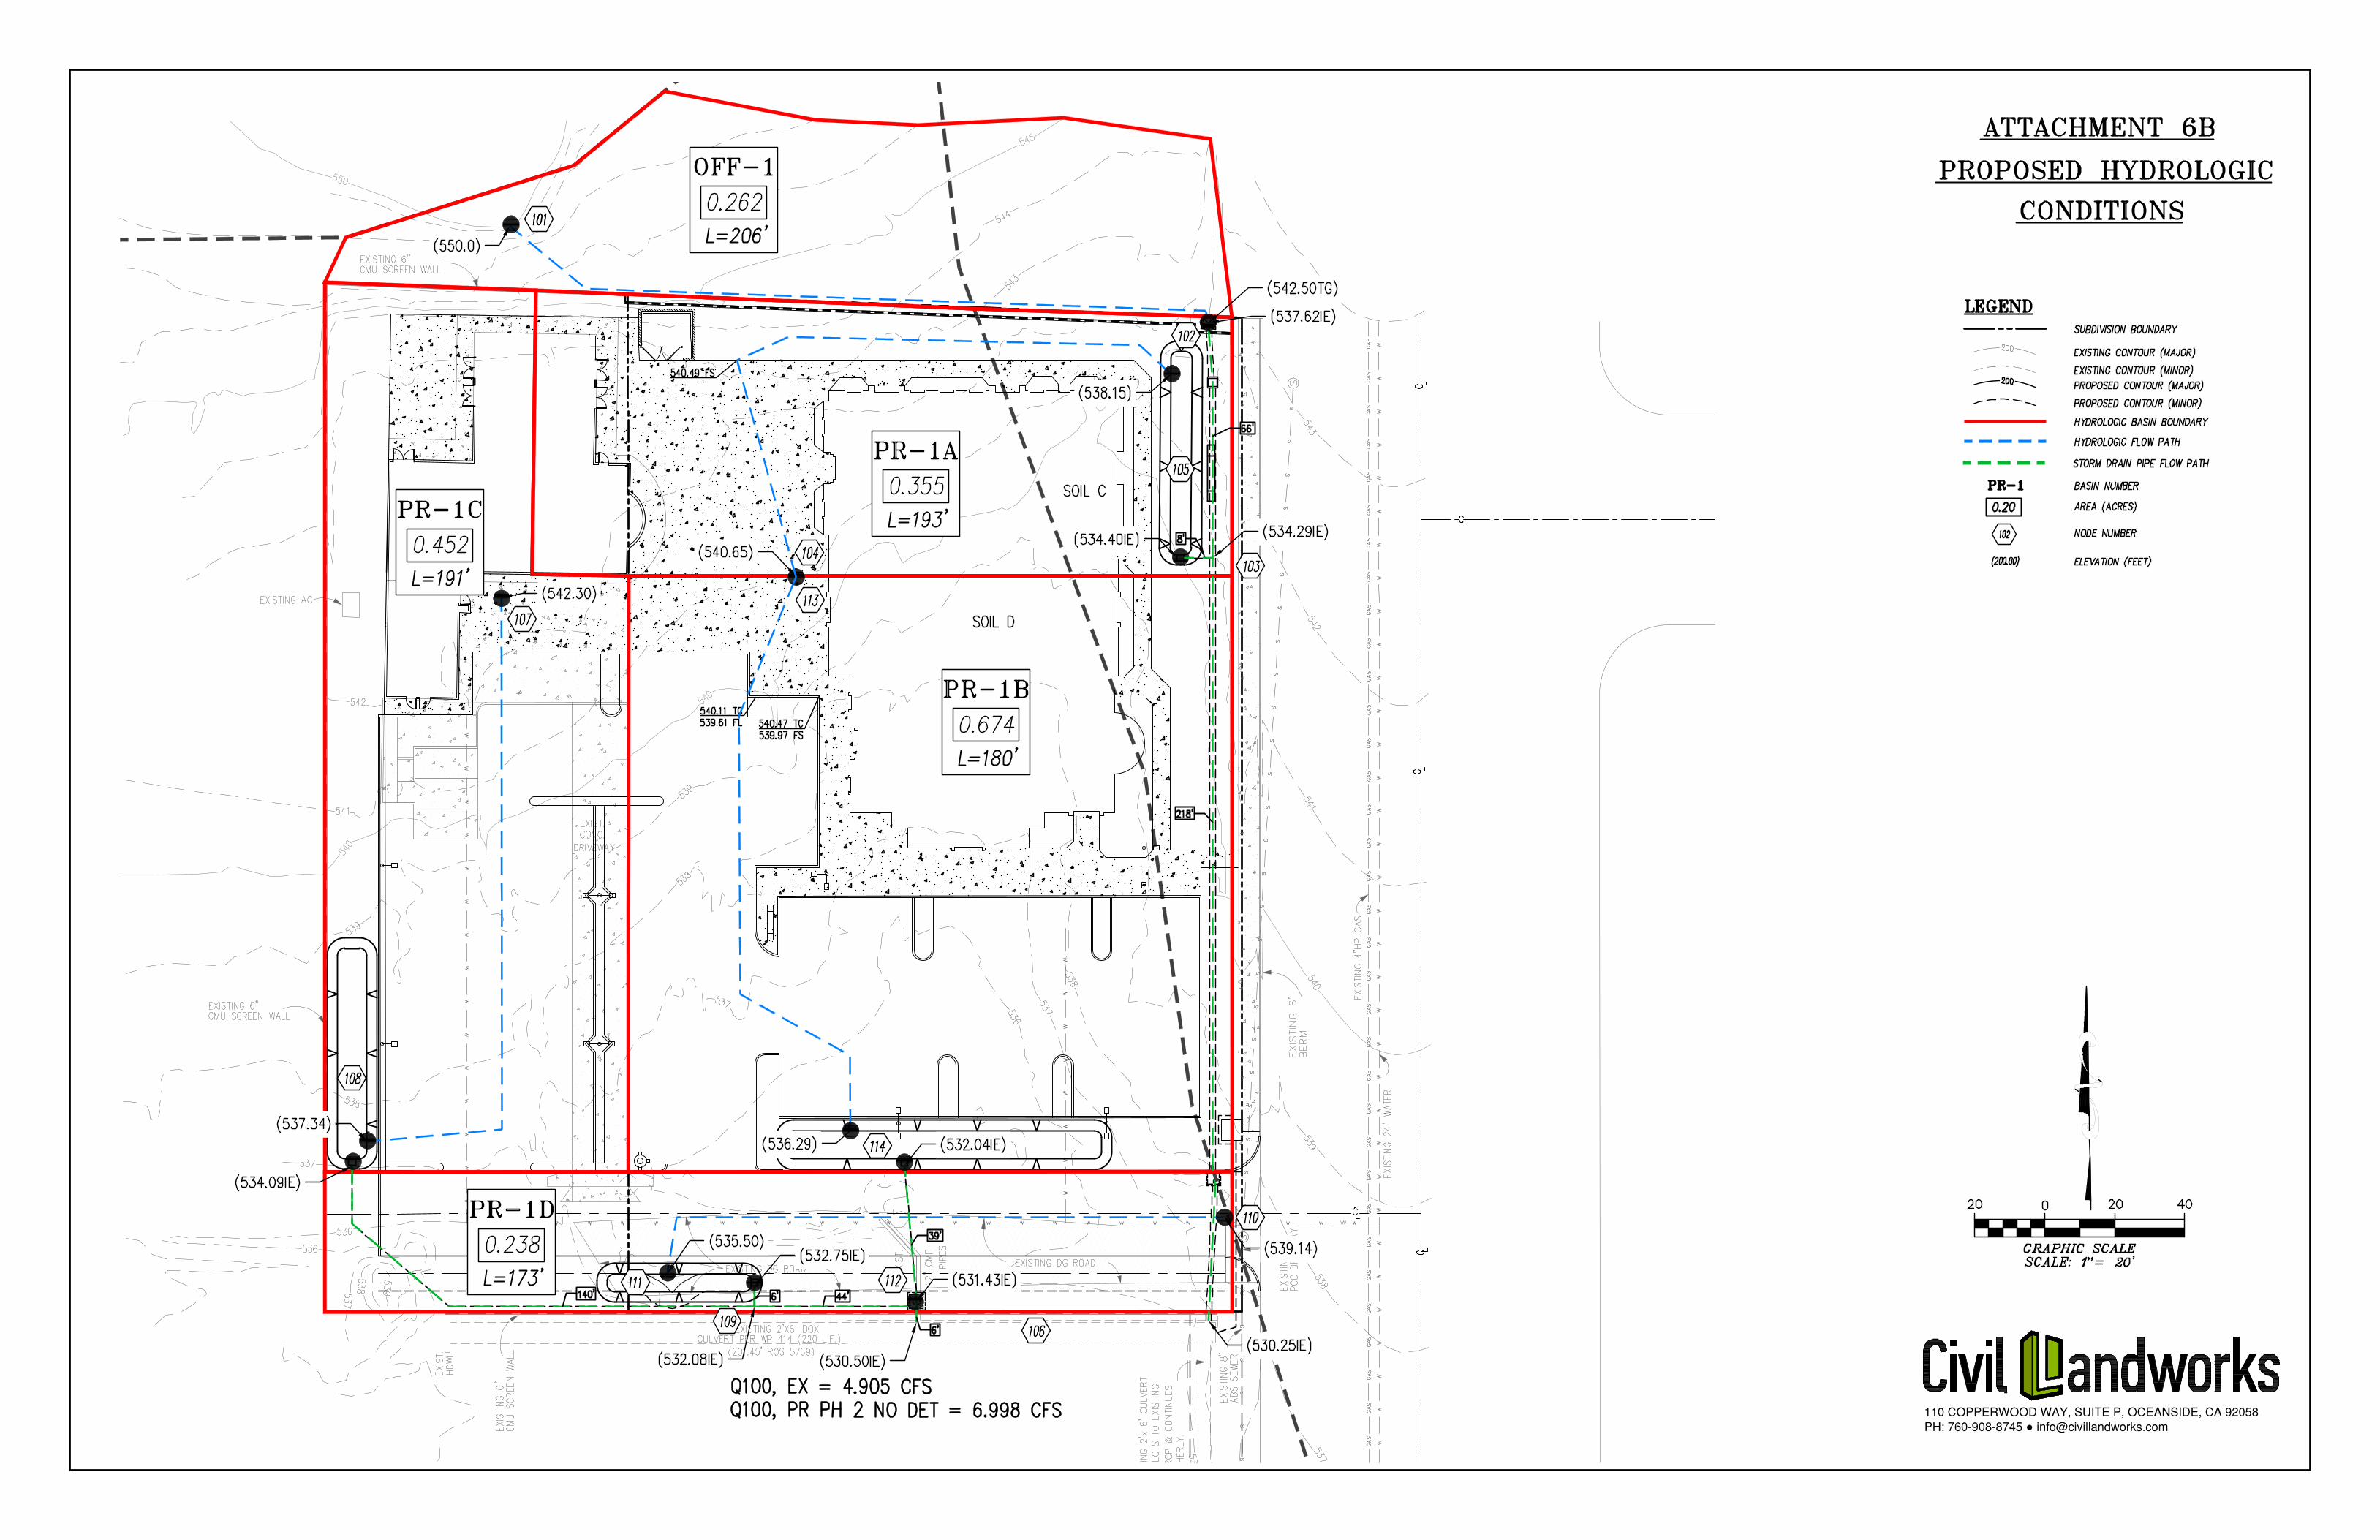
ATTACHMENT 3
EXISTING HYDROLOGY CALCULATIONS
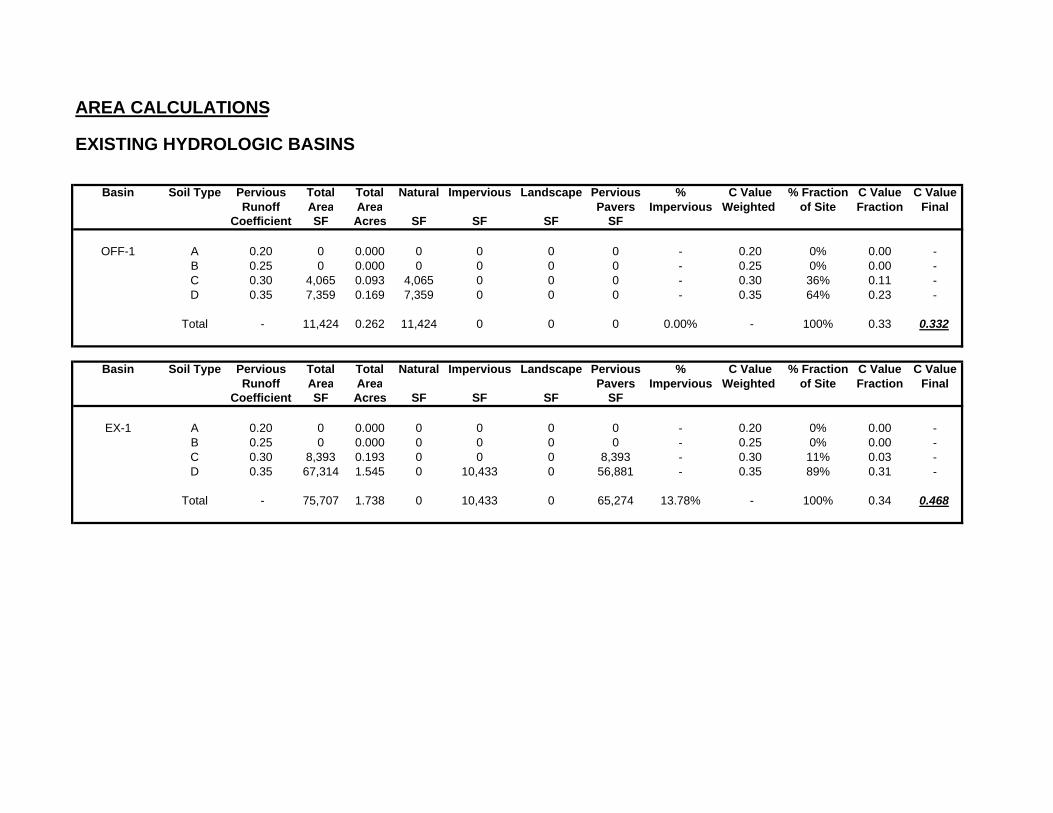
AREA CALCULATIONS
EXISTING HYDROLOGIC BASINS
Basin Soil Type Pervious Total Total Natural Impervious Landscape Pervious % C Value % Fraction C Value C ValueRunoff Area Area Pavers Impervious Weighted of Site Fraction Final
Coefficient SF Acres SF SF SF SF
OFF-1 A 0.20 0 0.000 0 0 0 0 - 0.20 0% 0.00 - B 0.25 0 0.000 0 0 0 0 - 0.25 0% 0.00 - C 0.30 4,065 0.093 4,065 0 0 0 - 0.30 36% 0.11 - D 0.35 7,359 0.169 7,359 0 0 0 - 0.35 64% 0.23 -
Total - 11,424 0.262 11,424 0 0 0 0.00% - 100% 0.33 0.332
Basin Soil Type Pervious Total Total Natural Impervious Landscape Pervious % C Value % Fraction C Value C ValueRunoff Area Area Pavers Impervious Weighted of Site Fraction Final
Coefficient SF Acres SF SF SF SF
EX-1 A 0.20 0 0.000 0 0 0 0 - 0.20 0% 0.00 - B 0.25 0 0.000 0 0 0 0 - 0.25 0% 0.00 - C 0.30 8,393 0.193 0 0 0 8,393 - 0.30 11% 0.03 - D 0.35 67,314 1.545 0 10,433 0 56,881 - 0.35 89% 0.31 -
Total - 75,707 1.738 0 10,433 0 65,274 13.78% - 100% 0.34 0.468
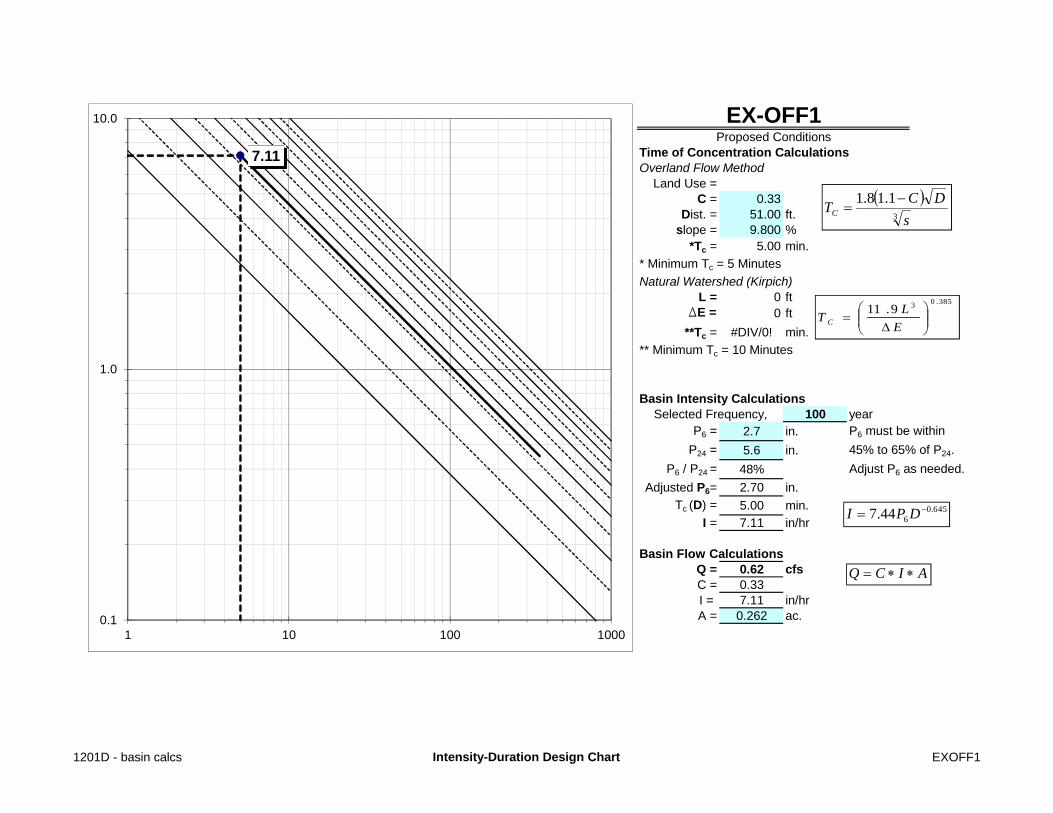
Time of Concentration CalculationsOverland Flow Method
Land Use =C = 0.33
Dist. = 51.00 ft.slope = 9.800 %
*Tc = 5.00 min.* Minimum Tc = 5 MinutesNatural Watershed (Kirpich)
L = 0 ftDE = 0 ft
**Tc = #DIV/0! min.** Minimum Tc = 10 Minutes
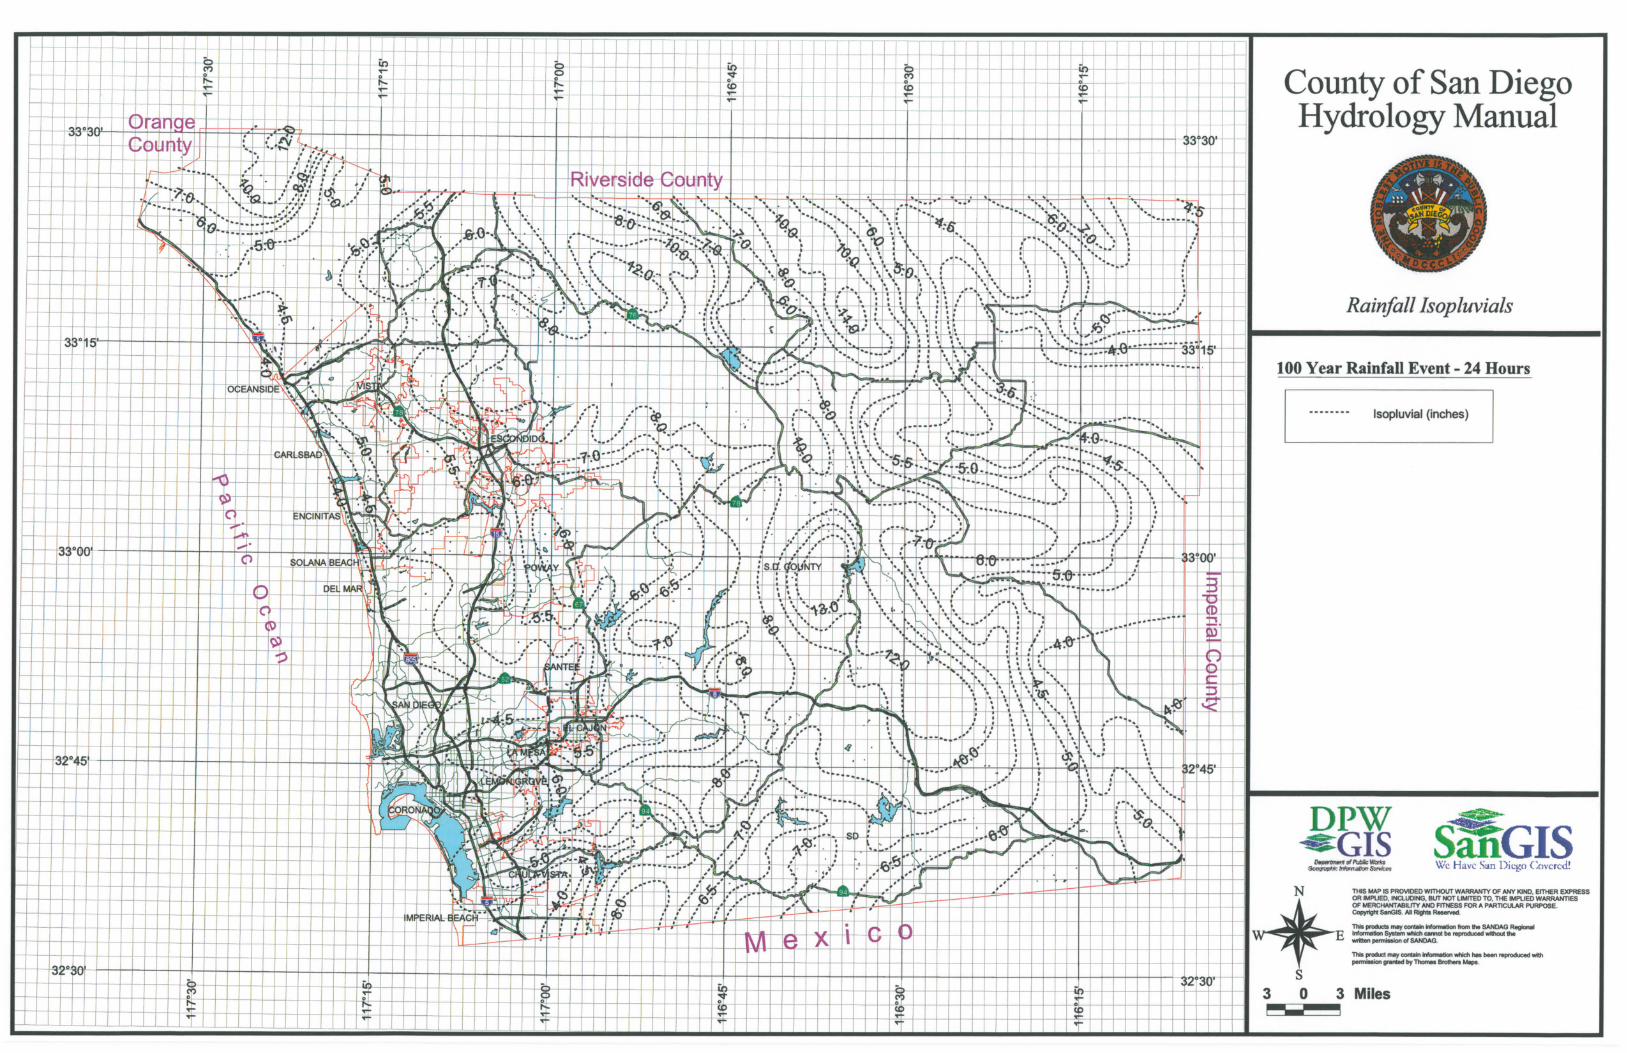
Basin Intensity Calculations100 year
P6 = 2.7 in. P6 must be withinP24 = 5.6 in. 45% to 65% of P24.
P6 / P24 = 48% Adjust P6 as needed.Adjusted P6= 2.70 in.
Tc (D) = 5.00 min.I = 7.11 in/hr
Basin Flow CalculationsQ = 0.62 cfsC = 0.33I = 7.11 in/hrA = 0.262 ac.
EX-OFF1Proposed Conditions
Selected Frequency,
7.11
0.1
1.0
10.0
1 10 100 1000
3
1.18.1
sDCTC
645.0644.7 DPI
AICQ
385.039.11
E
LT C
1201D - basin calcs Intensity-Duration Design Chart EXOFF1

EX1
San Diego County Rational Hydrology Program
CIVILCADD/CIVILDESIGN Engineering Software,(c)1991-2012 Version 7.9
Rational method hydrology program based on San Diego County Flood Control Division 2003 hydrology manual Rational Hydrology Study Date: 04/12/17 ------------------------------------------------------------------------ ********* Hydrology Study Control Information **********
------------------------------------------------------------------------
Program License Serial Number 6313
------------------------------------------------------------------------ Rational hydrology study storm event year is 100.0 English (in-lb) input data Units used
Map data precipitation entered: 6 hour, precipitation(inches) = 2.700 24 hour precipitation(inches) = 5.600 P6/P24 = 48.2% San Diego hydrology manual 'C' values used
++++++++++++++++++++++++++++++++++++++++++++++++++++++++++++++++++++++ Process from Point/Station 101.000 to Point/Station 102.000 **** USER DEFINED FLOW INFORMATION AT A POINT **** ______________________________________________________________________ User specified 'C' value of 0.332 given for subarea Rainfall intensity (I) = 7.114(In/Hr) for a 100.0 year storm User specified values are as follows: TC = 5.00 min. Rain intensity = 7.11(In/Hr) Total area = 0.262(Ac.) Total runoff = 0.620(CFS)
++++++++++++++++++++++++++++++++++++++++++++++++++++++++++++++++++++++ Process from Point/Station 102.000 to Point/Station 103.000 **** IRREGULAR CHANNEL FLOW TRAVEL TIME **** ______________________________________________________________________ Estimated mean flow rate at midpoint of channel = 2.718(CFS) Depth of flow = 0.167(Ft.), Average velocity = 1.848(Ft/s) ******* Irregular Channel Data *********** ----------------------------------------------------------------- Information entered for subchannel number 1 : Point number 'X' coordinate 'Y' coordinate 1 0.00 0.40 2 21.00 0.00 3 42.00 0.40 Manning's 'N' friction factor = 0.030 ----------------------------------------------------------------- Sub-Channel flow = 2.719(CFS) ' ' flow top width = 17.576(Ft.) ' ' velocity= 1.848(Ft/s) ' ' area = 1.471(Sq.Ft) ' ' Froude number = 1.126
Upstream point elevation = 545.000(Ft.) Downstream point elevation = 534.200(Ft.) Flow length = 284.000(Ft.) Travel time = 2.56 min. Time of concentration = 7.56 min. Depth of flow = 0.167(Ft.) Average velocity = 1.848(Ft/s) Total irregular channel flow = 2.718(CFS) Irregular channel normal depth above invert elev. = 0.167(Ft.) Average velocity of channel(s) = 1.848(Ft/s) Adding area flow to channel Rainfall intensity (I) = 5.448(In/Hr) for a 100.0 year storm User specified 'C' value of 0.468 given for subarea Rainfall intensity = 5.448(In/Hr) for a 100.0 year storm Effective runoff coefficient used for total area (Q=KCIA) is C = 0.450 CA = 0.900 Subarea runoff = 4.285(CFS) for 1.738(Ac.) Total runoff = 4.905(CFS) Total area = 2.000(Ac.) Depth of flow = 0.209(Ft.), Average velocity = 2.142(Ft/s) End of computations, total study area = 2.000 (Ac.)
Page 1

EX1
Page 2

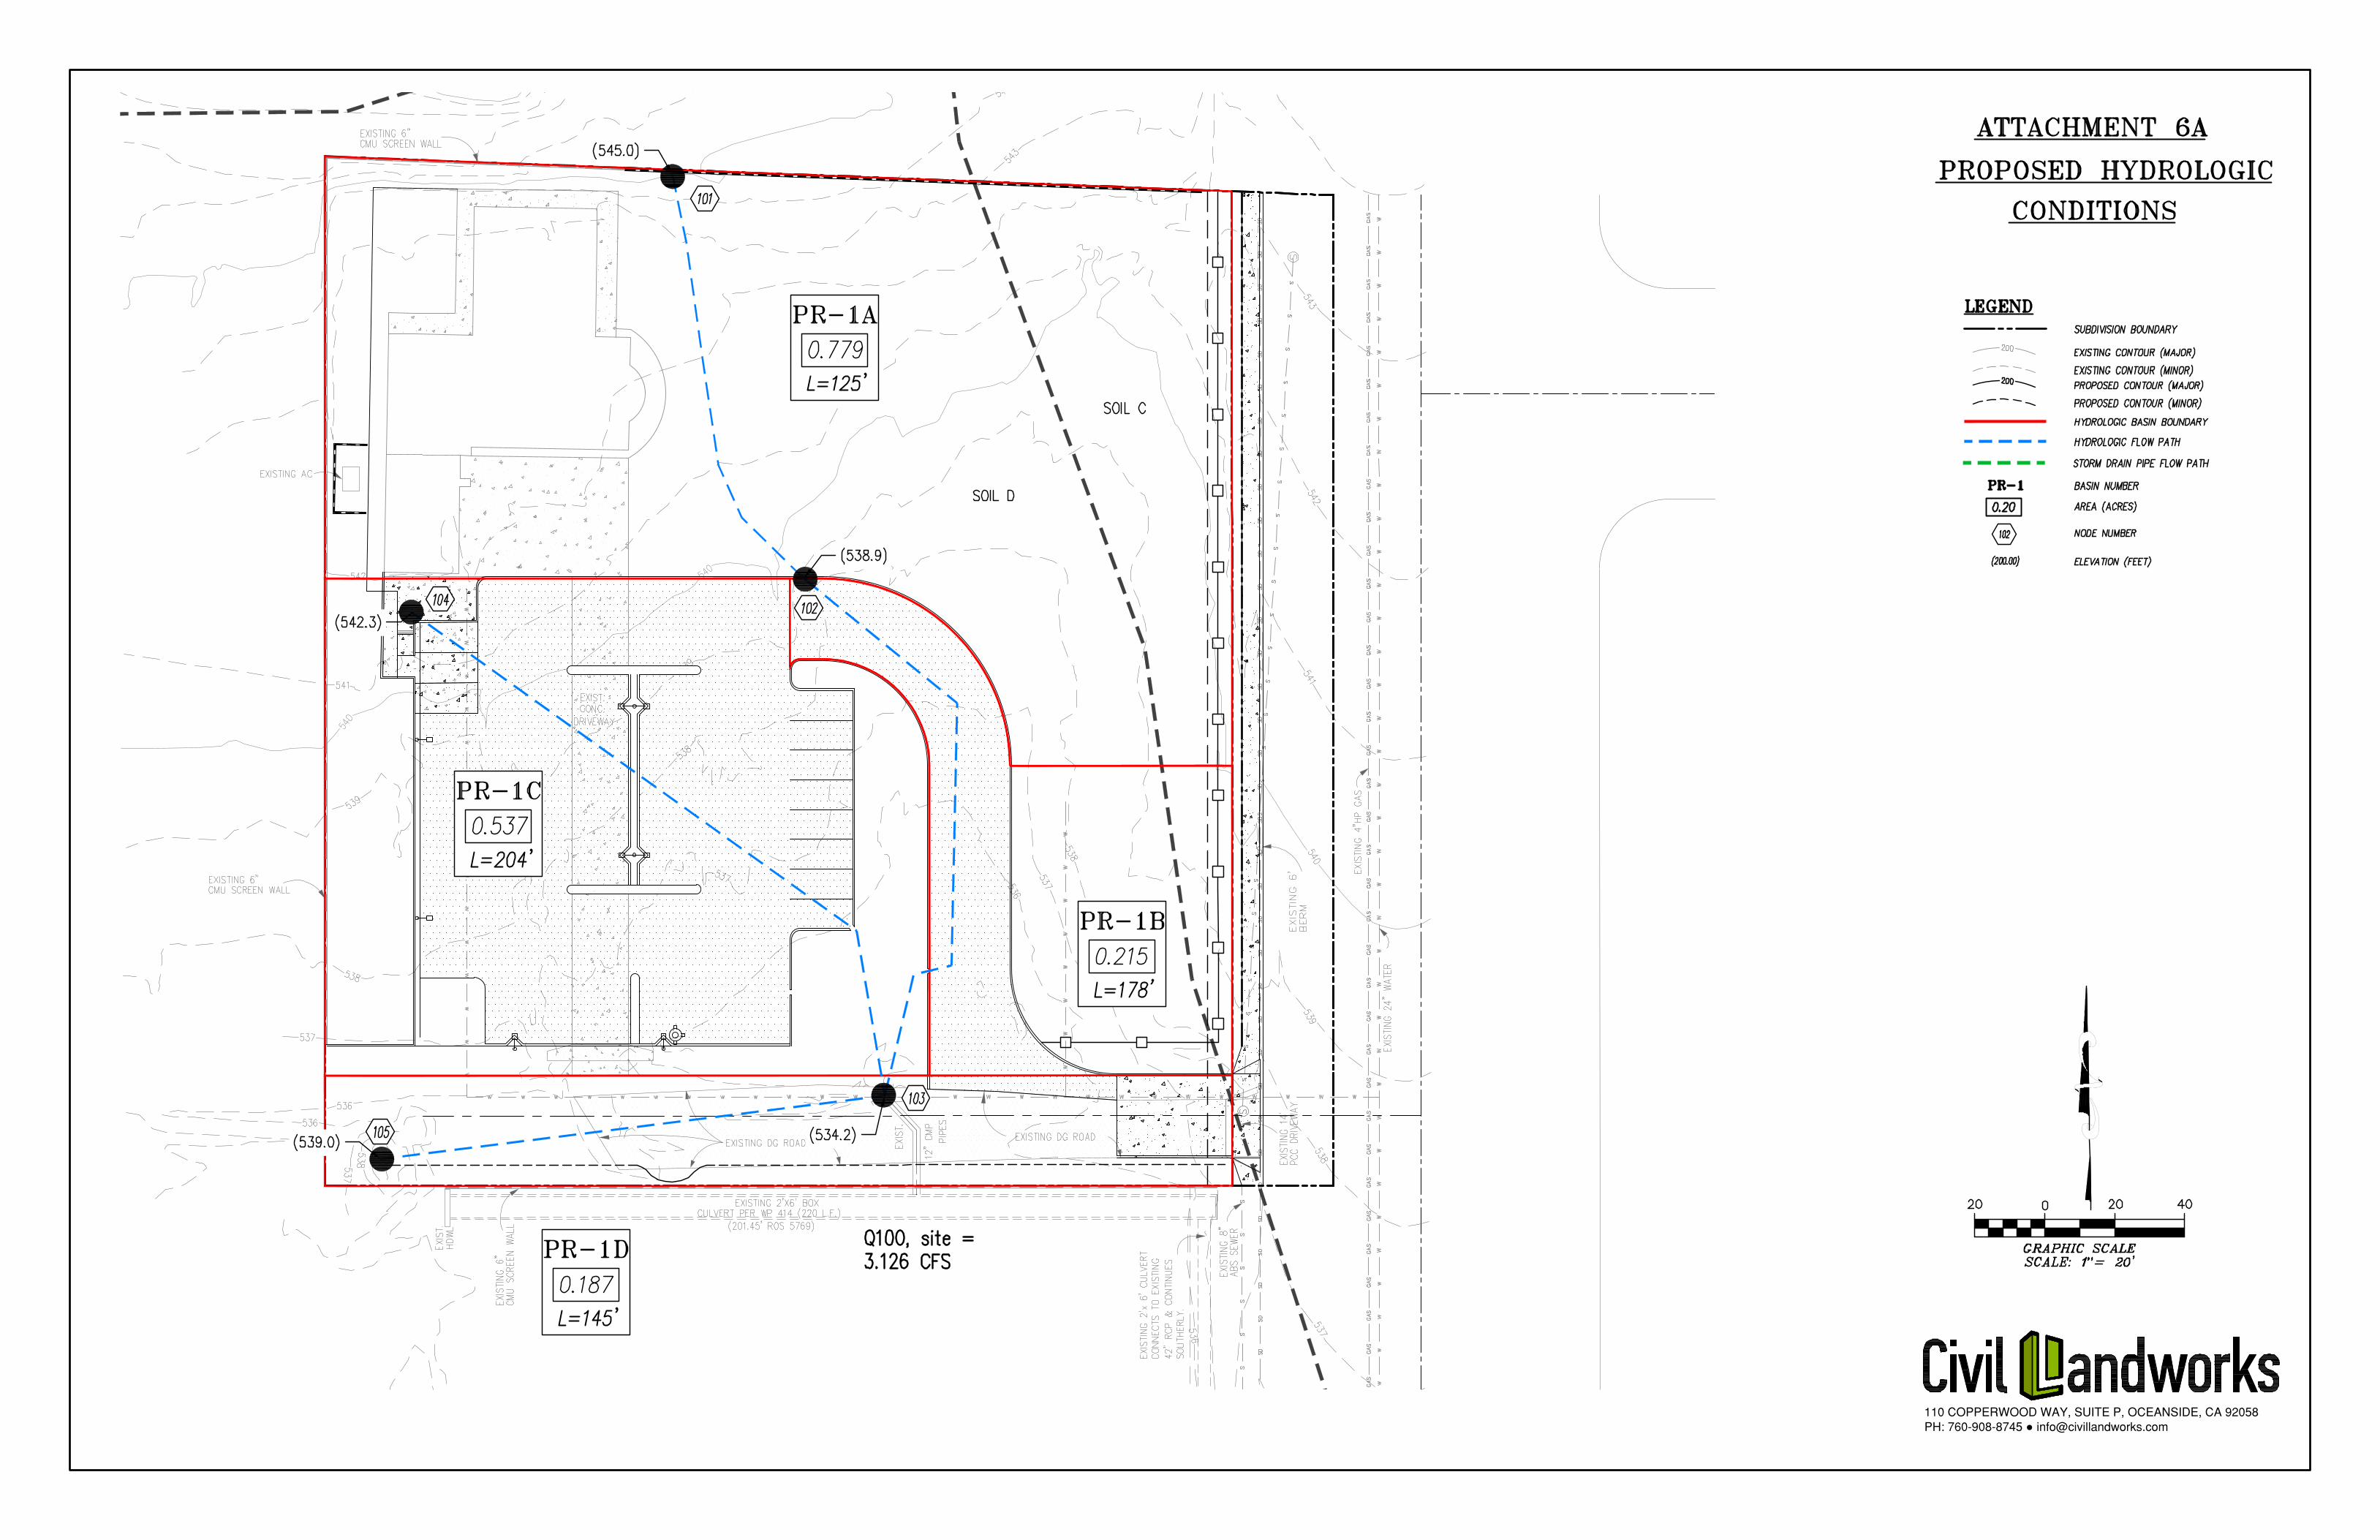
ATTACHMENT 4
PROPOSED HYDROLOGY CALCULATIONS

PHASE 1
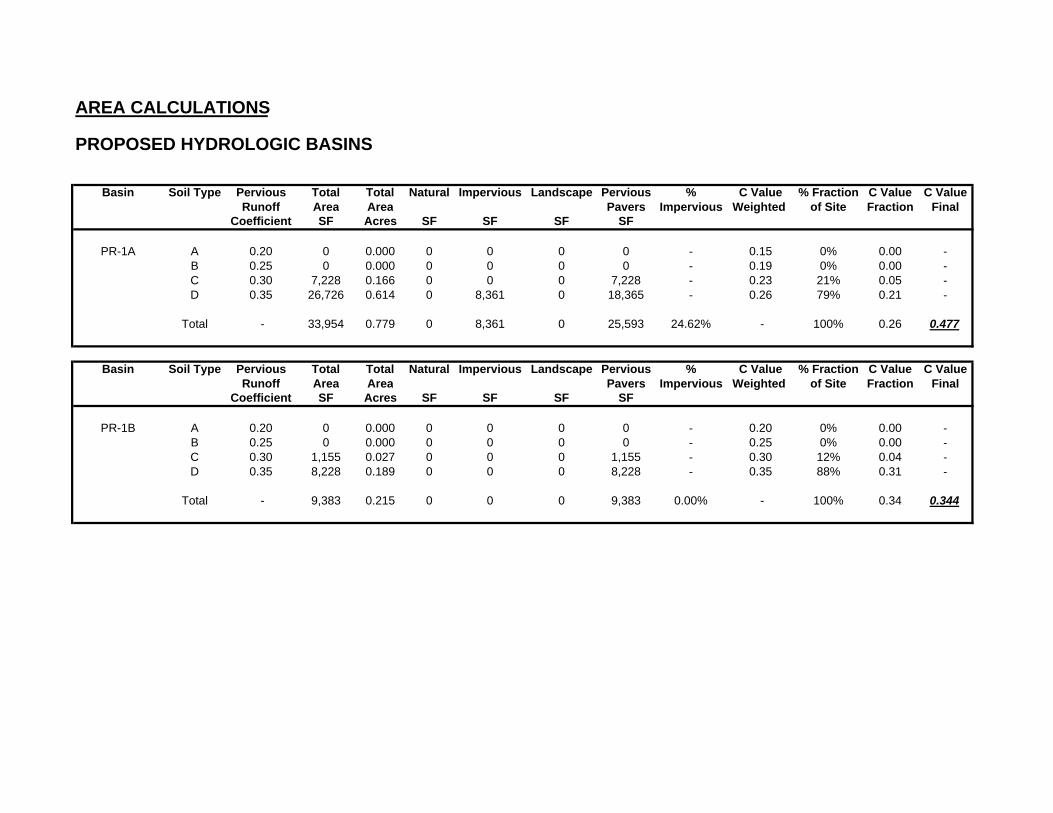
AREA CALCULATIONS
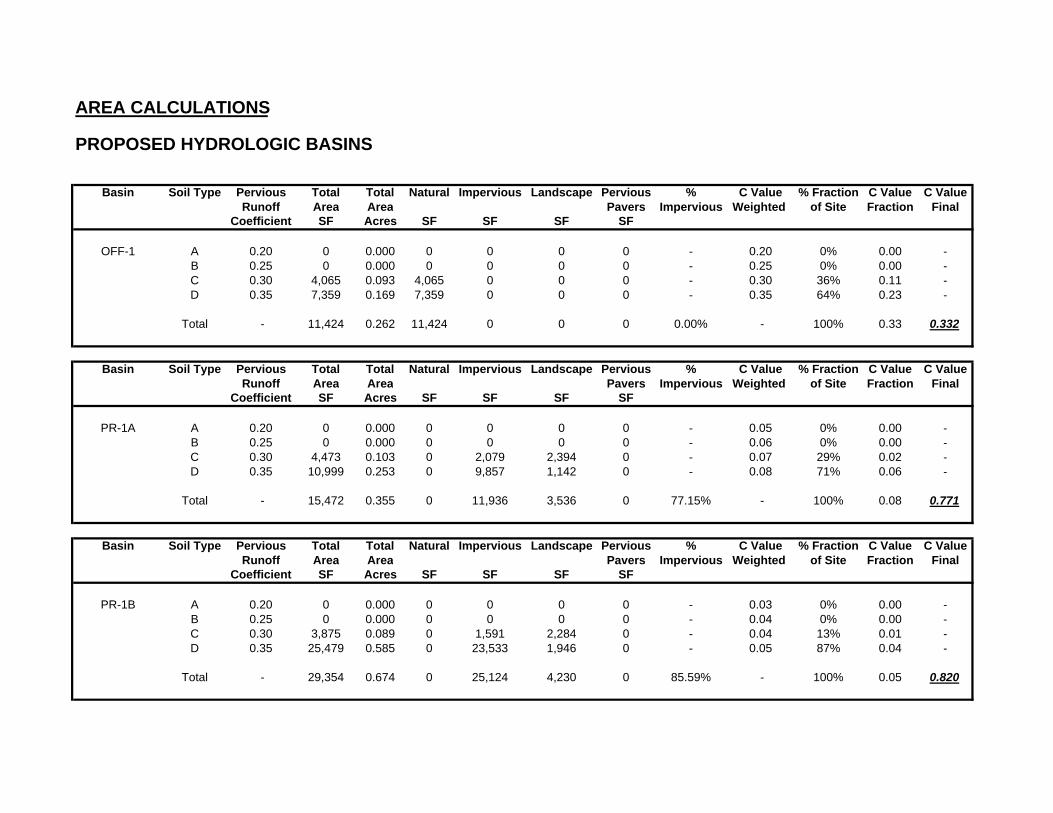
PROPOSED HYDROLOGIC BASINS
Basin Soil Type Pervious Total Total Natural Impervious Landscape Pervious % C Value % Fraction C Value C ValueRunoff Area Area Pavers Impervious Weighted of Site Fraction Final
Coefficient SF Acres SF SF SF SF
PR-1A A 0.20 0 0.000 0 0 0 0 - 0.15 0% 0.00 - B 0.25 0 0.000 0 0 0 0 - 0.19 0% 0.00 - C 0.30 7,228 0.166 0 0 0 7,228 - 0.23 21% 0.05 - D 0.35 26,726 0.614 0 8,361 0 18,365 - 0.26 79% 0.21 -
Total - 33,954 0.779 0 8,361 0 25,593 24.62% - 100% 0.26 0.477
Basin Soil Type Pervious Total Total Natural Impervious Landscape Pervious % C Value % Fraction C Value C ValueRunoff Area Area Pavers Impervious Weighted of Site Fraction Final
Coefficient SF Acres SF SF SF SF
PR-1B A 0.20 0 0.000 0 0 0 0 - 0.20 0% 0.00 - B 0.25 0 0.000 0 0 0 0 - 0.25 0% 0.00 - C 0.30 1,155 0.027 0 0 0 1,155 - 0.30 12% 0.04 - D 0.35 8,228 0.189 0 0 0 8,228 - 0.35 88% 0.31 -
Total - 9,383 0.215 0 0 0 9,383 0.00% - 100% 0.34 0.344

Basin Soil Type Pervious Total Total Natural Impervious Landscape Pervious % C Value % Fraction C Value C ValueRunoff Area Area Pavers Impervious Weighted of Site Fraction Final
Coefficient SF Acres SF SF SF SF
PR-1C A 0.20 0 0.000 0 0 0 0 - 0.04 0% 0.00 - B 0.25 0 0.000 0 0 0 0 - 0.05 0% 0.00 - C 0.30 0 0.000 0 0 0 0 - 0.06 0% 0.00 - D 0.35 19,703 0.452 0 15,497 4,206 0 - 0.07 100% 0.07 -
Total - 19,703 0.452 0 15,497 4,206 0 78.65% - 100% 0.07 0.783
Basin Soil Type Pervious Total Total Natural Impervious Landscape Pervious % C Value % Fraction C Value C ValueRunoff Area Area Pavers Impervious Weighted of Site Fraction Final
Coefficient SF Acres SF SF SF SF
PR-1D A 0.20 0 0.000 0 0 0 0 - 0.20 0% 0.00 - B 0.25 0 0.000 0 0 0 0 - 0.25 0% 0.00 - C 0.30 39 0.001 0 22 0 17 - 0.30 0% 0.00 - D 0.35 10,323 0.237 0 54 4,494 5,775 - 0.35 100% 0.35 -
Total - 10,362 0.238 0 76 4,494 5,792 0.73% - 100% 0.35 0.354

Time of Concentration CalculationsOverland Flow Method
Land Use =C = 0.48
Dist. = 125.00 ft.slope = 4.880 %
*Tc = 7.39 min.* Minimum Tc = 5 MinutesNatural Watershed (Kirpich)
L = 0 ftDE = 0 ft
**Tc = #DIV/0! min.** Minimum Tc = 10 Minutes
Basin Intensity Calculations100 year
P6 = 2.7 in. P6 must be withinP24 = 5.6 in. 45% to 65% of P24.
P6 / P24 = 48% Adjust P6 as needed.Adjusted P6= 2.70 in.
Tc (D) = 7.39 min.I = 5.53 in/hr
Basin Flow CalculationsQ = 2.05 cfsC = 0.48I = 5.53 in/hrA = 0.779 ac.
PR-1AProposed Conditions
Selected Frequency,
5.53
0.1
1.0
10.0
1 10 100 1000
3
1.18.1
sDCTC
645.0644.7 DPI
AICQ
385.039.11
E
LT C
1201D - basin calcs Intensity-Duration Design Chart PR1A PH1

Time of Concentration CalculationsOverland Flow Method
Land Use =C = 0.39
Dist. = 204.00 ft.slope = 3.970 %
*Tc = 11.54 min.* Minimum Tc = 5 MinutesNatural Watershed (Kirpich)
L = 0 ftDE = 0 ft
**Tc = #DIV/0! min.** Minimum Tc = 10 Minutes
Basin Intensity Calculations100 year
P6 = 2.7 in. P6 must be withinP24 = 5.6 in. 45% to 65% of P24.
P6 / P24 = 48% Adjust P6 as needed.Adjusted P6= 2.70 in.
Tc (D) = 11.54 min.I = 4.15 in/hr
Basin Flow CalculationsQ = 0.87 cfsC = 0.39I = 4.15 in/hrA = 0.537 ac.
PR-1CProposed Conditions
Selected Frequency,
4.15
0.1
1.0
10.0
1 10 100 1000
3
1.18.1
sDCTC
645.0644.7 DPI
AICQ
385.039.11
E
LT C
1201D - basin calcs Intensity-Duration Design Chart PR1C PH1

Time of Concentration CalculationsOverland Flow Method
Land Use =C = 0.40
Dist. = 145.00 ft.slope = 3.310 %
*Tc = 10.15 min.* Minimum Tc = 5 MinutesNatural Watershed (Kirpich)
L = 0 ftDE = 0 ft
**Tc = #DIV/0! min.** Minimum Tc = 10 Minutes
Basin Intensity Calculations100 year
P6 = 2.7 in. P6 must be withinP24 = 5.6 in. 45% to 65% of P24.
P6 / P24 = 48% Adjust P6 as needed.Adjusted P6= 2.70 in.
Tc (D) = 10.15 min.I = 4.51 in/hr
Basin Flow CalculationsQ = 0.34 cfsC = 0.40I = 4.51 in/hrA = 0.187 ac.
PR-1DProposed Conditions
Selected Frequency,
4.51
0.1
1.0
10.0
1 10 100 1000
3
1.18.1
sDCTC
645.0644.7 DPI
AICQ
385.039.11
E
LT C
1201D - basin calcs Intensity-Duration Design Chart PR1D PH1
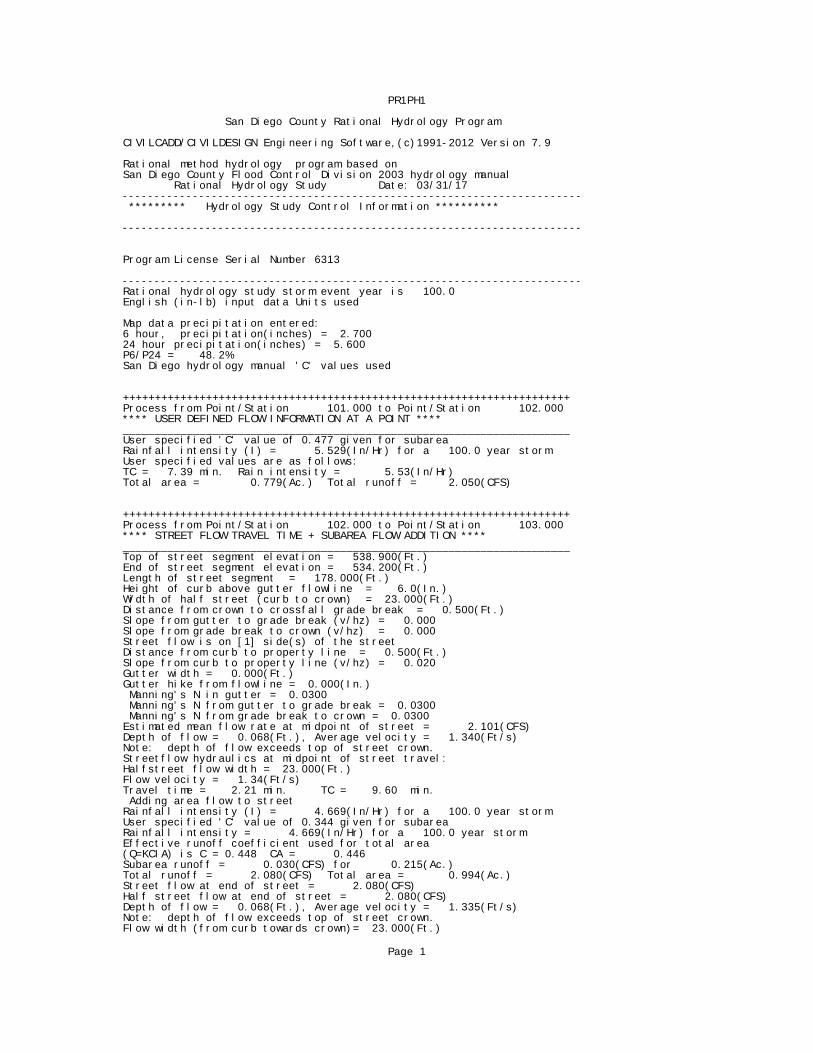
PR1PH1
San Diego County Rational Hydrology Program
CIVILCADD/CIVILDESIGN Engineering Software,(c)1991-2012 Version 7.9
Rational method hydrology program based on San Diego County Flood Control Division 2003 hydrology manual Rational Hydrology Study Date: 03/31/17 ------------------------------------------------------------------------ ********* Hydrology Study Control Information **********
------------------------------------------------------------------------
Program License Serial Number 6313
------------------------------------------------------------------------ Rational hydrology study storm event year is 100.0 English (in-lb) input data Units used
Map data precipitation entered: 6 hour, precipitation(inches) = 2.700 24 hour precipitation(inches) = 5.600 P6/P24 = 48.2% San Diego hydrology manual 'C' values used
++++++++++++++++++++++++++++++++++++++++++++++++++++++++++++++++++++++ Process from Point/Station 101.000 to Point/Station 102.000 **** USER DEFINED FLOW INFORMATION AT A POINT **** ______________________________________________________________________ User specified 'C' value of 0.477 given for subarea Rainfall intensity (I) = 5.529(In/Hr) for a 100.0 year storm User specified values are as follows: TC = 7.39 min. Rain intensity = 5.53(In/Hr) Total area = 0.779(Ac.) Total runoff = 2.050(CFS)
++++++++++++++++++++++++++++++++++++++++++++++++++++++++++++++++++++++ Process from Point/Station 102.000 to Point/Station 103.000 **** STREET FLOW TRAVEL TIME + SUBAREA FLOW ADDITION **** ______________________________________________________________________ Top of street segment elevation = 538.900(Ft.) End of street segment elevation = 534.200(Ft.) Length of street segment = 178.000(Ft.) Height of curb above gutter flowline = 6.0(In.) Width of half street (curb to crown) = 23.000(Ft.) Distance from crown to crossfall grade break = 0.500(Ft.) Slope from gutter to grade break (v/hz) = 0.000 Slope from grade break to crown (v/hz) = 0.000 Street flow is on [1] side(s) of the street Distance from curb to property line = 0.500(Ft.) Slope from curb to property line (v/hz) = 0.020 Gutter width = 0.000(Ft.) Gutter hike from flowline = 0.000(In.) Manning's N in gutter = 0.0300 Manning's N from gutter to grade break = 0.0300 Manning's N from grade break to crown = 0.0300 Estimated mean flow rate at midpoint of street = 2.101(CFS) Depth of flow = 0.068(Ft.), Average velocity = 1.340(Ft/s) Note: depth of flow exceeds top of street crown. Streetflow hydraulics at midpoint of street travel: Halfstreet flow width = 23.000(Ft.) Flow velocity = 1.34(Ft/s) Travel time = 2.21 min. TC = 9.60 min. Adding area flow to street Rainfall intensity (I) = 4.669(In/Hr) for a 100.0 year storm User specified 'C' value of 0.344 given for subarea Rainfall intensity = 4.669(In/Hr) for a 100.0 year storm Effective runoff coefficient used for total area (Q=KCIA) is C = 0.448 CA = 0.446 Subarea runoff = 0.030(CFS) for 0.215(Ac.) Total runoff = 2.080(CFS) Total area = 0.994(Ac.) Street flow at end of street = 2.080(CFS) Half street flow at end of street = 2.080(CFS) Depth of flow = 0.068(Ft.), Average velocity = 1.335(Ft/s) Note: depth of flow exceeds top of street crown. Flow width (from curb towards crown)= 23.000(Ft.)
Page 1

PR1PH1
++++++++++++++++++++++++++++++++++++++++++++++++++++++++++++++++++++++ Process from Point/Station 102.000 to Point/Station 103.000 **** CONFLUENCE OF MAIN STREAMS **** ______________________________________________________________________ The following data inside Main Stream is listed: In Main Stream number: 1 Stream flow area = 0.994(Ac.) Runoff from this stream = 2.080(CFS) Time of concentration = 9.60 min. Rainfall intensity = 4.669(In/Hr) Program is now starting with Main Stream No. 2
++++++++++++++++++++++++++++++++++++++++++++++++++++++++++++++++++++++ Process from Point/Station 104.000 to Point/Station 103.000 **** USER DEFINED FLOW INFORMATION AT A POINT **** ______________________________________________________________________ User specified 'C' value of 0.389 given for subarea Rainfall intensity (I) = 4.148(In/Hr) for a 100.0 year storm User specified values are as follows: TC = 11.54 min. Rain intensity = 4.15(In/Hr) Total area = 0.537(Ac.) Total runoff = 0.870(CFS)
++++++++++++++++++++++++++++++++++++++++++++++++++++++++++++++++++++++ Process from Point/Station 105.000 to Point/Station 103.000 **** CONFLUENCE OF MAIN STREAMS **** ______________________________________________________________________ The following data inside Main Stream is listed: In Main Stream number: 2 Stream flow area = 0.537(Ac.) Runoff from this stream = 0.870(CFS) Time of concentration = 11.54 min. Rainfall intensity = 4.148(In/Hr) Program is now starting with Main Stream No. 3
++++++++++++++++++++++++++++++++++++++++++++++++++++++++++++++++++++++ Process from Point/Station 105.000 to Point/Station 103.000 **** USER DEFINED FLOW INFORMATION AT A POINT **** ______________________________________________________________________ User specified 'C' value of 0.402 given for subarea Rainfall intensity (I) = 4.506(In/Hr) for a 100.0 year storm User specified values are as follows: TC = 10.15 min. Rain intensity = 4.51(In/Hr) Total area = 0.187(Ac.) Total runoff = 0.340(CFS)
++++++++++++++++++++++++++++++++++++++++++++++++++++++++++++++++++++++ Process from Point/Station 105.000 to Point/Station 103.000 **** CONFLUENCE OF MAIN STREAMS **** ______________________________________________________________________ The following data inside Main Stream is listed: In Main Stream number: 3 Stream flow area = 0.187(Ac.) Runoff from this stream = 0.340(CFS) Time of concentration = 10.15 min. Rainfall intensity = 4.506(In/Hr) Summary of stream data:
Stream Flow rate TC Rainfall Intensity No. (CFS) (min) (In/Hr)
1 2.080 9.60 4.669 2 0.870 11.54 4.148 3 0.340 10.15 4.506 Qmax(1) = 1.000 * 1.000 * 2.080) + 1.000 * 0.832 * 0.870) + 1.000 * 0.946 * 0.340) + = 3.126 Qmax(2) = 0.888 * 1.000 * 2.080) + 1.000 * 1.000 * 0.870) + 0.921 * 1.000 * 0.340) + = 3.031 Qmax(3) = 0.965 * 1.000 * 2.080) + 1.000 * 0.880 * 0.870) +
Page 2

PR1PH1 1.000 * 1.000 * 0.340) + = 3.113
Total of 3 main streams to confluence: Flow rates before confluence point: 2.080 0.870 0.340 Maximum flow rates at confluence using above data: 3.126 3.031 3.113 Area of streams before confluence: 0.994 0.537 0.187
Results of confluence: Total flow rate = 3.126(CFS) Time of concentration = 9.604 min. Effective stream area after confluence = 1.718(Ac.) End of computations, total study area = 1.718 (Ac.)
Page 3

PHASE 2
AREA CALCULATIONS
PROPOSED HYDROLOGIC BASINS
Basin Soil Type Pervious Total Total Natural Impervious Landscape Pervious % C Value % Fraction C Value C ValueRunoff Area Area Pavers Impervious Weighted of Site Fraction Final
Coefficient SF Acres SF SF SF SF
OFF-1 A 0.20 0 0.000 0 0 0 0 - 0.20 0% 0.00 - B 0.25 0 0.000 0 0 0 0 - 0.25 0% 0.00 - C 0.30 4,065 0.093 4,065 0 0 0 - 0.30 36% 0.11 - D 0.35 7,359 0.169 7,359 0 0 0 - 0.35 64% 0.23 -
Total - 11,424 0.262 11,424 0 0 0 0.00% - 100% 0.33 0.332
Basin Soil Type Pervious Total Total Natural Impervious Landscape Pervious % C Value % Fraction C Value C ValueRunoff Area Area Pavers Impervious Weighted of Site Fraction Final
Coefficient SF Acres SF SF SF SF
PR-1A A 0.20 0 0.000 0 0 0 0 - 0.05 0% 0.00 - B 0.25 0 0.000 0 0 0 0 - 0.06 0% 0.00 - C 0.30 4,473 0.103 0 2,079 2,394 0 - 0.07 29% 0.02 - D 0.35 10,999 0.253 0 9,857 1,142 0 - 0.08 71% 0.06 -
Total - 15,472 0.355 0 11,936 3,536 0 77.15% - 100% 0.08 0.771
Basin Soil Type Pervious Total Total Natural Impervious Landscape Pervious % C Value % Fraction C Value C ValueRunoff Area Area Pavers Impervious Weighted of Site Fraction Final
Coefficient SF Acres SF SF SF SF
PR-1B A 0.20 0 0.000 0 0 0 0 - 0.03 0% 0.00 - B 0.25 0 0.000 0 0 0 0 - 0.04 0% 0.00 - C 0.30 3,875 0.089 0 1,591 2,284 0 - 0.04 13% 0.01 - D 0.35 25,479 0.585 0 23,533 1,946 0 - 0.05 87% 0.04 -
Total - 29,354 0.674 0 25,124 4,230 0 85.59% - 100% 0.05 0.820
Basin Soil Type Pervious Total Total Natural Impervious Landscape Pervious % C Value % Fraction C Value C ValueRunoff Area Area Pavers Impervious Weighted of Site Fraction Final
Coefficient SF Acres SF SF SF SF
PR-1C A 0.20 0 0.000 0 0 0 0 - 0.04 0% 0.00 - B 0.25 0 0.000 0 0 0 0 - 0.05 0% 0.00 - C 0.30 0 0.000 0 0 0 0 - 0.06 0% 0.00 - D 0.35 19,703 0.452 0 15,497 4,206 0 - 0.07 100% 0.07 -
Total - 19,703 0.452 0 15,497 4,206 0 78.65% - 100% 0.07 0.783
Basin Soil Type Pervious Total Total Natural Impervious Landscape Pervious % C Value % Fraction C Value C ValueRunoff Area Area Pavers Impervious Weighted of Site Fraction Final
Coefficient SF Acres SF SF SF SF
PR-1D A 0.20 0 0.000 0 0 0 0 - 0.09 0% 0.00 - B 0.25 0 0.000 0 0 0 0 - 0.11 0% 0.00 - C 0.30 0 0.000 0 0 0 0 - 0.13 0% 0.00 - D 0.35 10,366 0.238 0 5,851 4,515 0 - 0.15 100% 0.15 -
Total - 10,366 0.238 0 5,851 4,515 0 56.44% - 100% 0.15 0.660

Time of Concentration CalculationsOverland Flow Method
Land Use =C = 0.33
Dist. = 206.00 ft.slope = 3.640 %
*Tc = 12.90 min.* Minimum Tc = 5 MinutesNatural Watershed (Kirpich)
L = 0 ftDE = 0 ft
**Tc = #DIV/0! min.** Minimum Tc = 10 Minutes
Basin Intensity Calculations100 year
P6 = 2.7 in. P6 must be withinP24 = 5.6 in. 45% to 65% of P24.
P6 / P24 = 48% Adjust P6 as needed.Adjusted P6= 2.70 in.
Tc (D) = 12.90 min.I = 3.86 in/hr
Basin Flow CalculationsQ = 0.34 cfsC = 0.33I = 3.86 in/hrA = 0.262 ac.
PR-OFF1Proposed Conditions
Selected Frequency,
3.86
0.1
1.0
10.0
1 10 100 1000
3
1.18.1
sDCTC
645.0644.7 DPI
AICQ
385.039.11
E
LT C
1201D - basin calcs Intensity-Duration Design Chart PROFF1 PH2

Time of Concentration CalculationsOverland Flow Method
Land Use =C = 0.77
Dist. = 193.00 ft.slope = 1.300 %
*Tc = 7.54 min.* Minimum Tc = 5 MinutesNatural Watershed (Kirpich)
L = 0 ftDE = 0 ft
**Tc = #DIV/0! min.** Minimum Tc = 10 Minutes
Basin Intensity Calculations100 year
P6 = 2.7 in. P6 must be withinP24 = 5.6 in. 45% to 65% of P24.
P6 / P24 = 48% Adjust P6 as needed.Adjusted P6= 2.70 in.
Tc (D) = 7.54 min.I = 5.46 in/hr
Basin Flow CalculationsQ = 1.49 cfsC = 0.77I = 5.46 in/hrA = 0.355 ac.
PR-1AProposed Conditions
Selected Frequency,
5.46
0.1
1.0
10.0
1 10 100 1000
3
1.18.1
sDCTC
645.0644.7 DPI
AICQ
385.039.11
E
LT C
1201D - basin calcs Intensity-Duration Design Chart PR1A PH2
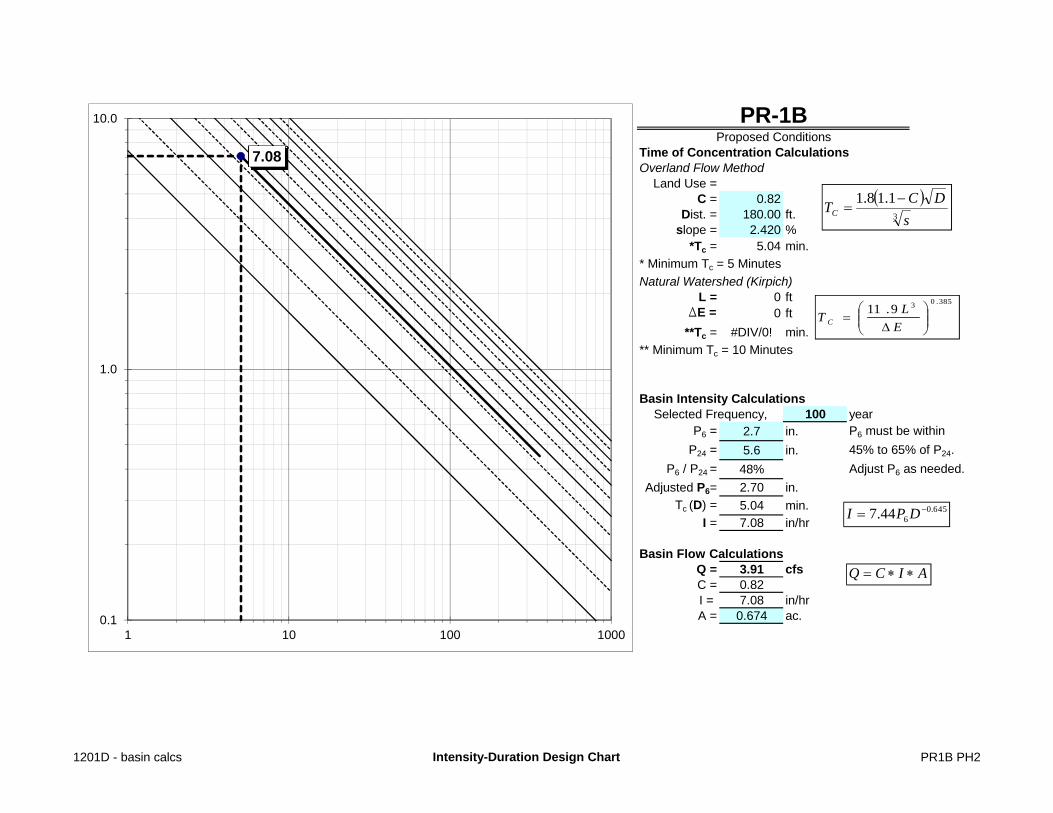
Time of Concentration CalculationsOverland Flow Method
Land Use =C = 0.82
Dist. = 180.00 ft.slope = 2.420 %
*Tc = 5.04 min.* Minimum Tc = 5 MinutesNatural Watershed (Kirpich)
L = 0 ftDE = 0 ft
**Tc = #DIV/0! min.** Minimum Tc = 10 Minutes
Basin Intensity Calculations100 year
P6 = 2.7 in. P6 must be withinP24 = 5.6 in. 45% to 65% of P24.
P6 / P24 = 48% Adjust P6 as needed.Adjusted P6= 2.70 in.
Tc (D) = 5.04 min.I = 7.08 in/hr
Basin Flow CalculationsQ = 3.91 cfsC = 0.82I = 7.08 in/hrA = 0.674 ac.
PR-1BProposed Conditions
Selected Frequency,
7.08
0.1
1.0
10.0
1 10 100 1000
3
1.18.1
sDCTC
645.0644.7 DPI
AICQ
385.039.11
E
LT C
1201D - basin calcs Intensity-Duration Design Chart PR1B PH2
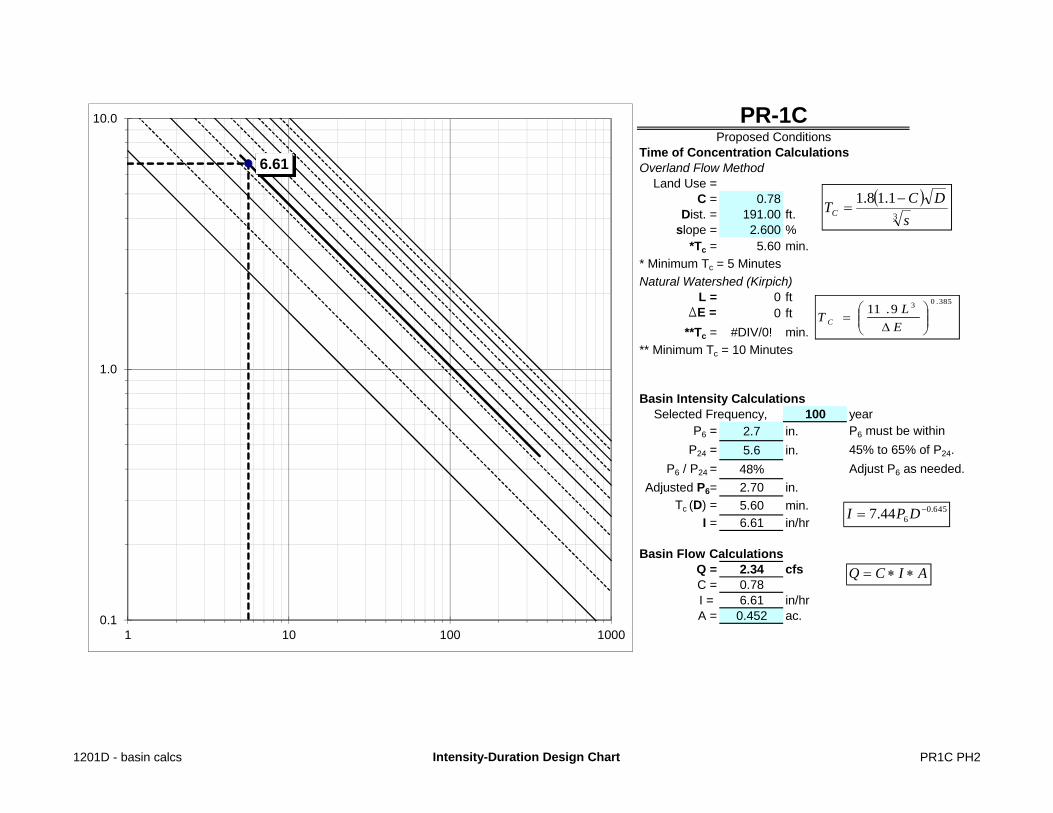
Time of Concentration CalculationsOverland Flow Method
Land Use =C = 0.78
Dist. = 191.00 ft.slope = 2.600 %
*Tc = 5.60 min.* Minimum Tc = 5 MinutesNatural Watershed (Kirpich)
L = 0 ftDE = 0 ft
**Tc = #DIV/0! min.** Minimum Tc = 10 Minutes
Basin Intensity Calculations100 year
P6 = 2.7 in. P6 must be withinP24 = 5.6 in. 45% to 65% of P24.
P6 / P24 = 48% Adjust P6 as needed.Adjusted P6= 2.70 in.
Tc (D) = 5.60 min.I = 6.61 in/hr
Basin Flow CalculationsQ = 2.34 cfsC = 0.78I = 6.61 in/hrA = 0.452 ac.
PR-1CProposed Conditions
Selected Frequency,
6.61
0.1
1.0
10.0
1 10 100 1000
3
1.18.1
sDCTC
645.0644.7 DPI
AICQ
385.039.11
E
LT C
1201D - basin calcs Intensity-Duration Design Chart PR1C PH2

Time of Concentration CalculationsOverland Flow Method
Land Use =C = 0.66
Dist. = 173.00 ft.slope = 2.100 %
*Tc = 18.87 min.* Minimum Tc = 5 MinutesNatural Watershed (Kirpich)
L = 0 ftDE = 0 ft
**Tc = #DIV/0! min.** Minimum Tc = 10 Minutes
Basin Intensity Calculations100 year
P6 = 2.7 in. P6 must be withinP24 = 5.6 in. 45% to 65% of P24.
P6 / P24 = 48% Adjust P6 as needed.Adjusted P6= 2.70 in.
Tc (D) = 18.87 min.I = 3.02 in/hr
Basin Flow CalculationsQ = 0.28 cfsC = 0.35I = 3.02 in/hrA = 0.238 ac.
PR-1DProposed Conditions
Selected Frequency,
3.02
0.1
1.0
10.0
1 10 100 1000
3
1.18.1
sDCTC
645.0644.7 DPI
AICQ
385.039.11
E
LT C
1201D - basin calcs Intensity-Duration Design Chart PR1D PH2
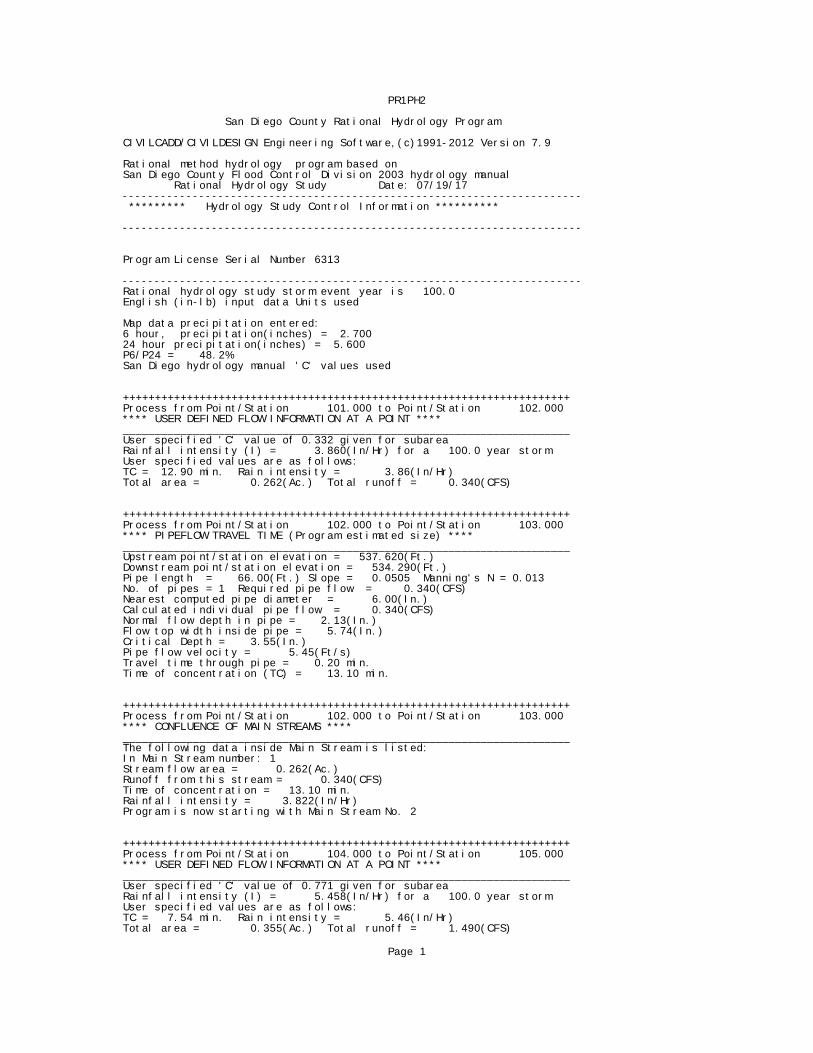
PR1PH2
San Diego County Rational Hydrology Program
CIVILCADD/CIVILDESIGN Engineering Software,(c)1991-2012 Version 7.9
Rational method hydrology program based on San Diego County Flood Control Division 2003 hydrology manual Rational Hydrology Study Date: 07/19/17 ------------------------------------------------------------------------ ********* Hydrology Study Control Information **********
------------------------------------------------------------------------
Program License Serial Number 6313
------------------------------------------------------------------------ Rational hydrology study storm event year is 100.0 English (in-lb) input data Units used
Map data precipitation entered: 6 hour, precipitation(inches) = 2.700 24 hour precipitation(inches) = 5.600 P6/P24 = 48.2% San Diego hydrology manual 'C' values used
++++++++++++++++++++++++++++++++++++++++++++++++++++++++++++++++++++++ Process from Point/Station 101.000 to Point/Station 102.000 **** USER DEFINED FLOW INFORMATION AT A POINT **** ______________________________________________________________________ User specified 'C' value of 0.332 given for subarea Rainfall intensity (I) = 3.860(In/Hr) for a 100.0 year storm User specified values are as follows: TC = 12.90 min. Rain intensity = 3.86(In/Hr) Total area = 0.262(Ac.) Total runoff = 0.340(CFS)
++++++++++++++++++++++++++++++++++++++++++++++++++++++++++++++++++++++ Process from Point/Station 102.000 to Point/Station 103.000 **** PIPEFLOW TRAVEL TIME (Program estimated size) **** ______________________________________________________________________ Upstream point/station elevation = 537.620(Ft.) Downstream point/station elevation = 534.290(Ft.) Pipe length = 66.00(Ft.) Slope = 0.0505 Manning's N = 0.013 No. of pipes = 1 Required pipe flow = 0.340(CFS) Nearest computed pipe diameter = 6.00(In.) Calculated individual pipe flow = 0.340(CFS) Normal flow depth in pipe = 2.13(In.) Flow top width inside pipe = 5.74(In.) Critical Depth = 3.55(In.) Pipe flow velocity = 5.45(Ft/s) Travel time through pipe = 0.20 min. Time of concentration (TC) = 13.10 min.
++++++++++++++++++++++++++++++++++++++++++++++++++++++++++++++++++++++ Process from Point/Station 102.000 to Point/Station 103.000 **** CONFLUENCE OF MAIN STREAMS **** ______________________________________________________________________ The following data inside Main Stream is listed: In Main Stream number: 1 Stream flow area = 0.262(Ac.) Runoff from this stream = 0.340(CFS) Time of concentration = 13.10 min. Rainfall intensity = 3.822(In/Hr) Program is now starting with Main Stream No. 2
++++++++++++++++++++++++++++++++++++++++++++++++++++++++++++++++++++++ Process from Point/Station 104.000 to Point/Station 105.000 **** USER DEFINED FLOW INFORMATION AT A POINT **** ______________________________________________________________________ User specified 'C' value of 0.771 given for subarea Rainfall intensity (I) = 5.458(In/Hr) for a 100.0 year storm User specified values are as follows: TC = 7.54 min. Rain intensity = 5.46(In/Hr) Total area = 0.355(Ac.) Total runoff = 1.490(CFS)
Page 1

PR1PH2
++++++++++++++++++++++++++++++++++++++++++++++++++++++++++++++++++++++ Process from Point/Station 105.000 to Point/Station 103.000 **** PIPEFLOW TRAVEL TIME (Program estimated size) **** ______________________________________________________________________ Upstream point/station elevation = 534.400(Ft.) Downstream point/station elevation = 534.290(Ft.) Pipe length = 8.00(Ft.) Slope = 0.0138 Manning's N = 0.013 No. of pipes = 1 Required pipe flow = 1.490(CFS) Nearest computed pipe diameter = 9.00(In.) Calculated individual pipe flow = 1.490(CFS) Normal flow depth in pipe = 5.91(In.) Flow top width inside pipe = 8.55(In.) Critical Depth = 6.74(In.) Pipe flow velocity = 4.84(Ft/s) Travel time through pipe = 0.03 min. Time of concentration (TC) = 7.57 min.
++++++++++++++++++++++++++++++++++++++++++++++++++++++++++++++++++++++ Process from Point/Station 105.000 to Point/Station 103.000 **** CONFLUENCE OF MAIN STREAMS **** ______________________________________________________________________ The following data inside Main Stream is listed: In Main Stream number: 2 Stream flow area = 0.355(Ac.) Runoff from this stream = 1.490(CFS) Time of concentration = 7.57 min. Rainfall intensity = 5.445(In/Hr) Summary of stream data:
Stream Flow rate TC Rainfall Intensity No. (CFS) (min) (In/Hr)
1 0.340 13.10 3.822 2 1.490 7.57 5.445 Qmax(1) = 1.000 * 1.000 * 0.340) + 0.702 * 1.000 * 1.490) + = 1.386 Qmax(2) = 1.000 * 0.578 * 0.340) + 1.000 * 1.000 * 1.490) + = 1.686
Total of 2 main streams to confluence: Flow rates before confluence point: 0.340 1.490 Maximum flow rates at confluence using above data: 1.386 1.686 Area of streams before confluence: 0.262 0.355
Results of confluence: Total flow rate = 1.686(CFS) Time of concentration = 7.568 min. Effective stream area after confluence = 0.617(Ac.)
++++++++++++++++++++++++++++++++++++++++++++++++++++++++++++++++++++++ Process from Point/Station 103.000 to Point/Station 106.000 **** PIPEFLOW TRAVEL TIME (Program estimated size) **** ______________________________________________________________________ Upstream point/station elevation = 534.290(Ft.) Downstream point/station elevation = 530.250(Ft.) Pipe length = 218.00(Ft.) Slope = 0.0185 Manning's N = 0.013 No. of pipes = 1 Required pipe flow = 1.686(CFS) Nearest computed pipe diameter = 9.00(In.) Calculated individual pipe flow = 1.686(CFS) Normal flow depth in pipe = 5.81(In.) Flow top width inside pipe = 8.61(In.) Critical Depth = 7.16(In.) Pipe flow velocity = 5.59(Ft/s) Travel time through pipe = 0.65 min. Time of concentration (TC) = 8.22 min.
++++++++++++++++++++++++++++++++++++++++++++++++++++++++++++++++++++++ Process from Point/Station 103.000 to Point/Station 106.000
Page 2
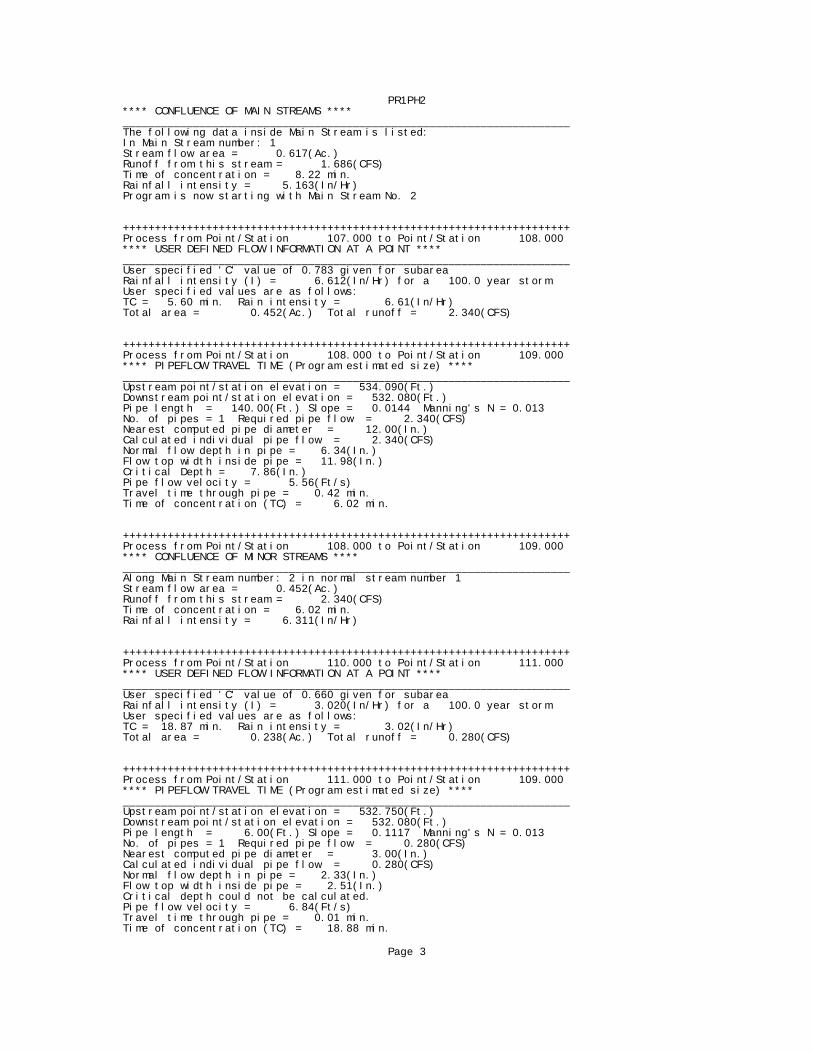
PR1PH2 **** CONFLUENCE OF MAIN STREAMS **** ______________________________________________________________________ The following data inside Main Stream is listed: In Main Stream number: 1 Stream flow area = 0.617(Ac.) Runoff from this stream = 1.686(CFS) Time of concentration = 8.22 min. Rainfall intensity = 5.163(In/Hr) Program is now starting with Main Stream No. 2
++++++++++++++++++++++++++++++++++++++++++++++++++++++++++++++++++++++ Process from Point/Station 107.000 to Point/Station 108.000 **** USER DEFINED FLOW INFORMATION AT A POINT **** ______________________________________________________________________ User specified 'C' value of 0.783 given for subarea Rainfall intensity (I) = 6.612(In/Hr) for a 100.0 year storm User specified values are as follows: TC = 5.60 min. Rain intensity = 6.61(In/Hr) Total area = 0.452(Ac.) Total runoff = 2.340(CFS)
++++++++++++++++++++++++++++++++++++++++++++++++++++++++++++++++++++++ Process from Point/Station 108.000 to Point/Station 109.000 **** PIPEFLOW TRAVEL TIME (Program estimated size) **** ______________________________________________________________________ Upstream point/station elevation = 534.090(Ft.) Downstream point/station elevation = 532.080(Ft.) Pipe length = 140.00(Ft.) Slope = 0.0144 Manning's N = 0.013 No. of pipes = 1 Required pipe flow = 2.340(CFS) Nearest computed pipe diameter = 12.00(In.) Calculated individual pipe flow = 2.340(CFS) Normal flow depth in pipe = 6.34(In.) Flow top width inside pipe = 11.98(In.) Critical Depth = 7.86(In.) Pipe flow velocity = 5.56(Ft/s) Travel time through pipe = 0.42 min. Time of concentration (TC) = 6.02 min.
++++++++++++++++++++++++++++++++++++++++++++++++++++++++++++++++++++++ Process from Point/Station 108.000 to Point/Station 109.000 **** CONFLUENCE OF MINOR STREAMS **** ______________________________________________________________________ Along Main Stream number: 2 in normal stream number 1 Stream flow area = 0.452(Ac.) Runoff from this stream = 2.340(CFS) Time of concentration = 6.02 min. Rainfall intensity = 6.311(In/Hr)
++++++++++++++++++++++++++++++++++++++++++++++++++++++++++++++++++++++ Process from Point/Station 110.000 to Point/Station 111.000 **** USER DEFINED FLOW INFORMATION AT A POINT **** ______________________________________________________________________ User specified 'C' value of 0.660 given for subarea Rainfall intensity (I) = 3.020(In/Hr) for a 100.0 year storm User specified values are as follows: TC = 18.87 min. Rain intensity = 3.02(In/Hr) Total area = 0.238(Ac.) Total runoff = 0.280(CFS)
++++++++++++++++++++++++++++++++++++++++++++++++++++++++++++++++++++++ Process from Point/Station 111.000 to Point/Station 109.000 **** PIPEFLOW TRAVEL TIME (Program estimated size) **** ______________________________________________________________________ Upstream point/station elevation = 532.750(Ft.) Downstream point/station elevation = 532.080(Ft.) Pipe length = 6.00(Ft.) Slope = 0.1117 Manning's N = 0.013 No. of pipes = 1 Required pipe flow = 0.280(CFS) Nearest computed pipe diameter = 3.00(In.) Calculated individual pipe flow = 0.280(CFS) Normal flow depth in pipe = 2.33(In.) Flow top width inside pipe = 2.51(In.) Critical depth could not be calculated. Pipe flow velocity = 6.84(Ft/s) Travel time through pipe = 0.01 min. Time of concentration (TC) = 18.88 min.
Page 3
PR1PH2
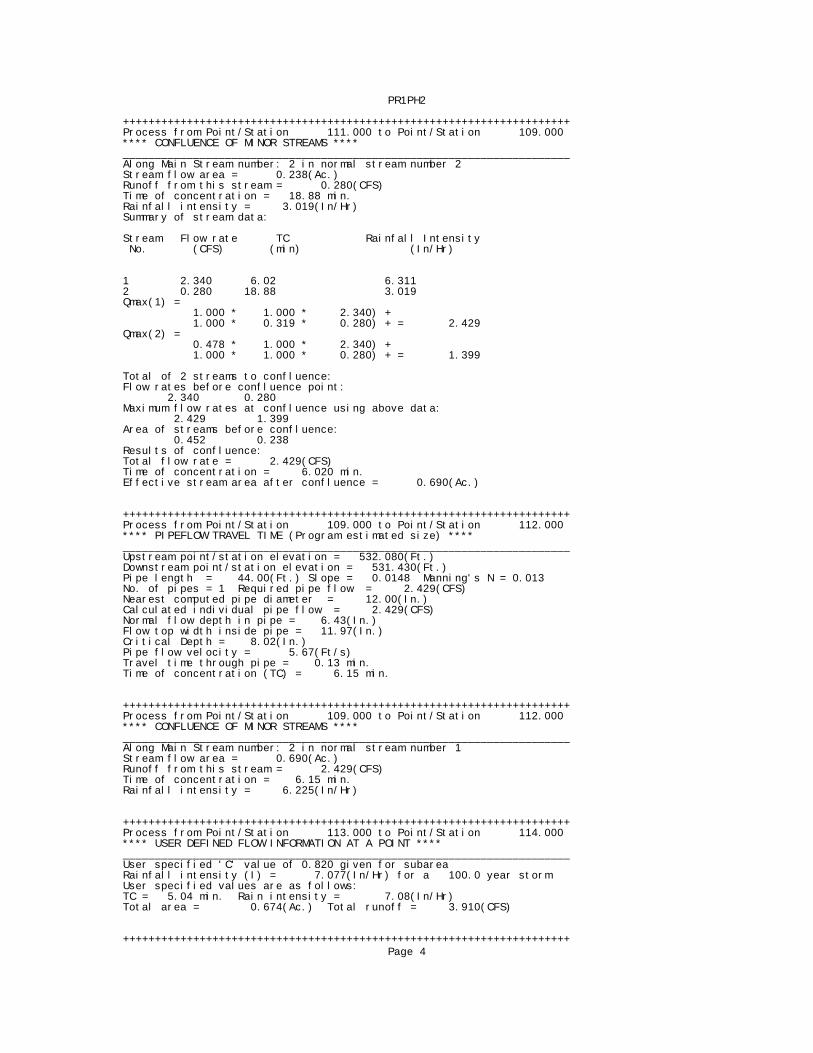
++++++++++++++++++++++++++++++++++++++++++++++++++++++++++++++++++++++ Process from Point/Station 111.000 to Point/Station 109.000 **** CONFLUENCE OF MINOR STREAMS **** ______________________________________________________________________ Along Main Stream number: 2 in normal stream number 2 Stream flow area = 0.238(Ac.) Runoff from this stream = 0.280(CFS) Time of concentration = 18.88 min. Rainfall intensity = 3.019(In/Hr) Summary of stream data:
Stream Flow rate TC Rainfall Intensity No. (CFS) (min) (In/Hr)
1 2.340 6.02 6.311 2 0.280 18.88 3.019 Qmax(1) = 1.000 * 1.000 * 2.340) + 1.000 * 0.319 * 0.280) + = 2.429 Qmax(2) = 0.478 * 1.000 * 2.340) + 1.000 * 1.000 * 0.280) + = 1.399
Total of 2 streams to confluence: Flow rates before confluence point: 2.340 0.280 Maximum flow rates at confluence using above data: 2.429 1.399 Area of streams before confluence: 0.452 0.238 Results of confluence: Total flow rate = 2.429(CFS) Time of concentration = 6.020 min. Effective stream area after confluence = 0.690(Ac.)
++++++++++++++++++++++++++++++++++++++++++++++++++++++++++++++++++++++ Process from Point/Station 109.000 to Point/Station 112.000 **** PIPEFLOW TRAVEL TIME (Program estimated size) **** ______________________________________________________________________ Upstream point/station elevation = 532.080(Ft.) Downstream point/station elevation = 531.430(Ft.) Pipe length = 44.00(Ft.) Slope = 0.0148 Manning's N = 0.013 No. of pipes = 1 Required pipe flow = 2.429(CFS) Nearest computed pipe diameter = 12.00(In.) Calculated individual pipe flow = 2.429(CFS) Normal flow depth in pipe = 6.43(In.) Flow top width inside pipe = 11.97(In.) Critical Depth = 8.02(In.) Pipe flow velocity = 5.67(Ft/s) Travel time through pipe = 0.13 min. Time of concentration (TC) = 6.15 min.
++++++++++++++++++++++++++++++++++++++++++++++++++++++++++++++++++++++ Process from Point/Station 109.000 to Point/Station 112.000 **** CONFLUENCE OF MINOR STREAMS **** ______________________________________________________________________ Along Main Stream number: 2 in normal stream number 1 Stream flow area = 0.690(Ac.) Runoff from this stream = 2.429(CFS) Time of concentration = 6.15 min. Rainfall intensity = 6.225(In/Hr)
++++++++++++++++++++++++++++++++++++++++++++++++++++++++++++++++++++++ Process from Point/Station 113.000 to Point/Station 114.000 **** USER DEFINED FLOW INFORMATION AT A POINT **** ______________________________________________________________________ User specified 'C' value of 0.820 given for subarea Rainfall intensity (I) = 7.077(In/Hr) for a 100.0 year storm User specified values are as follows: TC = 5.04 min. Rain intensity = 7.08(In/Hr) Total area = 0.674(Ac.) Total runoff = 3.910(CFS)
++++++++++++++++++++++++++++++++++++++++++++++++++++++++++++++++++++++Page 4
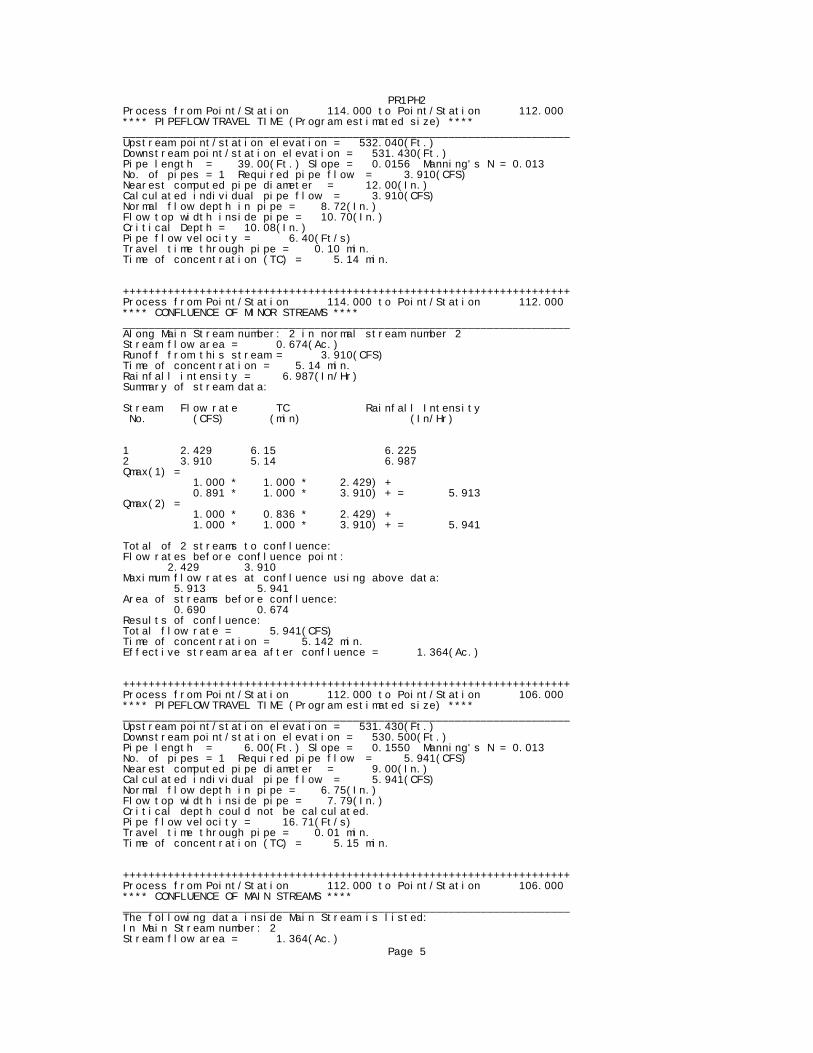
PR1PH2 Process from Point/Station 114.000 to Point/Station 112.000 **** PIPEFLOW TRAVEL TIME (Program estimated size) **** ______________________________________________________________________ Upstream point/station elevation = 532.040(Ft.) Downstream point/station elevation = 531.430(Ft.) Pipe length = 39.00(Ft.) Slope = 0.0156 Manning's N = 0.013 No. of pipes = 1 Required pipe flow = 3.910(CFS) Nearest computed pipe diameter = 12.00(In.) Calculated individual pipe flow = 3.910(CFS) Normal flow depth in pipe = 8.72(In.) Flow top width inside pipe = 10.70(In.) Critical Depth = 10.08(In.) Pipe flow velocity = 6.40(Ft/s) Travel time through pipe = 0.10 min. Time of concentration (TC) = 5.14 min.
++++++++++++++++++++++++++++++++++++++++++++++++++++++++++++++++++++++ Process from Point/Station 114.000 to Point/Station 112.000 **** CONFLUENCE OF MINOR STREAMS **** ______________________________________________________________________ Along Main Stream number: 2 in normal stream number 2 Stream flow area = 0.674(Ac.) Runoff from this stream = 3.910(CFS) Time of concentration = 5.14 min. Rainfall intensity = 6.987(In/Hr) Summary of stream data:
Stream Flow rate TC Rainfall Intensity No. (CFS) (min) (In/Hr)
1 2.429 6.15 6.225 2 3.910 5.14 6.987 Qmax(1) = 1.000 * 1.000 * 2.429) + 0.891 * 1.000 * 3.910) + = 5.913 Qmax(2) = 1.000 * 0.836 * 2.429) + 1.000 * 1.000 * 3.910) + = 5.941
Total of 2 streams to confluence: Flow rates before confluence point: 2.429 3.910 Maximum flow rates at confluence using above data: 5.913 5.941 Area of streams before confluence: 0.690 0.674 Results of confluence: Total flow rate = 5.941(CFS) Time of concentration = 5.142 min. Effective stream area after confluence = 1.364(Ac.)
++++++++++++++++++++++++++++++++++++++++++++++++++++++++++++++++++++++ Process from Point/Station 112.000 to Point/Station 106.000 **** PIPEFLOW TRAVEL TIME (Program estimated size) **** ______________________________________________________________________ Upstream point/station elevation = 531.430(Ft.) Downstream point/station elevation = 530.500(Ft.) Pipe length = 6.00(Ft.) Slope = 0.1550 Manning's N = 0.013 No. of pipes = 1 Required pipe flow = 5.941(CFS) Nearest computed pipe diameter = 9.00(In.) Calculated individual pipe flow = 5.941(CFS) Normal flow depth in pipe = 6.75(In.) Flow top width inside pipe = 7.79(In.) Critical depth could not be calculated. Pipe flow velocity = 16.71(Ft/s) Travel time through pipe = 0.01 min. Time of concentration (TC) = 5.15 min.
++++++++++++++++++++++++++++++++++++++++++++++++++++++++++++++++++++++ Process from Point/Station 112.000 to Point/Station 106.000 **** CONFLUENCE OF MAIN STREAMS **** ______________________________________________________________________ The following data inside Main Stream is listed: In Main Stream number: 2 Stream flow area = 1.364(Ac.)
Page 5
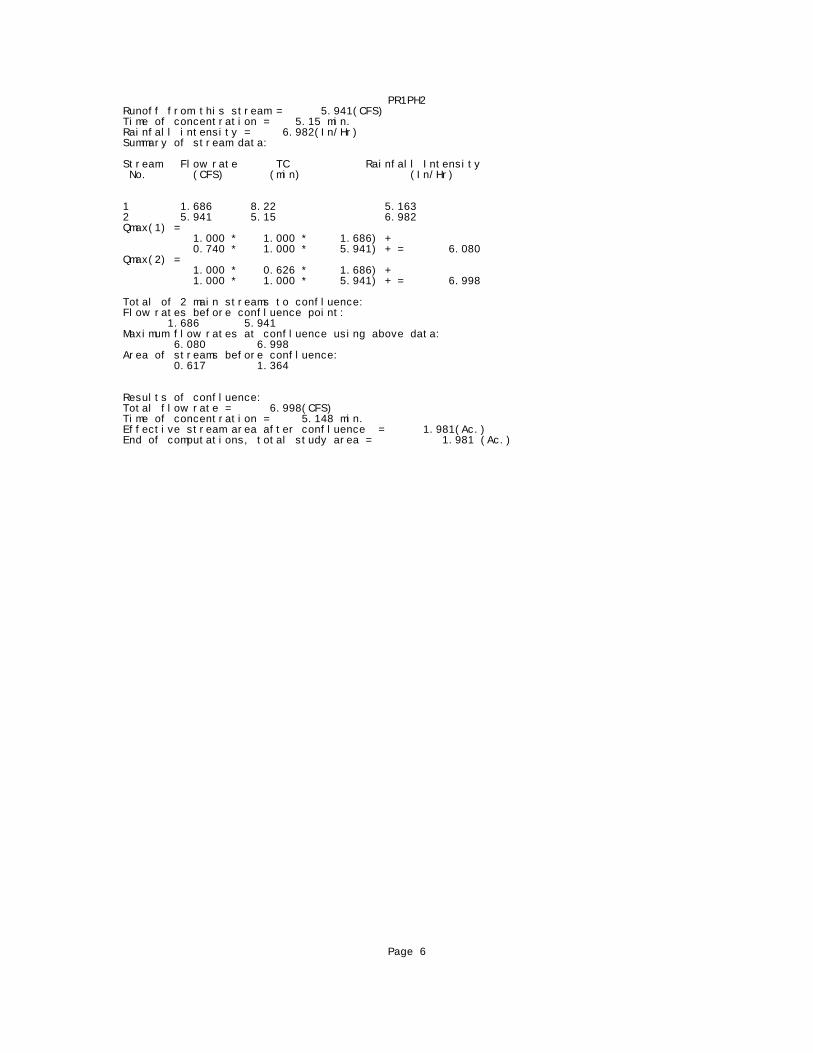
PR1PH2 Runoff from this stream = 5.941(CFS) Time of concentration = 5.15 min. Rainfall intensity = 6.982(In/Hr) Summary of stream data:
Stream Flow rate TC Rainfall Intensity No. (CFS) (min) (In/Hr)
1 1.686 8.22 5.163 2 5.941 5.15 6.982 Qmax(1) = 1.000 * 1.000 * 1.686) + 0.740 * 1.000 * 5.941) + = 6.080 Qmax(2) = 1.000 * 0.626 * 1.686) + 1.000 * 1.000 * 5.941) + = 6.998
Total of 2 main streams to confluence: Flow rates before confluence point: 1.686 5.941 Maximum flow rates at confluence using above data: 6.080 6.998 Area of streams before confluence: 0.617 1.364
Results of confluence: Total flow rate = 6.998(CFS) Time of concentration = 5.148 min. Effective stream area after confluence = 1.981(Ac.) End of computations, total study area = 1.981 (Ac.)
Page 6
ATTACHMENT 5
HYDROLOGY MAP - EXISTING CONDITIONS

●
ATTACHMENT 6
HYDROLOGY MAP - PROPOSED CONDITIONS

PHASE 1
●

PHASE 2
●
Attachment 7 Geotechnical and Groundwater Investigation Report

PRIORITY DEVELOPMENT PROJECT (PDP) SWQMP 41 of 42
Template Date: March 16, 2016 Preparation Date: 4-11-17 LUEG:SW PDP SWQMP - Attachments
ATTACHMENT 7
Copy of Project's Geotechnical and Groundwater Investigation Report
This is the cover sheet for Attachment 7. If hardcopy or CD is not attached, the following information should be provided: Title: Prepared By: Date:

PRIORITY DEVELOPMENT PROJECT (PDP) SWQMP 42 of 42
Template Date: March 16, 2016 Preparation Date: 4-11-17 LUEG:SW PDP SWQMP - Attachments
This page was left intentionally blank.

LIMITED GEOTECHNICAL EVALUATION OF STORM WATER
INFILTRATION FEASIBILITY
SAINT GREGORY OF NYASSA GREEK ORTHODOX CHURCH
1454 JAMACHA ROAD
EL CAJON, SAN DIEGO COUNTY, CALIFORNIA 92019
ASSESSOR’S PARCEL NUMBER (APN) 498-320-56-00
FOR
SAINT GREGORY OF NYASSA GREEK ORTHODOX CHURCH
1454 JAMACHA ROAD
EL CAJON, CALIFORNIA 92019
W.O. 7220-A-SC JANUARY 10, 2017

Geotechnical C Geologic C Coastal C Environmental
5741 Palmer Way C Carlsbad, California 92010 C (760) 438-3155 C FAX (760) 931-0915 C www.geosoilsinc.com
January 10, 2017W.O. 7220-A-SC
Saint Gregory of Nyassa Greek Orthodox Church1454 Jamacha RoadEl Cajon, California 92019
Attention: Mr. Peter Shenas
Subject: Limited Geotechnical Evaluation of Storm Water Infiltration Feasibility,Saint Gregory of Nyassa Greek Orthodox Church, 1454 Jamacha Road,El Cajon, San Diego County, California 92019, APN 498-320-56-00
Dear Mr. Shenas:
In accordance with your request and authorization, GeoSoils, Inc. (GSI) is providing thissummary of our limited geotechnical evaluation of storm water infiltration feasibility at thesubject site. The purpose of our study was to evaluate the onsite geologic andgeotechnical conditions relative to the feasibility of storm water infiltration for permanentstorm water best management practices (BMPs).
SCOPE OF SERVICES
The scope of services performed for this study included:
• A review of in-house geologic maps and literature, and readily available soils,groundwater, and environmental data for the subject site and near-vicinity, includingUnited States Department of Agriculture - Natural Resources Conservation Service(USDA-NRCS) soils infiltration data.
• Analysis of information collected; and
• The preparation of this summary report.
SITE CONDITIONS
The subject site consists of a roughly rectangular-shaped parcel of land located at1454 Jamacha Road in El Cajon, San Diego County, California (see Figure 1, Site LocationMap). The property is bounded by Jamacha Road (State Route 54) to the east, by existingresidential development to the north, by relatively vacant land to the west, and by existingcommercial/retail development and a nursery/landscape retailer to the south.Topographically, the site is relatively flat-lying to gently sloping to the south.
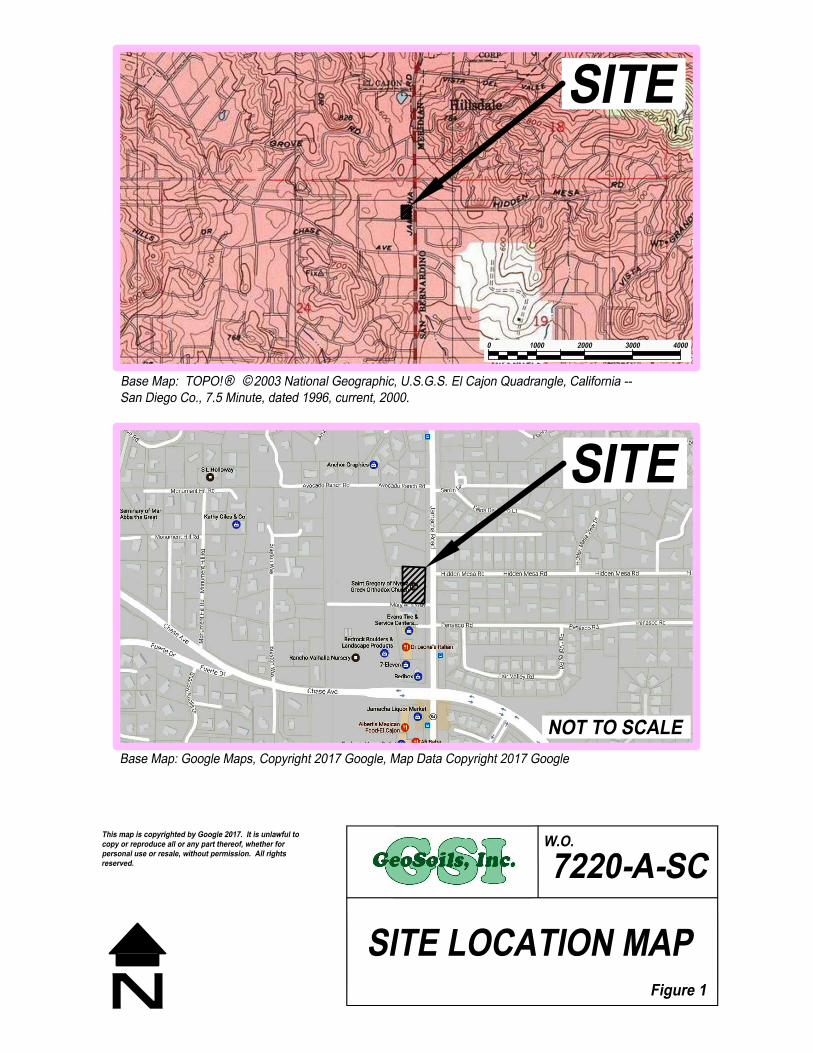

GeoSoils, Inc.
Saint Gregory of Nyassa Greek Orthodox Church W.O. 7220-A-SC
APN 498-320-56-00 January 10, 2016
File:e:\wp12\7200\7220a.lge Page 3
The property is located near the axis of a low relief, southerly-flowing natural drainage;considered a tributary within the Sweetwater River watershed. According to Google Earthsatellite imagery, site elevations range between approximately 534 and 545 feet(unknown datum), for an overall relief of about 11 feet. With the exception of a relativelynewly constructed church building and associated Portland Cement Concrete (PCC)flatwork, near the northwesterly property corner, the site is relatively undeveloped.Site drainage appears to be controlled by sheet-flow runoff, directed to the south.Site vegetation consists of sparse trees and shrubbery.
SITE GEOLOGIC/LITHOLOGIC CONDITIONS
According to regional geologic mapping by Tan (2002), the subject site is underlain byCretaceous-age plutonic bedrock, consisting of medium-grained, severely weatheredtonalite with lesser granodiorite and quartz diorite composition. Based on geomorphology,GSI surmises that the bedrock is mantled by undifferentiated, stream-deposited alluviumand colluvium (topsoil), and locally by artificial fill. Our experience has shown that similarplutonic bedrock has low hydraulic conductivity and is typically a limiting factor in regardto storm water infiltration feasibility.
SOILS
According to soil survey mapping by the United States Department of Agriculture - NaturalResources Conservation Service (USDA-NRCS), the westerly, approximately two-thirds ofthe site is mantled by soils belonging to the Placentia sandy loam, 2 to 9 percent slopes.Whereas, the easterly, approximately one-third of the site is mantled by the Ramona sandyloam, 2 to 5 percent slopes. The USDA-NRCS indicates that the infiltration rate of the mostlimiting layer, within the Placentia sandy loam, 2 to 9 percent slopes, ranges from 0.0 to0.06 inches per hour (in/hr). The USDA-NRCS reports that the infiltration rate of the mostlimiting layer, within the Ramona sandy loam, 2 to 5 percent slopes, varies from 0.20 to0.57 in/hr. Thus, the USDA-NRCS assigns the Placentia sandy loam, 2 to 9 percent slopesto Hydrologic Soil Group (HSG) “D,” and the Ramona sandy loam, 2 to 5 percent slopesto HSG “C.” Such soil conditions, suggest that infiltration for permanent storm water BMPsat the subject site is typically infeasible.
GROUNDWATER
According to the State of California Department of Water Resources ([CDWR],1967),groundwater was measured and inferred at depths less than 25 feet below the surface inthe general site vicinity. A review of an environmental study, performed at2249 Jamacha Road, El Cajon, California by Avocet Environmental, Inc. ([AEI], 2013),indicated groundwater depths ranging between 25 and 35 feet below the surface of thatproperty. It is the opinion of GSI that the groundwater conditions described by
GeoSoils, Inc.
Saint Gregory of Nyassa Greek Orthodox Church W.O. 7220-A-SC
APN 498-320-56-00 January 10, 2016
File:e:\wp12\7200\7220a.lge Page 4
CDWR (1967) and AEI (2013) are consistent with a perched water table; whereby, thegroundwater is resting or perched upon relatively fresh (i.e., less weathered), impermeablebedrock, or contained in fractures, and is not the regional groundwater table (typically notpresent in crystalline plutonic rock). GSI estimates that the elevation of the regionalgroundwater table is roughly consistent with sea level.
The subject site is located within the Hillsdale Hydrologic Subarea of theMiddle Sweetwater Hydrologic Area of the Sweetwater Hydrologic Unit. According to theCalifornia Regional Water Quality Control Board - San Diego Region (1994), beneficialgroundwater use within the Middle Sweetwater Hydrologic Area include municipal anddomestic supply, agricultural supply, and industrial service supply. Thus, if shallowgroundwater conditions do exist at the property, as reported in CDWR (1967) andAEI (2013), insufficient vertical separation, between the permanent storm water BMP andthe groundwater table could lead to groundwater contamination because of inadequatefiltering of potential contaminants.
ADDITIONAL GEOTECHNICAL CONCERNS
Expansive Soils
Although the scope of this study did not include an evaluation of expansive soils, within thesubject property, it is well documented that residual soils, formed through weathering andalteration of plutonic bedrock, can be detrimentally expansive. The shrink/swell effects ofexpansive soils can damage improvements such as foundations, slab-on-grade floors,pavements, walls, etc. The introduction of infiltrated storm water, if not properly contained,could initiate swelling of expansive soils, especially during the wet season.Conversely, during the dry season, when storm water infiltration would be of limitedvolume, the drying of expansive soils would lead to shrinking effects. Cyclical shrinkingand swelling soils may have damaging repercussions to existing improvements and futureimprovements.
Perched Water Conditions
As previously indicated, the dense nature of plutonic bedrock, shown to underlie thesubject site (Tan, 2002), is not conducive to infiltration. Thus, infiltrated storm water wouldmost likely perch upon the bedrock and begin to mound and migrate laterally, potentiallyadversely affecting onsite improvements as well as existing improvements on adjoiningproperties.

GeoSoils, Inc.
Saint Gregory of Nyassa Greek Orthodox Church W.O. 7220-A-SC
APN 498-320-56-00 January 10, 2016
File:e:\wp12\7200\7220a.lge Page 5
Underground Utilities
Given the likelihood for perched water conditions to develop in the event of storm waterinfiltration, perched water entering into underground utility trenches has the potential toinduce settlement of backfill, lead to the migration of fines into open-graded gravels usedin the pipe zone (i.e., piping), and cause corrosion of any metal components used inunderground utility construction.
CONCLUSIONS
Owing to the above-described factors and concerns, the site is not well suited for stormwater infiltration for permanent storm water BMPs; and therefore, is not recommended froma geotechnical perspective, owing to the likelihood of potential adverse effects.
RECOMMENDATIONS
GSI recommends that storm water treatment occur within lined bioretention basins orswales, or subsurface infiltration chambers/galleries. More specifically, we recommend:
• Impermeable liners used in conjunction with bioretention basins should consist ofa 30-mil polyvinyl chloride (PVC) membrane that is covered by a minimum of12 inches of clean soil, free from rocks and debris, with a maximum 4:1 (h:v) slopeinclination, or flatter, and meets the following minimum specifications:
Specific Gravity (ASTM D792): 1.2 (g/cc, min.); Tensile (ASTM D882):73 (lb/in-width, min); Elongation at Break (ASTM D882): 380 (%, min);Modulus (ASTM D882): 30 (lb/in-width, min.); and Tear Strength(ASTM D1004): 8 (lb/in, min); Seam Shear Strength (ASTM D882) 58.4 (lb/in,min); Seam Peel Strength (ASTM D882) 15 (lb/in, min).
• Subdrains used in bioretention basins should consist of at least 4-inch diameterSchedule 40 or SDR 35 drain pipe with perforations oriented down. The drain pipeshould be sleeved with a filter sock.
• Areas adjacent to, or within, the bioretention basins that are subject to inundationshould be properly protected against scouring, undermining, and erosion, inaccordance with the recommendations of the design engineer.
• If subsurface infiltration galleries/chambers are proposed, the appropriate size,depth interval, and ultimate placement of the detention/infiltration system should beevaluated by the design engineer, and be of sufficient width/depth to achieveoptimum performance, based on the infiltration rates provided. In addition, properdebris filter systems will need to be utilized for the infiltration galleries/chambers.
GeoSoils, Inc.
Saint Gregory of Nyassa Greek Orthodox Church W.O. 7220-A-SC
APN 498-320-56-00 January 10, 2016
File:e:\wp12\7200\7220a.lge Page 6
Debris filter systems will need to be self cleaning and periodically and regularlymaintained on a regular basis.
• Provisions for the regular and periodic maintenance of any debris filter system isrecommended and this condition should be disclosed to all interested/affectedparties.
• Infiltrations basins/swales should not be installed within ±8 feet of buildingfoundations utility trenches, and walls, or a 1:1 (h:v) slope (down and away) fromthe bottom elements of these improvements. Alternatively, deepened foundationsand/or pile/pier supported improvements may be used.
• Infiltrations basins/swales should not be installed adjacent to pavement and/orhardscape improvements. Alternatively, deepened/thickened edges and curbs maybe utilized in areas adjoining the basin/swale.
• Infiltration systems should be designed using a suitable factor-of-safety (FOS) toaccount for uncertainties in the known infiltration rates (as generally required by thecontrolling authorities), and reduction in performance over time. Any designedsystem will require regular and periodic maintenance, which may includerehabilitation and/or complete replacement of the filter media (e.g., sand, gravel,filter fabrics, topsoils, mulch, etc.) or other components utilized in construction,so that the design life exceeds 15 years.
• Due to the potential for piping and adverse seepage conditions, a burrowing rodentcontrol program should also be implemented onsite.
• All or portions of these systems may be considered attractive nuisances.Thus, consideration of the effects of, or potential for, vandalism should beaddressed.
• The potential for surface flooding, in the case of system blockage, should beevaluated by the design engineer.
• Any proposed utility backfill materials (i.e., inlet/outlet piping and/or othersubsurface utilities) located within or near the proposed area of the storm watertreatment BMP may become saturated. This is due to the potential for piping, watermigration, and/or seepage along the utility trench line backfill. Slurry backfill isrecommended in the area proposed for storm water treatment.
• If utility trenches cross and/or are proposed near the BMP, cut-off walls or otherwater barriers will need to be installed to mitigate the potential for piping and excesswater entering the utility backfill materials.

GeoSoils, Inc.
Saint Gregory of Nyassa Greek Orthodox Church W.O. 7220-A-SC
APN 498-320-56-00 January 10, 2016
File:e:\wp12\7200\7220a.lge Page 7
• Planned or existing utilities may also be subject to piping of fines into open-gradedgravel backfill layers unless separated from overlying or adjoining BMPs bygeotextiles and/or slurry backfill.
• The use of storm water treatment BMPs above existing utilities that mightdegrade/corrode with the introduction of water/seepage should be avoided.
• A vector control program may be necessary as stagnant water contained in stormwater treatment BMPs may attract mammals, birds, and insects that carrypathogens.
LIMITATIONS
The conclusions and recommendations are professional opinions. These opinions havebeen derived in accordance with current standards of practice, and no warranty, eitherexpress or implied, is given. Standards of practice are subject to change with time.GSI assumes no responsibility or liability for work or testing performed by others, or theirinaction; or work performed when GSI is not requested to be onsite, to evaluate if ourrecommendations have been properly implemented. Use of this report constitutes anagreement and consent by the user to all the limitations outlined above, notwithstandingany other agreements that may be in place. In addition, this report may be subject toreview by the controlling authorities. Thus, this report brings to completion our scope ofservices for this portion of the project.

GeoSoils, Inc.
Saint Gregory of Nyassa Greek Orthodox Church W.O. 7220-A-SC
APN 498-320-56-00 January 10, 2016
File:e:\wp12\7200\7220a.lge Page 8
If you have any questions or comments regarding this letter, please do not hesitate tocontact the undersigned.
Respectfully submitted,
GeoSoils, Inc.
John P. Franklin David W. SkellyEngineering Geologist, CEG 1340 Civil Engineer, RCE 47857
Ryan B. BoehmerProject Geologist
RBB/JPF/DWS/jh
Attachments: Appendix A - ReferencesAppendix B - County of San Diego Worksheet C.4-1
Distribution: (1) Addressee (via email)(2) JG Consulting and Engineering, Attn: Mr. Jerry Gaughan (via email and US mail)
GeoSoils, Inc.
APPENDIX A
REFERENCES
GeoSoils, Inc.
APPENDIX A
REFERENCES
Avocet Environmental, Inc., 2013, Interim remedial action report, Monte Vista Forest FireStation, 2249 Jamacha Road, El Cajon, California (SAM Case No. H05241-002),Project No. 1338.005, dated August 26.
Birkeland, P.W., 1999, Soils and geomorphology, third edition, Oxford University Press.
California Regional Water Quality Control Board - San Diego Region, 1994, Water QualityControl Plan for the San Diego Basin (9), dated September 8(amended May 17, 2016).
County of San Diego, 2016, BMP design manual for permanent site design, stormwatertreatment, and hydromodification management, February 26.
State of California Department of Water Resources, 1967, Ground water occurrence andquality, San Diego Region, Bulletin 106-2, Vol. II, Plate 8A, dated June.
Tan, S.S., 2002, Geologic map of the El Cajon 7.5' quadrangle, San Diego County,California, 1:24,000-scale.
Twidale, C.R., and Vidal Romaní, J.R., 2005, Landforms and geology of granite terrains,A.A. Balkema Publishers Leiden, the Netherlands.
United States Department of Agriculture - Natural Resources Conservation Service, 2016,Web soil survey, https://websoilsurvey.sc.egov.usda.gov/App/HomePage.htm,last modified August 10.
United States Geological Survey, 1967, El Cajon quadrangle, San Diego County,California, 7.5 minute series, 1:24,000 scale, photorevised 1975.
GeoSoils, Inc.
APPENDIX B
COUNTY OF SAN DIEGO WORKSHEET C.4-1
Appendix C: Geotechnical and Groundwater Investigation Requirements
C-11 February 26, 2016
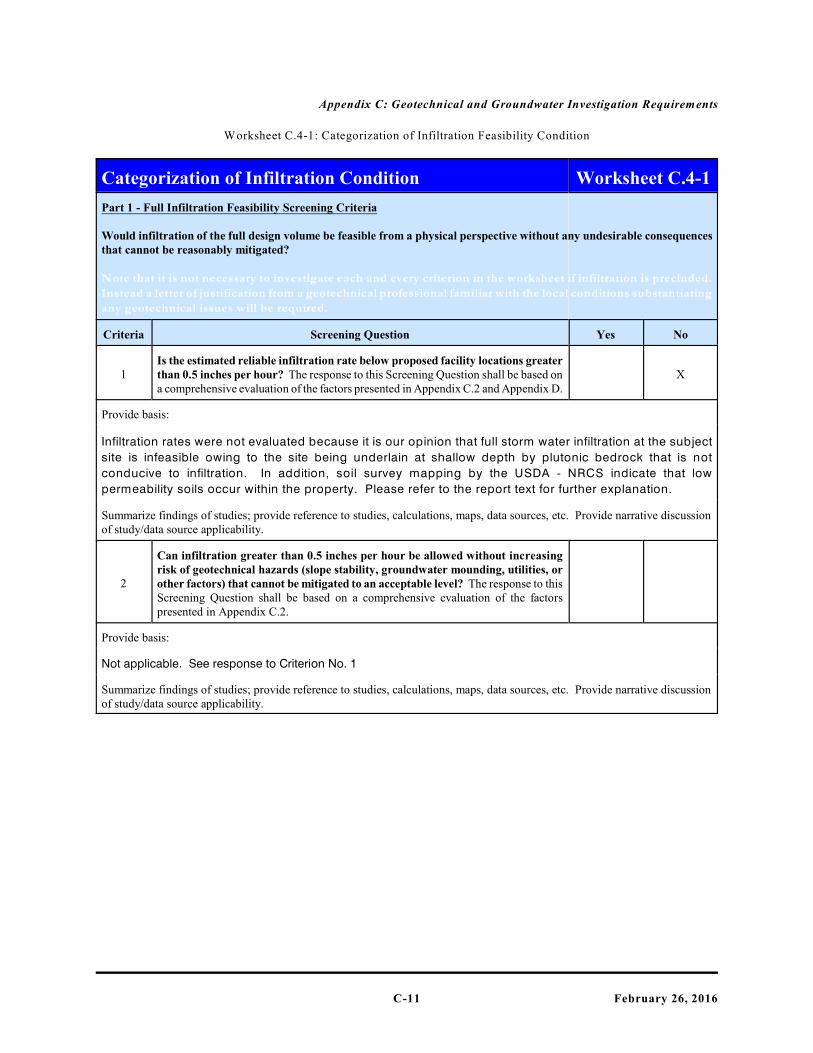
Worksheet C.4-1: Categorization of Infiltration Feasibility Condition
Categorization of Infiltration Condition Worksheet C.4-1
Part 1 - Full Infiltration Feasibility Screening Criteria
Would infiltration of the full design volume be feasible from a physical perspective without any undesirable consequencesthat cannot be reasonably mitigated?
Note that it is not necessary to investigate each and every criterion in the worksheet if infiltration is precluded.
Instead a letter of justification from a geotechnical professional familiar with the local conditions substantiating
any geotechnical issues will be required.
Criteria Screening Question Yes No
1Is the estimated reliable infiltration rate below proposed facility locations greaterthan 0.5 inches per hour? The response to this Screening Question shall be based ona comprehensive evaluation of the factors presented in Appendix C.2 and Appendix D.
X
Provide basis:
Infiltration rates were not evaluated because it is our opinion that full storm water infiltration at the subject
site is infeasible owing to the site being underlain at shallow depth by plutonic bedrock that is not
conducive to infiltration. In addition, soil survey mapping by the USDA - NRCS indicate that low
permeability soils occur within the property. Please refer to the report text for further explanation.
Summarize findings of studies; provide reference to studies, calculations, maps, data sources, etc. Provide narrative discussionof study/data source applicability.
2
Can infiltration greater than 0.5 inches per hour be allowed without increasingrisk of geotechnical hazards (slope stability, groundwater mounding, utilities, orother factors) that cannot be mitigated to an acceptable level? The response to thisScreening Question shall be based on a comprehensive evaluation of the factorspresented in Appendix C.2.
Provide basis:
Not applicable. See response to Criterion No. 1
Summarize findings of studies; provide reference to studies, calculations, maps, data sources, etc. Provide narrative discussionof study/data source applicability.
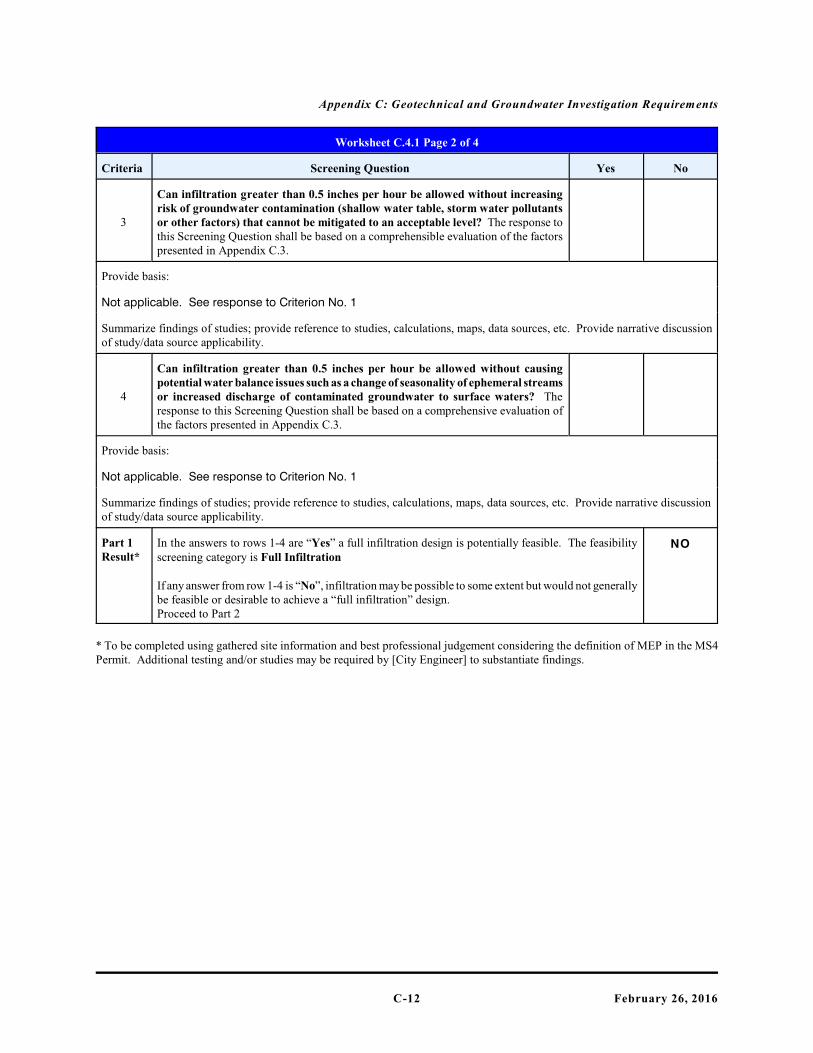
Appendix C: Geotechnical and Groundwater Investigation Requirements
C-12 February 26, 2016
Worksheet C.4.1 Page 2 of 4
Criteria Screening Question Yes No
3
Can infiltration greater than 0.5 inches per hour be allowed without increasingrisk of groundwater contamination (shallow water table, storm water pollutantsor other factors) that cannot be mitigated to an acceptable level? The response tothis Screening Question shall be based on a comprehensible evaluation of the factorspresented in Appendix C.3.
Provide basis:
Not applicable. See response to Criterion No. 1
Summarize findings of studies; provide reference to studies, calculations, maps, data sources, etc. Provide narrative discussionof study/data source applicability.
4
Can infiltration greater than 0.5 inches per hour be allowed without causingpotential water balance issues such as a change of seasonality of ephemeral streamsor increased discharge of contaminated groundwater to surface waters? Theresponse to this Screening Question shall be based on a comprehensive evaluation ofthe factors presented in Appendix C.3.
Provide basis:
Not applicable. See response to Criterion No. 1
Summarize findings of studies; provide reference to studies, calculations, maps, data sources, etc. Provide narrative discussionof study/data source applicability.
Part 1Result*
In the answers to rows 1-4 are “Yes” a full infiltration design is potentially feasible. The feasibilityscreening category is Full Infiltration
If any answer from row 1-4 is “No”, infiltration may be possible to some extent but would not generallybe feasible or desirable to achieve a “full infiltration” design. Proceed to Part 2
NO
* To be completed using gathered site information and best professional judgement considering the definition of MEP in the MS4Permit. Additional testing and/or studies may be required by [City Engineer] to substantiate findings.
Appendix C: Geotechnical and Groundwater Investigation Requirements
C-13 February 26, 2016
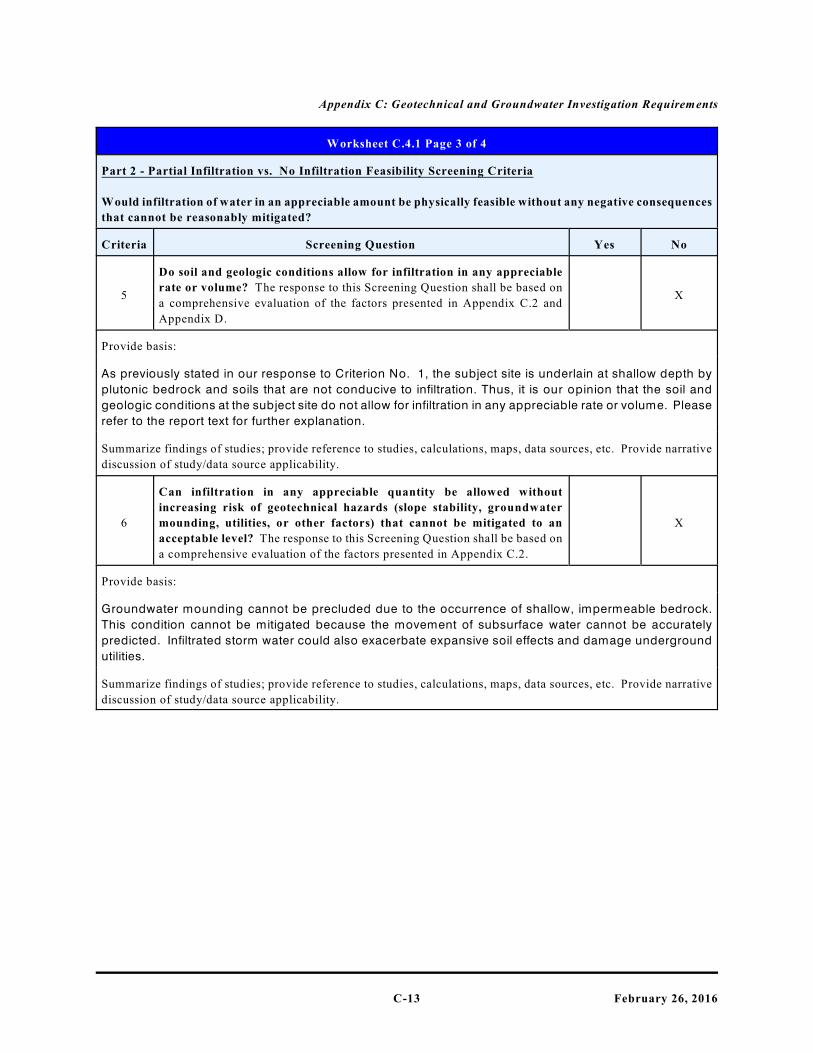
Worksheet C.4.1 Page 3 of 4
Part 2 - Partial Infiltration vs. No Infiltration Feasibility Screening Criteria
Would infiltration of water in an appreciable amount be physically feasible without any negative consequences
that cannot be reasonably mitigated?
Criteria Screening Question Yes No
5
Do soil and geologic conditions allow for infiltration in any appreciable
rate or volume? The response to this Screening Question shall be based on
a comprehensive evaluation of the factors presented in Appendix C.2 and
Appendix D.
X
Provide basis:
As previously stated in our response to Criterion No. 1, the subject site is underlain at shallow depth by
plutonic bedrock and soils that are not conducive to infiltration. Thus, it is our opinion that the soil and
geologic conditions at the subject site do not allow for infiltration in any appreciable rate or volume. Please
refer to the report text for further explanation.
Summarize findings of studies; provide reference to studies, calculations, maps, data sources, etc. Provide narrative
discussion of study/data source applicability.
6
Can infiltration in any appreciable quantity be allowed without
increasing risk of geotechnical hazards (slope stability, groundwater
mounding, utilities, or other factors) that cannot be mitigated to an
acceptable level? The response to this Screening Question shall be based on
a comprehensive evaluation of the factors presented in Appendix C.2.
X
Provide basis:
Groundwater mounding cannot be precluded due to the occurrence of shallow, impermeable bedrock.
This condition cannot be mitigated because the movement of subsurface water cannot be accurately
predicted. Infiltrated storm water could also exacerbate expansive soil effects and damage underground
utilities.
Summarize findings of studies; provide reference to studies, calculations, maps, data sources, etc. Provide narrative
discussion of study/data source applicability.
Appendix C: Geotechnical and Groundwater Investigation Requirements
C-14 February 26, 2016
Worksheet C.4.1 Page 4 of 4
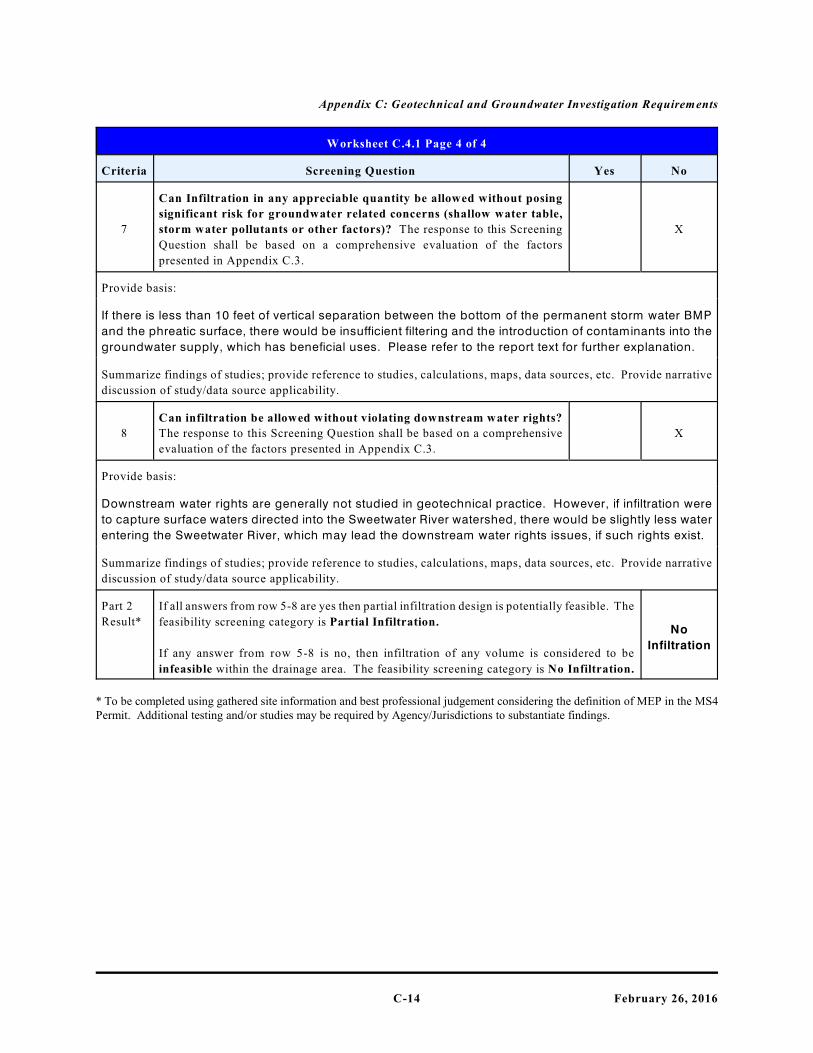
Criteria Screening Question Yes No
7
Can Infiltration in any appreciable quantity be allowed without posing
significant risk for groundwater related concerns (shallow water table,
storm water pollutants or other factors)? The response to this Screening
Question shall be based on a comprehensive evaluation of the factors
presented in Appendix C.3.
X
Provide basis:
If there is less than 10 feet of vertical separation between the bottom of the permanent storm water BMP
and the phreatic surface, there would be insufficient filtering and the introduction of contaminants into the
groundwater supply, which has beneficial uses. Please refer to the report text for further explanation.
Summarize findings of studies; provide reference to studies, calculations, maps, data sources, etc. Provide narrative
discussion of study/data source applicability.
8
Can infiltration be allowed without violating downstream water rights?
The response to this Screening Question shall be based on a comprehensive
evaluation of the factors presented in Appendix C.3.
X
Provide basis:
Downstream water rights are generally not studied in geotechnical practice. However, if infiltration were
to capture surface waters directed into the Sweetwater River watershed, there would be slightly less water
entering the Sweetwater River, which may lead the downstream water rights issues, if such rights exist.
Summarize findings of studies; provide reference to studies, calculations, maps, data sources, etc. Provide narrative
discussion of study/data source applicability.
Part 2
Result*
If all answers from row 5-8 are yes then partial infiltration design is potentially feasible. The
feasibility screening category is Partial Infiltration.
If any answer from row 5-8 is no, then infiltration of any volume is considered to be
infeasible within the drainage area. The feasibility screening category is No Infiltration.
No
Infiltration
* To be completed using gathered site information and best professional judgement considering the definition of MEP in the MS4Permit. Additional testing and/or studies may be required by Agency/Jurisdictions to substantiate findings.