Singapore’s Industrial Policy In A New Era: Painful ...appolds/research/progress/AppoldPDI1.pdf1...
24
1 Singapore’s Industrial Policy In A New Era: Painful Lessons for Busan Stephen Appold Department of Sociology, NUS, [email protected] VERY PRELIMINARY DRAFT – Please do not quote or cite; sources are not adequately cited Comments Are Welcome Industrial policy is a “government’s explicit attempt to coordinate its own multifarious activities and expenditures and to reform them using as a basic criteria the achievement of dynamic comparative advantage (Johnson, 1988: 11).” As such it is a logical outgrowth of the changing concept of comparative advantage which centers increasingly on considerations such as “human creative power, foresight, a highly educated workforce, and organizational talent.” Such comparative advantage may possibly be cultivated through public policies such as education, organized research, and investment in social overhead capital. Johnson’s writings could have served as a blueprint for much of Singapore’s recent industrial policy thought which has come to increasingly focus of what is sometimes termed, “heartware.” Policy action, however, remains focused on more tangible outcomes. I will outline the Singaporean industrial policy apparatus, examine Singapore’s economy in an historical and regional context, and sketch out the general contours of a response to a declining level of competitiveness. My general thesis (which is by no means fully demonstrated) is that effective industrial policy facilitates the actions that make collective sense. In an era when Singapore’s policy apparatus addressed the obstacles to making good decisions, Singapore’s industrial policies were effective. As the policy apparatus has become decreasingly able to address contemporary obstacles, effectiveness has also declined and industrial policy is increasingly dominated by subsidy. The decline in effectiveness can be seen in the high costs of innovation and the difficulties of adjusting to a knowledge-based economy. The points raised here are for the sake of discussion; more extensive data and analysis are needed.
Transcript of Singapore’s Industrial Policy In A New Era: Painful ...appolds/research/progress/AppoldPDI1.pdf1...

1
Singapore’s Industrial Policy In A New Era: Painful Lessons for Busan
Stephen Appold
Department of Sociology, NUS, [email protected]
VERY PRELIMINARY DRAFT – Please do not quote or cite; sources are not adequately cited
Comments Are Welcome
Industrial policy is a “government’s explicit attempt to coordinate its own multifarious
activities and expenditures and to reform them using as a basic criteria the achievement of dynamic
comparative advantage (Johnson, 1988: 11).” As such it is a logical outgrowth of the changing concept
of comparative advantage which centers increasingly on considerations such as “human creative power,
foresight, a highly educated workforce, and organizational talent.” Such comparative advantage may
possibly be cultivated through public policies such as education, organized research, and investment in
social overhead capital. Johnson’s writings could have served as a blueprint for much of Singapore’s
recent industrial policy thought which has come to increasingly focus of what is sometimes termed,
“heartware.” Policy action, however, remains focused on more tangible outcomes.
I will outline the Singaporean industrial policy apparatus, examine Singapore’s economy in an
historical and regional context, and sketch out the general contours of a response to a declining level of
competitiveness. My general thesis (which is by no means fully demonstrated) is that effective
industrial policy facilitates the actions that make collective sense. In an era when Singapore’s policy
apparatus addressed the obstacles to making good decisions, Singapore’s industrial policies were
effective. As the policy apparatus has become decreasingly able to address contemporary obstacles,
effectiveness has also declined and industrial policy is increasingly dominated by subsidy. The decline
in effectiveness can be seen in the high costs of innovation and the difficulties of adjusting to a
knowledge-based economy. The points raised here are for the sake of discussion; more extensive data
and analysis are needed.

1 The Social Development Unit has just had its ISO 9002 certification renewed for another 3years.
2
How the Singaporean state addresses industrial policy
Whether state-led or merely state-regulated development, Singapore may be the archetypical
bureaucratic state. Each task and each perceived problem quickly has a bureau or a committee
assigned to it. Each is controlled by a mission and there are often identifiable performance measures.
The state may not be particularly efficient or even very effective, but the various offices are at least
goal-oriented. An extreme example may be the government efforts to address the relatively high rate of
non-marriage, particularly among well-educated women. The Social Development Unit1, under the
purview of the Ministry of Community Development and Sports, addresses the perceived problem by
organizing social activities for unmarried university graduates. (There is a separate Social
Development Service for those who are not university graduates.) Unfortunately, the government
bureau is not very effective despite the talent and energy applied; the rate of singlehood among female
university graduates in the 40-44 age group has increased from 24 to 27 percent between 1990 and
2000.
The Economic Development Board, responsible for industrial development strategies, and the
Jurong Town Corporation, responsible for industrial real estate (both under the Ministry of Trade and
Industry) have been arguable the first-line bureaus for industrial policy. As the push for greater
knowledge content has increased, that ministry’s National Science & Technology Board has become
more central in industrial policy. The important supporting role of the Housing and Development
Board in supplying residence for approximately 80 percent of the population and of the Urban
Redevelopment Authority in managing central city land (both under the Ministry of National
Development) has long been noted. However, as the broad nature of “dynamic competitive advantage”
has gained appreciation, other ministries have become more directly tied to economic development
concerns. The Ministry of Education has been charged with instilling more creativity and the Ministry
of Community Development and Sports with cultivating sports teams that can get Singaporeans to

3
cheer as one. Even the Ministry of Information and the Arts is charged with creating a “vibrant city
life” with the attendant chaos that is supposedly the basis of economic competitiveness today. These
days, it is less clear who has responsible for industrial policy than it may have been in the past. At the
same time, the relationship between policy and outcome is also less clear and more complex and
contingent.
Economic Development Board operations
The Economic Development Board is probably still the organization most directly concerned
with industrial policy. Following a somewhat “matrix”-style design, offices within the organization are
charged with development of each of the four pillars and, crossing them with those responsible for
upgrading the strengths of local firms, attracting international headquarters to Singapore, encourage
innovation and develop new knowledge-driven capabilities, and to develop domestic human resources
and attract “foreign talent” to Singapore.
The degree of goal-directedness of the Singaporean bureaus can be seen in the way in which
section leaders in the Economic Development Board report the results of their work. Those responsible
for the four major manufacturing pillars of the economy, electronics, chemicals, engineering, and life
sciences report on the performance of their cluster of industries, including fixed asset investment
commitments, the number of jobs resulting from those commitments, the value of sectoral output, and
the total value added and the value added per worker. They will list sectoral highlights over the
previous year and mention the successes of their industry cluster in meeting EDB promising local
enterprise, headquarters, manpower, and innovation targets. Those charged with promoting education
and healthcare, the headquarters initiative, information, communication, and media, logistics and
supply chain development, and venture capital report on spending commitments and the jobs created
from those commitments and how their functional areas help achieve the targets in other areas. Those
successes may not be due to EDB efforts but such reporting facilitates the control of EDB personnel

2 Curiously, the human resources area seems to have the least systematic report.
4
and the honing of policies.2 As with all organizational efforts, the goals that can be sufficiently
specified seem to achieve the most recognizable results.
The EDB’s efforts entail a substantial level of subsidy. Aside from granting tax advantages,
the Singaporean government is paying for at least 25 percent of the costs of developing the Jurong
Island (petro-) chemical complex. Nevertheless, the EDB efforts support interventions aimed at solving
the operational problems of businesses in Singapore. In that way, their efforts may help make
Singapore a more efficient business location. Business services and banking do not appear to receive
the level of systematic attention that the four pillars of manufacturing do.
Singapore in the global economy
Since modern Singapore was founded in 1819 by Stamford Raffles, Singapore has filled a
function in the global economy as a port. There has been a great deal of continuity over the past 192
years with one recent comment that, even today, “Singapore is the quintessential entrepot economy,
serving as a key financial center, a major trading center, the hub of regional activities for many
multinationals and a manufacturing exporter in its own right (World Economic Forum, n.d.).” The
break-in-bulk collecting of materials and wholesaling, the increasingly complex central place retailing
and services for the hinterland, and the cluster of specialized manufacturing found in Singapore
(Wheatley, 1972) are arguably all tied to the port and its efficiency. Singapore has been termed a
“shop on a busy street” and its location in the center of Southeast Asia and on the sea lanes may be its
most important resource, generating tremendous economic rents. The port generates a need for
international finance and insurance. The port also facilitates export-oriented manufacturing.
As with shopkeepers everywhere, an increase in traffic has benefits and policies that enhance
that comparative advantage by increasing the efficiency of the port or of the activities dependent upon
the port have clear benefits. Policies that attempt to develop new sources of comparative advantage

5
carry a higher risk and are more speculative. Historical studies have found that “change in the [spatial
patterns of the] manufacturing sector seems to trace primarily to the fact that activity in 'new' lines of
industry is distributed territorially more or less independently of the 'old' distribution of manufacturing
activity (Duncan and Lieberson 1970, p. 23).” As new industries emerge and old ones decline, the
fortunes of particular cities shifts. The clearly felt danger in Singapore is that the increasingly
attractive centers of northeast Asia will render Singapore less relevant to the global economy.
---------------------------------------------
Figure 1 about here
---------------------------------------------
Figure 1 shows the trends in occupational distribution over the past half century. The
proportion of the labor force engaged in production-related and blue collar occupations since 1947
seems remarkably stable given the tremendous changes in the production operations performed in that
time period. The solid base of production-related occupations in the labor force facilitated shifts into
higher value-added manufacturing. The proportion of the labor force engaged as clerks has also
remained remarkably stable. There has, however, been a dramatic apparent shift out of sales and
service occupations into managerial and professional occupations. Some of this shift is due to the
reorganization of work. The employment share of trade, for example, has remained relatively constant
– implying the growth of large organizations in retail, wholesale, and other sectors. The increase in the
representation of professionals and managers is aided by the rapid increase in permanent residents –
fully one-third of whom hold university degrees and another fourth of whom hold other post-secondary
school qualifications (Department of Statistics, 2000).
---------------------------------------------
Figure 2 about here
---------------------------------------------
Figure 2 illustrates the trend in employment by industry over the last several decades of

6
Singapore’s history. Employment in financial and business services has risen fairly steadily over the
past three decades from approximately 4 percent of total employment in 1970 to 16 percent in 2000.
Building on a strong base, the manufacturing share of employment rose from approximately 16 percent
in 1947 (it was almost as high, 15.6 percent, in 1921 [Huff, 1994: Appendix Table 10]) to a peak of 30
percent around 1980 and then has subsequently declined to 21 percent in 2000. (These figures may
overstate the decline in actual manufacturing employment because many factory workers commute
from nearby Johore Bahru and because those in the country on work permits are not counted among the
resident population.) The contribution of manufacturing to GDP has closely tracked employment
share. In 1960, 16.7 percent of GDP came from manufacturing; it may have peaked at 29.5 percent in
1980.
---------------------------------------------
Table 1 about here
---------------------------------------------
Table 1 reveals some of the turbulence underneath the apparent relative calm of the aggregates
employment figures. Although there was some manufacturing for export in Singapore prior to 1940,
most of the manufacturing in 1960 was oriented toward local needs, primarily food and beverages.
Although the share of food and beverages in total manufacturing output is small, many of the local
manufacturing fortunes have been (and continue to be) made in the food industry. Another set of
industries peaked in importance in the late 1970s but it is still possible to buy clothing labeled “Made in
Singapore” in U.S. department stores. Further, as the third-largest refining center in the world after
Houston and Rotterdam, petroleum refining remains quite important. With refineries reportedly
operating at about 50 percent capacity, the potential for greater contribution is there. A third set of
industries has not yet peaked in importance. The growth of chemicals and pharmaceutical has been
modest. Both electronic components and chemicals were more important than textiles and garments in
1961.

7
Singapore and multinational firms
Multinational firms have had a large role in some of the industries. Philips, now a major
manufacturing employer, began producing portable radios in Singapore during the late 1950s. Ford
was producing automobiles in Singapore before the Second World War. Oil refining has a long
presence in the Singaporean economy; Shell and Mobil were here in the 1890s. By the early 1960s, the
list of multinational firms in Singapore is long and diverse. General Electric (US) and General Electric
Corporation (UK) were both present. The list also includes Caltex, and Maruzen Toyo Oil in
petroleum, Boots and ICI in pharmaceuticals, Bridgestone, Dunlop, Firestone, and Goodyear in tires,
several American insurers and five major film distributors along with Bata and Skoda and many others
(Commercial Guide to Malaya, 1960). Multinational firms were an important presence in Singapore
before the PAP was and it is difficult to tell whether Singapore is an example of state-led or MNC-led
development. Singapore developed a strong export-oriented manufacturing base as MNCs in developed
countries were faced with increasing costs and severe labor shortages. As those MNCs searched for
offshore production locations, Singapore industrialized – albeint somewhat later than the first-tier
NICs. Singapore’s industrial policy was successful in regulating the investment that ensured by
ordering the markets for industrial and office space and by providing housing. Although the Housing
Development Board and the Urban Redevelopment Authority have received criticism, it is unlikely that
significantly different policies or private developers could have filled the needs as effectively.
Regardless of who took the lead, the Singapore government has well-developed feedback
mechanisms for MNC concerns. Multinational firms are well-represented in the boards of directors of
the statutory boards. In 1996, Ernst and Young (4) Esso Singapore (5); Kuok (S) (3); Motorola (2);
Philips (3); Price Waterhouse (3); Shell (2); Standard Chartered Bank (2) were represented multiple
times (in parentheses) and appeared to be approximately as well-represented as private sector
Singaporean firms. Moreover, MNC representatives (many native Singaporeans) played an active role
in the Ministry of Trade and Industry’s “Committee on Singapore’s Competitiveness” which was

8
formed in May 1997 and filed a final report in late 1998. Of the 16 members of the Main Committee,
three represented the government and 6 MNCs. The manufacturing committee had 12 members; 7
(including the chair) were representatives of MNCs. The focus groups for chemicals, electronics, and
life sciences were all chaired and dominated by the representatives of multinational firms. Only the
local enterprise and marine groups has majority local representation. The finance and banking
committee had 19 members, twelve from MNCs. Of the 22 hub services committee members, 9 were
MNC representatives. The domestic business and manpower and productivity committees were
predominantly local representatives. To their credit, rather than the bold action that is sometimes
claimed, the Singapore government may be more accurately characterized as having honed its skills in
“the science muddling through (Lindblom, 1959).”
Singapore, ASEAN, and beyond
---------------------------------------------
Table 2 about here
---------------------------------------------
Table 2 compares some of Singapore’s basic indicators with those of its ASEAN neighbors
and selected other countries and regions. The GNP per capita (an indicator of economic well-being) in
Singapore is substantially higher than that in the neighboring countries. The 20-year rate of economic
growth is at least comparable to the rest of ASEAN. Only the Philippine economy has grown
substantially slower. The rate of economic growth in Singapore is also comparable to that in Hong
Kong, Korea, and China. The rate of GNP per capita growth in Singapore has been substantially
higher than in Malaysia and the Philippines but comparable to Thailand. (It is difficult to assess the
meaning of GNP per capita when a significant minority proportion of the production is accounted for
by those not counted in the denominator.) Although the improvement in life expectancy has been
somewhat lower in Singapore than in the rest of ASEAN, Singapore started from a higher baseline

3 Other sources, e.g., World Bank (1993), show slightly different but comparable growthindicators for somewhat different time periods. That same source reports an absence of total factorproductivity growth in Singapore. Although there are several possible explanations for the finding, itsuggests that the Singaporean economy hasn’t learned to use resources more efficiently than it did inthe past.
9
from which further improvements are probably more difficult to achieve. It would be possible to
tentatively conclude that the same forces that have driven ASEAN’s growth have worked in equal force
in Singapore.3
---------------------------------------------
Table 3 about here
---------------------------------------------
Table 3 compares the growth in output of selected manufacturing sectors in Singapore and
Malaysia over approximately a decade. The sectors illustrated are not exactly those shown in Table xx
and, because of differences in the way the data are classified, they are not totally equivalent with each
other. Index numbers are reported. The actual volume of production may be very different in the two
countries even when the index numbers are similar. It may not be surprising that the Singapore “early
pattern” manufacturing industries continue to hold their own or even grow in Malaysia. Malaysia
seems to do well in the Singapore “middle pattern” industries. (The 1998 drop in transportation
equipment may be temporary.) Malaysia also apparently does as well as Singapore in the “late
pattern” manufacturing sectors also. More detailed data would be needed to see whether Singapore has
a clear locational advantage over its nearest neighbor for any aspect of manufacturing. In a recent
visit, Michael Porter suggested that it did not.
---------------------------------------------
Table 4 about here
---------------------------------------------
Table 4 shows the trends in foreign direct investment in ASEAN and selected other countries
since 1986. Foreign direct investment is admittedly an imperfect indicator of the influence and interest

10
of multinational corporations because it tends to favor knowledge embedded in machinery and because
MNCs often raise substantial capital inside the country of investment. Several points bear mentioning.
First, Singapore attracts the greatest share of FDI in ASEAN, although in some years Malaysia is not
far behind. Second, FDI in ASEAN has cooled since 1997. Third, only Hong Kong in recent years has
been as dependent upon foreign capital for investment (or alternatively, Singapore is the only country
that is consistently highly attractive to foreign investors). Fourth, Singapore and ASEAN have lost
their attractiveness relative to other areas in Asia to foreign investors. Since 1994, other areas in Asia
(primarily China) have attracted more FDI than ASEAN. In the latter half of the 1990s, Hong Kong
also began to attract more FDI than Singapore. These trends suggest that Singapore will have a
smaller role to play in the global economy than it has had in the past. These trends have had a part in
shaping recent industrial policy in Singapore, including the attempt to regionalize and globalize.
Moreover, they are important to industrial policy because, if the gist of Singaporean industrial policy in
the past has been to help multinational firms do what they wanted to do, the interests begin to diverge
and policy needs to adapt when MNC aims include de-emphasizing Singapore and Southeast Asia. The
shifts in FDI destination suggest a turning point in the Singapore industrial policy problem from when
ASEAN and Singapore was the favored destination of investment in developing Asia to an era when it
was not. In that latter period the policy problem has become more difficult and the chances of policy
success, more distant because the basic task has changed from channeling investments to attracting
them.
The uncertain response to rising costs
By the late 1980s, Singaporean manufacturing wages were higher than those of Hong Kong
and Korea and only slightly lower than those of Taiwan. This was despite and increasing reliance on
low-wage foreign labor from neighboring countries (Ho, 1995). Since then, industrial policy has
increasingly stressed upgrading.

4 This paragraph relies heavily on Khondker (1999).
11
The idea of a knowledge-based economy is not new in Singapore.4 Soon after independence, in
1967, the Singapore Science Council (subsequently reformed as the National Science and Technology
Board) was formed to assist the government in promoting the development of scientific and
technological capabilities, including the development of manpower and the promotion of private sector
research. Barely a year later, the Ministry of Science and Technology was formed with the aim of
using science and technology as tools for economic development. In 1972, two organizations in
Singapore were performing research and development work, NUS and a department in the Ministry of
Defense (Amsden, Tschang, and Goto, 2001). As early as 1981, the primary objective of the economic
plan was to base the Singaporean economy on science, technology, skills and knowledge. That
objective received new urgency during the mid-1980s following an economic downturn. A S$5 billion
Science Hub is now being built for start-ups and R&D labs.
---------------------------------------------
Table 5 about here
---------------------------------------------
Table 5 places the some of the indicators of the Singaporean push towards innovation and
research and development in the context of selected countries. In 1978, Singapore spent .2 percent of
its GDP on research and development and 818 research scientists and engineers (8 per 10,000
residents). (In 1975, petroleum refining was contributing 38 percent and electronic components 10
percent to Singapore’s S$12.6 billion manufacturing output.) By the late 1990s, Singapore had
increased the proportion of the GDP devoted to research and development by 84 percent. None of the
other selected countries increased their spending as quickly. Unfortunately, that it still trailed several
other key comparison countries.
---------------------------------------------
Table 6 about here

12
---------------------------------------------
Table 6 shows the number of research scientists and engineers per 10,000 residents. The
representation increased by more than 250 percent giving Singapore 70 research scientists and
engineers per 10,000 residents. That is roughly comparable to the U.S. Despite its late start in R&D
compared to other Asian developing nations, Singapore has been able to begin catching up with respect
to spending and manpower.
---------------------------------------------
Table 7 about here
---------------------------------------------
Table 7 provides more details about the push toward a knowledge-based economy in
Singapore. R&D spending increased over four and one-half times between 1990 and 1999 – reaching
S$2.6 billion in 1999. The number of research scientists and engineers in the country has increased
from 4329 to 13817 – more than tripled – over the same time period. Both spending and the numbers
of research scientists and engineers increased dramatically over the last decade but because spending
increased more quickly than human resource counts, R&D became more capital intensive. The
information for patents does not stretch back that far but the number of applications and the number
granted have both increased rapidly in the second half of the last decade. Each Singaporean patent
granted required an average investment of S$16.5 million in 1999 (the lowest cost for the years
recorded) and approximately 86 research scientists and engineers (85 is the lowest figure for the years
recorded). A comparison with the U.S. using the latest available (1998) figures, where R&D spending
totaled over US$227 billion (S$398 billion) and resulted in 80,294 patents of domestic U.S. origin,
reveals that each U.S. patent represented an investment of US$353,338 (S$615,067) and
approximately 15 research scientists and engineers (estimated). In other words, innovation in the U.S.
costs approximately 1/25th of what it does in Singapore and requires 17 percent of the human
resources. Imperfect as these indicators are, they demonstrate that while the Singaporean policy

5 This paragraph relies heavily on Amsden, Tschang, and Goto (2001). Singaporeanuniversities also perform research and development. NUS received 13 patents in 2000. This iscomparable to U.S. institutions such as Yeshiva University, Florida State University and the Universityof Missouri which were granted 14, 13, and 13 patents in 1998, respectively.
13
interventions may be effective, they are not necessarily promoting efficiency.
Multinational firms account for 40 percent of all Singaporean research and development
expenditures.5 Some of that research was performed in small in-house labs of 20 to 50 people. IBM
reported 14 researchers in Singapore. These labs were heavily subsidized by the Singaporean
government. In some cases, the research is undertaken on an equal cost-sharing basis with the
Singaporean government not making any claim on the intellectual property generated. MNC laboratory
managers universally claimed that the motivation for undertaking research was the generous subsidy
offered by the government, rather than the low cost of doing research in Singapore (Amsdem, Tschang,
and Goto, 1999). The Center for Wireless Communication and the Data Storage Institute, both
government-supported laboratories, sell research services to multinational firms. By maintaining
specialized staffs they can offer an alternative to MNC in-house labs. Their function is to hold the
“recent pattern” manufacturing in Singapore despite the cost pressures on the firms to move the
operations out.
There are difficulties in the labor supply system at almost all levels. The research and
development labor force, 14,000 research scientists and engineers, is largely transient. Former civil
servants and military officers who are tracked to become the top managers of GLCs, the cream of the
meritocratic system, are apparently ill-prepared for the demands of contemporary business and
foreigners are replacing them in those positions. The same is true at many skill levels. Of course a
quickly growing economy should create a greater demand for labor than it can supply, but at the same
time foreign labor is widely hired, Singaporeans at several skill levels have difficulty finding
employment. In assessing recent developments in Singapore, Michael Porter suggested that “Singapore
truly is going to have to step up the pace of innovation, broadly defined, if it's going to have the
productivity growth in order to continue to increase its sustainability.”
14
Conclusions
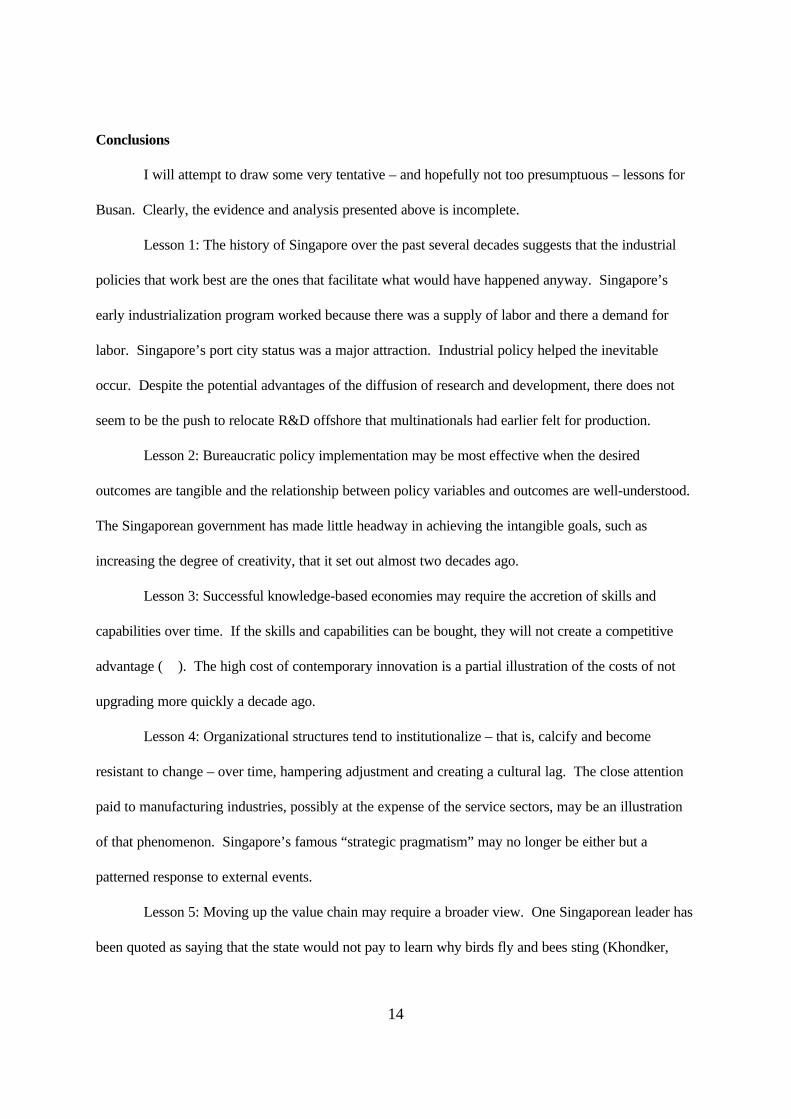
I will attempt to draw some very tentative – and hopefully not too presumptuous – lessons for
Busan. Clearly, the evidence and analysis presented above is incomplete.
Lesson 1: The history of Singapore over the past several decades suggests that the industrial
policies that work best are the ones that facilitate what would have happened anyway. Singapore’s
early industrialization program worked because there was a supply of labor and there a demand for
labor. Singapore’s port city status was a major attraction. Industrial policy helped the inevitable
occur. Despite the potential advantages of the diffusion of research and development, there does not
seem to be the push to relocate R&D offshore that multinationals had earlier felt for production.
Lesson 2: Bureaucratic policy implementation may be most effective when the desired
outcomes are tangible and the relationship between policy variables and outcomes are well-understood.
The Singaporean government has made little headway in achieving the intangible goals, such as
increasing the degree of creativity, that it set out almost two decades ago.
Lesson 3: Successful knowledge-based economies may require the accretion of skills and
capabilities over time. If the skills and capabilities can be bought, they will not create a competitive
advantage ( ). The high cost of contemporary innovation is a partial illustration of the costs of not
upgrading more quickly a decade ago.
Lesson 4: Organizational structures tend to institutionalize – that is, calcify and become
resistant to change – over time, hampering adjustment and creating a cultural lag. The close attention
paid to manufacturing industries, possibly at the expense of the service sectors, may be an illustration
of that phenomenon. Singapore’s famous “strategic pragmatism” may no longer be either but a
patterned response to external events.
Lesson 5: Moving up the value chain may require a broader view. One Singaporean leader has
been quoted as saying that the state would not pay to learn why birds fly and bees sting (Khondker,

15
1999) but similar seemingly unimportant concerns are now at the basis of commercial processes and
products. Similarly, an earlier neglect of social sciences and humanities may have left Singapore
inadequately prepared to address its “heartware” issues. The society may not yet have the capabilities
needed to support the new economy through cultural production and improvements in the quality of life.
Bibliography
Amsden, Alice H., Ted Tschang, and Akira Goto. 2001. “Do Foreign Companies Conduct R&D inDeveloping Countries? A New Approach to Analyzing the Level of R&D, With an Analysis ofSingapore.” Asian Development Bank Institute Working Paper 14, Tokyo.
Commercial Guide to Malaya, 1960. Ipoh: O.S. Pada Advertising.
Department of Statistics. 2000. Changing Educational Profile. Census 2000 Advanced Data Release.
Duncan, Beverly and Stanley Lieberson. 1970. Metropolis and Region in Transition. Beverly Hills:Sage.
Ho Kong Chong. 2000. “One Response from the South: Singapore Efforts to Stay Competitive in theGlobal Economy.”
Ho Kong Chong. 1995. “Singapore: Maneurvering in the Middle League.” In Gordon L. Clark andWon Bae Kim, eds., Asian NIEs and the Global Economy. Baltimore: Johns HopkinsUniversity Press.
Huff, W.G. 1994. The Economic Growth of Singapore: Trade and Development in the TwentiethCentury. Cambridge: Cambridge University Press.
Johnson, Chalmers. 1988. “The Idea of Industrial Policy.” in The Industrial Policy Debate. SanFrancisco: Institute for Contemporary Studies.
Khondker, Habibul H. 1999. “Science Policy Framework and Science Parks in Singapore.” Presentedat the Workshop on IT Parks in Asia and the Role of U.S. Inventors in their Development,Honululu.
Lindblom, Charles E. 1959. “The Science of Muddling Through .” Public Administration Review 13:
National Science Board. 2000. Science and Engineering Indicators, 2000. Washington D.C.
Wheatley, Paul. 1972. "The Concept of Urbanism." in P.J. Ucko, R. Tringham and G.W. Dimbley,eds., Man, Settlement and Urbanism. Duckworth and Co.; Hertfordshire.
World Bank. 1993. The East Asian Miracle: Economic Growth and Public Policy. New York: :Oxford University Press.

Employment by Industry
0.0
5.0
10.0
15.0
20.0
25.0
30.0
35.0
1947 1957 1970 1975 1980 1985 1990 1995 2000
Per
cent
of L
abor
For
ce
Manuf Trade Trans & Com FIRE
Figure One

Occupational distribution in Singapore
0
10
20
30
40
50
60
70
80
90
100
1947 1957 1970 1974 1979 1983 1990 1994 2000
perc
ent
Man & Prof Clerical Service Production Fishing
Figure Two

17
Table One
Contribution (%) of Selected Industries to Total Manufacturing Output
Industry 1961 1965 1970 1975 1980 1985 1990 1995 1999
Early Pattern (1960s)Food, beverages, tobacco 40.6 31.0 18.3 8.7 6.6 7.3 4.0 3.2 2.5Wood products 7.5 6.9 5.4 2.9 3.1 1.8 1.2 .4 .3Paper products, printing 10.3 6.8 3.5 2.6 2.6 3.5 3.6 3.3 2.6
Middle-Pattern (1970s)Textiles, garments, 2.5 4.6 5.2 4.7 4.5 3.4 3.1 1.2 .9 Ftwear, leatherPetroleum 0.2 17.8 31.4 37.7 36.4 28.7 15.9 11.8 14.6Transport equipment 5.3 4.8 8.5 8.4 6.5 4.7 5.3 4.6 4.3
Recent pattern (1980s)Electronic components 3.4 2.4 7.3 9.8 16.9 23.7 39.1 51.0 51.4Chemicals, Pharmaceuticals 3.4 2.1 2.9 3.4 2.9 6.7 6.9 3.6 6.4
Total manufacturingOutput (S$ billion) 0.511 1.07 3.89 12.61 31.66 38.49 71.32 113.3 133.5
*Note: Up until 1970, Electric Appliances was classified together with Electronic components
Source: Singapore, Department of Statistics, Census of industrial Production (1985, p.18 ).Singapore,Department of Statistics, Economic and Social Statistics 1960-1982, pp.80-81. Singapore, Department ofStatistics Yearbook of Statistics, 1994, pp.108-109

18
Table Two
Basic indicators of economic development and well-being, Singapore, ASEAN, and selected countries andregions
GNP annual 1987 GNP GNP per capita life expectancy at birthgrowth rate, per capita, annual 1970 1997 change1975-1995 US $ growth rate
1975-1995
Singapore 7.8 32810 5.8 68.8 77.1 8.3Malaysia 7.1 4530 4.4 61.3 72.0 10.7Thailand 7.8 2740 5.9 58.3 68.8 10.5Philippines 3.0 1200 0.1 56.9 68.3 11.4Indonesia 7.1 1100 5.1 47.6 65.1 17.5
Hong Kong SAR 7.6 25200 5.7 71.1 78.5 7.4Korea, Rep. Of 8.3 10550 7.0 60.1 72.4 12.3China 9.1 860 7.7 62.0 69.8 7.8India 5.0 370 2.8 49.1 62.6 13.5
All developing countries 4.4 1314 2.3 54.5 64.4 9.9East Asia 8.8 1330 7.3 62.0 70.0 8.0East Asia (w/o China) 8.1 11811 6.8 61.0 72.8 11.8SE Asia & the Pacific 6.6 1556 4.4 51.0 65.9 14.9Industrialied countires 2.6 27174 1.9 71.4 77.7 6.3World 2.8 5257 1.1 59.1 66.7 7.6
Source: Human Development Report, 1999; Tables 8, 11

19
Table Three
Comparison of the Growth of Selected Industries (index numbers)
Industry 1987 1990 1993 1996 1997 1998
Early Pattern (1960s)Food & beveragesSingapore; ISIC r3: 15 89 100 112 115 112 99Malaysia; ISIC r2: 311, 312, 313 82* 100 109 137 146 141Wood productsSingapore; ISIC r3: 20 115 100 79 74 67 67Malaysia; ISIC r2: 331 66 100 140 173 170 151Paper productsSingapore; ISIC r3: 21 85 100 93 102 94 82Malaysia; ISIC r2: 341 -- 100 85 103 116 106
Middle-Pattern (1970s)GarmentsSingapore; ISIC r3: 18 99 100 71 42 40 45Malaysia; ISIC r2: 322 75 100 106 98 100 101Petroleum refiningSingapore; ISIC r3: 23 74 100 120 126 131 129Malaysia; ISIC r2: 353 79 100 119 172 188 166Transport equipment Singapore; ISIC r3: 34, 35 61 100 104 107 115 131Malaysia; ISIC r2: 384 31 100 114 227 259 124
Recent pattern (1980s)Electronic componentsSingapore; ISIC r3: 31, 32, 33 79 100 113 130 134 130Malaysia; ISIC r2: 383 49 100 174 283 326 315Chemicals, PharmaceuticalsSingapore; ISIC r3: 24 71 100 112 136 171 214Malaysia; ISIC r2: 351, 352 89* 100 131 195 225 215
*Note: 1988 index number
Source: International yearbook of industrial statistics. United Nations Industrial DevelopmentOrganization. Vienna: United Nations Industrial Development Organization, 2001

20
Table Four
FDI inflows (Millions of US $) and ratio of FDI inflows to gross fixed capital formation (second row)
1986 1987 1988 1989 1990 1991 1992 1993 1994 1995 1996 1997 1998 1999
Singapore 1710 2836 3647 2887 5575 4888 6730 6829 8550 7206 8984 8085 5493 698432.7 36.2 43.3 56.5 34.4 34.4 28.4 21.4
Malaysia 489 423 719 1668 2332 3998 5183 5206 4581 5816 7296 6513 2700 353224 26 23.7 18.6 18.3 20.5 17.8 16.1
Thailand 263 352 1105 1775 2444 2014 2116 1715 1343 2000 2405 3732 7449 60785.6 4.9 3.6 2.4 2.9 3.3 8.5 33.5
Philippines 127 307 936 563 530 544 228 763 1591 1459 1520 1249 1752 7376 2 5.9 11.7 9.8 8.5 6.6 14.7
Indonesia 258 385 576 682 1093 1482 1777 2004 2109 4346 6194 4677 -356 -32703.6 5.1 4.8 4.0 7.2 9.8 7.3 -0.8
Hong Kong SAR 996 3298 2675 1076 1728 538 2051 1667 7828 6213 10460 11368 14776 230682.3 7.7 7.1 25.2 17.1 27.7 24.7 42.0
Korea, Rep. Of 435 601 871 758 715 1116 550 516 991 1357 2308 3088 5215 103401 0.5 0.4 0.7 0.8 1.2 1.8 5.8
China 1875 2314 3194 3393 3487 4366 11156 27515 33787 35849 40180 44236 43751 404003.3 7.8 20 20.9 17.2 16.7 17.1 14.8
India 118 212 91 252 236 155 261 586 973 2144 2426 3577 2635 21680.3 0.5 1.1 1.4 2.5 2.7 4.0 3.0

21
Table Five
R& D Spending as Percent of GDP
R&D Spending 1980s early/mid 1990s late 1990s(% of GDP)Japan 2.9 (1988) 2.73 (1993) 3.06 (1998)Germany 2.9 (1987) 2.30 (1995) 2.29 (1998)Switzerland 2.9 (1986) 2.51 (1992) 2.73 (1996)USA 2.8 (1988) 2.40 (1995) 2.84 (1999)Korea 1.8 (1988) 2.61 (1994) 2.52 (1998)Taiwan 1.3 (1988) 1.80 (1994) 1.98 (1998)Singapore 1.0 (1990) 1.12 (1994) 1.84 (1999)
Sources: NSTB, 1991 and 1996

22
Table Six
Research Scientists and Engineers per 10,000 Workers
No. of Research Scientists & 1980s early/mid 1990s late 1990sEngineers (RSE) per 10,000Japan 87 (1988) 82 (1993) 96 (1998)USA 77 (1988) 74 (1993) 74 (1998)Germany 56 (1987) 58 (1995) 60 (1998)Switzerland 44 (1986) 70 (1992) 55 (1996)Taiwan 43 (1988) 61 (1994) 66 (1998)Korea 33 (1988) 57 (1994) 48 (1997)Singapore 28 (1990) 42 (1994) 70 (1999)
Sources: NSTB, 1991 and 1996

23
Table Seven
Indicators of innovative activity in Singapore
R&D ratio of Research RSE/10000 Patent Patentexpenditures R&D scientists applications grants
S$ mill expenditures andto GDP engineers
1990 571.7 0.86 4329 27.71991 756.7 1.02 5218 33.61992 949.3 1.19 6454 39.81993 998.2 1.07 6629 40.51994 1175.0 1.10 7086 41.9 263 581995 1366.6 1.16 8340 47.7 242 511996 1792.1 1.39 10153 56.3 316 911997 2104.6 1.50 11302 60.2 490 1321998 2492.3 1.80 12655 65.5 579 1361999 2656.3 1.84 13817 69.9 673 161